metropolitan dynamics typology of the portuguese … · metropolitan dynamics typology of the...
TRANSCRIPT
68 The Open Urban Studies Journal, 2010, 3, 68-77
1874-9429/10 2010 Bentham Open
Open Access
Metropolitan Dynamics Typology of the Portuguese Urban System
Patrícia Abrantes*, Dulce Pimentel and José António Tenedório
e-GEO, Center of Geographical and Regional Planning Studies, New University of Lisbon, Lisbon, Portugal
Abstract: The metropolitan dynamics typology of the Portuguese urban system is the product of a methodology based on Geographic Information Systems (GIS). A GIS data describes six dimensions of metropolisation (population, economy, urban organisation, society and culture, networks and territorial organisation), based on a matrix of entities or indicators. Such a matrix has been subjected to treatment by neuronal networks through a Self-Organising Map (SOM). The method is robust in order to obtain a typology designated as DYMET (Metropolitan Dynamics Typology). As a result of the application of SOM’s classification algorithm ten types of areas were identified (metropolis core of Lisbon and of Porto, suburbanised area, suburbanised area in consolidation, potential metropolis centre, metropolisation area, area of urban dynamics, area of local centrality, peri-urbanised area, area with weak urban dynamics, area without urban dynamics) and compared to the typologies based on empirical studies of the Portuguese urban network developed mainly in the nineties. The identified types are described and characterised with some global dimension indicators.
Keywords: DYMET, GIS, metropolis, pattern, process, SOM, spatial analysis.
INTRODUCTION
Seen as the spatial equivalent of world economy globalisation [1], metropolisation is a complex process of scale interaction and rhythms of development. There is still no consensus to its conceptual definition. In general, most authors relate it to economic aspects considering it as the spatial result of the globalisation of the world economy, as the dynamic processes that transform a city into a metropolis, or as the movement of concentration of economic power in a limited number of world cities. Recent research considers that the process is intrinsically related with other important dimensions as good government and sustainable development [2].
A metropolis is characterised by the development of functional specialisations (specialised tertiary functions) and by an inner-spatial re-organisation. The process of metropolisation does not affect every city, but mainly upper hierarchy cities with a critical population density. These cities benefit from a major centrality and they are capable of attracting and distributing important flows of innovation and information through their networks, with special emphasis on the type of relations they maintain at an international level.
In Portugal, despite there being few studies on the subject, some authors consider that the metropolisation process has accured in the last decades, though it is incomplete and poorly structured [3, 4], both due to the low internationalisation of any Portuguese metropolis and the induced territorial asymmetries. The early nineties are rich in analyses of the spatial organisation of the European territory;
*Address correspondence to this author at the e-GEO, Center of Geographical and Regional Planning Studies, New University of Lisbon, Av. de Berna, 26-C, 1069-061 Lisboa, Portugal Tel: +351.21.7908300; Fax: +351.21.7908308; E-mail: patrí[email protected]
the more emblematic ones are the Blue Banana [5] and the European Bunch of Grapes [6]. These studies show a dominating axe of spatial development going from London to Milan with extensive and poorly integrated peripheral areas.
In this new geography of Europe, Portuguese cities are badly classified. They are considered as systems with poor internationalisation capacity due to their peripheral nature. The study developed by the P.A.R.I.S. team [7] classifies only two Portuguese cities – Lisbon and Porto – in the system of European cities, namely as peripheral regional metropolis with limited international influence. Lisbon is classified as a second rank capital in Vandermotten et al study [8], implying that its central functions are mainly executed at national level, although with some cultural and business tourism potential. Porto is classified as a city with a low internationalisation capacity. Taylor and Hoyler [9] classify Lisbon as a world city under formation in a study on the position of World European cities based on advanced services indicators. Lisbon is the only Portuguese city included in the study.
In 2003, the DATAR study [10], which is basically an update of the work by Brunet (1989), classified Lisbon as a level 3 city and Porto as a level 5 cities. On the European hierarchy, level 3 indicates cities that benefit from their role as national capitals, acting as anchors for international functions. Lisbon is in the same category as cities such as Barcelona, Rome, Berlin, and Brussels. The level 5 indicates cities poorly diversified without international influence.
The studies on the position of European cities in the nineties launched an important reflection on the social and spatial cohesion of the European Union and on the role of territorial planning, thus, helping to formalise the construction of a European transnational planning project through ESDP (European Spatial Development Perspective) in 1999. This programme allowed several analytical and
Metropolitan Dynamics Typology of the Portuguese Urban System The Open Urban Studies Journal, 2010, Volume 3 69
prospective European studies searching for a polycentric spatial model, namely ESPON (European Spatial Planning Observation Network) and ASDP (Atlantic Spatial Development Perspective).
ESPON was created within ESDP to support the realisation of studies on a territorial basis and the formulation of strategies and policies more adequate to the European spatial development, such as, “the role, specific situation and potentials of urban areas as nodes in a polycentric development” (project 1.1.1.). The typology
developed on ESPON 1.1.1 [11] proposes for Portugal two European Metropolitan Areas (MEGA) of category 3 and 4, Lisbon and Porto, respectively, characterised by low levels of competitive capabilities and connectivity, and four national/transnational Functional Urban Areas (FUA) – Faro, Coimbra, Aveiro, and Braga.
ASDP appears also within the scope of ESDP but focuses on the Atlantic space. It defines four typologies of territorial and urban-Atlantic systems, namely metropolitan areas, intermediate cities, small towns, and rural spaces. Attention
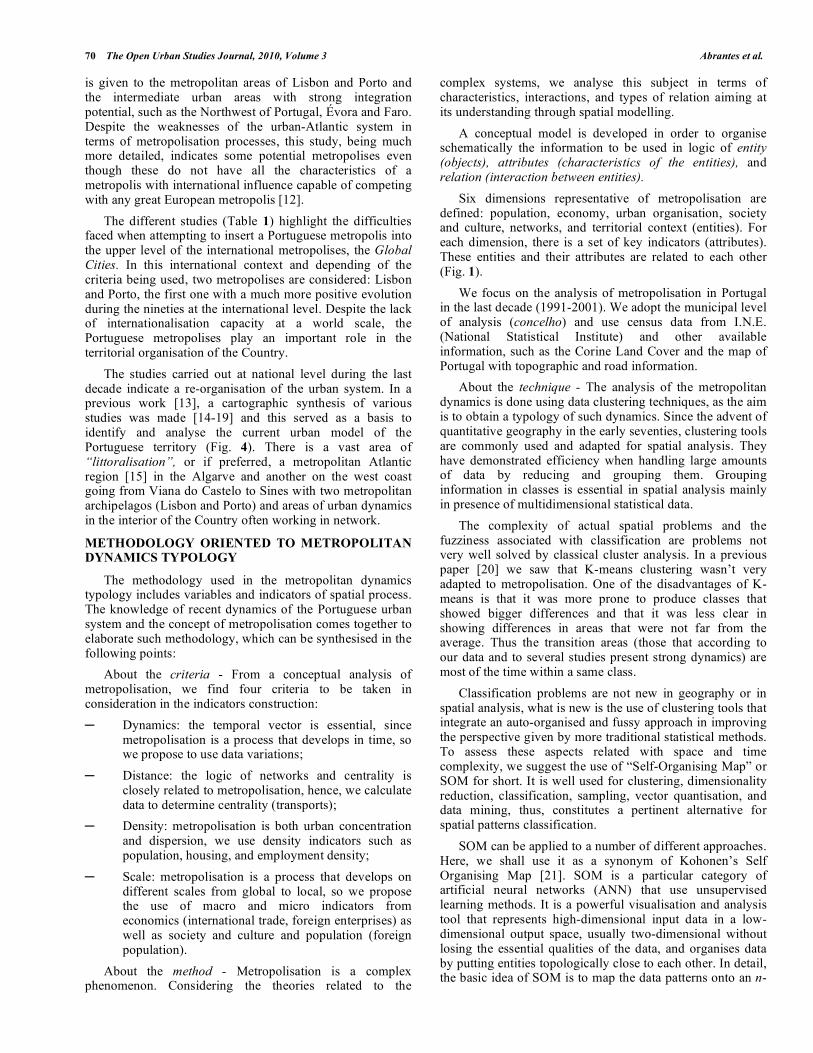
Table 1. Synthesis of Studies on the Position of Portuguese Cities within the European Metropolitan Context
Study Aims Criteria Classification Portuguese Cities
Classification
ESPON 1.1.1., 2005
Provide the background for an informed discussion of polycentric development in Europe trough, an overview of the European urban system with regards to functional specialisations and current degrees of poly-centricity.
- Identification of FUA (Functional urban areas) through population criteria
- Multi-criteria analysis based on indicators from Population, Transport, Manufacturing, Knowledge and Decision Making.
- Metropolitan European Growth Areas (MEGA) correspond to FUA with the highest average score in the defined criteria (76 MEGA have been identified in Europe)
- Transnational/national FUA,
- Regional/local FUA
- MEGA of Lisbon
- MEGA of Porto
- Transnational/national FUA of Faro, Coimbra, Aveiro and Braga
ASDP, 2005
Territorial view of the place and role of the Atlantic space the European organisation
Identification of urban areas with the potential to become the principal nodes in a polycentic atlantic area
Multi-criteria analysis based on indicators from:
Mass
Connectivity
Competitiveness
Dynamic
- Metropolitan region,
- Intermediate urban area
- Medium-sized town
- Rural area
- Lisbon Metropolitan region
- Porto Metropolitan region
- Intermediate urban areas: Viana do Castelo-Ponte de Lima, Braga-Cávado, Ave, Entre Douro e Vouga, Aveiro-Baixo Vouga, Coimbra-Baixo Mondego, Viseu, Vila Real-Régua-Lamego, Leiria-Marinha Grande, Santarém-Lezíria do Tejo, Évora, Faro
DATAR, Les villes européennes – analyse
comparative, 2003
Defines the hierarchy and describes the major European cities system from relevant quantitative indicators of metropolitan functions.
Identification of all cities with more than 200.000 inhabitants
Multi-criteria analysis based on 15 indicators such as population, traffic, connectivity, economics, R&D
Classes 1 to 7 - Lisbon (level 3 city)
- Porto (level 5 city)
VANDERMOTTEN C., et al, Villes
d'Europe - Cartographie
comparative, 1999
Comparison of the European urban spaces based on the analysis of socio-economical comparable indicators
Classification of cities from a grid of criteria for metropolitan success: population, accessibility, tourism, culture, business head quarters, international businessmen
- World cities
- Major conurbations
- Capitals and cities with strong internationalisation levels
- Intermediate cities with an exceptional internationalisation levels
- Second rank capitals
- Regional metropolis and conurbations with a strong international orientation
- Third rank capitals
- Other cities and conurbations
- Lisbon (second rank capital)
- Porto (other city or conurbation)
P.J. TAYLOR, M. HOYLER, The
Spatial Order of European Cities
under Conditions of Contemporary
Globalisation, 2000
Analysis of the external relations of European cities under conditions of contemporary globalisation
Typology of 53 European cities through a principal components analysis of the locations of 46 global firms providing advanced producer services (accountancy, advertising, banking/finance and law)
- Alpha world cities
- Beta world cities
- Gamma world cities
- World cities in formation
Lisbon (world city in formation)
70 The Open Urban Studies Journal, 2010, Volume 3 Abrantes et al.
is given to the metropolitan areas of Lisbon and Porto and the intermediate urban areas with strong integration potential, such as the Northwest of Portugal, Évora and Faro. Despite the weaknesses of the urban-Atlantic system in terms of metropolisation processes, this study, being much more detailed, indicates some potential metropolises even though these do not have all the characteristics of a metropolis with international influence capable of competing with any great European metropolis [12].
The different studies (Table 1) highlight the difficulties faced when attempting to insert a Portuguese metropolis into the upper level of the international metropolises, the Global Cities. In this international context and depending of the criteria being used, two metropolises are considered: Lisbon and Porto, the first one with a much more positive evolution during the nineties at the international level. Despite the lack of internationalisation capacity at a world scale, the Portuguese metropolises play an important role in the territorial organisation of the Country.
The studies carried out at national level during the last decade indicate a re-organisation of the urban system. In a previous work [13], a cartographic synthesis of various studies was made [14-19] and this served as a basis to identify and analyse the current urban model of the Portuguese territory (Fig. 4). There is a vast area of “littoralisation”, or if preferred, a metropolitan Atlantic region [15] in the Algarve and another on the west coast going from Viana do Castelo to Sines with two metropolitan archipelagos (Lisbon and Porto) and areas of urban dynamics in the interior of the Country often working in network.
METHODOLOGY ORIENTED TO METROPOLITAN DYNAMICS TYPOLOGY
The methodology used in the metropolitan dynamics typology includes variables and indicators of spatial process. The knowledge of recent dynamics of the Portuguese urban system and the concept of metropolisation comes together to elaborate such methodology, which can be synthesised in the following points:
About the criteria - From a conceptual analysis of metropolisation, we find four criteria to be taken in consideration in the indicators construction:
Dynamics: the temporal vector is essential, since metropolisation is a process that develops in time, so we propose to use data variations;
Distance: the logic of networks and centrality is closely related to metropolisation, hence, we calculate data to determine centrality (transports);
Density: metropolisation is both urban concentration and dispersion, we use density indicators such as population, housing, and employment density;
Scale: metropolisation is a process that develops on different scales from global to local, so we propose the use of macro and micro indicators from economics (international trade, foreign enterprises) as well as society and culture and population (foreign population).
About the method - Metropolisation is a complex phenomenon. Considering the theories related to the
complex systems, we analyse this subject in terms of characteristics, interactions, and types of relation aiming at its understanding through spatial modelling.
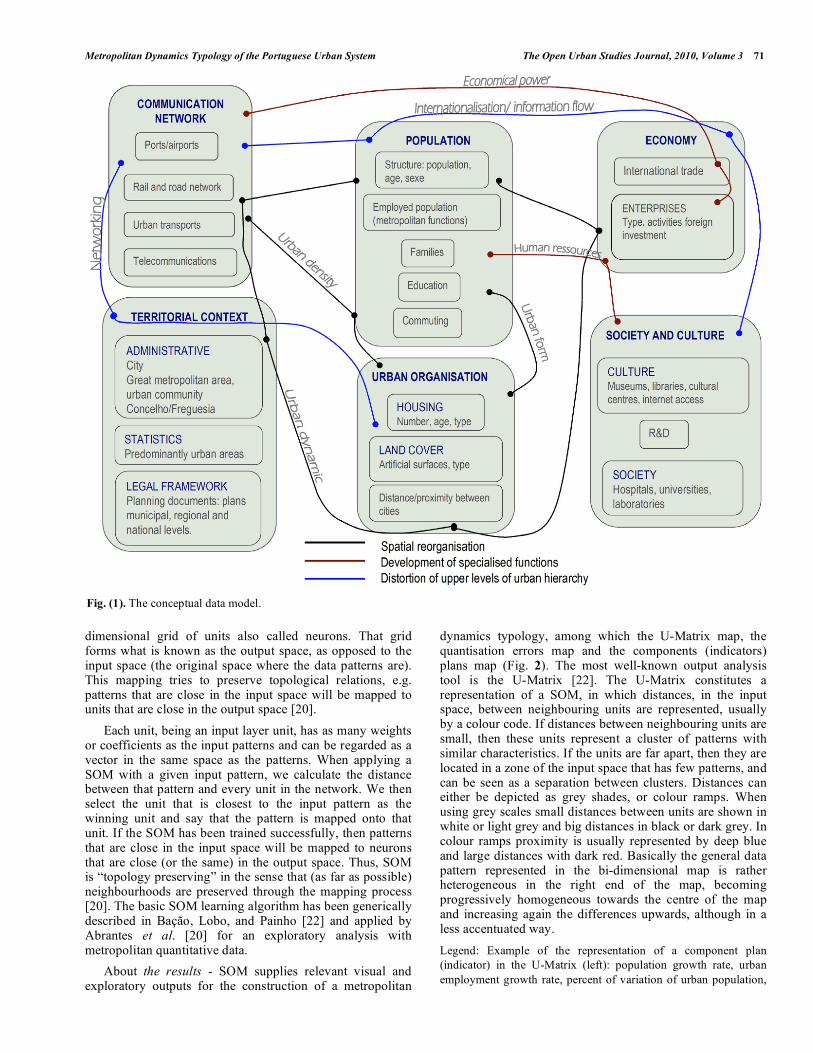
A conceptual model is developed in order to organise schematically the information to be used in logic of entity (objects), attributes (characteristics of the entities), and relation (interaction between entities).
Six dimensions representative of metropolisation are defined: population, economy, urban organisation, society and culture, networks, and territorial context (entities). For each dimension, there is a set of key indicators (attributes). These entities and their attributes are related to each other (Fig. 1).
We focus on the analysis of metropolisation in Portugal in the last decade (1991-2001). We adopt the municipal level of analysis (concelho) and use census data from I.N.E. (National Statistical Institute) and other available information, such as the Corine Land Cover and the map of Portugal with topographic and road information.
About the technique - The analysis of the metropolitan dynamics is done using data clustering techniques, as the aim is to obtain a typology of such dynamics. Since the advent of quantitative geography in the early seventies, clustering tools are commonly used and adapted for spatial analysis. They have demonstrated efficiency when handling large amounts of data by reducing and grouping them. Grouping information in classes is essential in spatial analysis mainly in presence of multidimensional statistical data.
The complexity of actual spatial problems and the fuzziness associated with classification are problems not very well solved by classical cluster analysis. In a previous paper [20] we saw that K-means clustering wasn’t very adapted to metropolisation. One of the disadvantages of K-means is that it was more prone to produce classes that showed bigger differences and that it was less clear in showing differences in areas that were not far from the average. Thus the transition areas (those that according to our data and to several studies present strong dynamics) are most of the time within a same class.
Classification problems are not new in geography or in spatial analysis, what is new is the use of clustering tools that integrate an auto-organised and fussy approach in improving the perspective given by more traditional statistical methods. To assess these aspects related with space and time complexity, we suggest the use of “Self-Organising Map” or SOM for short. It is well used for clustering, dimensionality reduction, classification, sampling, vector quantisation, and data mining, thus, constitutes a pertinent alternative for spatial patterns classification.
SOM can be applied to a number of different approaches. Here, we shall use it as a synonym of Kohonen’s Self Organising Map [21]. SOM is a particular category of artificial neural networks (ANN) that use unsupervised learning methods. It is a powerful visualisation and analysis tool that represents high-dimensional input data in a low-dimensional output space, usually two-dimensional without losing the essential qualities of the data, and organises data by putting entities topologically close to each other. In detail, the basic idea of SOM is to map the data patterns onto an n-
Metropolitan Dynamics Typology of the Portuguese Urban System The Open Urban Studies Journal, 2010, Volume 3 71
dimensional grid of units also called neurons. That grid forms what is known as the output space, as opposed to the input space (the original space where the data patterns are). This mapping tries to preserve topological relations, e.g. patterns that are close in the input space will be mapped to units that are close in the output space [20].
Each unit, being an input layer unit, has as many weights or coefficients as the input patterns and can be regarded as a vector in the same space as the patterns. When applying a SOM with a given input pattern, we calculate the distance between that pattern and every unit in the network. We then select the unit that is closest to the input pattern as the winning unit and say that the pattern is mapped onto that unit. If the SOM has been trained successfully, then patterns that are close in the input space will be mapped to neurons that are close (or the same) in the output space. Thus, SOM is “topology preserving” in the sense that (as far as possible) neighbourhoods are preserved through the mapping process [20]. The basic SOM learning algorithm has been generically described in Bação, Lobo, and Painho [22] and applied by Abrantes et al. [20] for an exploratory analysis with metropolitan quantitative data.
About the results - SOM supplies relevant visual and exploratory outputs for the construction of a metropolitan
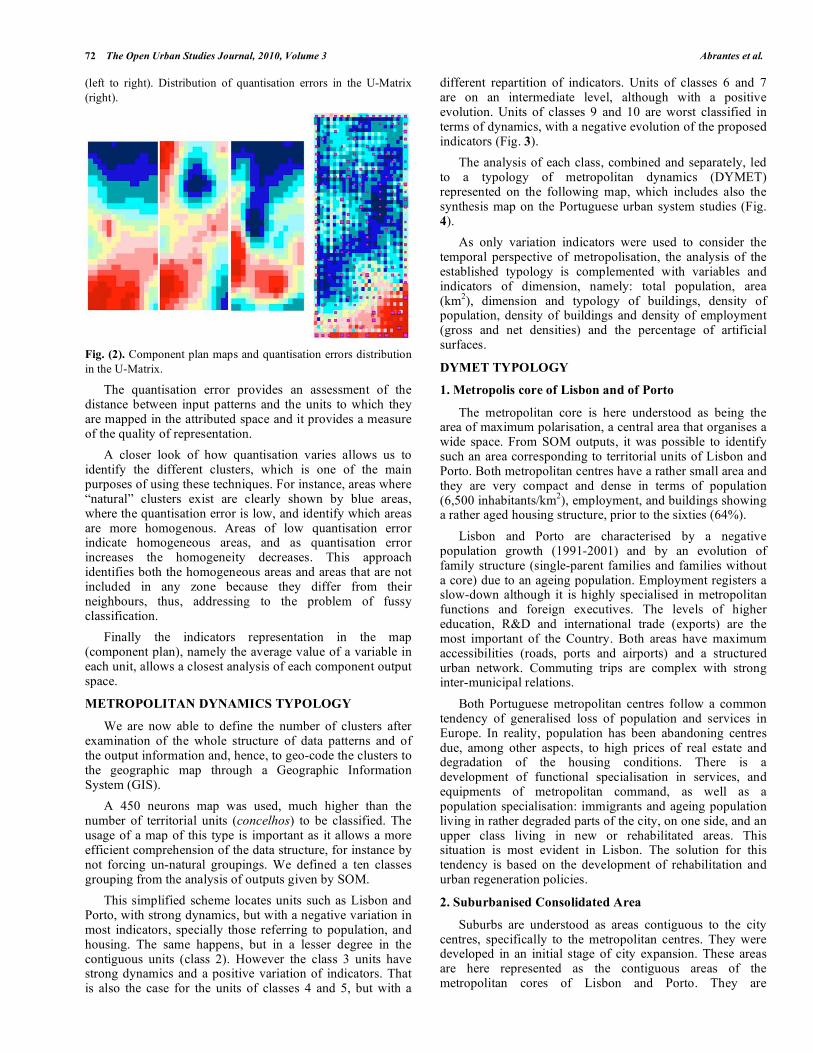
dynamics typology, among which the U-Matrix map, the quantisation errors map and the components (indicators) plans map (Fig. 2). The most well-known output analysis tool is the U-Matrix [22]. The U-Matrix constitutes a representation of a SOM, in which distances, in the input space, between neighbouring units are represented, usually by a colour code. If distances between neighbouring units are small, then these units represent a cluster of patterns with similar characteristics. If the units are far apart, then they are located in a zone of the input space that has few patterns, and can be seen as a separation between clusters. Distances can either be depicted as grey shades, or colour ramps. When using grey scales small distances between units are shown in white or light grey and big distances in black or dark grey. In colour ramps proximity is usually represented by deep blue and large distances with dark red. Basically the general data pattern represented in the bi-dimensional map is rather heterogeneous in the right end of the map, becoming progressively homogeneous towards the centre of the map and increasing again the differences upwards, although in a less accentuated way.
Legend: Example of the representation of a component plan (indicator) in the U-Matrix (left): population growth rate, urban employment growth rate, percent of variation of urban population,
Fig. (1). The conceptual data model.
72 The Open Urban Studies Journal, 2010, Volume 3 Abrantes et al.
(left to right). Distribution of quantisation errors in the U-Matrix (right).
Fig. (2). Component plan maps and quantisation errors distribution in the U-Matrix.
The quantisation error provides an assessment of the distance between input patterns and the units to which they are mapped in the attributed space and it provides a measure of the quality of representation.
A closer look of how quantisation varies allows us to identify the different clusters, which is one of the main purposes of using these techniques. For instance, areas where “natural” clusters exist are clearly shown by blue areas, where the quantisation error is low, and identify which areas are more homogenous. Areas of low quantisation error indicate homogeneous areas, and as quantisation error increases the homogeneity decreases. This approach identifies both the homogeneous areas and areas that are not included in any zone because they differ from their neighbours, thus, addressing to the problem of fussy classification.
Finally the indicators representation in the map (component plan), namely the average value of a variable in each unit, allows a closest analysis of each component output space.
METROPOLITAN DYNAMICS TYPOLOGY
We are now able to define the number of clusters after examination of the whole structure of data patterns and of the output information and, hence, to geo-code the clusters to the geographic map through a Geographic Information System (GIS).
A 450 neurons map was used, much higher than the number of territorial units (concelhos) to be classified. The usage of a map of this type is important as it allows a more efficient comprehension of the data structure, for instance by not forcing un-natural groupings. We defined a ten classes grouping from the analysis of outputs given by SOM.
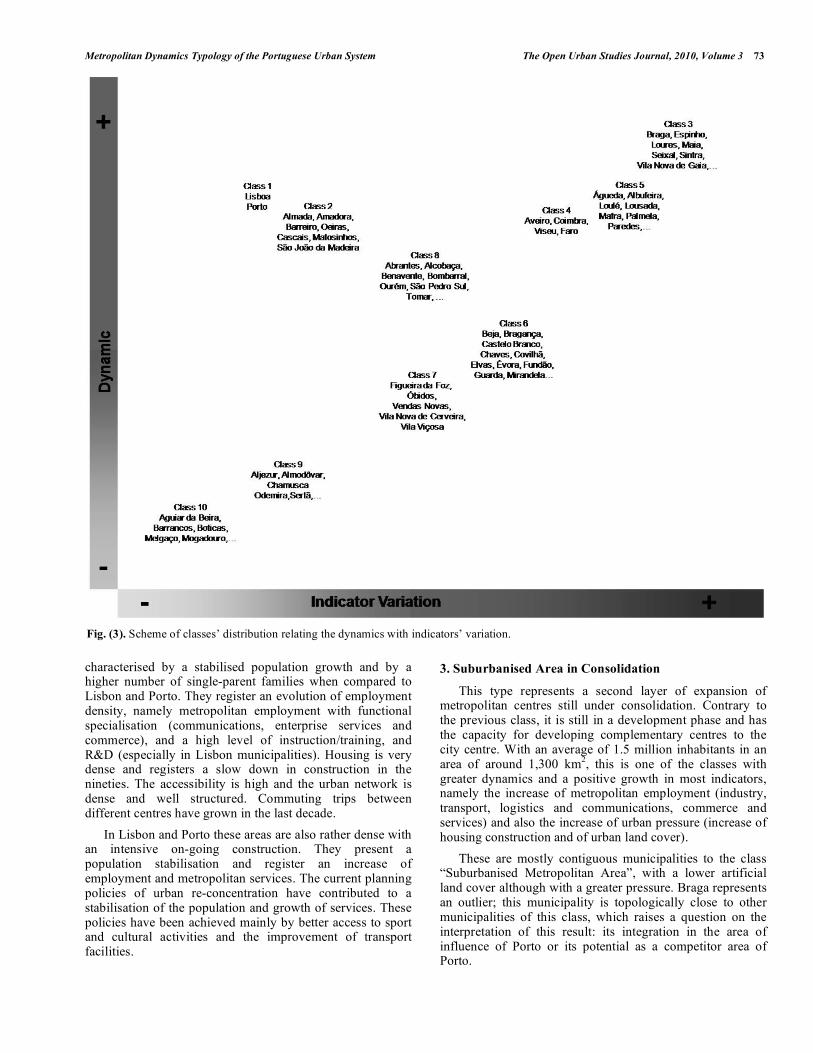
This simplified scheme locates units such as Lisbon and Porto, with strong dynamics, but with a negative variation in most indicators, specially those referring to population, and housing. The same happens, but in a lesser degree in the contiguous units (class 2). However the class 3 units have strong dynamics and a positive variation of indicators. That is also the case for the units of classes 4 and 5, but with a
different repartition of indicators. Units of classes 6 and 7 are on an intermediate level, although with a positive evolution. Units of classes 9 and 10 are worst classified in terms of dynamics, with a negative evolution of the proposed indicators (Fig. 3).
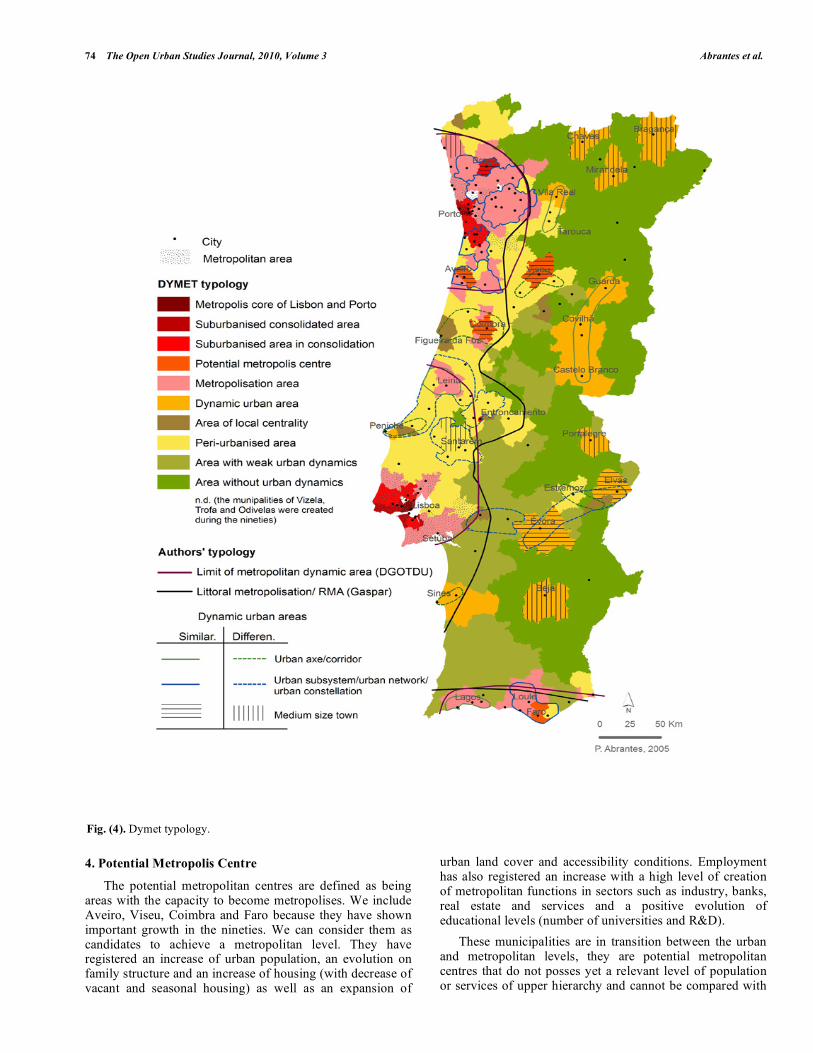
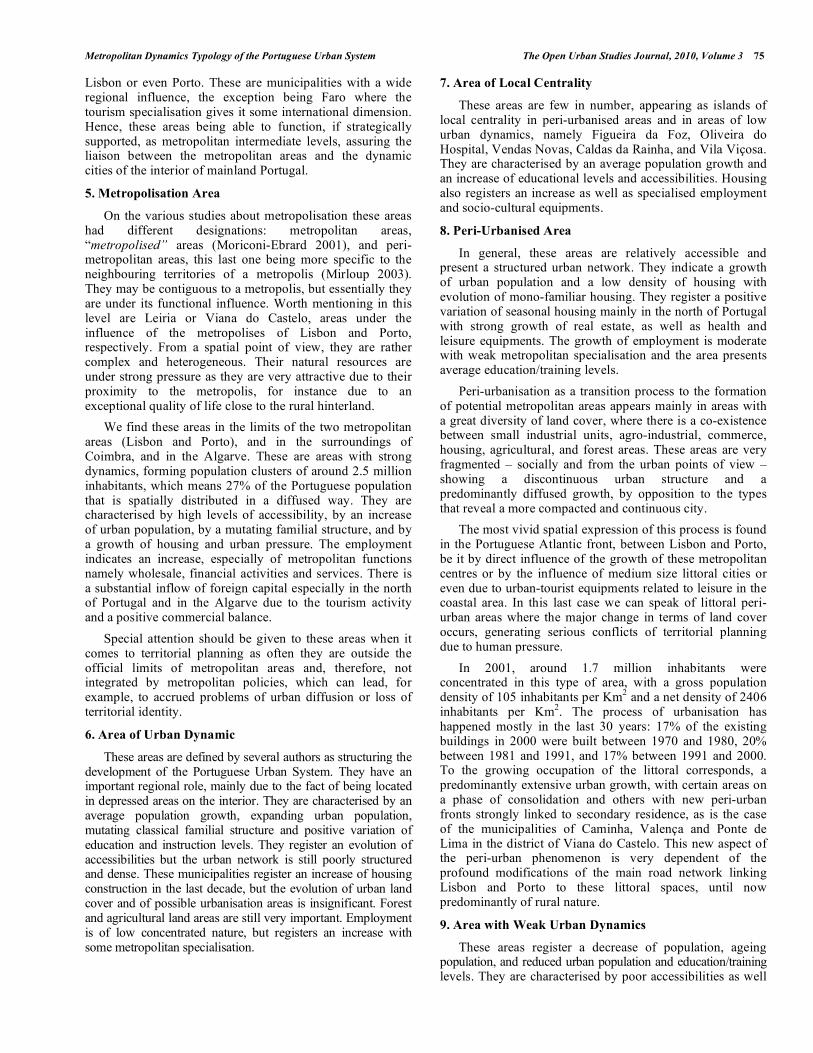
The analysis of each class, combined and separately, led to a typology of metropolitan dynamics (DYMET) represented on the following map, which includes also the synthesis map on the Portuguese urban system studies (Fig. 4).
As only variation indicators were used to consider the temporal perspective of metropolisation, the analysis of the established typology is complemented with variables and indicators of dimension, namely: total population, area (km2), dimension and typology of buildings, density of population, density of buildings and density of employment (gross and net densities) and the percentage of artificial surfaces.
DYMET TYPOLOGY
1. Metropolis core of Lisbon and of Porto
The metropolitan core is here understood as being the area of maximum polarisation, a central area that organises a wide space. From SOM outputs, it was possible to identify such an area corresponding to territorial units of Lisbon and Porto. Both metropolitan centres have a rather small area and they are very compact and dense in terms of population (6,500 inhabitants/km2), employment, and buildings showing a rather aged housing structure, prior to the sixties (64%).
Lisbon and Porto are characterised by a negative population growth (1991-2001) and by an evolution of family structure (single-parent families and families without a core) due to an ageing population. Employment registers a slow-down although it is highly specialised in metropolitan functions and foreign executives. The levels of higher education, R&D and international trade (exports) are the most important of the Country. Both areas have maximum accessibilities (roads, ports and airports) and a structured urban network. Commuting trips are complex with strong inter-municipal relations.
Both Portuguese metropolitan centres follow a common tendency of generalised loss of population and services in Europe. In reality, population has been abandoning centres due, among other aspects, to high prices of real estate and degradation of the housing conditions. There is a development of functional specialisation in services, and equipments of metropolitan command, as well as a population specialisation: immigrants and ageing population living in rather degraded parts of the city, on one side, and an upper class living in new or rehabilitated areas. This situation is most evident in Lisbon. The solution for this tendency is based on the development of rehabilitation and urban regeneration policies.
2. Suburbanised Consolidated Area
Suburbs are understood as areas contiguous to the city centres, specifically to the metropolitan centres. They were developed in an initial stage of city expansion. These areas are here represented as the contiguous areas of the metropolitan cores of Lisbon and Porto. They are
Metropolitan Dynamics Typology of the Portuguese Urban System The Open Urban Studies Journal, 2010, Volume 3 73
characterised by a stabilised population growth and by a higher number of single-parent families when compared to Lisbon and Porto. They register an evolution of employment density, namely metropolitan employment with functional specialisation (communications, enterprise services and commerce), and a high level of instruction/training, and R&D (especially in Lisbon municipalities). Housing is very dense and registers a slow down in construction in the nineties. The accessibility is high and the urban network is dense and well structured. Commuting trips between different centres have grown in the last decade.
In Lisbon and Porto these areas are also rather dense with an intensive on-going construction. They present a population stabilisation and register an increase of employment and metropolitan services. The current planning policies of urban re-concentration have contributed to a stabilisation of the population and growth of services. These policies have been achieved mainly by better access to sport and cultural activities and the improvement of transport facilities.
3. Suburbanised Area in Consolidation
This type represents a second layer of expansion of metropolitan centres still under consolidation. Contrary to the previous class, it is still in a development phase and has the capacity for developing complementary centres to the city centre. With an average of 1.5 million inhabitants in an area of around 1,300 km2, this is one of the classes with greater dynamics and a positive growth in most indicators, namely the increase of metropolitan employment (industry, transport, logistics and communications, commerce and services) and also the increase of urban pressure (increase of housing construction and of urban land cover).
These are mostly contiguous municipalities to the class “Suburbanised Metropolitan Area”, with a lower artificial land cover although with a greater pressure. Braga represents an outlier; this municipality is topologically close to other municipalities of this class, which raises a question on the interpretation of this result: its integration in the area of influence of Porto or its potential as a competitor area of Porto.
Fig. (3). Scheme of classes’ distribution relating the dynamics with indicators’ variation.
74 The Open Urban Studies Journal, 2010, Volume 3 Abrantes et al.
4. Potential Metropolis Centre
The potential metropolitan centres are defined as being areas with the capacity to become metropolises. We include Aveiro, Viseu, Coimbra and Faro because they have shown important growth in the nineties. We can consider them as candidates to achieve a metropolitan level. They have registered an increase of urban population, an evolution on family structure and an increase of housing (with decrease of vacant and seasonal housing) as well as an expansion of
urban land cover and accessibility conditions. Employment has also registered an increase with a high level of creation of metropolitan functions in sectors such as industry, banks, real estate and services and a positive evolution of educational levels (number of universities and R&D).
These municipalities are in transition between the urban and metropolitan levels, they are potential metropolitan centres that do not posses yet a relevant level of population or services of upper hierarchy and cannot be compared with
Fig. (4). Dymet typology.
Metropolitan Dynamics Typology of the Portuguese Urban System The Open Urban Studies Journal, 2010, Volume 3 75
Lisbon or even Porto. These are municipalities with a wide regional influence, the exception being Faro where the tourism specialisation gives it some international dimension. Hence, these areas being able to function, if strategically supported, as metropolitan intermediate levels, assuring the liaison between the metropolitan areas and the dynamic cities of the interior of mainland Portugal.
5. Metropolisation Area
On the various studies about metropolisation these areas had different designations: metropolitan areas, “metropolised” areas (Moriconi-Ebrard 2001), and peri-metropolitan areas, this last one being more specific to the neighbouring territories of a metropolis (Mirloup 2003). They may be contiguous to a metropolis, but essentially they are under its functional influence. Worth mentioning in this level are Leiria or Viana do Castelo, areas under the influence of the metropolises of Lisbon and Porto, respectively. From a spatial point of view, they are rather complex and heterogeneous. Their natural resources are under strong pressure as they are very attractive due to their proximity to the metropolis, for instance due to an exceptional quality of life close to the rural hinterland.
We find these areas in the limits of the two metropolitan areas (Lisbon and Porto), and in the surroundings of Coimbra, and in the Algarve. These are areas with strong dynamics, forming population clusters of around 2.5 million inhabitants, which means 27% of the Portuguese population that is spatially distributed in a diffused way. They are characterised by high levels of accessibility, by an increase of urban population, by a mutating familial structure, and by a growth of housing and urban pressure. The employment indicates an increase, especially of metropolitan functions namely wholesale, financial activities and services. There is a substantial inflow of foreign capital especially in the north of Portugal and in the Algarve due to the tourism activity and a positive commercial balance.
Special attention should be given to these areas when it comes to territorial planning as often they are outside the official limits of metropolitan areas and, therefore, not integrated by metropolitan policies, which can lead, for example, to accrued problems of urban diffusion or loss of territorial identity.
6. Area of Urban Dynamic
These areas are defined by several authors as structuring the development of the Portuguese Urban System. They have an important regional role, mainly due to the fact of being located in depressed areas on the interior. They are characterised by an average population growth, expanding urban population, mutating classical familial structure and positive variation of education and instruction levels. They register an evolution of accessibilities but the urban network is still poorly structured and dense. These municipalities register an increase of housing construction in the last decade, but the evolution of urban land cover and of possible urbanisation areas is insignificant. Forest and agricultural land areas are still very important. Employment is of low concentrated nature, but registers an increase with some metropolitan specialisation.
7. Area of Local Centrality
These areas are few in number, appearing as islands of local centrality in peri-urbanised areas and in areas of low urban dynamics, namely Figueira da Foz, Oliveira do Hospital, Vendas Novas, Caldas da Rainha, and Vila Viçosa. They are characterised by an average population growth and an increase of educational levels and accessibilities. Housing also registers an increase as well as specialised employment and socio-cultural equipments.
8. Peri-Urbanised Area
In general, these areas are relatively accessible and present a structured urban network. They indicate a growth of urban population and a low density of housing with evolution of mono-familiar housing. They register a positive variation of seasonal housing mainly in the north of Portugal with strong growth of real estate, as well as health and leisure equipments. The growth of employment is moderate with weak metropolitan specialisation and the area presents average education/training levels.
Peri-urbanisation as a transition process to the formation of potential metropolitan areas appears mainly in areas with a great diversity of land cover, where there is a co-existence between small industrial units, agro-industrial, commerce, housing, agricultural, and forest areas. These areas are very fragmented – socially and from the urban points of view – showing a discontinuous urban structure and a predominantly diffused growth, by opposition to the types that reveal a more compacted and continuous city.
The most vivid spatial expression of this process is found in the Portuguese Atlantic front, between Lisbon and Porto, be it by direct influence of the growth of these metropolitan centres or by the influence of medium size littoral cities or even due to urban-tourist equipments related to leisure in the coastal area. In this last case we can speak of littoral peri-urban areas where the major change in terms of land cover occurs, generating serious conflicts of territorial planning due to human pressure.
In 2001, around 1.7 million inhabitants were concentrated in this type of area, with a gross population density of 105 inhabitants per Km2 and a net density of 2406 inhabitants per Km2. The process of urbanisation has happened mostly in the last 30 years: 17% of the existing buildings in 2000 were built between 1970 and 1980, 20% between 1981 and 1991, and 17% between 1991 and 2000. To the growing occupation of the littoral corresponds, a predominantly extensive urban growth, with certain areas on a phase of consolidation and others with new peri-urban fronts strongly linked to secondary residence, as is the case of the municipalities of Caminha, Valença and Ponte de Lima in the district of Viana do Castelo. This new aspect of the peri-urban phenomenon is very dependent of the profound modifications of the main road network linking Lisbon and Porto to these littoral spaces, until now predominantly of rural nature.
9. Area with Weak Urban Dynamics
These areas register a decrease of population, ageing population, and reduced urban population and education/training levels. They are characterised by poor accessibilities as well
76 The Open Urban Studies Journal, 2010, Volume 3 Abrantes et al.
as by poorly structured urban network, although they register recently a positive evolution of accessibilities, resulting from the opening of new roads. They indicate a low density of housing but a positive variation of seasonal housing and a positive evolution of the construction of mono-familiar housing and health and leisure equipments. They also indicate an evolution of metropolitan employment especially in services, in culture, and in the tourism sector with some evolution in foreign capital.
These areas are mainly located in the southwest littoral and in a central corridor of transition between the littoral and the interior, reinforcing a permanent structure of the country. They occupy around 18% of the total area of mainland Portugal but their population is less than 4%. They correspond to areas of low density, with ageing and rural population in demographic loss.
The urban dynamics are reduced and the centres are small in dimension (around 10,000 inhabitants). The building structure has a marginal expression and the construction dynamics are also diminished (63% built before 1980). These are areas with scarce employment expression and very poor dynamics.
10. Area without Urban Dynamic
These areas are very similar to class 8, however, they registered a weak growth of housing during the nineties and a high degree of retraction of employed population with low density of employment without metropolitan specialisation. There is some creation of companies, especially in the tourism sector. An in the typology above these areas register a positive evolution of health and leisure equipments, but still with low population coverage.
These areas occupy about 37% of mainland Portugal, in a wide corridor of the interior from north (Trás-os-Montes) to south (Algarve). They represent 7% of the total population (700,000 inhabitants), the lowest densities (21.5 inhabitants per km2, in average), ageing population, and the municipalities had the bigger demographic losses during the nineties [23]. The urban areas are very small and are losing or stabilising population. Employment structures are fragile predominantly dependent on public administration. The employment rate is only 35%. Concentration of commerce and services is very weak. Construction dynamics are very weak.
But these areas do not constitute homogeneous spaces as they are intercalated by medium size towns, who’s economical and demographic dynamics have been contributing for the regional structuring and organisation (class 6). These cities also play an important role in the articulation between small urban centres that “populate” this vast territory and the metropolises, both consolidated or in formation.
The DYMET results are broadly in agreement with the empirical studies of the nineties. The major differences are to be found mainly in the area north of Lisbon. Although authors, show a lack of consensus, the proposed typology includes peri-urban areas, this is, areas with strong urban and population dynamics but with weak economical dynamics. The produced map brings a better comprehension of what are
metropolitan dynamics and how they are spatially processed, as it has been conceived to model the metropolisation.
Thus, with regards to the level of the metropolisation processes, the DYMET map provides evidence for a littoral corridor, that is strongly dynamic, heterogeneous, and complex. In this corridor there are two well consolidated metropolitan areas – Lisbon and Porto (centres and surrounding), metropolisation areas that are being concentrically extended from the centre of the metropolises, municipalities with a capacity to develop a metropolitan potential, e.g., areas in transition between urban and metropolitan levels, a wide peri-urbanised area along the littoral with certain penetrations towards the interior, and finally areas developing local centralities.
CONCLUSIONS AND FURTHER DEVELOPMENTS
The developed methodology has proved to be useful for systematic identification and interpretation of metropolitan dynamics, providing access to important knowledge about the recent reorganisation of the urban system and helping understanding the complexity of metropolisation process. However, there are some weaknesses in the methodology. Some questions may arise from the choice of the indicators, as well as the empirical nature of the 10 classes grouping and the proposed typology. The option adopted was to use solely indicators of variation, when indicators of the dimensions of the phenomenon should have perhaps been used too.
SOM minimises the fussy character of the data, it is rather robust with respect to the outliers and to the non-linearity. But, when it is up to the user to choose a few number of classes, situations were found that were contradictory to the above referred SOM potential. Such is the case for Braga that appears as an outlier municipality within the “suburbanised area in consolidation” class. It can be said that it is a problem of fussiness, not of the tool itself but of the user’s subjective choice. This situation is bypassed through an adequate knowledge of the reality or by testing these outliers through a recently developed method that consists to compute fussy membership based on the U-Matrix of data [24].
Essentially, the methodology has allowed a scientific and innovating interpretation of metropolitan dynamics. From the DYMET map, our line of investigation is now focused on the metropolitan organisation of the territory and on its operational capacity in the present urban policies and territorial planning in Portugal.
The territorial model proposed by the National Policy Program for Territorial Planning (PNPOT) [25] at national level shows many similarities with DYMET. It indicates two metropolitan regions, Lisbon and Porto, and an intermediate metropolitan space from five polarisations (Aveiro, Viseu, Coimbra, Leiria and Algarve), for which large scale measures and strategies are proposed. At regional level, the regional plans, for instance, the one related to the Metropolitan Area of Lisbon, propose strategies and policies to fight the urban diffusion and to develop polycentrism, which are operational at a local level (municipal). But, in fact, none of these instruments takes a profound approach on organisation and metropolitan configuration, maintaining a gap between the scientific study of the process and its real and operational dimension.
Metropolitan Dynamics Typology of the Portuguese Urban System The Open Urban Studies Journal, 2010, Volume 3 77
Future developments should be realised through:
• Enrichment of the data base, namely the matrix of flows origin-destination for territorial units of thin analysis, be it for population or goods and services, essentially those related to the knowledge and information society (for instance, informational flows generated from broadband optic fibre networks);
• Making the concept of Territoire pertinent de métropolisation (Metropolisation pertinent territory) operational within territorial planning, e.g. assuming that metropolisation spaces, despite their fluidity, can be territorially delimited in a coherent way, including relations, organisation, structure and dynamics. These must also include:
A robust formalisation of the concept oriented to the application on the planning instruments;
Utilisation of the concept in re-defining the Law 10 and 11 (dated May 2003) that establishes the creation regime, the frame of attributions and competences of the metropolitan areas and the functioning of their administration bodies. In article 3, the Law stipulates the territorial and demographic requirements on which their creation must be based, inspired on a threefold territorial delimitation criteria – continuity, demographic dimension, and administrative dimension. But the Law does not indicate any delimitation criteria based on indicators of transition as it is the case for the metropolisation areas. In fact, the delimitation methods of geographic objects must incorporate the processes. The delimitation of metropolisation areas must arise from a combination of multi-dimensional and multi-temporal data, using, for instance, the classification by neuronal networks (Geo-SOM). It seems evident that a political-administrative delimitation must reflect the territorial continuity, but mainly be homogeneous through the acceptance of the temporality that statistical data generally shows.
REFERENCES
[1] Claval P. Métropolisation et globalisation. Géographie et Cultures 2003; 48: 5-23.
[2] Lacour C, Puissant S. La métropolisation: croissance, diversité, fractures. Paris: Anthropos 1999.
[3] Guichard F. Le Portugal au défis de l’urbain: enjeux et périls de la métropolisation. Méditerranée 2005; 1: 5-10.
[4] Carrière JP, Stuart F. Les cités atlantiques: villes périphériques ou métropoles de demain? Diagnostics et politiques, Paris: Publisud 2000.
[5] Brunet R. Les villes européennes. Paris: DATAR/ La documentation Française 1989.
[6] Kunzmann KR. Planning for Spatial Equity in Europe. Int Plann Stud 1998; 3(1): 101-20.
[7] Cattan N, Pumain D, Rozenblat C, Saint-Julien T. Le système des villes européennes. Paris: Anthropos 1994.
[8] Vandermotten C, Ed. Villes d’Europe: cartographie comparative. Bruxelles: Crédit Communal 1999.
[9] Taylor PJ, Hoyler M. The spatial order of European cities under conditions of contemporary globalisation. GaWC research bullentin
2000. [Retrieved: 10 Dec 2005] Available from: http://www.lboro. ac.uk/gawc/rb/rb16.html
[10] Cicille P, Rozenblat C. Les villes européennes: analyse comparative. Paris: DATAR/ La Documentation Française 2003.
[11] ESPON Ed. 2005. Espon 1.1.1 Potentials for polycentric development in Europe: project report. [Retrieved: 30 March 2007]. Available from: http://www.espon.eu/mmp/online/website/content/ projects/259/648/index_EN.html
[12] Azevedo R, Carrière JP, Eds. Atlantic spatial development perspective. Feira: CRPM 2005.
[13] Abrantes P. La métropolisation au Portugal: processus et politiques spatiales. Ph.D thesis. Université Paris IV and Universidade Nova de Lisboa 2006.
[14] INE. Sistema urbano, áreas de influência e marginalidade funcional. Lisboa: INE 2004.
[15] Gaspar J. Inserção da AML no País, na Península Ibérica e na Europa. In: Tenedório JA, Ed. Atlas da Área Metropolitana de Lisboa. Lisboa: AML 2003; pp. 31-43.
[16] Soares NP. O Sistema Urbano Português: 1890/1991. Ph.D Thesis. FCSH/Universidade Nova de Lisboa 1998.
[17] Ferreira MJ, Rosado AR. As Grandes Áreas Urbanas Portuguesas: conceitos e delimitação espacial in Actas do Seminário Território e Administração. Gestão de Grandes Áreas Metropolitanas. Lisboa, Portugal: New University of Lisbon 2001; pp. 41-57.
[18] DGOTDU Ed. Sistema Urbano Nacional – Cidades Médias e Dinâmicas Territoriais. Lisboa: DGOTDU 1999.
[19] Ferrão J. Dinâmicas territoriais e trajectórias de desenvolvimento: Portugal 1991. Revista de Estudos Demográficos 2001; 34: 17-25.
[20] Abrantes P, Bação F, Lobo V, Tenedório JA. Spatial modelling of metropolisation in Portugal: analysis of spatial metropolitan patterns in Proceedings of the 14th European colloquium on theoretical and quantitative geography. New University of Lisbon and e-GEO, Center of Geographical and Regional Planning Studies. Tomar, Portugal 2005.
[21] Kohonen T. Self-Organizing Maps. Berlin-Heidelberg: Springer 2001.
[22] Bação F, Lobo V, Painho M. Geo-self-organizing map (Geo-SOM) for building and exploring homogeneous regions. Comput Geosci 2004; 3234: 22-37.
[23] Pimentel D, Ed. A População in IGP. Atlas de Portugal. Lisboa: Instituto Geográfico Português 2006; pp. 86-97.
[24] Loureiro M. The Umat of a Self-Organizing Map as a tool to calculate the membership functions in fuzzy clustering. Dissertation. ISEGI/Universidade Nova de Lisboa 2006.
[25] MAOTDR Ed. Programa nacional da política de ordenamento do território, programa de acção. Lisboa: MAOTDR 2006; Vol. 2: p. 91.
Received: April 7, 2009 Revised: May 10, 2009 Accepted: May 15, 2009 © Abrantes et al.; Licensee Bentham Open.
This is an open access article licensed under the terms of the Creative Commons Attribution Non-Commercial License (http://creativecommons.org/licenses/by-nc/3.0/) which permits unrestricted, non-commercial use, distribution and reproduction in any medium, provided the work is properly cited.