census bureau product update - population.az.gov · census bureau product update arizona state data...
TRANSCRIPT
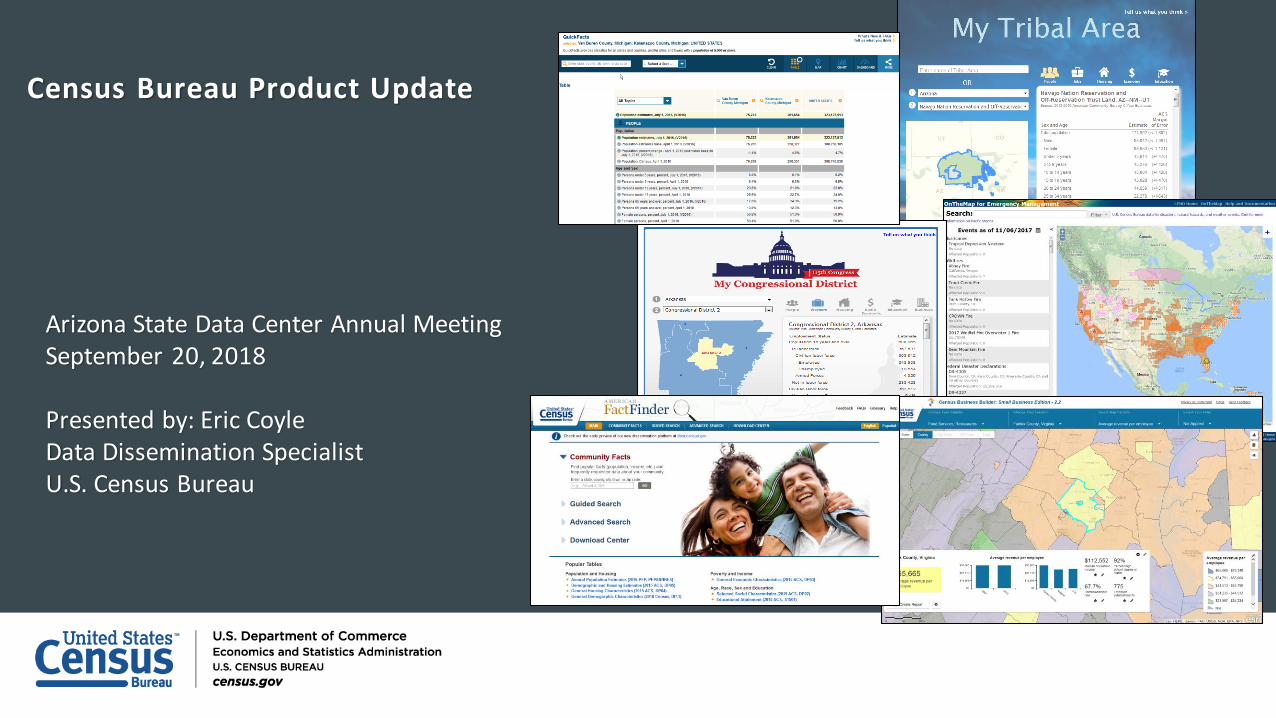
Census Bureau Product Update
Arizona State Data Center Annual MeetingSeptember 20, 2018
Presented by: Eric CoyleData Dissemination SpecialistU.S. Census Bureau
Current Population Survey Annual Social and Economic Supplement• 2017 Income, Poverty, and Health Insurance Reports
American Community Survey• 2017 1-year estimates release updates
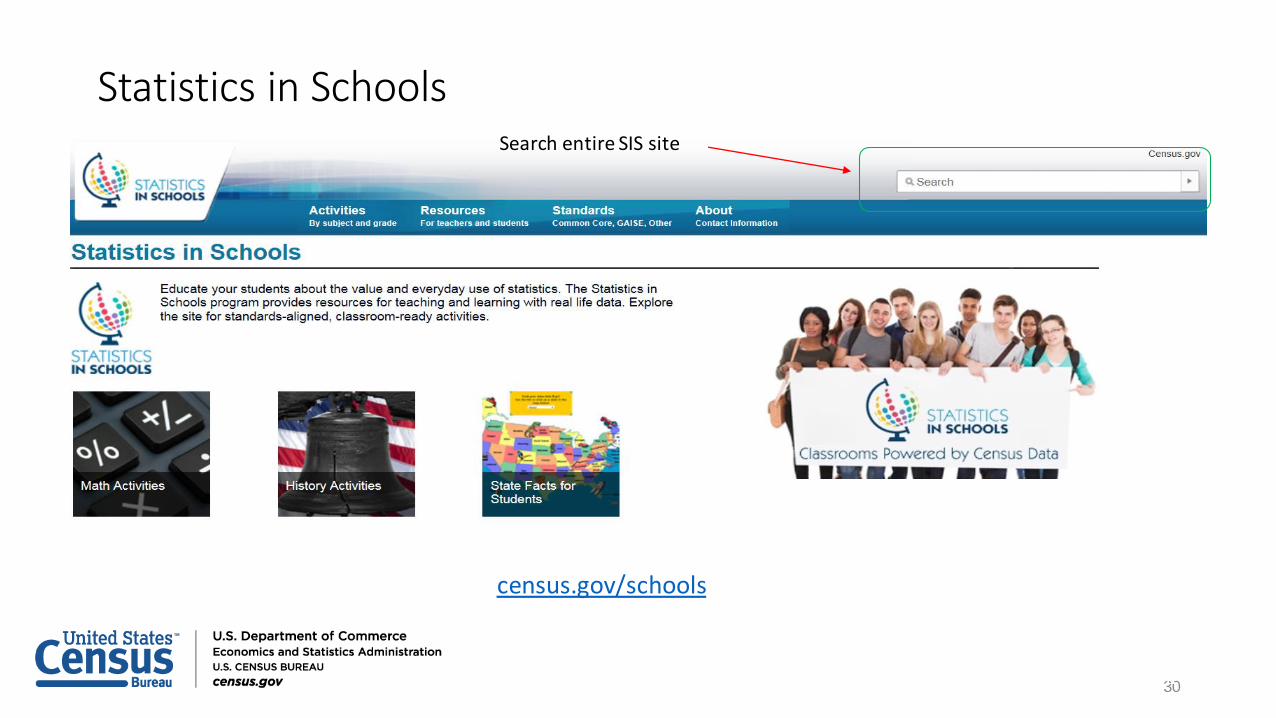
Statistics in Schools• What’s new!
Census Business Builder• 2.4 Update
Census Academy
Q&A
Agenda
2

3
• Data are based on the Current Population Survey’s Annual Social and Economic Supplement (CPSASEC).
• CPS ASEC is the official source of national poverty estimates.
• Official poverty estimates are calculated in accordance with OMB Statistical Policy Directive14.
https://www.census.gov/newsroom/press-releases/2018/income-poverty.html

4
• Includes Current Population Survey (CPS) and American Community Survey (ACS) data.
• ACS is the recommended source for smaller populations and levels of geography.

Real Median Household Income: 1967 to 2017
10
0
20
30
40
50
60
70
80
90
100
1967 1975 1980 1990 2000 2010 2017
Income in thousands (2017 dollars) Recession
$61,400
$46,000
Note: The data for 2013 and beyond reflect the implementation of the redesigned income questions. Income rounded to nearest $100.Source: U.S. Census Bureau, Current Population Survey, 1968 to 2018 Annual Social and Economic Supplements.
5
Median household income was$61,400 in 2017, an increase in real terms of 1.8 percent from the 2016 median of $60,300. This is the third consecutive annual increase in median household income.

0
5
15
10
20
25
50
45
40
35
30
25
201959 1970 1980 1990 2000
Numbers inmillions
Poverty Rate and Number in Poverty: 1959 to2017
Percent Recession
Poverty rate22.4%
12.3%
2010 2017
Note: The data for 2013 and beyond reflect the implementation of the redesigned income questions. Source: U.S. Census Bureau, Current Population Survey, 1960 to 2018 Annual Social and Economic Supplements.
39.5 million Number inPo
verty
39.7million
6
The official poverty rate in 2017 was 12.3 percent, down 0.4 percentage points from 2016. In 2017, there were 39.7 million people in poverty, not statistically different from the number in poverty in 2016.

14.0 13.9
15.2 15.6
13.3 13.2
14.5 14.1
All People Under 18 years
18 to64 years
65 years and older
Source: U.S. Census Bureau, Current Population Survey, 2017 and 2018 Annual Social and Economic Supplements.
Comparison of SPM Poverty Estimates: 2016 and 2017(In Percent)
20172016
7
The Supplemental Poverty Measure (SPM) rate in 2017 was13.9 percent. This is not statistically different from the 2016 SPM rate of 14.0 percent.

8.8
91.2
67.2
56.0
16.0
37.7
17.2
19.3
4.8
0 20 40 60 80 100
Uninsured
With health insurance
Any private plan
Employment-based
Direct-purchase
Any governmentplan
Medicare
Medicaid
Military healthcare*
*Military health care includes TRICARE and CHAMPVA (Civilian Health and Medical Program of the Department of Veterans Affairs) as well as care provided by the Department of Veterans Affairs and the military.Source: U.S. Census Bureau, Current Population Survey, 2018 Annual Social and Economic Supplement.
Percentage of People by Type of Health Insurance Coverage: 2017
8
The percentage of people without health insurance coverage for the entire calendar year was 8.8 percent, or 28.5 million people.The uninsured rate and number of uninsured in 2017 were not statistically different from 2016.
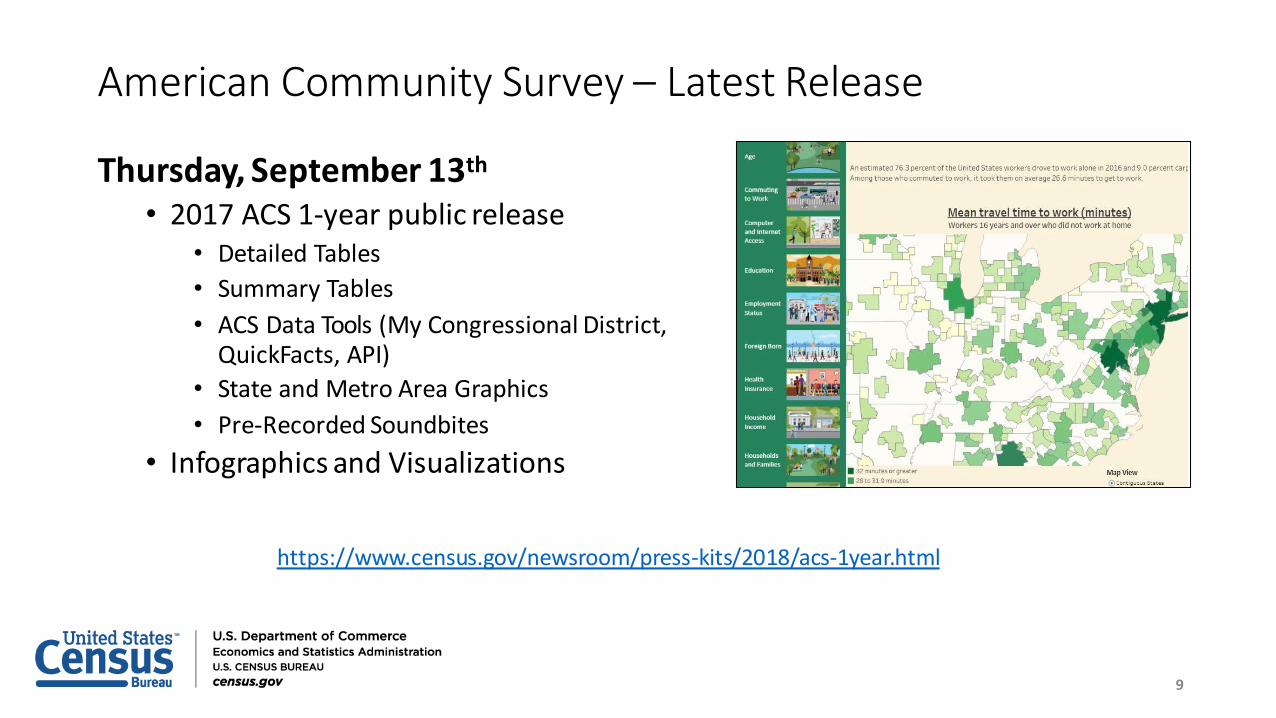
Thursday, September 13th
• 2017 ACS 1-year public release• Detailed Tables
• Summary Tables
• ACS Data Tools (My Congressional District, QuickFacts, API)
• State and Metro Area Graphics
• Pre-Recorded Soundbites
• Infographics and Visualizations
9
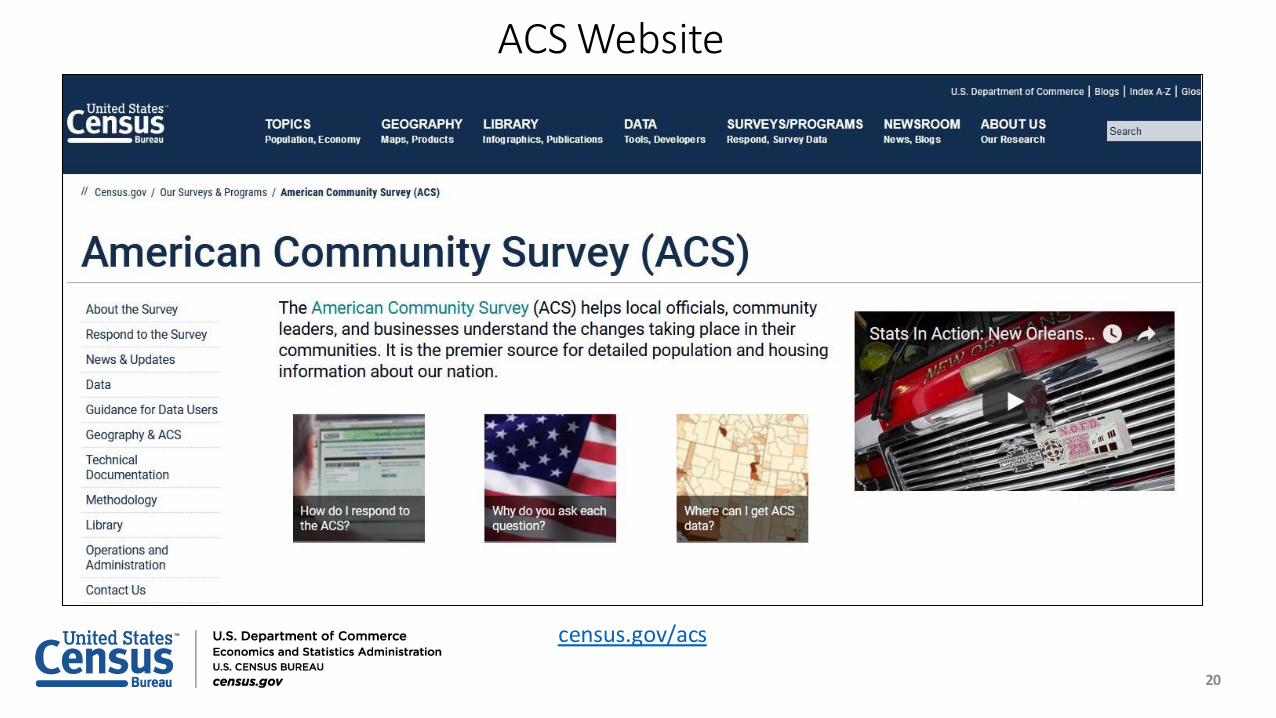
American Community Survey – Latest Release
https://www.census.gov/newsroom/press-kits/2018/acs-1year.html
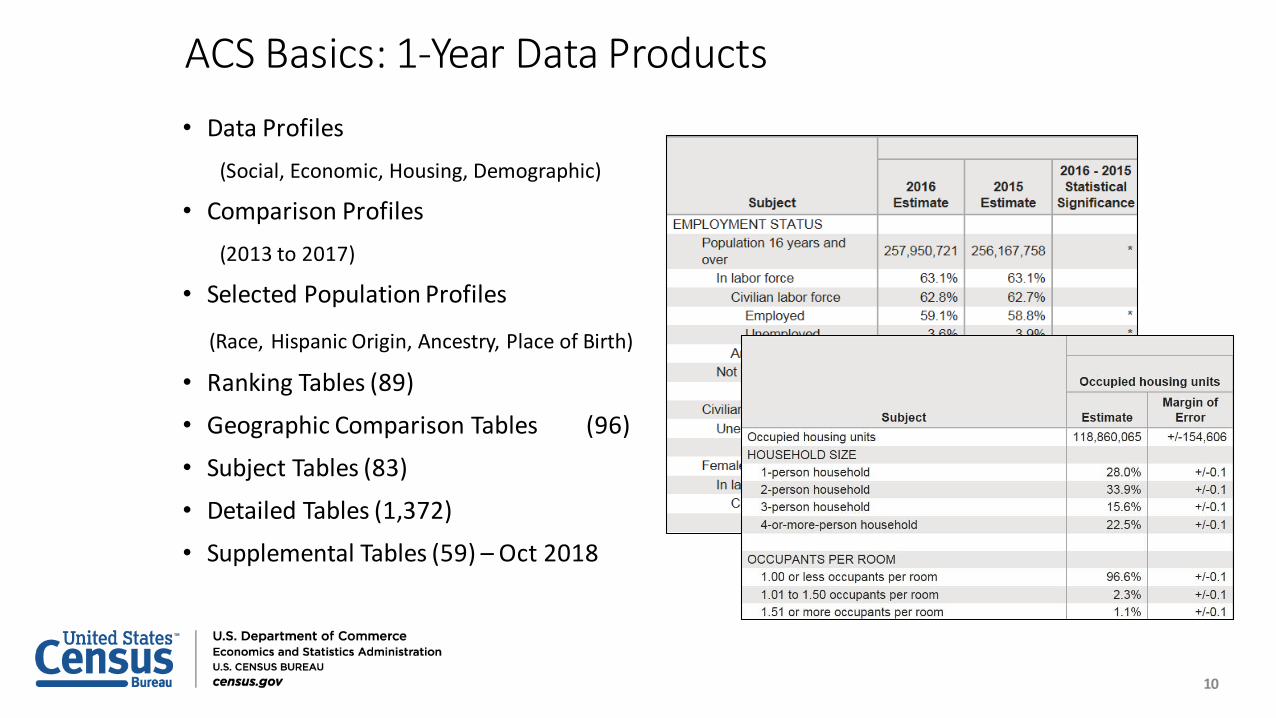
ACS Basics: 1-Year Data Products
• Data Profiles
(Social, Economic, Housing, Demographic)
• Comparison Profiles
(2013 to 2017)
• Selected Population Profiles
(Race, Hispanic Origin, Ancestry, Place of Birth)
• Ranking Tables (89)
• Geographic Comparison Tables (96)
• Subject Tables (83)
• Detailed Tables (1,372)
• Supplemental Tables (59) – Oct 2018
10
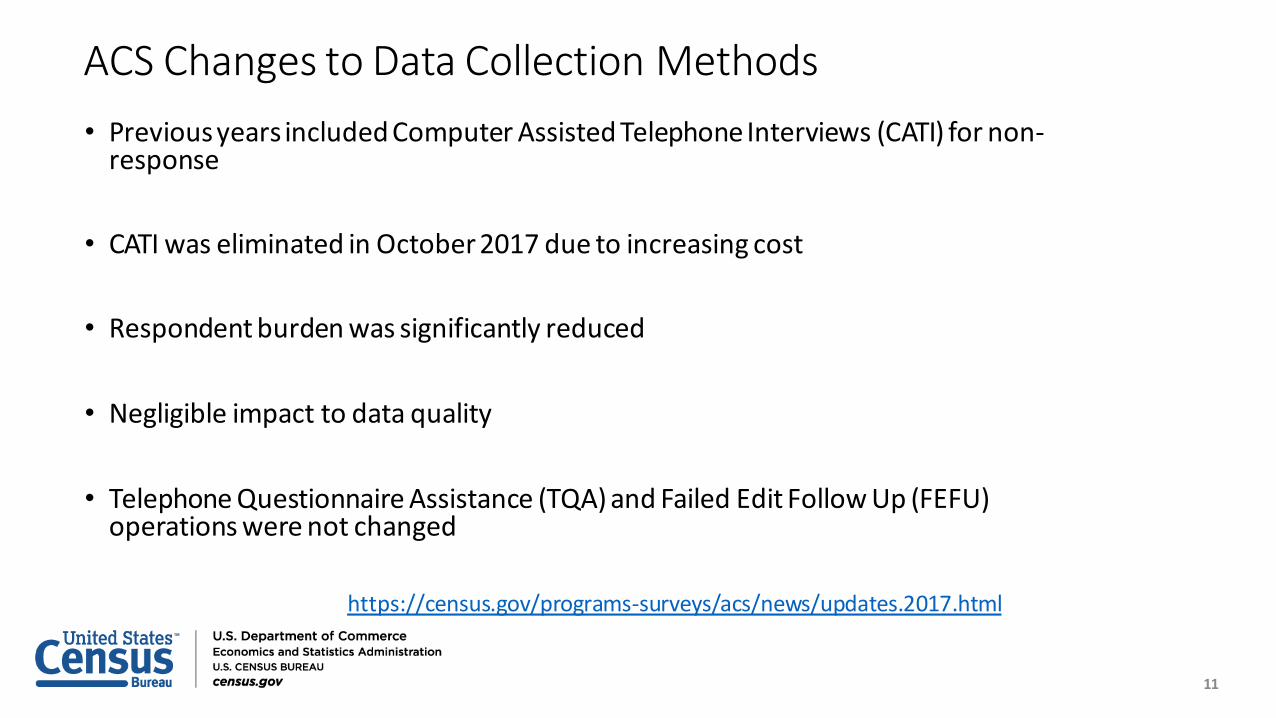
ACS Changes to Data Collection Methods
11
• Previous years included Computer Assisted Telephone Interviews (CATI) for non-response
• CATI was eliminated in October 2017 due to increasing cost
• Respondent burden was significantly reduced
• Negligible impact to data quality
• Telephone Questionnaire Assistance (TQA) and Failed Edit Follow Up (FEFU) operations were not changed
https://census.gov/programs-surveys/acs/news/updates.2017.html

ACS New TablesGroup Quarters
• Two new Subject Tables have replaced S2601B
• S2602: Characteristics of the Group Quarters Population by Group Quarters Type (3 Types)
• S2603: Characteristics of the Group Quarters Population by Group Quarters Type (5 Types)
• 55 new Detailed Tables as source tables for the new Subject Tables
https://www2.census.gov/programs-surveys/acs/tech_docs/table_shells/2017/
12

2016 Table: S2601B Characteristics of the Group
Quarters Population by Group Quarters Type
13

2017 Table: S2603 Characteristics of the Group Quarters Population By Group Quarters Type (5 Types)
14
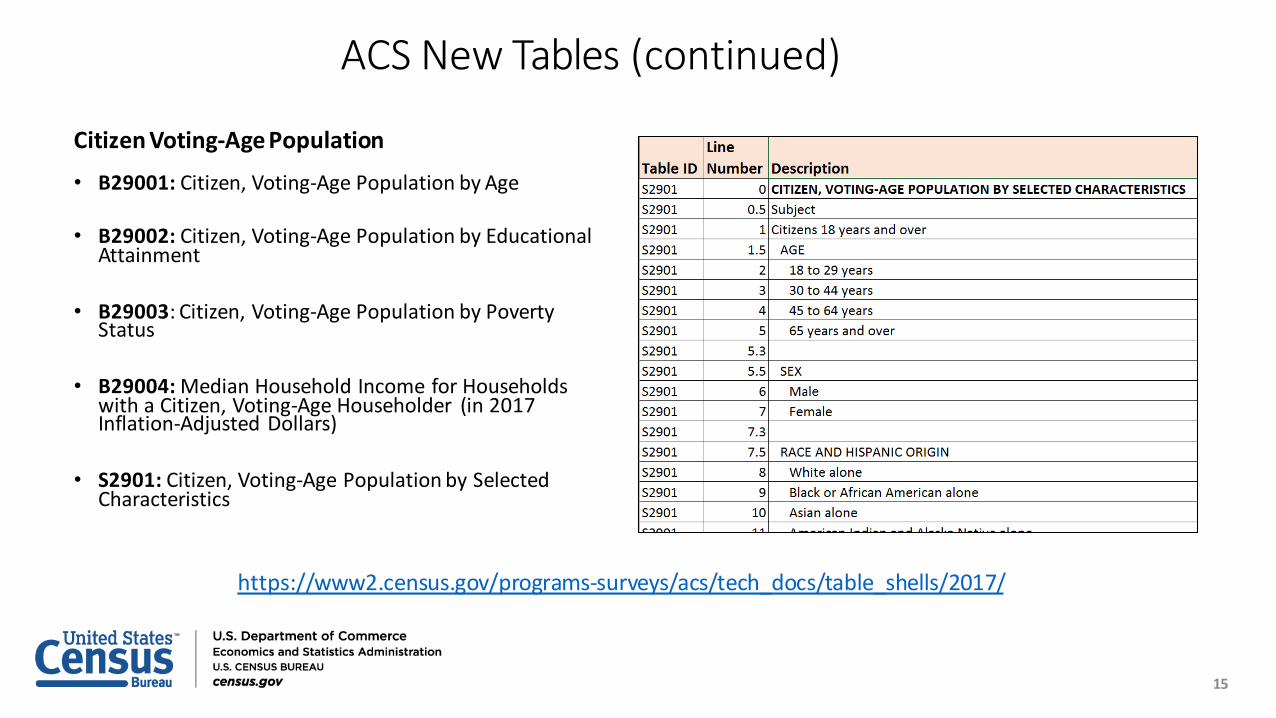
ACS New Tables (continued)
Citizen Voting-Age Population
• B29001: Citizen, Voting-Age Population by Age
• B29002: Citizen, Voting-Age Population by Educational Attainment
• B29003: Citizen, Voting-Age Population by Poverty Status
• B29004: Median Household Income for Households with a Citizen, Voting-Age Householder (in 2017 Inflation-Adjusted Dollars)
• S2901: Citizen, Voting-Age Population by Selected Characteristics
TableID Line Number Description
B29001 CITIZEN, VOTING-AGE POPULATION BY AGE
B29001 Universe: Citizens 18 years and over
B29001 1 Total:
B29001 2 18 to 29 years
B29001 3 30 to 44 years
B29001 4 45 to 64 years
B29001 5 65 years and over
15
https://www2.census.gov/programs-surveys/acs/tech_docs/table_shells/2017/
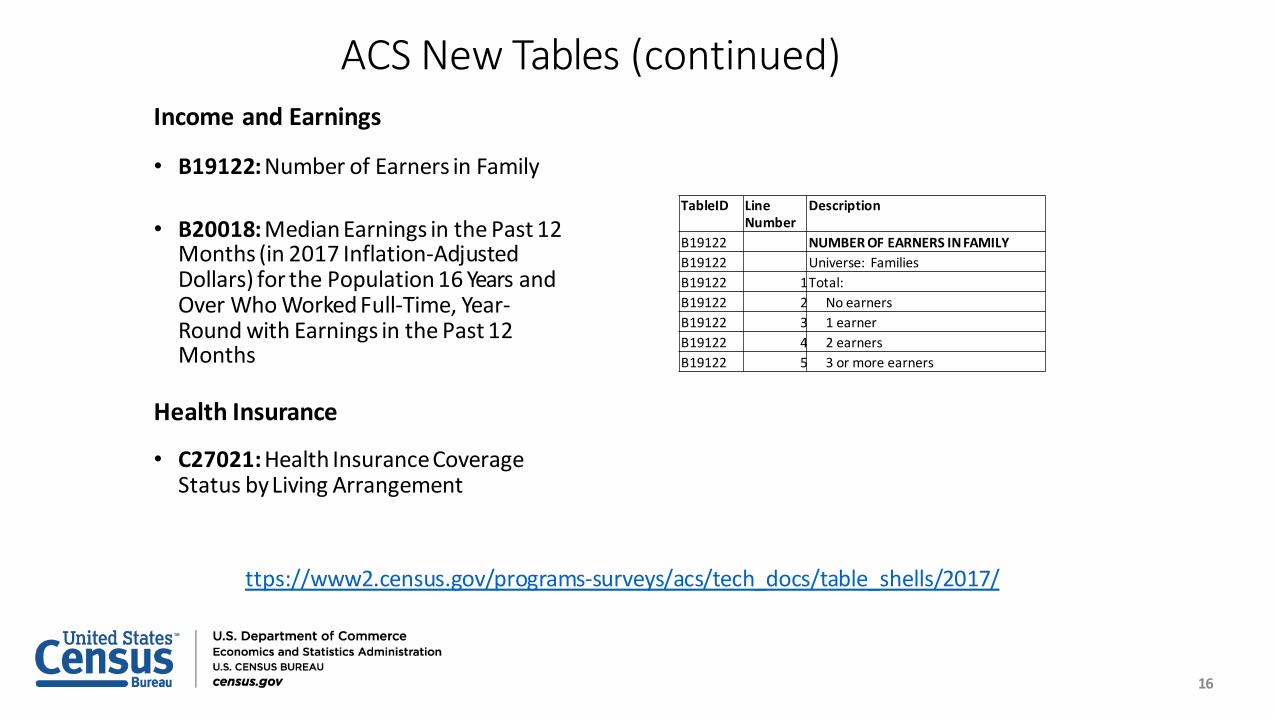
ACS New Tables (continued)
16
TableID Line Number
Description
B19122 NUMBER OF EARNERS IN FAMILY
B19122 Universe: Families
B19122 1Total:
B19122 2 No earners
B19122 3 1 earner
B19122 4 2 earners
B19122 5 3 or more earners
Income and Earnings
• B19122: Number of Earners in Family
• B20018: Median Earnings in the Past 12 Months (in 2017 Inflation-Adjusted Dollars) for the Population 16 Years and Over Who Worked Full-Time, Year-Round with Earnings in the Past 12 Months
Health Insurance
• C27021: Health Insurance Coverage Status by Living Arrangement
ttps://www2.census.gov/programs-surveys/acs/tech_docs/table_shells/2017/
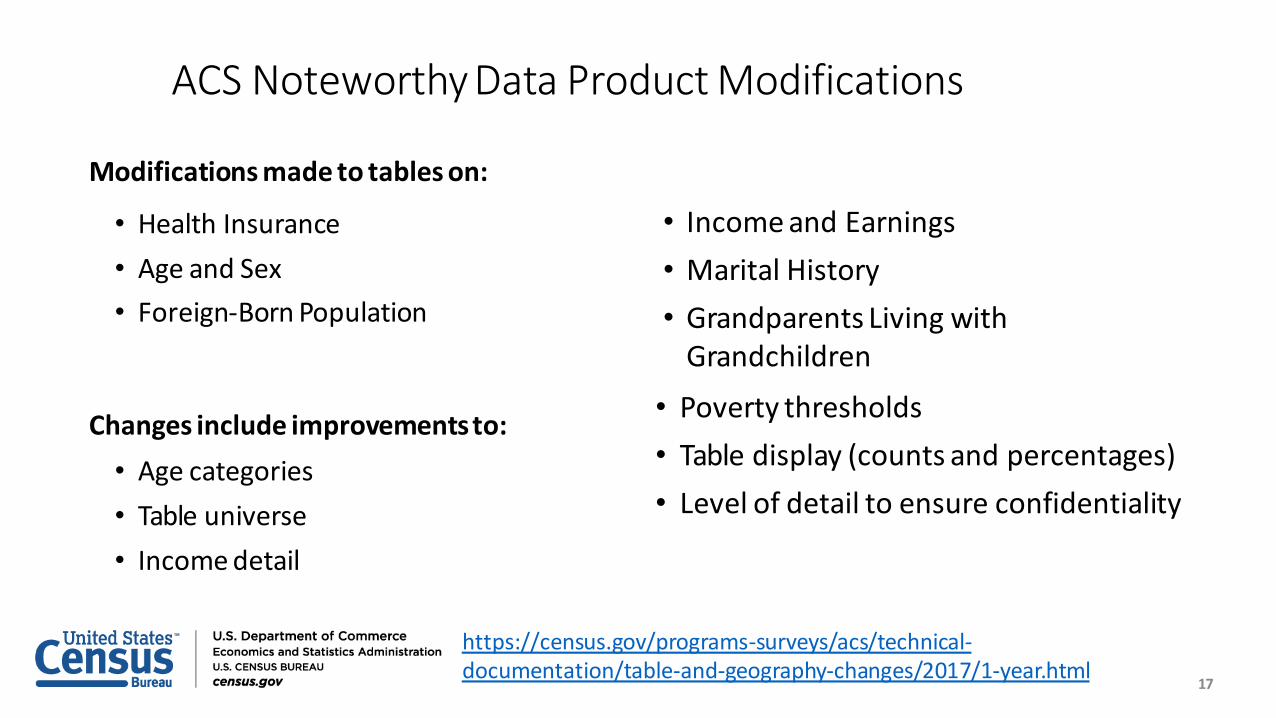
ACS Noteworthy Data Product Modifications
17
• Income and Earnings
• Marital History
• Grandparents Living withGrandchildren
Modifications made to tables on:
• Health Insurance
• Age and Sex
• Foreign-Born Population
Changes include improvementsto:
• Age categories
• Table universe
• Income detail
• Poverty thresholds
• Table display (counts and percentages)
• Level of detail to ensure confidentiality
https://census.gov/programs-surveys/acs/technical-documentation/table-and-geography-changes/2017/1-year.html

ACS Geography Update
18
• New Geographies:• American Indian off-reservation trust lands: 9 new geographies in California,
Massachusetts, Michigan, and Washington
• County Subdivisions: 9 new geographies in Louisiana, Ohio, South Dakota, and Wisconsin
• Places: 7 new cities, villages, and census-designated places in Florida, Georgia, Illinois, South Dakota, Texas, and Wisconsin.
• Boundary changes due to annexation, disincorporation, and geocoding updates
https://census.gov/programs-surveys/acs/technical-documentation/table-and-geography-changes.html

Guidance for ACS Users
•
•
Compare across geographies and population subgroups using 2017 ACS
Compare 2016 ACS and 2017 ACS estimates but use caution when comparing•Income, Earnings, and Poverty
Compare percentages, means, medians, and rates instead of totals whenever possible
Don’t expect ACS estimates to match decennial census counts or estimates from other surveys
19
https://census.gov/programs-surveys/acs/guidance/comparing-acs-data/2017.html

Data Tables & Tools
https://www.census.gov/acs/www/data/data-tables-and-tools/
21

Comparison Guidance
https://www.census.gov/programs-surveys/acs/guidance/comparing-acs-data/2017.html
22

Documentation
23

Why We Ask
https://www.census.gov/acs/www/about/why-we-ask-each-question/
24

Application Programming Interface (API)
https://www.census.gov/data/developers/data-sets.html
25
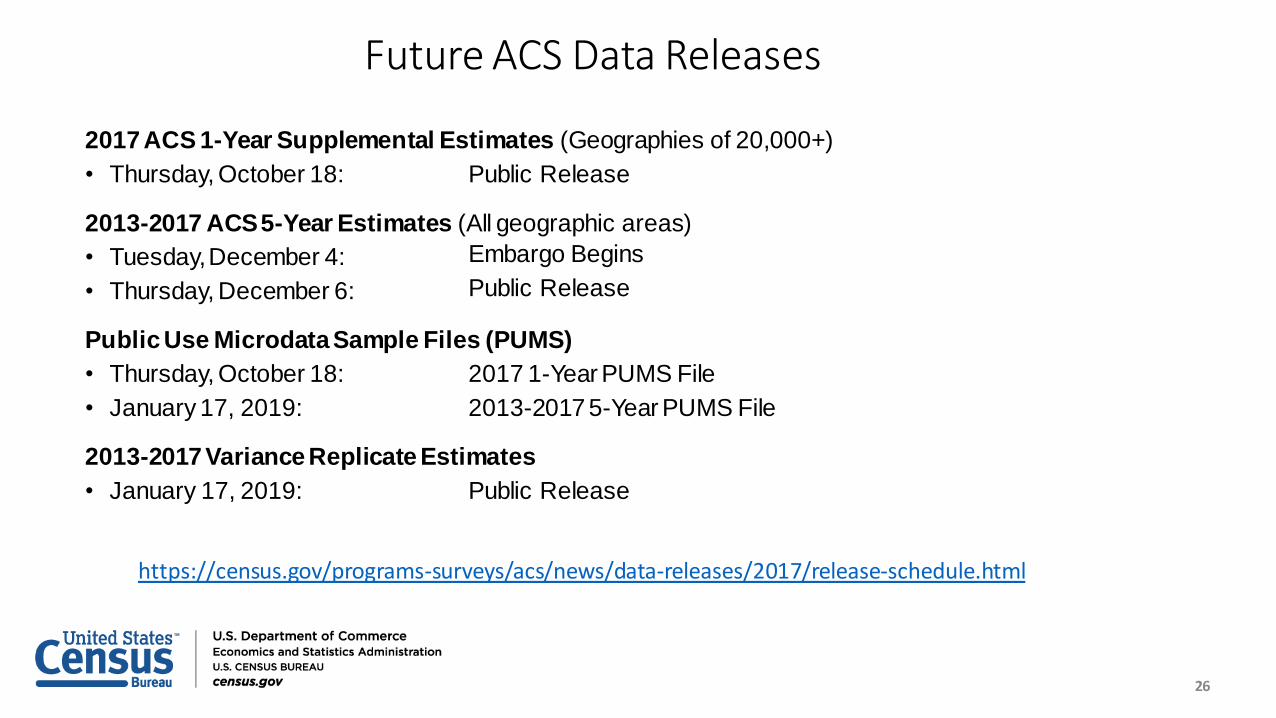
Future ACS Data Releases
26
2017 ACS 1-Year Supplemental Estimates (Geographies of 20,000+)
• Thursday, October 18: Public Release
2013-2017 ACS 5-Year Estimates (All geographic areas)
• Tuesday, December 4:
• Thursday, December 6:
Embargo Begins
Public Release
Public Use Microdata Sample Files (PUMS)
• Thursday, October 18:
• January 17, 2019:
2017 1-Year PUMS File
2013-2017 5-Year PUMS File
2013-2017 Variance Replicate Estimates
• January 17, 2019: Public Release
https://census.gov/programs-surveys/acs/news/data-releases/2017/release-schedule.html

Data Tell Stories. Tell Us Yours!
Your story
Your outcome Your
data details
27
https://www.census.gov/acs/www/share-your-story/
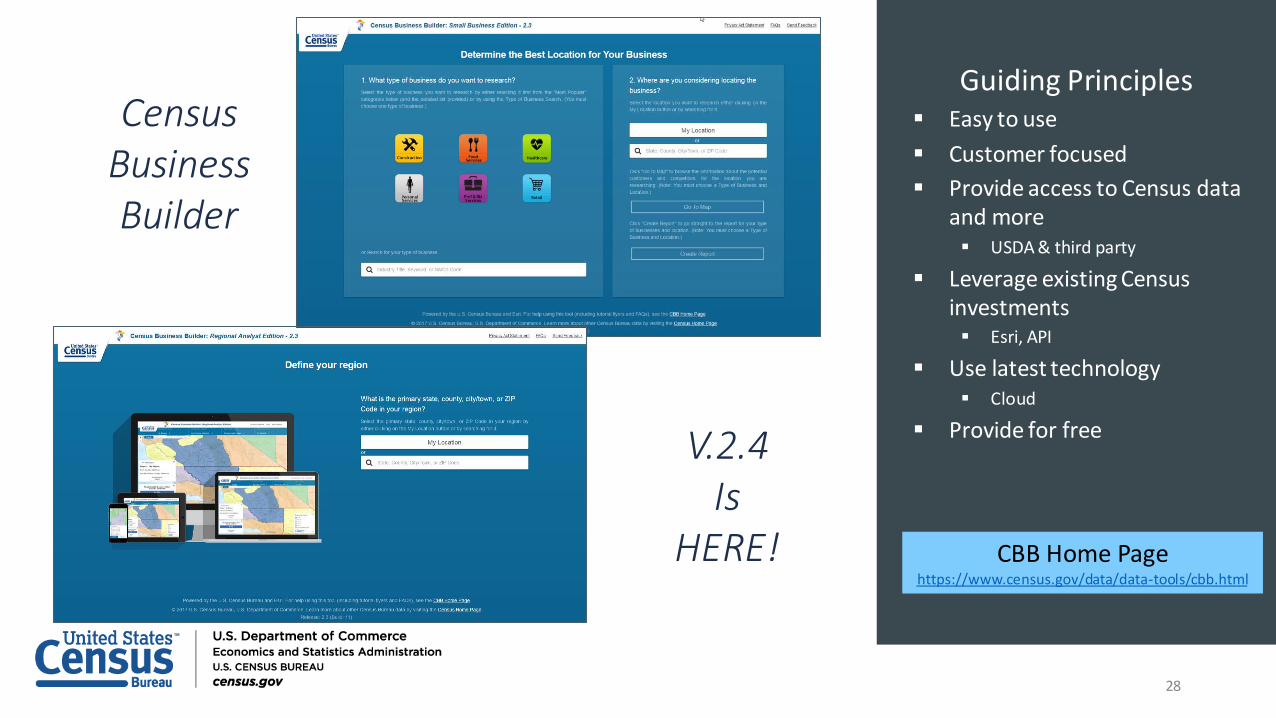
Census Business Builder
Guiding Principles Easy to use
Customer focused
Provide access to Census data and more USDA & third party
Leverage existing Census investments Esri, API
Use latest technology Cloud
Provide for free
CBB Home Pagehttps://www.census.gov/data/data-tools/cbb.html
28
V.2.4 Is
HERE!
Census Business Builder 2.4 Update
29
What's New in Version 2.4
New and Expanded Content:• Revised business data (from the 2016 County Business Patterns and 2016
Nonemployer Statistics program.
New or Revised Features:• Ability to build regions in RAE by combinations of States, Counties, Cities/Towns,
ZIP codes, and Tracts (Tracts is new!).• Ability to build regions in RAE by combinations of geographic areas across types.
https://www.census.gov/data/data-tools/cbb.How_Tos.html

Grade Levels and Subjects
31
Classroom activities available for:
• Elementary and middle school
Math
Geography
History
• High school
Math
History
Geography
Sociology
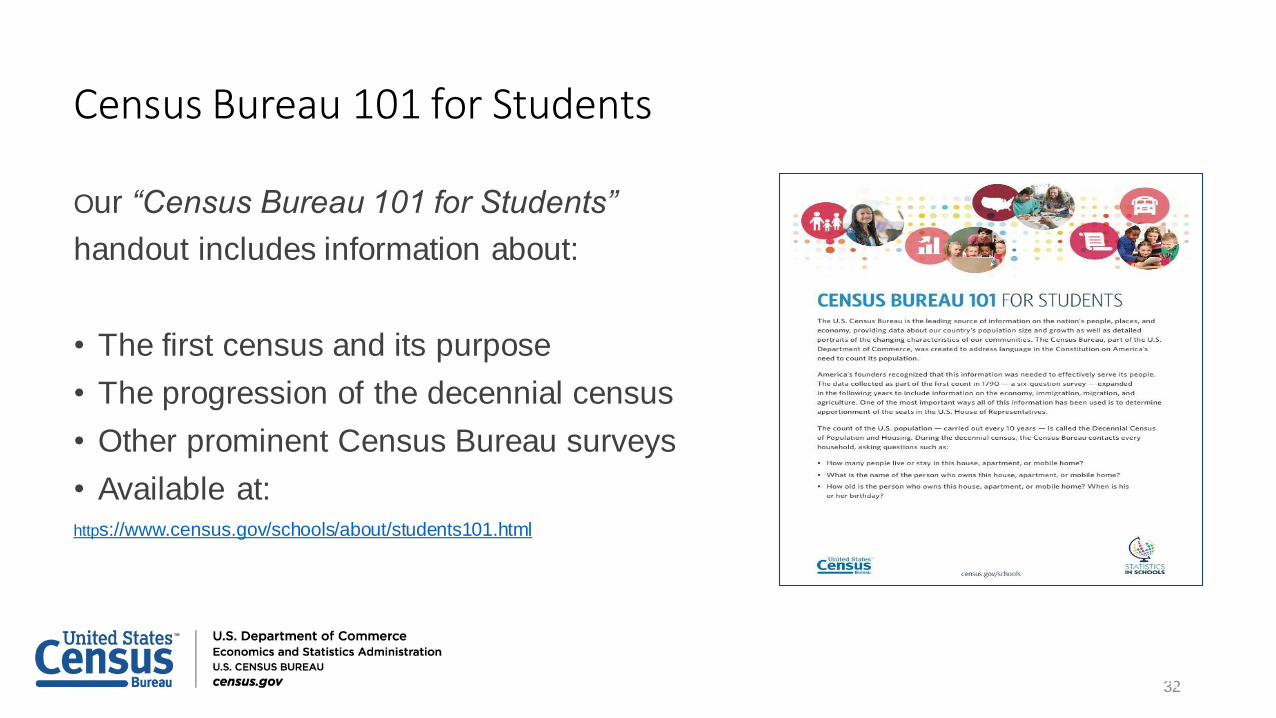
Census Bureau 101 for Students
32
Our “Census Bureau 101 for Students”
handout includes information about:
• The first census and its purpose
• The progression of the decennial census
• Other prominent Census Bureau surveys
• Available at:https://www.census.gov/schools/about/students101.html

Top 10 Benefits for Teachers
33
Our “Top 10 Benefits of Statistics in Schools for Teachers” handout highlights that:
• Activities were developed by teachers, for teachers.
• The program promotes cross-curricular education.
• Activities can augment teachers’ curriculum.
• The program can easily be expanded or modified to meet students’ skill levels.
• Activities correspond with specified, relevant standards and guidelines.
• All resources are completely free and ready to use.
• Available at: https://www.census.gov/schools/about/top10.html
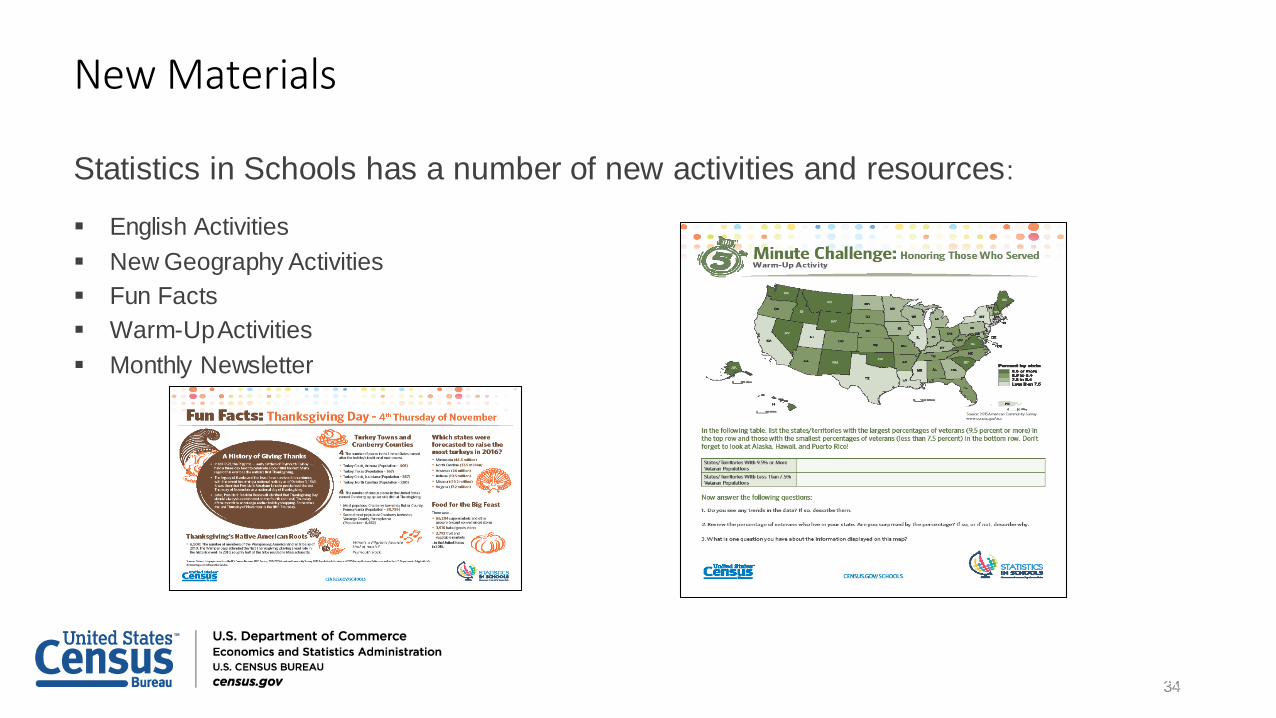
New Materials
34
Statistics in Schools has a number of new activities and resources:
English Activities
New Geography Activities
Fun Facts
Warm-Up Activities
Monthly Newsletter

Receive weekly Data Gems.These short “how-to” videos are an easy and quick way to increase your knowledge of Census data. Get them in your inbox!
Get access to our data courses.You will learn-at-your-own-pace with these video-tutorials designed for different skill levels.
Interact with our instructors via webinars. Learn about our data releases and tools while attending these live virtual classes.
Bring our data experts to you.Request free workshops and webinars for your organization: [email protected]
Take part in this communityShare your feedback and ideas for our educational content:[email protected]
Census.gov/Academy: Visit and Subscribe
https://census.gov/academy

Sign up for and manage alerts athttps://public.govdelivery.com/acco
unts/USCENSUS/subscriber/new
More information on the
American Community Survey: https://www.census.gov/acs
Continue the Conversation #ACSdata
Census (Non-media inquiries)
800-923-8282
Public Information Office (Media)
301-763-3030
facebook.com/uscensusbureau
twitter.com/uscensusbureau
youtube.com/user/uscensusbureau
instagram.com/uscensusbureau
pinterest.com/uscensusbureau
linkedin.com/company/us-census-bureau
U.S. Census Bureau
Data Dissemination Specialist (DDS)
Eric Coyle(702) 236-3202
Additional Assistance:
Toll-free number:1-844-ASK-DATA (1-844-275-2342)
Additional Resources:Want Free Training?Need Local Stats?
37

Q&A and Thank You!
38