cell lineage reconstruction of early zebrafish embryos
TRANSCRIPT

DOI: 10.1126/science.1189428 , 967 (2010); 329Science
et al.Nicolas Olivier,Embryos Using Label-Free Nonlinear MicroscopyCell Lineage Reconstruction of Early Zebrafish
This copy is for your personal, non-commercial use only.
. clicking herecolleagues, clients, or customers by , you can order high-quality copies for yourIf you wish to distribute this article to others
. herefollowing the guidelines can be obtained byPermission to republish or repurpose articles or portions of articles
(this information is current as of August 19, 2010 ):The following resources related to this article are available online at www.sciencemag.org
http://www.sciencemag.org/cgi/content/full/329/5994/967version of this article at:
including high-resolution figures, can be found in the onlineUpdated information and services,
http://www.sciencemag.org/cgi/content/full/329/5994/967/DC1 can be found at: Supporting Online Material
http://www.sciencemag.org/cgi/content/full/329/5994/967#otherarticles, 9 of which can be accessed for free: cites 27 articlesThis article
http://www.sciencemag.org/cgi/collection/developmentDevelopment
: subject collectionsThis article appears in the following
registered trademark of AAAS. is aScience2010 by the American Association for the Advancement of Science; all rights reserved. The title
CopyrightAmerican Association for the Advancement of Science, 1200 New York Avenue NW, Washington, DC 20005. (print ISSN 0036-8075; online ISSN 1095-9203) is published weekly, except the last week in December, by theScience
on
Aug
ust 1
9, 2
010
ww
w.s
cien
cem
ag.o
rgD
ownl
oade
d fr
om

20. T. Pizzari, C. K. Cornwallis, H. Løvlie, S. Jakobsson,T. R. Birkhead, Nature 426, 70 (2003).
21. M. Olsson, R. Shine, T. Madsen, A. Gullberg,H. Tegelstrom, Nature 383, 585 (1996).
22. A. Pusey, M. Wolf, Trends Ecol. Evol. 11, 201 (1996).23. T. Tregenza, N. Wedell, Nature 415, 71 (2002).24. J. Merilä, L. E. B. Kruuk, B. C. Sheldon, Nature
412, 76 (2001).25. T. Veen et al., Nature 411, 45 (2001).26. J. Merilä, B. C. Sheldon, S. C. Griffith, Ann. Zool. Fenn.
40, 269 (2003).
27. W. G. Eberhard, Female Control: Sexual Selection byCryptic Female Choice (Princeton Univ. Press, Princeton,NJ, 1996).
28. S. C. Griffith, Am. Nat. 169, 274, discussion 282(2007).
29. We thank T. Birkhead, R. Brooks, R. Calsbeek, S. Immler,S. Ulfstrand, D. Westneat, and M. Whiting for commentson the manuscript. This work was supported by DiscoveryGrants DP0770889 (S.R.P.) and DP0881019 (S.C.G.) fromthe Australian Research Council, a L’Oréal for Women inScience Fellowship (S.R.P.), and the Save the Gouldian
Fund. The Animal Care and Ethics Committee ofMacquarie University approved this research.
Supporting Online Materialwww.sciencemag.org/cgi/content/full/329/5994/964/DC1Materials and MethodsFig. S1Table S1References
17 May 2010; accepted 7 July 201010.1126/science.1192407
Cell Lineage Reconstruction of EarlyZebrafish Embryos Using Label-FreeNonlinear MicroscopyNicolas Olivier,1* Miguel A. Luengo-Oroz,2* Louise Duloquin,3* Emmanuel Faure,4 Thierry Savy,4
Israël Veilleux,1 Xavier Solinas,1 Delphine Débarre,1 Paul Bourgine,4,5 Andrés Santos,2
Nadine Peyriéras,3,6† Emmanuel Beaurepaire1†
Quantifying cell behaviors in animal early embryogenesis remains a challenging issue requiringin toto imaging and automated image analysis. We designed a framework for imaging andreconstructing unstained whole zebrafish embryos for their first 10 cell division cycles and reportmeasurements along the cell lineage with micrometer spatial resolution and minute temporalaccuracy. Point-scanning multiphoton excitation optimized to preferentially probe the innermostregions of the embryo provided intrinsic signals highlighting all mitotic spindles and cellboundaries. Automated image analysis revealed the phenomenology of cell proliferation.Blastomeres continuously drift out of synchrony. After the 32-cell stage, the cell cycle lengthensaccording to cell radial position, leading to apparent division waves. Progressive amplificationof this process is the rule, contrasting with classical descriptions of abrupt changes in thesystem dynamics.
Although classical developmental biologyis characterized by qualitative descrip-tions, recent work underlines the require-
ments for precise measurements to enable formalreconstruction integrating the genetic, molecular,and cellular levels of organization (1–3). The op-timization ofmicroscopy imaging techniques andimproved data algorithmic processing are keyissues in such reconstructions. Parallelized linearmicroscopy such as light-sheet fluorescence mi-croscopy provides fast imaging but suffers fromloss of information with depth (4). Point-scanningtwo-photonmicroscopy provides deeper imaging(5) but exhibits slower frame rate, compromising
automated individual cell tracking in whole orga-nisms (6). Furthermore, the usual implementationof these two paradigms does not allow homoge-neous illumination in spherical samples, leadingto a difficult tradeoff between the detection ofdeep structures and illumination-induced pertur-bation in outer layers. Finally, relying on fluo-rescent staining of biological structures bringsadditional artifacts and limitations. Exploiting theintrinsic optical nonlinear properties of the sam-ple is a valuable, although challenging, alter-native. Second-harmonic generation (SHG) isobtained from dense noncentrosymmetric struc-tures such as orientedmicrotubule assemblies (7–9),including mitotic spindles (8, 10). Third-harmonicgeneration (THG) is obtained from optical hetero-geneities (11)—such as the interface between anaqueous medium and a lipidic, mineralized, or ab-sorbing structure (12)—and allows morphologi-cal imaging of small organisms (10, 13).
Here, we show that combining SHG and THGimaging of unlabeled embryos with a scanningscheme matching embryo morphology providesadequate three-dimensional (3D) imaging overtime for the automated reconstruction of cell be-havior during zebrafish embryo cleavage stages(14). Ad hoc image analysis strategies for cellposition, division, and shape identification wereused to produce a complete and validated lineage
tree for a cohort of six zebrafish embryos until the1000-cell stage, annotated with minute-level divi-sion timing,micrometer-accuracy cell coordinates,and shape characteristics. These data provided aquantitative spatiotemporal description of thewave-like division cycles and allowed the constructionof a prototypic digital blastula. The cycle dura-tion of sister cells exhibited variability that did notcorrelate with cell volume, revealing unexpectedcell division asynchrony and asymmetry from thefirst division cycles and leading to increasing cellheterogeneity by the time ofmidblastula transition(MBT) (14).
An appropriate image acquisition scheme wasdevised to provide high-resolution time-lapse imag-ing of intrinsic SHG and THG signals (Fig. 1 andsupporting online material). Excitation in the1.2-mm range reduced nonlinear endogenous ab-sorption by the sample and allowed simultaneoustwo-photon–excited fluorescence (2PEF) imag-ing of red fluorescent proteins (Fig. 1, B and C)for control experiments. When imaging a spheri-cal embryo, scattering and aberrations typicallyresult in reduced signal at the center of each plane(Fig. 1E). We therefore scanned each plane of ahalf-sphere along a spiral trajectory with variablespeed to spend more time imaging the innermostcells (Fig. 1, D to F, and fig. S1). This conformalstrategy provided optimal acquisition time andminimal photoperturbation (fig. S2). SHG andTHG signals were co-optimized by using rotatinglinear incident polarization. In addition, becauseTHG contrast from a specific structure dependson its size relative to the focal volume (15), mod-erate focusing (3.5-mm Z-resolution) was used tohighlight cell interface compared with smallersubcellular structures (Fig. 2D).
Combining the conformal scanning schemedescribed above, sensitive detection, infrared ex-citation wavelength, and appropriate focusing andpolarization conditions allowed homogenous de-tection of mitotic spindles and cell and tissue phe-notypic features in the whole unlabeled zebrafishembryo during cleavage stages. The blastodermwas contained in a half sphere of 440-mm radiusimaged with a temporal resolution of 80 s and avolumetric pixel size of 2 by 2 by 4 mm, suitablefor further automated reconstruction of the celllineage tree.
The intrinsic THG signal revealed a numberof structures and dynamic processes (Fig. 2, A toJ, and movies S1 to S6) and highlighted cellcontours even better than membrane staining by
1Laboratory for Optics and Biosciences, Ecole Polytechnique,CNRS, INSERM, Palaiseau, France. 2Biomedical Image Technol-ogies, Universidad Politécnica de Madrid, and BiomedicalResearch Center in Bioengineering, Biomaterials, and Nano-medicine (CIBER-BBN), Madrid, Spain. 3Neurobiologie etDéveloppement, Institut de Neurobiologie Alfred Fessard,CNRS, Gif/Yvette, France. 4Centre deRecherche en EpistémologieAppliquée, Ecole Polytechnique, CNRS, Paris, France. 5RéseauNational des Systèmes Complexes, 57-59 rue Lhomond, Paris,France. 6Institut des Systèmes Complexes Paris Ile-de-France,57-59 rue Lhomond, Paris, France.
*These authors contributed equally to this work.†To whom correspondence should be addressed. E-mail: [email protected] (N.P.); [email protected] (E.B.)
www.sciencemag.org SCIENCE VOL 329 20 AUGUST 2010 967
REPORTS
on
Aug
ust 1
9, 2
010
ww
w.s
cien
cem
ag.o
rgD
ownl
oade
d fr
om
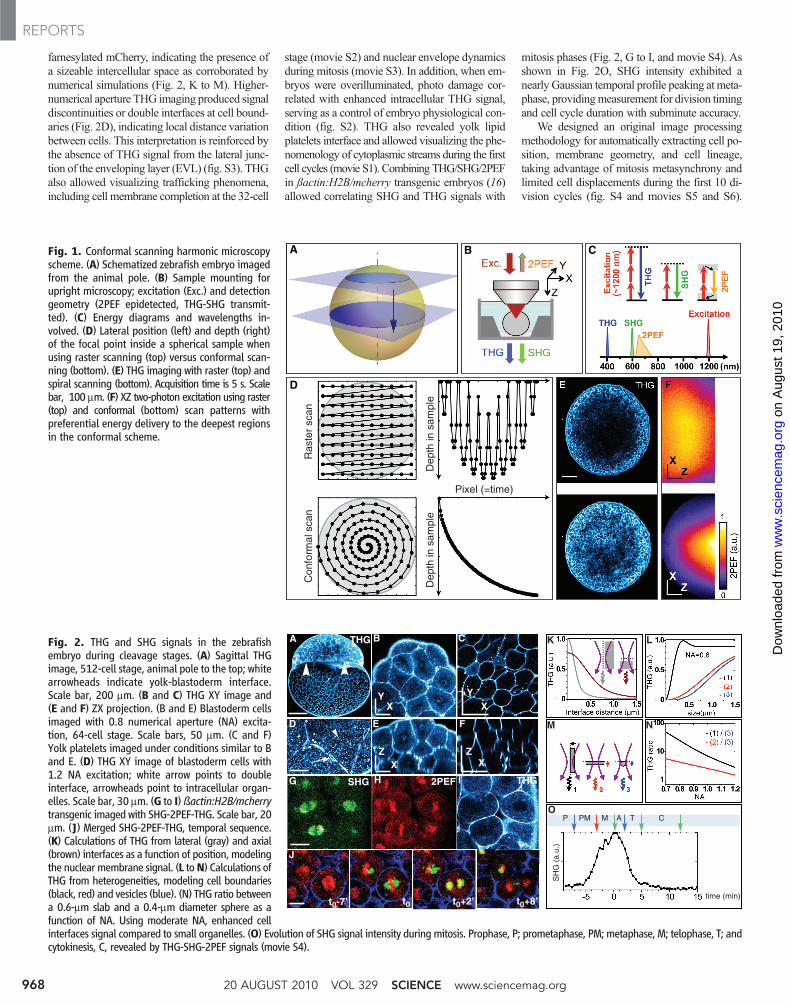
farnesylated mCherry, indicating the presence ofa sizeable intercellular space as corroborated bynumerical simulations (Fig. 2, K to M). Higher-numerical aperture THG imaging produced signaldiscontinuities or double interfaces at cell bound-aries (Fig. 2D), indicating local distance variationbetween cells. This interpretation is reinforced bythe absence of THG signal from the lateral junc-tion of the enveloping layer (EVL) (fig. S3). THGalso allowed visualizing trafficking phenomena,including cell membrane completion at the 32-cell
stage (movie S2) and nuclear envelope dynamicsduring mitosis (movie S3). In addition, when em-bryos were overilluminated, photo damage cor-related with enhanced intracellular THG signal,serving as a control of embryo physiological con-dition (fig. S2). THG also revealed yolk lipidplatelets interface and allowed visualizing the phe-nomenology of cytoplasmic streams during the firstcell cycles (movie S1). Combining THG/SHG/2PEFin ßactin:H2B/mcherry transgenic embryos (16)allowed correlating SHG and THG signals with
mitosis phases (Fig. 2, G to I, and movie S4). Asshown in Fig. 2O, SHG intensity exhibited anearly Gaussian temporal profile peaking at meta-phase, providingmeasurement for division timingand cell cycle duration with subminute accuracy.
We designed an original image processingmethodology for automatically extracting cell po-sition, membrane geometry, and cell lineage,taking advantage of mitosis metasynchrony andlimited cell displacements during the first 10 di-vision cycles (fig. S4 and movies S5 and S6).
Fig. 1. Conformal scanning harmonic microscopyscheme. (A) Schematized zebrafish embryo imagedfrom the animal pole. (B) Sample mounting forupright microscopy; excitation (Exc.) and detectiongeometry (2PEF epidetected, THG-SHG transmit-ted). (C) Energy diagrams and wavelengths in-volved. (D) Lateral position (left) and depth (right)of the focal point inside a spherical sample whenusing raster scanning (top) versus conformal scan-ning (bottom). (E) THG imaging with raster (top) andspiral scanning (bottom). Acquisition time is 5 s. Scalebar, 100 mm. (F) XZ two-photon excitation using raster(top) and conformal (bottom) scan patterns withpreferential energy delivery to the deepest regionsin the conformal scheme.
A CB
D
Con
form
al s
can
Dep
th in
sam
ple
Ras
ter
scan
Dep
th in
sam
ple
Pixel (=time)
Fig. 2. THG and SHG signals in the zebrafishembryo during cleavage stages. (A) Sagittal THGimage, 512-cell stage, animal pole to the top; whitearrowheads indicate yolk-blastoderm interface.Scale bar, 200 mm. (B and C) THG XY image and(E and F) ZX projection. (B and E) Blastoderm cellsimaged with 0.8 numerical aperture (NA) excita-tion, 64-cell stage. Scale bars, 50 mm. (C and F)Yolk platelets imaged under conditions similar to Band E. (D) THG XY image of blastoderm cells with1.2 NA excitation; white arrow points to doubleinterface, arrowheads point to intracellular organ-elles. Scale bar, 30 mm. (G to I)ßactin:H2B/mcherrytransgenic imaged with SHG-2PEF-THG. Scale bar, 20mm. (J) Merged SHG-2PEF-THG, temporal sequence.(K) Calculations of THG from lateral (gray) and axial(brown) interfaces as a function of position, modelingthe nuclear membrane signal. (L toN) Calculations ofTHG from heterogeneities, modeling cell boundaries(black, red) and vesicles (blue). (N) THG ratio betweena 0.6-mm slab and a 0.4-mm diameter sphere as afunction of NA. Using moderate NA, enhanced cellinterfaces signal compared to small organelles. (O) Evolution of SHG signal intensity during mitosis. Prophase, P; prometaphase, PM; metaphase, M; telophase, T; andcytokinesis, C, revealed by THG-SHG-2PEF signals (movie S4).
time (min)
SH
G (
a.u.
)
P PM M A T C
A B C
D E
SHG
t0-7’ t0 t0+2’ t0+8’
THG
THG
2PEF
F
G H
X
XZ
XZ
YX
Y
I
O
K L
M N
J
20 AUGUST 2010 VOL 329 SCIENCE www.sciencemag.org968
REPORTS
on
Aug
ust 1
9, 2
010
ww
w.s
cien
cem
ag.o
rgD
ownl
oade
d fr
om

This allowed measurements along the cell lin-eage tree throughout cleavage (17) until the onsetof MBT (18). Mitoses were detected from the
SHG channel by compressing the data into 10volumes corresponding to cell cycles and detect-ing in each volume the expected number of SHG
spots corresponding to cell divisions (2, 4, 8…)(Fig. 3A and movie S7). A distance rule respect-ing the symmetric and limited displacement of
Fig. 3. Automated reconstruction of the cell lineage tree for a cohort ofzebrafish early blastulas. (A) SHG spot detection (red) overlaid to XYprojections of SHG images; A1 to A5 encompass cell cycle 5 (with cell division1 at 45 min); see movie S8. (B and C) THG image segmentation at the 8-cellstage (B) and 128-cell stage (C); see movie S9. (D and E) Reconstruction of 4-cell stage (D) and 256-cell stage (E) embryos. In white, raw THG signal; orange,detected SHG spots; colors, segmented cell contours. (F to J) Digital embryofrom 1-cell stage to 512-cell stage. See movie S10. (K) Flat representation of
the lineage tree with eight-cell stage clones; same colors as in (G) to (J). (L)Spatial deployment of the cell lineage up to cycle 5. (Top) Animal pole view.(Bottom) Lateral views. See movie S11 and fig. S6. (M) Angle between suc-cessive sister cells dipoles, in degrees. 55° (black line) corresponds to randomorientation. (N) Angle between sister cells dipoles and the normal to theembryo surface. Cells divided tangentially to the embryo surface until cycle 5(16 to 32 cells). At cycle 5, the four central blastomeres [shown in black in (L)and (N)] divided orthogonally to the surface.
www.sciencemag.org SCIENCE VOL 329 20 AUGUST 2010 969
REPORTS
on
Aug
ust 1
9, 2
010
ww
w.s
cien
cem
ag.o
rgD
ownl
oade
d fr
om
daughter cells after mitosis was then used to linkconsecutive sequences. Finally, accurate cell cycletiming was obtained by fitting time-dependentSHG intensity to a Gaussian function (Fig. 2O).The lineage tree validation is a critical step astracking errors propagate along the tree. Valida-tion was performed using an interactive visual-ization interface that allowed comparing raw andreconstructed data at each cell cycle before pro-cessing the next one (movie S8). This strategy
provided error-free lineage trees with minimalhuman intervention (fig. S5). Cell shapes werethen extracted from THG images by using cells’spatial coordinates as seeds to perform a regiongrowing-based contour detection. A rough shapeapproximation was first obtained by building aVoronoi diagram, and membrane detection wasrefined using a viscous watershed algorithm (19)(movie S9 and Fig. 3, B to E). Data sets from sixdifferent embryos were processed to obtain the
corresponding digital blastulas (Fig. 3, fig. S5,and movies S10 to S13).
The phenomenological reconstruction al-lowed a systematic analysis of spatiotemporalcorrelations between cell position, cell cycle du-ration, mitosis duration, cell volume, and cell di-vision orientation. Cells during cycles 1 to 4 wereconstrained by the absence of basal plasmamem-brane contacting the yolk, and divisions dis-played the known stereotyped orientation with
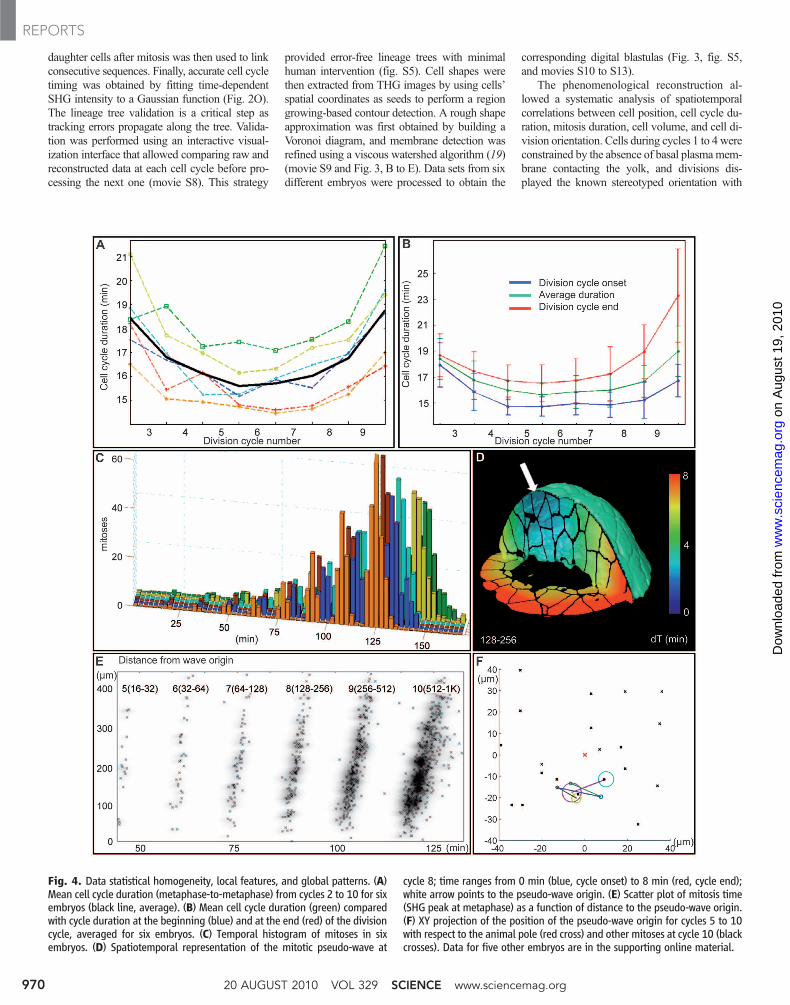
Fig. 4. Data statistical homogeneity, local features, and global patterns. (A)Mean cell cycle duration (metaphase-to-metaphase) from cycles 2 to 10 for sixembryos (black line, average). (B) Mean cell cycle duration (green) comparedwith cycle duration at the beginning (blue) and at the end (red) of the divisioncycle, averaged for six embryos. (C) Temporal histogram of mitoses in sixembryos. (D) Spatiotemporal representation of the mitotic pseudo-wave at
cycle 8; time ranges from 0 min (blue, cycle onset) to 8 min (red, cycle end);white arrow points to the pseudo-wave origin. (E) Scatter plot of mitosis time(SHG peak at metaphase) as a function of distance to the pseudo-wave origin.(F) XY projection of the position of the pseudo-wave origin for cycles 5 to 10with respect to the animal pole (red cross) and other mitoses at cycle 10 (blackcrosses). Data for five other embryos are in the supporting online material.
20 AUGUST 2010 VOL 329 SCIENCE www.sciencemag.org970
REPORTS
on
Aug
ust 1
9, 2
010
ww
w.s
cien
cem
ag.o
rgD
ownl
oade
d fr
om

little fluctuation from one embryo to the other(Fig. 3M). Division orientation at cycle 5 startedexploring one more spatial direction at 90° rel-ative to the previous division, thus allowing theformation of a partially double-layered blasto-derm (Fig. 3, L and N). This quantitative ob-servation contrasts with the classical descriptionpresenting the 32-cell stage as a single cell layer(14). From divisions 5 to 8, larger fluctuationsoccurred in division orientation, resulting in pro-gressively more random orientations (Fig. 3Nand fig. S6). By averaging and registering sixdifferent embryos, we constructed a prototype ofthe lineage spatiotemporal deployment (fig. S6and movie S10). From cycle 3 to cycle 9, celldisplacements were limited to cytokinesis, anddisplacement speed from one division to theother remained constant (fig. S7), suggesting thatbiochemical dynamics (20, 21) do not impact celldisplacements until MBT, quantitatively sup-porting previous observations (18). Consistently,the clones corresponding to the first eight blas-tomeres observed at the 512-cell stage remainedclustered (Fig. 3, F to J, and movie S10).
In the temporal domain, the main dynamicalchangewas the evolution of cell cycle duration aspreviously observed (22). The cell cycle shorteneduntil division 5 (18.5 T 1.5 min to 15.5 T 1 min),followed by lengthening until division 10 (up to18.5 T 1.5 min) (Fig. 4A). The minimum valuecorrelated with plasma membrane completion atthe 32-cell stage, suggesting a specific regime forthe division of the large early blastomeres (23, 24).Continuous cell cycle lengthening thereafter ishypothesized to result from the degradation ofmaternal products and S-phase lengthening (21).Furthermore, as early as the 4-cell stage, celldivisions did not occur synchronously, and thedelaymeasured between the first and last divisionat each cell cycle increased continuously throughcleavages (Fig. 4, B and C).
In addition, after the 32-cell stage, cell cyclelengthening increased with the physical distancefrom the blastoderm surface (Fig. 4, D and E, andfigs. S8 to S11), so that in the particular case ofsister cells, the deeper tended to divide later thanher sister located closer to the surface (fig. S13).We hypothesize that this feature correlates withdeposition of maternal components by cyto-plasmic streams (movie S1) that might have pro-duced a concentration gradient. In any case,fluctuation in sister cells’ division timing andsteady lengthening in cell cycle duration as afunction of cell position relative to the blastodermsurface are sufficient to explain the progressiveappearance of a global wave-like pattern of radialdivision (Fig. 4, D and E). Calculating the po-sition of this pseudo-wave origin relative to theanimal pole indicated an early symmetry break-ing variably amplified in some cases (fig. S14). Adiscussion of the cell division patterns duringcleavage stages must also take into account theformation of the yolk syncitial layer (YSL) (25).We observed that YSL nuclei typically individ-ualized at the 512-cell stage and underwent three
division cycles with an average timing of 20 to30 min and displaying a peripheral pattern, thusdiffering from the radial pattern observed in theblastoderm (movies S14 to S16 and figs. S15 and16). YSL formation is known to display pheno-typic variability (26), but extreme cases of arti-factual YSL formation were observed in embryosmechanically constrained by the mounting me-dium (movie S16 and fig. S17). Altogether, ourobservations suggest that there is no switch froma radial toward a peripheral pseudo-wave patternin the blastoderm, in contrast to a recent proposalby Keller et al. (4).
Cell volume measurements indicated that upto cycle 10, the nucleo-cytoplasmic ratio (N/C)was unlikely to trigger cell cycle lengthening aswe observed cell volume variability, includingrandom fluctuation between sister cells, with nocorrelation to cycle duration (figs. S11 and S12).According to other studies, N/C becomes an im-portant factor at later developmental stages (18).Indeed, a pause in cell cycle, regulated by N/C, isdescribed as one of the most prominent featuresof the MBT (27). This means that by MBT, theN/C variability generated earlier could act asa local fluctuation factor, breaking the globalpseudo-wave pattern. Cell cycle lengthening, bothglobally and as a function of cell position, is themain parameter that should be taken into accountfor further modeling zebrafish embryo cleavagemorphogenesis. Continuity and amplification ofthe process are the rule, rather than the classicallydescribed abrupt changes from synchrony tometasynchrony and asynchrony (14).
Harmonic time-lapse microscopy provides intoto imaging, enabling automated and validatedreconstruction of the zebrafish embryo lineagetree during the cleavage period. Because the re-construction scheme is based on cell cycle meta-synchrony and limited cell displacements, weprovide a quantitative assessment that cell in-trinsic motility does not arise before cell cycle 10,described as the MBTstage (18). The frameworkpresented here automates the phenomenologicalreconstruction of animal early embryogenesis with-out the use of fluorescent staining. Conformalacquisition with excitation power and scanningspeed matching specimen morphology makespoint-scanning multiphoton microscopy an ex-cellent strategy for deep embryo imaging. Weanticipate that combining harmonic and fluores-cent signals in conformal scanning time-lapsemicroscopy will provide optimal data sets toachieve the automated tracking of cell trajectoriesand cell divisions throughout vertebrate embryo-genesis. Single-cell analysis along the lineagetree is necessary to provide relevant spatial andtemporal correlations underlying emerging pat-terns. Most of developmental biology still relieson visual inspection and manual work to achievelimited cell tracking, and recent studies haveprovided only a global estimation of cell move-ments. In this context, we expect our frameworkto establish standards in terms of measurementsprecision and accuracy of automated algorithmic
segmentation and tracking procedures. The quan-titative phenomenological reconstruction of thezebrafish embryo cleavage period provided hereshould serve as a reference for further analysis ofthe interplay between nano- (molecular and ge-netic) andmacro- (biomechanics) level dynamics.
References and Notes1. C. Zimmer et al., IEEE Signal Process. Mag. 23, 54
(2006).2. D. Muzzey, A. van Oudenaarden, Annu. Rev. Cell Dev.
Biol. 25, 301 (2009).3. A. C. Oates, N. Gorfinkiel, M. González-Gaitán,
C. P. Heisenberg, Nat. Rev. Genet. 10, 517 (2009).4. P. J. Keller, A. D. Schmidt, J. Wittbrodt, E. H. Stelzer,
Science 322, 1065 (2008).5. F. Helmchen, W. Denk, Nat. Methods 2, 932
(2005).6. A. McMahon, W. Supatto, S. E. Fraser, A. Stathopoulos,
Science 322, 1546 (2008).7. W. R. Zipfel et al., Proc. Natl. Acad. Sci. U.S.A. 100,
7075 (2003).8. P. J. Campagnola et al., Biophys. J. 82, 493 (2002).9. A. C. Kwan, D. A. Dombeck, W. W. Webb, Proc. Natl.
Acad. Sci. U.S.A. 105, 11370 (2008).10. C.-K. Sun et al., J. Struct. Biol. 147, 19 (2004).11. Y. Barad, H. Eisenberg, M. Horowitz, Y. Silberberg, Appl.
Phys. Lett. 70, 922 (1997).12. D. Oron et al., J. Struct. Biol. 147, 3 (2004).13. D. Débarre et al., Opt. Lett. 29, 2881 (2004).14. C. B. Kimmel, W. W. Ballard, S. R. Kimmel, B. Ullmann,
T. F. Schilling, Dev. Dyn. 203, 253 (1995).15. D. Débarre, W. Supatto, E. Beaurepaire, Opt. Lett. 30,
2134 (2005).16. J. P. Levraud et al., J. Immunol. 178, 4385 (2007).17. W. Tadros, H. D. Lipshitz, Development 136, 3033
(2009).18. D. A. Kane, C. B. Kimmel, Development 119, 447
(1993).19. C. Vachier, F. Meyer, J. Math. Imaging Vis. 22, 251
(2005).20. S. Mathavan et al., PLoS Genet. 1, 260 (2005).21. A. F. Schier, Science 316, 406 (2007).22. D. A. Kane, R. M. Warga, C. B. Kimmel, Nature 360, 735
(1992).23. T. Yabe et al., PLoS Genet. 5, e1000518 (2009).24. E. W. Abrams, M. C. Mullins, Curr. Opin. Genet. Dev. 19,
396 (2009).25. C. B. Kimmel, R. M. Warga, T. F. Schilling, Development
108, 581 (1990).26. J. P. Trinkaus, J. Exp. Zool. 265, 258 (1993).27. X. M. Lu, J. M. Li, O. Elemento, S. Tavazoie,
E. F. Wieschaus, Development 136, 2101 (2009).28. We thank G. Lutfalla for pAct26H2B/mcherry,
pAct26mcherry-F DNA constructs, and transgenic fishlines. We thank P. Herbomel, C. Little, J.-L . Martin,H. Myllykallio, and J.-L. Rubio for critical reading of themanuscript. This work was supported by DirectionGénérale de l’Armament, Agence Nationale de laRecherche, FP6 New Emerging Science and Technologyprogram, Association pour le Recherche Contre le Cancer,Egide Picasso France-Spain, and Fondation Louis D.,Institut de France. Patent application PCT/FR2010/050173 describes the combination of conformalacquisition and beam conditioning in scanningmicroscopy of 3D objects.
Supporting Online Materialwww.sciencemag.org/cgi/content/full/329/5994/967/DC1Materials and MethodsFigs. S1 to S17ReferencesMovies S1 to S16
11 March 2010; accepted 7 July 201010.1126/science.1189428
www.sciencemag.org SCIENCE VOL 329 20 AUGUST 2010 971
REPORTS
on
Aug
ust 1
9, 2
010
ww
w.s
cien
cem
ag.o
rgD
ownl
oade
d fr
om