cdma in africa, bill hearmon - cdg.org · zte 6,000 sub nitel ewc, moto, huawei - trial ingwatel...
TRANSCRIPT


800 MHz Current Deployments
Cote d’Ivoire
Madagascar
MovicelMotorola
1,700 000
Angola
Deployments
CamTelHuawei
280,000 Sub
CameroonArobaseTelecom
Huawei
GVTTBA
Dem. Rep. of Congo
EthiopiaGhana
KasapaTelecomZTE
350, 000
TelmaHuawei
85,000 Sub
Nigeria
IntercellularMoto; Huawei140,000 Sub
Multi-LinksNortel
155,000 Sub
Intercellular200,000 Sub
MTS70,000 Sub
Rwanda
TerracomUTStarcomm; ZTE
40,000 Sub
Tanzania
TTCLHuawei100 Sub
Mauritius
MTML30,000 subs
MTNHuawei
30,000 Sub
Kenya
ETCHuawei; ZTE40,000 Sub
TDM
35,000 Sub
S.Africa
Mozambique
TelkomNamibia50 000
Namibia
NoetelHuawei
Uganda
TK
250,000Sub
Benin
BBCOM24,000 subs
TeleEgypt
600,000. Sub
EgyptLybia
3rd mobile70,000 Sub
Morocco
Chinguitel70,000 subs
Mauritania
Zambia
Zamel2 000
Mali
Brukina
Soltema
20,000 Sub
Sierra tel40,000 subs
Guinea
Onatel6,000 Sub
Sudan
Sudatel1900,000 Sub

1900 MHz Current Deployments
Nigeria
Deployments
Kenya
Telkom KenyaHuawei
80,000 Sub
StarcommsEricsson; Huawei
1000,000 Sub
Multi-LinksNortel
240,000 Sub
Rel-TelEricsson
440,000 Sub
NiTelEWC, Moto,
Huawei – Trial
Popote10,000 Sub
Algeria
Algeria Tel
1600,000 Sub
Pace GVT22,000 Sub
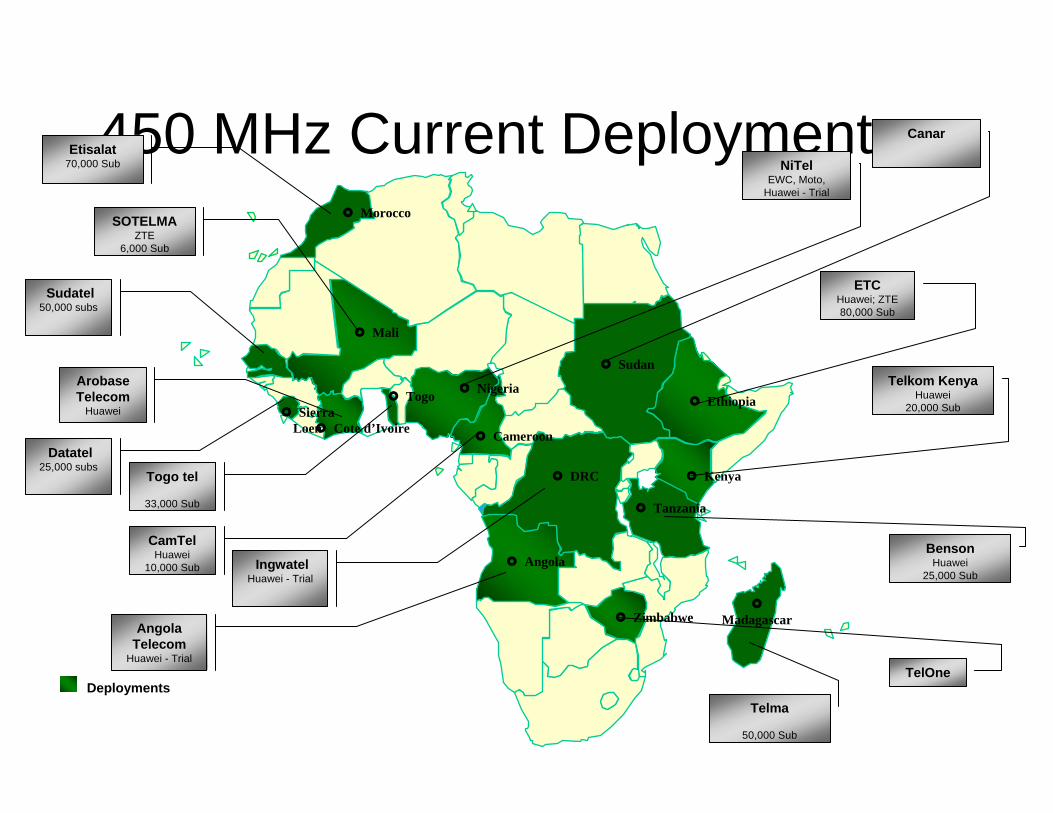
450 MHz Current Deployments
Angola
Nigeria
Zimbabwe
Ethiopia
TelOne
Angola Telecom
Huawei - Trial
CamTelHuawei
10,000 Sub
Cameroon
Deployments
Cote d’Ivoire
ArobaseTelecom
Huawei
ETCHuawei; ZTE80,000 Sub
Kenya
Telkom KenyaHuawei
20,000 Sub
Mali
SOTELMAZTE
6,000 Sub
NiTelEWC, Moto,
Huawei - Trial
IngwatelHuawei - Trial
DRC
BensonHuawei
25,000 Sub
Tanzania
Datatel25,000 subs
Sierra Loen
Telma
50,000 Sub
Madagascar
Togo
Togo tel
33,000 Sub
Morocco
Etisalat70,000 Sub
Sudatel50,000 subs
Sudan
Canar

Data Throughput ComparisonData Throughput Comparison
1 Assumes 4 time slots @ 12kbps per slot, 3/9 reuse, CS-3 coding scheme maximum (average C/I of 12dB)2 Source: "EDGE TECHNOLOGY: AN ASSESSMENT" QUALCOMM Internal Paper: Rao Yallapragada 3 Source: "Understanding the Capacity - Coverage Trade-off" Peter Muszynski, Senior Research Manager, Nokia Networks - The GSM World Congress 20004-6 QUALCOMM Simulations
(Average Throughput per Sector in 5 MHz)(Average Throughput per Sector in 5 MHz)Note:Assumes 100% loading of data trafficPedestrian Mobility
Average Throughput
Re-use
430 kbps
3/9
EDGE2
128 kbps
3/9
GPRS1
1/1
1,050 kbps
CDMA2000 1X4
1/1
900 kbps
WCDMA3
Base 3x7x 9x
19x 19x9x
28xRx Div
28xRx Div
35xRev A
1/1
2,400-3,600 kbps
HSDPA5
1/1
1xEV-DO6
2,400-4,500 kbps
Cost = Network Operations Expense + Depreciation on Capital
Spectral efficiency affects cost Spectral efficiency affects cost
GPRS$0.38
EDGE0.19
1X$0.06
1xEV-DO$0.02
WCDMA$0.09
Cost per Megabyte Comparison
EV-DO(Platinum)$0.005

Erlangs/Sector
Voice Capacity Comparison
Voice Capacity Comparison
(Erlangs per Sector in 5 MHz)(Erlangs per Sector in 5 MHz)2% GOS for all calculations
1 Source: “GSM AMR VOCODERS: FACTS ABOUT INCREASED VOICE CAPACITY” QUALCOMM Internal Paper: Rao Yallapragada2 Source: "WCDMA for UMTS" , Radio Access for Third Generation Mobile Communications, John Wiley & Sons, LTD., copyright 20003 Source: "The Rise of the 3G Empire", Deutsche Banc Alex Brown, September 20014 Source: "SMV Capacity Increases", Andy Dejaco (QUALCOMM) - reference: CDG-C11-2000-1016010, October 16, 2000. Assumes EVRC = 35users and 2dB power control factor 5 Source: "Further Capacity Improvements in CDMA Cellular Systems", QUALCOMM Inc, Roberto Padovani (Calculations based on 1% Blocking)
Note:Assumes 100% loading of voice traffic
Re-use
Users/Sector
TDMA15.8
23
7/21
5x
AMPS3.0
8
7/21
Base
CDMA2000 1x92.8 – 133.9
105-147
4
1/1
SMV1
SMV0,EVRC
SMV2
31x
39x
45x
1x Diversity
168-189
154.5 – 175.3
5
1/1
SMV0,EVRC
SMV1
52x
59x
GSM13.2 – 32.8
20 – 43
1
3/9 – 1/1
4xEFR
9xAMR 3/9
11x AMR 1/1
WCDMA51.5 – 83.1
62-95
AMRHalf Rate
2-3
1/1
17x
28x
AMRHalf Rate
AMRFull Rate
1/1
18x
cdmaOne52.5
63

African Markets Addressed with CDMABest practices analysis of CDMA work around the world
CDMA1x BreakevenARPU ~ $4
Per Capita GDP Available for Telephony /
Communications
Population or Potential Subscriber Base
GSM BreakevenARPU ~ $7
Market 1: New Subscribers Currently
Without Telephony
Market 2: High End Data Users
CDMA Potential in Africa: Low-Cost Telephony, and Data Services in 800 and 450MHz Frequency Bands

11
CDMA2000 is redefining the low tier handset category by adding data capabilities. The low tier is not just voice and SMS.
Low-End Wireless Handsets (< $US 35 Wholesale)CDMA now offers a larger selection of low-end devices from many suppliers
MotorolaC210
LGRD2330
KyoceraK112
Huawei C218
HaierD1000
JingPengSpektra 101
SamsungN 380
SamsungN500
CDMA 2000CDMA 2000
LGRD2670
22 low22 low--end handset models from 10 suppliersend handset models from 10 suppliers

IP Bearer Backbone
AC BRAS
GPRS/UMTSWiFi/WiMaxxDSL/LAN
PDSN
CDMA
GGSN
NGN/IMS CoreSession Control
TDM
TDM
FixedMobile InternetAccess
Bearer
Session
Application
…
…
…
Voice IPVoice
…IP
Applications
African operators need to leverage Paradigm shift Towards
Distributed Architecture
Goal is to move to a truly access agnostic core network in the future

Source: Michael Minges, TMG Telecom, and ITU World Telecommunications Database Statistics, 2003.
For each 1% increase in Mobile penetration, GDP per capita goes up by US$240
y = 23995xR2 = 0.6681
$100
$1,000
$10,000
$100,000
0.0% 20.0% 40.0% 60.0% 80.0% 100.0% 120.0%
Impact of Improving Telephony Connectivity
It is not just about Voice...It is not just about Voice...


y = 48948x + 103.27R2 = 0.7387
$100
$1,000
$10,000
$100,000
0.0% 0.1% 1.0% 10.0% 100.0%
Internet penetration, 2002
GD
P pe
r cap
ita, 2
002
Source: Michael Minges, TMG Telecom, and ITU World Telecommunications Database Statistics, 2003.
For each 1% increase in Internet penetration, GDP per capita goes up by US$593
Impact of Improving ConnectivityIt is about It is about voicevoice and and datadata……

Push to Talk
Photo Sharing
Entertainment
Music
NewsPosition Location
Multiplayer Gaming
Video Monitoring
Sports
• Non-voice Applications are Driving Wireless Growth
Beyond Voice is the World of Mobile Data
Growing Big TomatoesEssential Steps;
Great Payoffs


Push to Talk
Photo Sharing
Entertainment
Music
NewsPosition Location
Multiplayer Gaming
Video Monitoring
Sports
• Non-voice Applications are Driving Wireless Growth
Beyond Voice is the World of Mobile Data

