cdm opportunities in indonesia - pembina institute · cdm opportunities in indonesia ... cng –...
TRANSCRIPT

CDM OPPORTUNITIES IN INDONESIA
Prepared by:
Center for Research on Material and Energy
Institut Teknologi Bandung
Postal address: Jalan Ganesha 10, Bandung 40132, Indonesia
Tel: (62-22) 2501238; 2504558; Fax: (62-22) 2504558; e-mail: [email protected] or [email protected]
website: http://www.creitb.or.id
September 2001

Clean Development Mechanism Opportunities in Indonesia – September 2001
Center for Research on Energy, Institut Technology Bandung 2
Preface The Pembina Institute for Appropriate Development and the Tata Energy Research Institute have explored the application of the Clean Development Mechanism (CDM) in Asia through a series of publications and workshops, including:
• A background report on the CDM. • Country reports on CDM potential in four Asian countries. • A study on the potential role of Canadian industry in the CDM. • A North-South NGO perspective on the emerging CDM rules. • Workshops on the CDM for potential Canadian investors and technology providers as
well as potential Asian partners. For more information on this project visit the following web sites:
• www.teriin.org • www.pembina.org
The participants are working in collaboration with: The Bangladesh University of Engineering and Technology; The Global Climate Change Institute at Tsinghua University (China); and the Centre for Research on Material and Energy at the Technology University in Bandung, Indonesia.
This project is being undertaken with the financial support of the Government of Canada provided through the Canadian International Development Agency (CIDA)
The following country report was prepared by the Center for Research on Energy, Institut Teknologi, Bandung, Indonesia. The views expressed in this report are entirely those of the authors.
Team Leader: Dr. Tatang H. Soerawidjaja
Senior Adviser: Prof. Dr. Saswinadi Sasmojo
Members: Ir. Nasrullah Salim; Ir. Achmad P. Nugraha, M.Eng; Iwan Hendrawan, ST
Clean Development Mechanism Opportunities in Indonesia – September 2001
Center for Research on Energy, Institut Technology Bandung 3
Contents
1 INTRODUCTION ............................................................................................................. 5
2 GOVERNMENT STAND AND COUNTRY PREPAREDNESS WITH RESPECT TO THE CLEAN
DEVELOPMENT MECHANISM (CDM)............................................................................ 6 2.1 Climate change policy .............................................................................................6 2.2 Government and other Stakeholder Views on the CDM...........................................6 2.3 Recent Initiatives on CDM......................................................................................7
3 COUNTRY’S GHG EMISSIONS INVENTORY AND PROJECTIONS ..................................12
4 POTENTIAL MITIGATION OPTIONS..............................................................................15 4.1 Sector options ......................................................................................................15 4.2 Experience to date ................................................................................................18
5 PRIORITY PROJECTS FOR THE CDM...........................................................................20 5.1 Criteria for selection of CDM opportunities ...........................................................20 5.2 List of priority CDM projects ................................................................................20
6 REFERENCES ................................................................................................................ 27
Tables and Figures Table 3.1: Summary of the 1990 GHG emissions inventory of Indonesia................................12 Table 3.2: GHG emission inventory for the energy sector, top-down approach (Gg) ..............13 Table 3.3: GHG emission inventory for the energy sector, bottom-up analysis (Gg) ................13 Table 4.1: Technology options for greenhouse gas mitigation/abatement.................................17 Table 4.2: List of AIJ projects in Indonesia ...........................................................................18 Table 5.1: Potential identified CDM projects in Indonesia .....................................................21 Table 5.2: Bio-ethanol production from sugarcane, cassava, and yam....................................24 Figure 3.1: Projection of CO2 emissions by fuel type.............................................................13 Figure 3.2: Projection of GHG emissions by type, in CO2 equivalent .....................................14

Clean Development Mechanism Opportunities in Indonesia – September 2001
Center for Research on Energy, Institut Technology Bandung 4
Selected Abbreviations and Acronyms AIJ – Activities Implemented Jointly ALGAS – Asia Least-Cost Greenhouse Gas Abatement Strategy BOE – Barrels of Oil-Equivalent CDM – Clean Development Mechanism CERs – Certified Emissions Reductions CNG – Compressed Natural Gas COP – Conference of the Parties CRE – Center for Research on Energy GEF – Global Environment Facility Gg – Gigagrams (= kilotonnes) GHG – Greenhouse Gas(es) IBEKA – Institut Bisnis Dan Ekonomi Kerakyatan (The People Centered Economic and
Business Institute) INAGA – Indonesian Geothermal Association IPCC – Intergovernmental Panel on Climate Change IRES – Indonesian Renewable Energy Society NGO – Non-Governmental Organization TCE – Tonnes of Coal-Equivalent TOE – Tonnes of Oil-Equivalent UNDP – United Nations Development Programme UNFCCC – United Nations Framework Convention on Climate Change WB – World Bank YBUL – Yayasan Bina Usaha Lingkungan

Clean Development Mechanism Opportunities in Indonesia – September 2001
Center for Research on Energy, Institut Technology Bandung 5
1 Introduction
The Clean Development Mechanism (CDM) is one of the instruments set up by the 1997
Kyoto Protocol to the United Nations Framework Convention on Climate Change (UNFCCC),
to allow industrialized countries and countries with economies in transition, collectively known as
Annex I countries, to gain credit for greenhouse gas (GHG) emission reductions achieved through
projects undertaken abroad. As defined by Article 12 of the Protocol, the CDM has two
purposes: to assist Annex I countries in complying with their Kyoto commitments, and to help
non-Annex I countries achieve sustainable development. Thus, under the CDM, an Annex I
country or private company may engage in projects in non-Annex I countries that reduce
emissions of GHGs and help non-Annex I countries achieve sustainable development. The
certified emissions reductions (CERs) generated through CDM projects may be used by Annex I
countries to help them meet their Kyoto commitments.
Even though the sixth Conference of the Parties (COP 6) in The Hague, Netherlands, 13-
24 November 2000 failed to decide the interim rules of the CDM, many parties and stakeholders
believe that the CDM could be an effective tool to start the transition towards truly sustainable
energy systems and that some agreements will, therefore, be achieved in the not-too-distant
future. Consequently, developing countries should be prepared to participate properly in the
CDM and, when the time comes, to take advantage of CDM projects in their own countries. This
step will allow them to gain a sense of contributing to the global achievement of sustainable
development as well as giving them a real economic return.
This report provides information for potential investors in developed countries to assess
CDM opportunities in Indonesia by analyzing the country preparedness to implement the CDM
and proposing a set of projects that would most likely be accepted by the Government of
Indonesia and other stakeholders in the country. The report describes the attitudes of the
government and other stakeholders towards the CDM, as well as the country’s emission
inventories and projections. Subsequently, it reviews potential mitigation options within the
country, including the experience to date in undertaking international climate change mitigation
projects. The final chapter identifies a set of potential CDM projects and presents a brief
evaluation of each project.

Clean Development Mechanism Opportunities in Indonesia – September 2001
Center for Research on Energy, Institut Technology Bandung 6
2 Government Stand and Country Preparedness with Respect to the Clean Development Mechanism (CDM)
2.1 Climate change policy
The Government of Indonesia is a signatory to the United Nations Framework
Convention on Climate Change (UNFCCC) and ratified the Convention on August 1, 1994 (Act.
no. 6, 1994, on the ratification of the UNFCCC). The Ministry of Environment is the nodal
ministry for coordinating the Climate Change Policy. To oversee the implementation of its
obligations under the Convention, provide inputs to policy formulation on climate change, and
enlarge feedback mechanisms, the government has set up a consultative committee—the National
Committee on Climate Change—whose members include representatives from various ministries
and government agencies.
Recognizing that climate change is caused primarily by the excessive use of fossil fuels, the
government has announced five initiatives as follow-up to UNFCCC ratification:
• Promoting the utilization of renewable energy;
• Promoting the utilization of clean energy and energy-efficient technology in industrial and commercial sectors;
• Promoting the efficient use of energy;
• Gradually eliminating energy market distortions through stepwise removal of various subsidies; and
• Restructuring the energy sector to allow more participation of private entities.
2.2 Government and other stakeholder views on the CDM
Although the Government of Indonesia is a signatory to the Kyoto Protocol, the country’s
economic and socio-political crisis during 1997-1999 meant that meaningful follow-up actions
related to the Protocol have been considerably delayed. Thus, despite being an active participant
in all COPs and other UNFCCC meetings, the Indonesian authority has not yet fixed formal
policies or national criteria, nor has it prioritized sectors with respect to the CDM. Government’s
approach to the issue seems to be cautious, implying that national CDM set-up would have to
wait until controversial issues surrounding the CDM are resolved. Nevertheless, through funding
and technical assistance from the German development agency GTZ and the World Bank, a

Clean Development Mechanism Opportunities in Indonesia – September 2001
Center for Research on Energy, Institut Technology Bandung 7
national task force for “Indonesia National Strategy Study on CDM” was established in February
2000 to advise the government on Indonesia’s negotiating position on the CDM, benefits that
could be gained from hosting CDM projects, CDM potential in the country, and policies and
institutions required to participate effectively and efficiently in the CDM. Through several
workshops and roundtable discussions, the task force has gathered input from various
stakeholders in the country. The major opinions that have arisen from those activities include the
following:
♦ Neither public institutions nor private sector entities are allowed to sign agreements and execute implementation of CDM projects before the rules and modalities for the CDM are internationally agreed to.
♦ Renewable energy generation should become a strong focus of CDM.
♦ Sinks and nuclear energy projects must not be included in CDM.
♦ CDM activities must include national capacity building and technology transfer.
♦ A pilot phase must precede any CDM project.
♦ AIJ (Activities Implemented Jointly) projects could later become CDM projects.
♦ Baselines should be determined on a case-by-case basis.
In view of the above, the statement made at COP 6 by Indonesia’s Minister of Environment as
Head of the Indonesian Delegation has been questioned by many stakeholders in the country, for
it indicated that Indonesia would accept sinks in the CDM.
2.3 Recent initiatives on CDM
To respond to the Kyoto Protocol, particularly to the CDM component, various activities
such as seminars and roundtable discussions have been conducted by government organizations,
NGOs, and industrial and professional associations. These activities were initiated individually by
each stakeholder and/or through collaboration between them.
These multi-stakeholder initiatives have created a better understanding of the CDM and
how it relates to global environmental issues as well as opportunities for capacity building at the
national, community and individual levels.
Various stakeholders hold different points of views about CDM. However, they share the
same view of the CDM objectives: (a) to reduce GHG emissions, and (b) to create sustainable
development.
Clean Development Mechanism Opportunities in Indonesia – September 2001
Center for Research on Energy, Institut Technology Bandung 8
From the government’s point of view, as reported in National Strategic Studies, possible
CDM project activity would come mainly from energy sectors, followed by forestry “sink”
projects. Stakeholders share similar views about undertaking CDM projects but specific criteria
for implementation are still under debate. Because AIJ projects are not intended to gain CERs, all
AIJ projects except a new cooling system for cement clinker plants can be nominated as potential
CDM projects.
Several stakeholders have been asked to propose CDM project opportunities. Most of
these projects are from the energy sector. The stakeholders include the Center for Research on
Energy ITB, Pelangi, Yayasan Bina Usaha Lingkungan, Indonesian Renewable Energy Society,
Indonesian Geothermal Association, the People Centered Economic and Business Institute
(Institut Bisnis Dan Ekonomi Kerakyatan - IBEKA) and other institutions.
Center for Research on Material and Energy, Institut Teknologi Bandung
The Center for Research on Material and Energy of the Institut Teknologi Bandung,
abbreviated as PPE ITB (Pusat Penelitian Energi, Institut Teknologi Bandung), is a research
center under The Institute for Research ITB. The Center’s major area of activity is to carry out
studies on energy, material, and mineral resources, focusing on the study and development of
planning methodologies, policy analysis studies, technology implementation studies and
development of an information base for transfer and exchange processes that include publications,
training, and conferences.
The mission of the Center for Research on Energy (CRE) is to lead a national effort to
develop innovative, market-driven new energy for producing fuels and chemicals from renewable
resources. The Center works in close cooperation with industry on these activities.
The vision of the Center is to be recognized as an international leader in developing
biologically-based technologies for the production of renewable transportation fuels and related
products. As a result of the Center’s work and leadership, new Indonesian businesses will be
established that will improve the environment and reduce Indonesian dependence on imported
petroleum.
Goals:

Clean Development Mechanism Opportunities in Indonesia – September 2001
Center for Research on Energy, Institut Technology Bandung 9
• Facilitate the development and use of renewable fuels and chemicals through the application of renewable energy.
• Work with government laboratories, universities, and industry to insure that innovative and cost effective solar energy to fuels, chemicals, and materials technologies are evaluated, developed, and commercialized.
• Provide technical support to DOE to insure success of their fuels, bio-based products and energy programs.
• Heighten the awareness of decision-makers in both government and industry about the advantages of energy technologies in addressing economic development and environmental and energy problems.
• Build a scientific and engineering infrastructure within the Center for Research on Energy while helping to develop and expand the capabilities of the research staff
PELANGI
Pelangi (which means, literally, “rainbow”) was established in 1990. Today in 2001,
Pelangi has established its superb role as a respectable policy research institution rooted in the
NGO community. Pelangi houses the best possible human resources that an NGO can have.
The network of experts to whom Pelangi has easy access is similarly impressive. Those
who helped found Pelangi currently hold top management positions in various influential
institutions, or are in the process of acquiring higher academic degrees. The experts who once
undertook some of Pelangi’s research are still readily available on call. Although the government
has been constantly in limbo, Pelangi’s contact with key bureaucracies remains strong. Indeed,
the 1970s is characterized as the era of developmental groups, the 1980s as the era of
environmental and advocacy groups, and the 1990s as the era of policy research and think tank
groups. The next decade will most likely be the era of public policy influence and lobbying. With
its ample resources as a research institution—highly educated staff and associates, a wide
network of experts available on call, and close relationships with decision-makers—Pelangi
strives to demonstrate its best in advancing high quality research products and policy
recommendations.
Yayasan Bina Usaha Lingkungan
Formed in 1993 as an NGO working on environmental issues, Yayasan Bina Usaha
Lingkungan (YBUL) has focused on increasing private sector participation in the development of

Clean Development Mechanism Opportunities in Indonesia – September 2001
Center for Research on Energy, Institut Technology Bandung 10
environmental business in Indonesia. YBUL is active in six sectors: renewable energy, energy
efficiency, sustainable agriculture and forestry, eco-tourism, pollution mitigation, and recycling.
YBUL is committed to establishing itself as an independent, professional and innovative
organization that will continue to play an active role in the development of environmental business.
This organization is also working on programs aimed at improving environmental awareness within
the business community, and continuing to raise the level of concern within the global community.
Indonesian Renewable Energy Society
The Indonesian Renewable Energy Society (IRES) is a group of people interested in the
development of renewable energy. The vision of this society is to be an effective vehicle
supporting renewable energy development to meet energy demand sustainably.
The objectives of IRES are: (a) to play a bridging role in communication, consulting, and
collaboration among stakeholders or IRES members, and (b) to accelerate the role of renewable
energy in meeting national energy supply.
The Indonesian Geothermal Associa tion
The Indonesian Geothermal Association (INAGA) is a group of geothermal experts and
persons interested in the development and utilization of Indonesian geothermal energy.
The objectives of INAGA are:
1. to support the policy of the Government to expand the development of geothermal energy in the framework of increasing the state’s revenues;
2. to assist the Government in the expansion of geothermal industry in general and geothermal technology in its broadest sense;
3. to promote activities of geothermal industry in Indonesia;
4. to unite entrepreneurs in the geothermal sector with experts who have the potentialities related to geothermal industry to improve the views, capabilities, and proficiency of its members, and to foster the feeling of familial relationship of its members; and
5. to establish and develop cooperation that is mutually beneficial in attempting the expansion of the geothermal industry by means of mutually making the best of information, infrastructure, and means, or other methods that support the achievement of the objectives within the country and abroad.

Clean Development Mechanism Opportunities in Indonesia – September 2001
Center for Research on Energy, Institut Technology Bandung 11
The People Centered Economic and Business Institute (Institut Bisnis Dan Ekonomi Kerakyatan)
The People Centered Economic and Business Institute’s (IBEKA) main objective is to
work with villagers to establish an environment more conducive to the growth of a people-
centered economic system in their area. It assists community development by improving and
promoting entrepreneurship to enhance the economic system and infrastructure, particularly by
implementation of appropriate technology in the villagers’ daily activities.
IBEKA has three main activities: (1) planning, engineering and constructing micro hydro
power plants (MHP) in many provinces of Indonesia; (2) planning, engineering, and constructing
water supply systems for villages; and (3) assisting with palm sugar distribution through a “mutual
business system.” It also gives MHP training courses and drinking water pumping system
seminars.

Clean Development Mechanism Opportunities in Indonesia – September 2001
Center for Research on Energy, Institut Technology Bandung 12
3 Country’s GHG Emissions Inventory and Projections
Based on the status of energy use and forestry and agricultural activities in 1990, and
following the IPCC guidelines on national GHG inventories, estimates were made for 1990 on
GHG emissions for Indonesia (Table 3.1).
Table 3.1: Summary of the 1990 GHG emissions inventory of Indonesia Sources and Sinks Emission (Gg)
CO2 Emission
CO2 Removal
Net CO 2 C H4 N2O NO X CO CO2 Equivalent
Total (Net) National Emission
1 All Energy (Fuel Combustion + Fugitive) 140,396.40 0.00 140,396.40 213.19 2.52 312.84 28.80 146,426.64
A Fuel Combustion 140,396.40 0.00 140,396.40 2.42 2.52 312.84 28.80 141,262.77
1 Energy and Transformation Industries 53,501.32 - 53,501.32 0.19 0.08 250.43 13.81 53,531.50
2 Industry 32,073.94 - 32,073.94 0.87 2.44 47.85 11.02 32,876.06
3 Transport 34,917.64 - 34,917.64 - - 0.26 0.35 34,918.39
4 Small Combustion in Residential and Commercial 19,903.50 - 19,903.50 1.36 - 14.30 3.62 19,936.82
5 Traditional biomass burned for energy 98,662.70 - 98,662.70 533.75 3.67 132.63 - 112,913.97
B Fugitive Fuel Emissions - - - 210.77 - - - 5,163.87
1 Solid Fuel - - - 32.61 - - - 798.95
2 Oil and Natural Gas - - - 178.16 - - - 4,364.92
2 Industrial Processes 17,843.77 - 17,843.77 - - - - 17,843.77
3 Agriculture - - - 3,387.52 13.53 1,071.00 30.96 75,332.22
A Livestock - - - 798.39 - - - 16,766.19
B Rice field - - - 2,543.00 - - - 53,403.00
C Agricultural Soils - - - - 12.67 - - 3,927.70
D Prescribed Burning Savanna - - - 19.52 0.24 512.00 8.74 484.32
E Burning of Agricultural Residue - - - 26.61 0.62 559.00 22.22 751.01
4 Land Use Change and Forestry 26,846.59 686,490.63 (347,042.57) 524.74 3.61 4,591.51 130.39 (334,903.93)
A Changes in Forest and other Woody Biomass Stocks
26,846.59 575,390.63 (548,544.04) - - - - (548,544.04)
B Forest and Grassland Conversion 312,601.47 - 312,601.47 524.74 3.61 4,591.51 130.39 324,740.11
C Abandonment of Managed Lands - 111,100.00 (111,100.00) - - - - (111,100.00)
5 Waste/Landfill - - - 287.59 - - - 6,039.39
INDONESIA 185,086.76 686,490.63 (188,802.40) 4,413.04 19.66 5,975.35 190.15 (89,261.91)
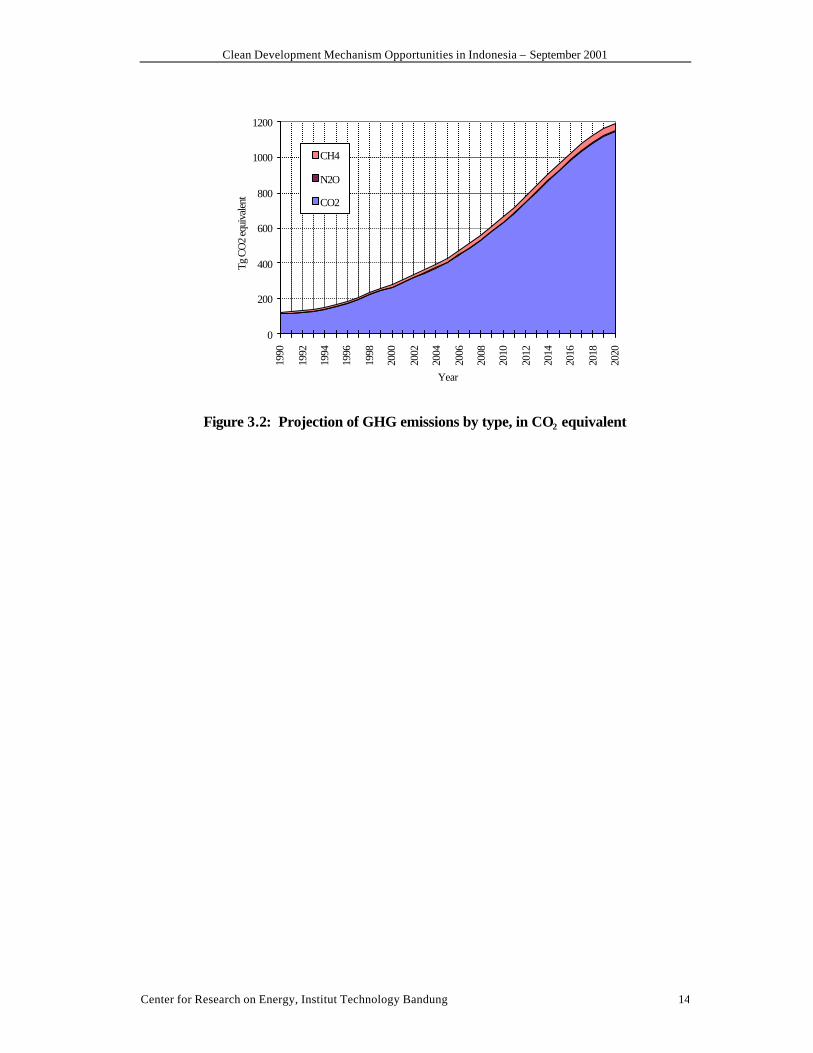
A breakdown of the emission inventory for 1990 is given in Tables 3.2 and 3.3. The projected
baseline emission (i.e., when there is no particular mitigation initiative is undertaken) is given in
Figure 3.1 and Figure 3.2.

Clean Development Mechanism Opportunities in Indonesia – September 2001
Center for Research on Energy, Institut Technology Bandung 13
Table 3.2: GHG emission inventory for the energy sector, top-down approach (Gg)
GHG sources CO2 % of total CO2
Coal 17,477.39 11.70% Oil 123,203.71 82.49% Gas 8,682.62 5.81% Total 149,363.72 100% Biomass 98,662.70
Table 3.3: GHG emission inventory for the energy sector, bottom-up analysis (Gg)
GHG Sources CO2 CH4 N2O NOX CO CO2 % of total
Emission Equivalent CO2 Equiv.
1 Fuel Combustion 140,396.4 2.39 2.5 312.8 28.8 145,655.3 89%
a Energy and Transformation Industries 53,501.3 0.2 0.1 250.4 13.8 53,530.0 33%
- Electricity and Heat Production 22,184.6 0.1 0.08 113.0 4.1 22,212.1 14%
- Petroleum Refining 9,831.2 0.002 0.00001 4.7 0.3 9,831.2 6%
- Solid Fuel Transformation and other Energy Industries
21,485.5 0.05 0.0006 132.7 9.4 21,486.7 13%
b Industry 32,073.9 0.9 2.4 47.9 11.0 32,848.6 20%
c Transport 34,917.6 0.005 0.002 0.3 0.4 34,918.4 21%
d Small Combustion in Residential and Commercial 19,903.5 1.4 - 14.3 3.6 19,932.1 12%
2 Fugitive Fuel Emissions Fuels - 210.8 - - - 4,426.2 3%
a Solid Fuel - 32.6 - - - 684.8 0%
b Oil and Natural Gas - 178.2 - - - 3,741.4 2%
3 Industrial Processes 17,843.8 0.0 0.0 0.0 0.0 17,843.8 11%
Total 158,240.2 213.2 2.5 312.8 28.8 167,925.3 100%
0
200
400
600
800
1000
1200
1400
1990
1992
1994
1996
1998
2000
2002
2004
2006
2008
2010
2012
2014
2016
2018
2020
Year
Tg
CO
2
Nat. gas
Coal
Oil
Figure 3.1: Projection of CO2 emissions by fuel type
Clean Development Mechanism Opportunities in Indonesia – September 2001
Center for Research on Energy, Institut Technology Bandung 14
0
200
400
600
800
1000
1200
1990
1992
1994
1996
1998
2000
2002
2004
2006
2008
2010
2012
2014
2016
2018
2020
Year
Tg C
O2
equi
vale
nt
CH4
N2O
CO2
Figure 3.2: Projection of GHG emissions by type, in CO2 equivalent

Clean Development Mechanism Opportunities in Indonesia – September 2001
Center for Research on Energy, Institut Technology Bandung 15
4 Potential Mitigation Options
4.1 Sector options
From a technological point of view, GHG emission reductions can be achieved through:
(a) Energy efficiency and conservation measures and practices, namely through better energy
housekeeping practices and by the deployment and functioning of more efficient energy
technological systems;
(b) Shifting the energy mix towards higher shares of lower or zero GHG emitting fuels—for
example, fuels having low C/H ratios, or zero carbon content, such as hydrogen; and
(c) Increasing the deployment of renewable, or near-renewable, energy technology systems, such
as solar photovoltaic, solar thermal, water turbines for mechanical energy and power
generation, wind turbines, geothermal base heat supply and power generation, biomass-based
systems, waves and ocean thermal energy conversion system, etc.
In identifying which technological systems have better opportunities to reduce GHG
emissions, a study was done in the ALGAS project (1) that produced a list of proposed priority
technological systems (see Table 4.1).
The list was produced by first scanning possible technological systems, many of which
have mitigative effects in the demand and supply sectors that are major contributors of GHG
emissions—namely the household, industry, power generation, and transportation sectors. These
technological systems were then ordered according to their economic attractiveness. The ordered
set was screened by applying qualitative criteria that are considered to be critical for the choice of
technology, such as the level of investment needed, operational accident risks, and scarcity of
natural resources.
The economic attractiveness of each technology was determined by estimating the
incremental costs of the particular technology with respect to a selected reference technology—
that is, one that is already in place to deliver the same function.
It must be pointed out that energy efficiency and conservation through better
housekeeping and retrofit, although not listed in Table 5, are to be included as major undertakings
that have to be pursued in realizing GHG emission reduction initiatives, as such undertakings will

Clean Development Mechanism Opportunities in Indonesia – September 2001
Center for Research on Energy, Institut Technology Bandung 16
result in a win-win situation. A policy climate to support such undertakings has to be established.
The most important one is the removal of subsidized prices for petroleum products and electricity.
Since April 2000, the government has taken steps to gradually accelerate schemes for the
removal of those subsidies. Subsidies on most refinery products have been removed and
electricity tariffs have been increased to reduce the subsidy to these sectors.

Clean Development Mechanism Opportunities in Indonesia – September 2001
Center for Research on Energy, Institut Technology Bandung 17
Table 4.1: Technology options for greenhouse gas mitigation/abatement
No. Sector and category Technology Options Base case or Reference Technology
GHG reduction potential, kg CO2 eq./MWh
Incremental cost per unit output, US$/MWh
Incremental cost per reduced GHG, US$/kg
1. Home water heating technology
w Solar Water Heater LPG-fired water heater 1250 -22 -0.018
2. w Combustion-Air Preheat No air-preheating 133 -1.38 -0.010
w Flue gas utilization for micro algae cultivation
Release to the atmosphere 1000 50 0.050
Add-on and end-of-pipe technology for fired furnaces
w CO2 recovery and disposal to reservoir Release to the atmosphere 1000 50 0.050
3. w Geothermal Power Plant Pulv. coal power plant 946 -27.69 -0.029
w Micro/small hydropower plant Pulv. coal power plant 1000 -24.15 -0.024
w Biomass Cogeneration Power Plant Pulv. coal power plant 1000 -10.12 -0.010
w Gas-Fired Combined-Cycle Plant Pulv. coal power plant 550.4 -4.53 -0.008
w IGCC* Power Plant Pulv. coal power plant 61.5 6.73 0.11
Improved technology for power generation
w Solar Photovoltaic Power Plant Pulv. coal power plant 1000 149.39 (-24.74)** 0.15 (-0.025)**
4. w Ethanol Vehicles Gasoline car 1693.6 45 0.0266
w Electric Cars Gasoline car 967.8 151 0.156
w Fuel Cell Vehicles Gasoline car 2080.7 450 0.216
Improved technology for road transport systems
w Compressed Natural Gas Vehicles Gasoline car 483.9 120 0.248 * Integrated (Coal) Gasification Combined-Cycle. ** parenthetical values are predicted costs after 2005

Clean Development Mechanism Opportunities in Indonesia – September 2001
Center for Research on Energy, Institut Technology Bandung 18
4.2 Experience to date
Quite a number of climate change mitigation projects have been undertaken, some funded
by the GEF, others within the realm of the AIJ scheme. Table 4.2 lists completed activities, as
well as those that are in progress or still at the proposal stage.
Table 4.2: List of AIJ projects in Indonesia
Project title and description
GHG abatement target
Energy saving Status Complementary Funding
100 tonnes/day paper sludge and sol id waste incinerator-steam boiler unit at Fajar Surya Wisesa Ltd., Bekasi, West Java.
91 Gg/yr CO2 equivalent.
9000 TOE/yr for 16.8 tonnes per hour steam production
Procurement NEDO
Cement clinker cooling system at PT Semen Cibinong, Narogong, West Java.
52 Gg/yr CO2 equivalent.
418 MJ/tonne of clinker
Engineering design
NEDO
159 kWh/day hybrid power generation system (PV-micro hydro-wind turbine) for rural electrification at Waimena, West Irian.
0.086 Gg/yr CO2 equivalent.
- September 1998: Completed and functioning.
Australia
175 units of 10 kW Solar Home System, 3 mini hydro units of 130 kW each, 2 units of 32 kW hybrid system at East Nusa Tenggara.
1.23 Gg/yr CO2 equivalent.
- Under construction
WB/E-7
Solid waste and wastewater treatment and utilization at 200 tonnes/day tapioca starch plant at Ponorogo, East Java.
not available - Feasibility study completed
NEDO
Heat recovery unit at PLN Suralaya Power Plant, West Java.
30,000 Gg/yr CO2 equivalent
9.5 million tonnes/yr coal drying
Submission of application to conduct feasibility study
?
Heat recovery unit at PTBA power plant, Tanjung enim, South Sumatera.
2000 Gg/yr CO2 equivalent.
0.7 million tonnes/yr coal drying
Submission of application to conduct feasibility study
?
40 tonnes/day solar desalination unit at Tanjung Priok, Jakarta.
0.8 Gg/yr CO2 equivalent
- Preparatory activity and data collection
Denmark
CNG for transport (36 fueling stations and 10,000 conversion kits) at 8 major cities
Not available Submission of proposal
?

Clean Development Mechanism Opportunities in Indonesia – September 2001
Center for Research on Energy, Institut Technology Bandung 19
Except for two projects listed in Table 4.2—the third (in Irian Jaya) and the fourth (in
East Nusa Tenggara)—all AIJ projects are undertaken with the participation of private
enterprises. However, initiatives to undertake the AIJ projects came mostly from the
corresponding donor agencies.
The GEF/SGP activities have been carried out in a sequence of three phases: pilot phase,
phase I and phase II. The pilot phase and the phase I activities have been completed, and phase
II is just commencing. The pilot phase covers 21 projects, none of which are climate-change
related (that is, all the projects deal with biodiversity). Of the 62 projects being undertaken in
phase II, only 6% deal with climate change; the rest deal with biodiversity (82%), multiple focal
areas (10%), and international waters (2%).
The GEF/SGP activities are handled and administered by a national committee
commissioned by the UNDP with the concurrence of the government of Indonesia. It operates
under the UNDP operation in Indonesia, in collaboration with Yayasan Bina Usaha Lingkungan, a
foundation that promotes and provides financing support to small and medium sized business
enterprises that are environmentally oriented. So far, only NGOs are eligible to submit proposals
and undertake GEF/SGP activitie s; the participation of university research centers is currently
under consideration.
As a general observation, efforts to promote and initiate GEF and AIJ projects have been
far from adequate, leading to poor information dissemination and consequent lack of awareness,
not only among the business community, but also among government agencies.

Clean Development Mechanism Opportunities in Indonesia – September 2001
Center for Research on Energy, Institut Technology Bandung 20
5 Priority Projects for the CDM
5.1 Criteria for selection of CDM opportunities
The energy sector in Indonesia, particularly oil and gas, has been a dominant factor in the
overall economic development of the country. In addition to providing for domestic energy needs,
oil and gas exports contribute significantly to government income and to generation of foreign
exchange revenue. It should be noted, however, that the role of the oil sector in securing foreign
exchange revenue will soon be declining, because of (a) the increase in domestic oil consumption,
and (b) oil resource constraints. Present estimates indicate that if no prudent policy measures are
implemented, Indonesia may become a net oil importing country in 2010.
For the past 25 years, the energy supply mix has been dominated by oil, and this is
expected to continue into the immediate future. In absolute terms the domestic consumption of oil
is increasing, but the percentage share is slowly declining. The share of natural gas and coal is
starting to pick up rapidly, particularly in the industrial and power sectors. In future, coal is
expected to be the dominant component of the energy supply mix. The exploitation of geothermal
energy resources for power generation can also be expected to emerge; an appropriate policy
climate is still to be developed. Among the countries endowed with geothermal energy resources,
Indonesia ranks second or third in terms of resource availability.
In the demand sectors, the consumption pattern has shifted considerably from the
household sector to the industry and transport sectors. Energy demand in the transport sector is
rising fastest.
5.2 List of priority CDM projects
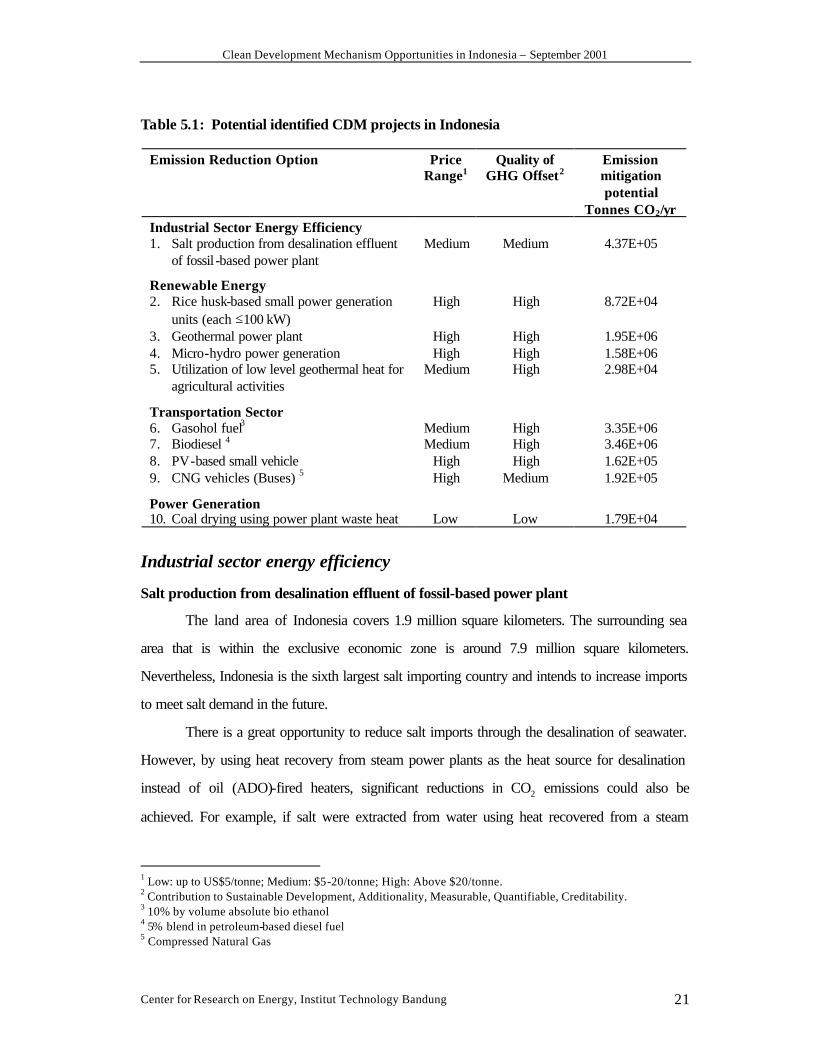
At least, ten projects have been identified as potential CDM projects, mainly in the
energy sector. These projects will cover energy efficiency in the industrial, renewable energy,
transportation, and power generation sectors. Table 5.1 summarizes potential CDM projects.
Clean Development Mechanism Opportunities in Indonesia – September 2001
Center for Research on Energy, Institut Technology Bandung 21
Table 5.1: Potential identified CDM projects in Indonesia
Emission Reduction Option Price Range1
Quality of GHG Offset2
Emission mitigation potential
Tonnes CO2/yr Industrial Sector Energy Efficiency 1. Salt production from desalination effluent
of fossil -based power plant Medium Medium 4.37E+05
Renewable Energy
2. Rice husk-based small power generation units (each ≤100 kW)
High High 8.72E+04
3. Geothermal power plant High High 1.95E+06 4. Micro-hydro power generation High High 1.58E+06 5. Utilization of low level geothermal heat for
agricultural activities Medium High 2.98E+04
Transportation Sector
6. Gasohol fuel3 Medium High 3.35E+06 7. Biodiesel 4 Medium High 3.46E+06 8. PV-based small vehicle High High 1.62E+05 9. CNG vehicles (Buses) 5 High Medium 1.92E+05
Power Generation
10. Coal drying using power plant waste heat Low Low 1.79E+04
Industrial sector energy efficiency
Salt production from desalination effluent of fossil-based power plant
The land area of Indonesia covers 1.9 million square kilometers. The surrounding sea
area that is within the exclusive economic zone is around 7.9 million square kilometers.
Nevertheless, Indonesia is the sixth largest salt importing country and intends to increase imports
to meet salt demand in the future.
There is a great opportunity to reduce salt imports through the desalination of seawater.
However, by using heat recovery from steam power plants as the heat source for desalination
instead of oil (ADO)-fired heaters, significant reductions in CO2 emissions could also be
achieved. For example, if salt were extracted from water using heat recovered from a steam
1 Low: up to US$5/tonne; Medium: $5-20/tonne; High: Above $20/tonne. 2 Contribution to Sustainable Development, Additionality, Measurable, Quantifiable, Creditability. 3 10% by volume absolute bio ethanol 4 5% blend in petroleum-based diesel fuel 5 Compressed Natural Gas

Clean Development Mechanism Opportunities in Indonesia – September 2001
Center for Research on Energy, Institut Technology Bandung 22
power plant in Suralaya instead of using an oil-fired heater, 161 million liters of oil would be
saved and emissions reduced by 0.44 million tonnes of CO2 a year.
Renewable Energy
Rice husk-based small power generation units (each ≤≤100 kW)
As an agricultural country, Indonesia produces a large amount of rice-husk waste. Rice-
husk gasifiers have been installed mainly as pilot projects. Several problems occurred during
operation, pointing out both technical and economic barriers. For example, lack of experienced
technicians meant that plant operations were frequently disturbed and, in some cases, the plants
became inoperable.
Although the direction of national development has moved from agriculture to industry,
food production (i.e., rice) still has a major role in meeting domestic consumption needs.
According to the Center for Research on Energy (1992), 1990 rice production was 36.63 million
tonnes, yielding about 8.85 million tonnes of rice husk. Therefore, rice husk-based small
generation will benefit local people by providing electricity for milling their rice and it will also
reduce emissions.
If diesel power generation is assumed to be the baseline for national electricity planning,
and if a rice-husk gasifier project were implemented with approximately 100 units of 100 KW
installed capacity, this project would reduce emissions by about 87 kilotonnes of CO2 per year
and would save 32.2 million liters of diesel oil per year.
Geothermal power plant Indonesia has the world’s largest share of geothermal energy reserves (about 40%), only
2% of which have been developed to generate electricity.
Although geothermal energy is considered a priority power source in Indonesia, it has
faced problems and obstacles in terms of electricity pricing, and has become more difficult to
develop since the recent economic crisis.

Clean Development Mechanism Opportunities in Indonesia – September 2001
Center for Research on Energy, Institut Technology Bandung 23
The CDM could potentially eliminate barriers to implementing geothermal power plants in
Indonesia. For example, a benefit of emissions trading could be reduced electricity prices for
geothermal, enabling it to compete effectively with other electricity sources
A CDM project consisting of six units of 155 MW installed geothermal capacity would
represent only 2.2% of known geothermal potential (42.6 GW). However, taking coal power
generation as the baseline power source, geothermal power plants could potentially reduce
emissions by 1.95 million tonnes of CO2 per year.
Micro-hydro power generation
Indonesia is endowed with sizable energy resources, including oil, natural gas, coal,
hydropower, geothermal, biomass, and a variety of less important renewable energy resources
such as wind, ocean thermal, wave and tidal energy.
According to DGEED, micro-hydro power potential amounts to 7,500 MW, excluding
large hydro dams. A micro-hydro CDM project consisting of 5,000 units of 100 KW each would
contribute about 3% to household electrification, reducing annual emissions by 1.58 million tonnes
of CO2 and affecting 900,000 households.
As well as its household electrification benefits, micro-hydro generation also supports
rural community development.
Utilization of low-level geothermal heat for agricultural activities
Use of a small geothermal heat plant for producing and processing agriculture products in
Indonesia has been implemented on a pilot scale. Collaboration between the Agency of
Technology Assessment and Application (BPPT) and Industry Engineering Co. (REKIN)
promoted the project entitled “Direct Use of Small Geothermal Plant in Pangalengan, Bandung.”
The project is being evaluated for its potential to provide heat for local farmers to use in growing
mushrooms, tea, and seedling potatoes.
A three-unit CDM project would reduce annual emissions by about 30 kilotonnes of
CO2.

Clean Development Mechanism Opportunities in Indonesia – September 2001
Center for Research on Energy, Institut Technology Bandung 24
Transportation Sector
Bio-ethanol (gasohol) fuel
Bio-ethanol blended with gasoline (gasohol) is used as a fuel in several countries. Bio-
ethanol is often labeled a “green” fuel with zero emissions due to its derivation from renewable
resources. As a tropical country, Indonesia has plenty of agricultural land and almost any plant
can grow in most of the country. At least three plants are regarded as having the most potential
for bio-ethanol products—sugarcane, cassava, and yam. Sugarcane has been used as a source of
bio-ethanol since the 1970s in Brazil and the United States.
Yam has been identified as a good source of bio-ethanol, yielding 7,812 liters per hectare
per year. Table 5.2 compares bio-ethanol production from sugarcane, cassava, and yam.
Table 5.2: Bio-ethanol production from sugarcane, cassava, and yam
Sources Harvesting yields Ethanol yields (tonnes/ha/yr) l/tonne l/ha/year
Sugarcane 75 67 5025 Cassava 25 180 4500 Yam 62.5 125 7812
Source: Soerawidjaja, 1999
If 5% of the predicted 2005 gasoline demand of 9 billion liters is filled by bio-ethanol
from yam, and if a bio-ethanol plant produces 5 million liters, then approximately 136 units of bio-
ethanol plants will be needed to meet this demand. This project would reduce greenhouse gas
emissions by 1.67 million tonnes of CO2 a year.
Bio-diesel
Bio-diesel is a fuel oil derived from plants and is combustible in a diesel engine. Sources
include palm and oilseed oils. Liquid fuel for the transportation sector is one of the major
concerns in Indonesia. In 1999, fuel consumption of the transportation sector was 51% of total oil
consumption, amounting to 299 million BOE. Increased fuel consumption can have harmful
environmental effects and some studies indicate that five large cities in Indonesia may be at a
critical point in terms of their ambient air quality. Shifting to greener fuels (i.e., bio fuels) and
improving road transport management are important options in an emission mitigation strategy.

Clean Development Mechanism Opportunities in Indonesia – September 2001
Center for Research on Energy, Institut Technology Bandung 25
If 5% of the 25.5 billion liters of ADO demand in 2005 is replaced by bio-diesel, this
would require 639 units of bio-diesel plants with yearly production capacity of about 1.280
million liters. Yearly emission reduction potential would be 3.46 million tonnes of CO2.
PV-based small vehicle
According to Central Bureau Statistics, in 1995 there were 14,612 small three-wheeled
public vehicles called Bajajs operating in Jakarta. With long operating hours, Bajajs are blamed
for causing traffic jams at several points in Jakarta, and add to air pollution problems. Some
policies have been introduced at the regional house of representatives and by the governor to
restrict the use of Bajajs.
A small vehicle powered by photovoltaic cells could be a major option to replace Bajajs.
Assuming that a PV-based small vehicle has zero emissions, then the emission mitigation potential
of replacing the Bajajs could amount to 1,620 kilotonnes of CO2 per year.
CNG vehicles for public transport
Shifting from diesel fuel to compressed natural gas (CNG) for bus transportation is a real
option in Indonesia. Emissions from public transport are normally expressed in terms of emissions
per unit output (tonnes/km or tonnes/passenger-km). Assessments of the emission mitigation
potential of different options are determined by comparing emission factors from selected
alternative options with existing conditions. Emission reductions, however, will also depend on the
total number of vehicles in use. Past experience with fuel-shifting to CNG-fueled taxis and
minibuses in major cities of the country has shown that in many cases, users revert to the original
fuel after a short time. The main reasons are lack of infrastructure (e.g., filling stations for LPG
and CNG), and poor public promotion.
Converting 10,000 buses to CNG in five big cities in Indonesia would save about 180
million liters ADO and reduce emissions by 192 kilotonnes of CO2 a year.
Coal drying using power plant waste heat
Indonesia has huge coal reserves of 38.01 billion TCE, most of which are classified as
low-rank coal. Domestically, coal is used mainly for electricity generation and in the cement
industry. In 1999, installed capacity of coal steam power plants was 4,385 MW. Because the
Clean Development Mechanism Opportunities in Indonesia – September 2001
Center for Research on Energy, Institut Technology Bandung 26
price of coal-generated electricity is relatively lower than electricity from other sources, coal
steam power plants are expected to have a major role in Indonesia’s national electricity
development planning.
There are several ways in which coal utilization efficiency can be increased and emissions
reduced. One is coal enrichment, which involves drying low-rank coal to yield a higher grade of
coal before burning.
Power plant coal normally has a moisture content of 10%. If waste heat is used to dry,
for example, 693 kilotonnes of coal. 17,936 tonnes of CO2.can be saved when the fuel is burned
in a power plant

Clean Development Mechanism Opportunities in Indonesia – September 2001
Center for Research on Energy, Institut Technology Bandung 27
6 References
1. ALGAS Project Final Report, Indonesia, 1997. Prepared by the national technical expert team, comprises teams from the Center for Environmental Studies, IPB, the Center for Research on Energy, ITB, The Indonesian association of agricultural meteorology (PERHIMPI), and Yayasan Pelangi.
2. Official Communication of Indonesia, Office of the State Minister of the Environment.1998.
3. Brief on The GEF/SGP activities, provided by the secretariat of the GEF/SGP national team and Yayasan Bina Usaha Lingkungan, February 2000.
4. Preliminary Information for Assessing CDM Project Development and Undertaking in Indonesia, Center for Research on Material and Energy, ITB, February 2000.