cbalance solutions pvt. ltd energy audit report · the geographical scope of the project comprised...
TRANSCRIPT

ICICI Bank Energy Audit Report - October 2015 Page 1
cBalance Solutions Pvt. Ltd
Energy Audit Report
for
ICICI Bank
DadarBranch, Mumbai
Prepared by: Vivek Gilani Ashoka Fellow Environmental Engineer (E.I.T) BEE Certified Energy Auditor (EA-17177) Founder / Director: cBalance Solutions Hub
Dhrumit Parikh M.Tech, Solar & Alternative Energy
In consultation with: Energetic Consulting Private Limited

ICICI Bank Energy Audit Report - October 2015 Page 2
Table of Contents 1. Introduction ............................................................................................................................. 5
2. Project Scope ........................................................................................................................... 6
3. Methodology ........................................................................................................................... 7
4. Energy Audit Data Analysis ...................................................................................................... 8
4.1 Baseline Performance – Measurement ........................................................................... 8
4.1.1 Electricity Consumption ................................................................................................. 8
4.1.2 Branch Load Distribution and Load Type - Wise Consumption Pattern ....................... 12
4.1.3Energy Conservation Opportunities .............................................................................. 13
4.2 Lighting System .................................................................................................................... 13
4.2.1 Lighting System Performance Assessment ............................................................ 13
4.2.2 Lighting System Recommendations and Energy Conservation Opportunities ...... 17
4.3 HVAC-Refrigeration System ........................................................................................... 20
4.3.1 HVAC Performance Assessment ................................................................................... 20
4.3.2 Thermal Comfort Assessment ...................................................................................... 23
4.3.3 HVAC System Recommendations and Energy Conservation Opportunities ......... 24
4.3.4 Passive Design Techniques ........................................................................................... 29
4.5 UPS System .................................................................................................................... 32
5. Conclusion ............................................................................................................................. 33
Appendix – I ................................................................................................................................... 38
Appendix – II ................................................................................................................................ 39
Appendix – III ............................................................................................................................... 40
Appendix – IV ............................................................................................................................... 40
Appendix – V ................................................................................................................................ 41

ICICI Bank Energy Audit Report - October 2015 Page 3
List of Tables
Table 1 GHG Emission Factors and Inventory – Energy .................................................................. 8
Table 2 Tariff Structure LT 2 b Commercial ..................................................................................... 8
Table 3 Time-of-Day (TOD) Structure .............................................................................................. 9
Table 4 Annual and Monthly Energy Use Summary ...................................................................... 11
Table 5.Power Measurement - Main Incomer Feeder .................................................................. 12
Table 6 Load (System) type Wise Consumption Pattern ............................................................... 12
Table 7 Lighting System – Illuminance Assessment ...................................................................... 14
Table 8 Lamp Efficiency Metrics .................................................................................................... 14
Table 9 Fixture-Wise Lighting Load and Energy Consumption Summary...................................... 15
Table 10 Target Lux/W/m2 as an Function of Room Index ........................................................... 16
Table 11 ILER Color Code ............................................................................................................... 16
Table 12 ILER Assessment ............................................................................................................. 17
Table 13 Energy and Cost Savings from ILER Improvement .......................................................... 18
Table 14 Energy and Cost Saving by Reducing the Lighting Fixtures ............................................ 18
Table 15 HVAC System Rated Details ............................................................................................ 20
Table 16 HVAC Result Summary .................................................................................................... 23
Table 17 Area Wise Thermal Comfort of Branch ........................................................................... 23
Table 18 Use of Direct/Indirect DX Evaporative Cooler ................................................................ 27
Table 19 Replace existing system with 5 Star AC .......................................................................... 27
Table 20 Replacing existing system with 6 Star AC ....................................................................... 27
Table 21 Cost and Energy savings with Radiant Cooling ............................................................... 29
Table 22 Energy and Cost Saving with Low E Coated Glass........................................................... 29
Table 23 Energy and Cost Saving with High Thermal Performance Glass ..................................... 30
Table 24 Energy and Cost Savings achieved by reducing Window to Wall Ratio .......................... 31
Table 25 UPS Details ...................................................................................................................... 32
Table 26 MACC Project Details ...................................................................................................... 36

ICICI Bank Energy Audit Report - October 2015 Page 4
List of Figures
Figure 1 Monthly Electricity Consumption .................................................................................... 10
Figure 2 Monthly Electricity Cost .................................................................................................. 11
Figure 3 Lighting Load Fixtures Type-wise Distribution ................................................................ 15
Figure 4 Occupancy Sensor ........................................................................................................... 19
Figure 5 Vacancy Sensor ................................................................................................................ 19
Figure 6 AC - Type Wise HVAC Load Distribution .......................................................................... 21
Figure 7 HVAC Energy Consumption Details ................................................................................. 22
Figure 8 Mechanical Dehumidifier Diagram .................................................................................. 25
Figure 9 Indirect Evaporative Cooling/DX ..................................................................................... 26
Figure 10 Radiant Cooling System ................................................................................................. 28
Figure 11 ICICI MACC Curve ........................................................................................................... 35

ICICI Bank Energy Audit Report - October 2015 Page 5
1. Introduction
cBalance Solutions Pvt. Ltd. (India) was contracted by ICICI Bank to conduct a complete
electrical and thermal energy audit as the primary step of an objective to transform their branch into a ‘green branch’ through conservation of natural resources and reducing environmental impact of their operations.
The overarching objectives of the exercise were to:
Determine the energy and related cost conservation potential for the bank branch based on technological interventions
Determine the energy and related cost conservation potential based on architectural interventions (especially related to building envelope/Air Conditioned space insulation)
Determine the electrical energy cost reduction potential based on operational process changes (related to reorganizing the scheduling of energy consuming activities)
Establish the comparative financial feasibility of proposed alternatives on a life-cycle cost basis
Additionally, cBalance Solutions Pvt. Ltd. determined the GHG mitigation potential for the proposed alternatives to reduce the overall Carbon Footprint of ICICI Bank (Scope 1 and Scope 2 Emissions). This assessment culminates in a macro-level Marginal Abatement Cost Curve (MACC) Analysis.
MACC Curves: An enterprise-specific Marginal GHG Abatement Cost Curve (MACC) analysis is
a key component of an institutionalized Sustainability Strategy. It is designed to discover the
most cost-effective means of mitigating climate change impact through technological
interventions or modifications in management practices. It is a vital decision-support input
for planning capital expenditure on Energy Efficiency, Water Conservation, Waste Reduction
& Management etc. projects in a manner that safeguards the financial sustainability of the
Organization while achieving tangible environmental and socio-economic sustainability
benefits for the planetary ecosystem. The idea is to harvest the low-hanging fruits first,
accumulate the economic benefits from these no-regret options and then steps through
more challenging interventions. In this way, it reduces financial risk and ensures longevity of
the environmental program at large.
MACC Methodology:Costs and benefits are calculated based on real values of financial
parameters such as inflation, interest rates, cost of electricity, energy etc. and resource
conservation benefits of options reflect the enhancement in technological alternatives
available over time.

ICICI Bank Energy Audit Report - October 2015 Page 6
2. Project Scope
The geographical scope of the project comprised execution of one day pilot energy audit of ICICI Bank, Dadar branch (Maharashtra, India) on 16th October, 2015.
The systems studied and assessed as part of the energy audit and conservation strategy devising process included the following:
Utility Analysis
HVAC Systems
Lighting Systems
UPS System

ICICI Bank Energy Audit Report - October 2015 Page 7
3. Methodology
The field measurement methodology adopted included the following processes and
equipments:
MECO Clamp-On Meter: for measuring electrical parameters of individual HVAC
equipment - to establish baseline system performance.
Luxmeter: for measuring lux levels on the working planes of the workspaces and human
occupancy areas.
Anemometer: for measuring flow rate (velocity) of condenser cooling air exiting the
outdoor-units to determine the heat rejected by the individual HVAC equipment
(equivalent to delivered cooling – Tonnes of Refrigeration or TR)
Psychrometer: for measuring the dry bulb temperature (DBT) and wet bulb temperature
(WBT) of the ambient and condenser-cooling air to establish the enthalpy change across
the condensers of the outdoor units.
Measuring Tape: to measure the diameter of outdoor unit fans to convert air velocity
into mass flow rate.

ICICI Bank Energy Audit Report - October 2015 Page 8
4. Energy Audit Data Analysis The following color coding has been used for the data interpretation in the tables:
Color Data Interpretation
Rated or Derived Values
On-field Measured Values
Calculated Values based on Rated/Derived and On-field Measured Values
4.1 Baseline Performance – Measurement The branch consumes only grid electricity for running HVAC systems, UPS system, Lighting and
bank utilities.The annual energy consumption (October 2014 to September 2015)of the ICICI-
Dadarbranch was recorded to be 65,081 kWh. The relative and total impacts of fossil and
electrical energy consumption on the Direct and Indirect (Scope 2) GHG Emissions of the branch
are presented in the tablebelow:
Table 1GHG Emission Factors and Inventory – Energy
Energy Source GHG Emission Units GHG Emissions (MT CO2e/year)
Grid Electricity
emissions 1.19 kg CO2e/kWh 77.6
Non electricity
emissions 331.8 kg CO2e/ TR/yr 4.8
Total 82.4
The analysis indicates that the annual energy related GHG emissions for the plant are 82.4metric
tonnes of CO2e.
4.1.1 Electricity Consumption
Brihanmumbai Electric Supply and Transport (BEST) provide this branch with Grid Electricity. the
Table below
presents the details of the tariff structure of the ICICI Bank, Dadar branch. The details of Time–
of–Day (TOD) tariff incentive / disincentive structure are presented in the Table below
Table 2Tariff Structure LT 2 b Commercial
Detail of Tariff Values Units
Sectioned Load 44.94 KW
kWh charges (New tariff w.e.f. 01.04.2015) 10.3 INR/Unit
kWh charges (Old tariff up to 31.03.2015) 9.3 INR/Unit
Contract Demand 56.18 KVA
Fixed Demand Tariff 200.00 KVA/month

ICICI Bank Energy Audit Report - October 2015 Page 9
Table 3Time-of-Day (TOD) Structure
Details TOD (0600 Hrs to 0900 Hrs)
TOD (0900 Hrs to 1200 Hrs)
TOD (1200 Hrs to 1800 Hrs)
TOD (1800 Hrs to 2200 Hrs)
TOD (2200 Hrs to 0600 Hrs)
Incentive / Disincentive (INR/ kWh)
0.00 0.50 0.00 1.00 -0.75
Baseline electrical energy consumption was determined through a review of the electricity bills
paid by the facility over a period of 12 months (October 2014 to September 2015). The
electricity bill spanned different Time-of-Day (TOD) Tariff regimes implemented by the utility
provider. Figure 1 below shows the monthly electricity consumption in kWh. The maximum
electricity consumption, recorded in October 2014 was identified to be7,461 kWh.The minimum
electricity consumption, recorded in March 2015 was identified to be 3,991kWh.The average
monthly consumption valueof5,423 kWh per month is taken as the present energy benchmark
and the goal of the energy conservation process.The ultimate desired outcome of the energy
audit process is to identify possibilities for reducing this benchmark energy consumption to the
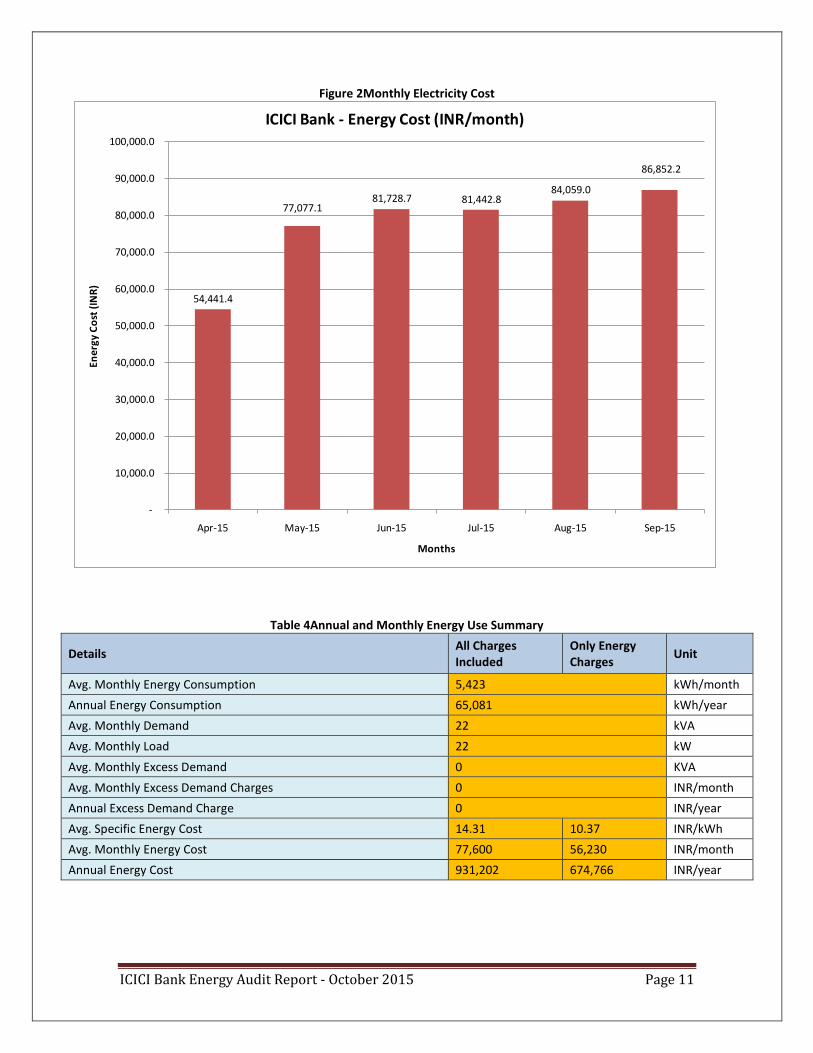
greatest extent feasible. Figure 2 depictsthe monthly electricity charges that are paid to BEST.
The maximum monthly electricity charge of INR 86,852 was paid in September 2015. The
minimum monthly electricity charge of INR 54,441was paid inApril2015. The average monthly
electricity charge was calculated to be INR 77,600. The normalized average electricity charge for
the manufacturing unit was calculated by dividing the total annual electricity cost (energy
charges only) with the total energy (in kWh) used. This was calculated to be INR 10.37 per kWh
and was used as the basis of all energy cost saving modeling activities conducted for the project.
It is to be noted that the total annual electrical energy cost (including fixed charges, demand
charges etc.) was INR 9,31,202 and the resultant gross electricity cost per kWh was therefore
INR 14.31 per kWh. This value however has only academic significance with respect to energy
savings calculation, as it does not truly; specifically address the energy cost but rather the total
cost of supply. The above analysis is summarized in Table 4, provided below. Other relevant
details of the energy bills are presented in Appendix – I.

ICICI Bank Energy Audit Report - October 2015 Page 10
Figure 1Monthly Electricity Consumption
7,461.0
7,140.0
6,204.0
5,185.0
4,399.0
3,991.04,114.0
4,831.0
5,713.0
5,373.0 5,471.05,199.0
-
1,000.00
2,000.00
3,000.00
4,000.00
5,000.00
6,000.00
7,000.00
8,000.00
Oct-14 Nov-14 Dec-14 Jan-15 Feb-15 Mar-15 Apr-15 May-15 Jun-15 Jul-15 Aug-15 Sep-15
Ener
gy C
on
sum
pti
on
(kW
h)
Month
ICICI Bank - Monthly Energy Consumption (kWh)
ICICI Bank Energy Audit Report - October 2015 Page 11
Figure 2Monthly Electricity Cost
Table 4Annual and Monthly Energy Use Summary
Details All Charges Included
Only Energy Charges
Unit
Avg. Monthly Energy Consumption 5,423 kWh/month
Annual Energy Consumption 65,081 kWh/year
Avg. Monthly Demand 22 kVA
Avg. Monthly Load 22 kW
Avg. Monthly Excess Demand 0 KVA
Avg. Monthly Excess Demand Charges 0 INR/month
Annual Excess Demand Charge 0 INR/year
Avg. Specific Energy Cost 14.31 10.37 INR/kWh
Avg. Monthly Energy Cost 77,600 56,230 INR/month
Annual Energy Cost 931,202 674,766 INR/year
54,441.4
77,077.181,728.7 81,442.8
84,059.0
86,852.2
-
10,000.0
20,000.0
30,000.0
40,000.0
50,000.0
60,000.0
70,000.0
80,000.0
90,000.0
100,000.0
Apr-15 May-15 Jun-15 Jul-15 Aug-15 Sep-15
En
erg
y C
ost
(IN
R)
Months
ICICI Bank - Energy Cost (INR/month)
ICICI Bank Energy Audit Report - October 2015 Page 12
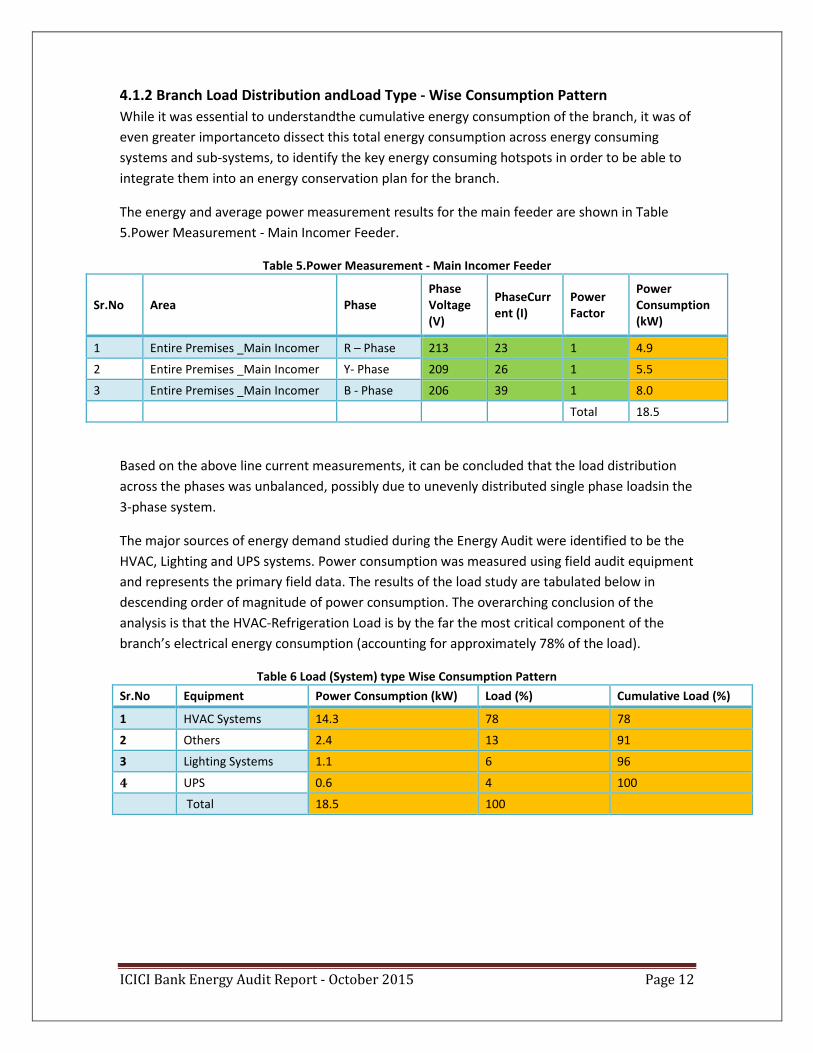
4.1.2 Branch Load Distribution andLoad Type - Wise Consumption Pattern
While it was essential to understandthe cumulative energy consumption of the branch, it was of
even greater importanceto dissect this total energy consumption across energy consuming
systems and sub-systems, to identify the key energy consuming hotspots in order to be able to
integrate them into an energy conservation plan for the branch.
The energy and average power measurement results for the main feeder are shown in Table
5.Power Measurement - Main Incomer Feeder.
Table 5.Power Measurement - Main Incomer Feeder
Sr.No Area Phase Phase Voltage (V)
PhaseCurrent (I)
Power Factor
Power Consumption (kW)
1 Entire Premises _Main Incomer R – Phase 213 23 1 4.9
2 Entire Premises _Main Incomer Y- Phase 209 26 1 5.5
3 Entire Premises _Main Incomer B - Phase 206 39 1 8.0
Total 18.5
Based on the above line current measurements, it can be concluded that the load distribution
across the phases was unbalanced, possibly due to unevenly distributed single phase loadsin the
3-phase system.
The major sources of energy demand studied during the Energy Audit were identified to be the
HVAC, Lighting and UPS systems. Power consumption was measured using field audit equipment
and represents the primary field data. The results of the load study are tabulated below in
descending order of magnitude of power consumption. The overarching conclusion of the
analysis is that the HVAC-Refrigeration Load is by the far the most critical component of the
branch’s electrical energy consumption (accounting for approximately 78% of the load).
Table 6 Load (System) type Wise Consumption Pattern
Sr.No Equipment Power Consumption (kW) Load (%) Cumulative Load (%)
1 HVAC Systems 14.3 78 78
2 Others 2.4 13 91
3 Lighting Systems 1.1 6 96
4 UPS 0.6 4 100
Total 18.5 100

ICICI Bank Energy Audit Report - October 2015 Page 13
4.1.3 Energy Conservation Opportunities
4.1.3.1 Load Management
To decrease the effects of unbalance, several actions can be taken, with different degrees of
technical complexity1.A primary modification that must receive immediate attention is the
redistribution of single-phase loads to achieve a balanced 3-phase system. Mitigation
techniques that use special transformers, such as Scott- and Steinmetz transformers, or ‘Static
Var Compensators’, which modify system parameters to allow addition of single-phase loads
while emulating characteristics of a three-phase load, can be deployed. These techniques are
described in detail in Appendix III of the report.
4.1.3.2 Reduce Contract Demand
The average recorded demand per month was identified to be 22kVA. When compared with the
contracted/sanctioned demand of 56.18 kVA, the contracted demand could be reduced by 50%.
4.2 Lighting System
4.2.1 Lighting System Performance Assessment
The lighting load across the facility is estimated to be 1.04kW, which represents approximately
4% of the averagemonthly electrical load of the branch. Lighting is an essential service required
by occupants of indoor and outdoor spaces and is designed to perform a functional and an
aesthetic role, as per specific requirements that are addressed during the lighting system design
phase. The intensity levels (lux, lumens per m2) required by the occupants vary with application
and area of usage. There are recommendations provided by the Indian Standard IS 3646:1992 to
evaluate the efficacy of the lighting installed in spaces as a function of use cases. Extensive field
measurements with Lux Meters were carried out throughout the indoor spaces of the branch
and these measurements are tabulated in Appendix – II. The measured lux values were
compared with the recommended lux values2 and the resulting comparison for lux levels are
presented in the Table below for indoor areas of the facility.
1 Power Quality Application Guide 5.1.3 Voltage Disturbances Introduction to Unbalance 2 Indian Standard: IS 3646:1992 – Code of Practice for Interior Illumination Part – 1 General Requirements And Recommendations for Working Interiors (First Revision). Table -1 Recommended Illumination (Clause 4.2.2.2)
ICICI Bank Energy Audit Report - October 2015 Page 14
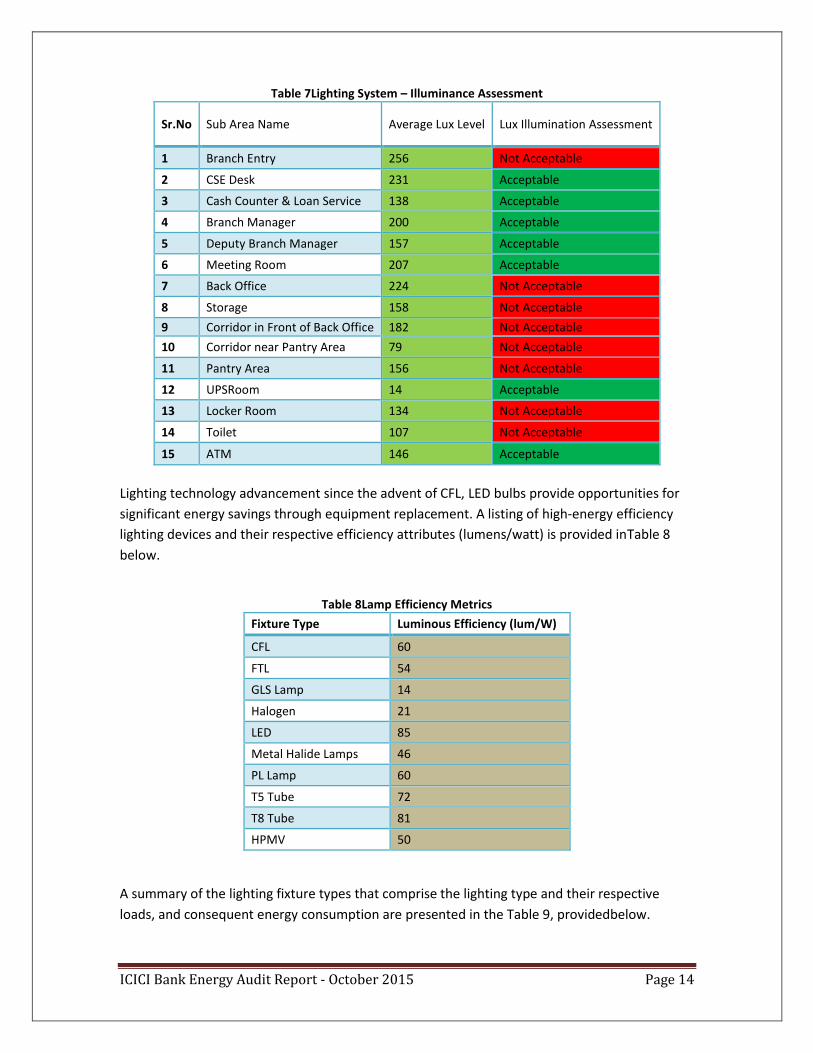
Table 7Lighting System – Illuminance Assessment
Sr.No Sub Area Name Average Lux Level Lux Illumination Assessment
1 Branch Entry 256 Not Acceptable
2 CSE Desk 231 Acceptable
3 Cash Counter & Loan Service 138 Acceptable
4 Branch Manager 200 Acceptable
5 Deputy Branch Manager 157 Acceptable
6 Meeting Room 207 Acceptable
7 Back Office 224 Not Acceptable
8 Storage 158 Not Acceptable
9 Corridor in Front of Back Office 182 Not Acceptable
10 Corridor near Pantry Area 79 Not Acceptable
11 Pantry Area 156 Not Acceptable
12 UPSRoom 14 Acceptable
13 Locker Room 134 Not Acceptable
14 Toilet 107 Not Acceptable
15 ATM 146 Acceptable
Lighting technology advancement since the advent of CFL, LED bulbs provide opportunities for
significant energy savings through equipment replacement. A listing of high-energy efficiency
lighting devices and their respective efficiency attributes (lumens/watt) is provided inTable 8
below.
Table 8Lamp Efficiency Metrics
Fixture Type Luminous Efficiency (lum/W)
CFL 60
FTL 54
GLS Lamp 14
Halogen 21
LED 85
Metal Halide Lamps 46
PL Lamp 60
T5 Tube 72
T8 Tube 81
HPMV 50
A summary of the lighting fixture types that comprise the lighting type and their respective
loads, and consequent energy consumption are presented in the Table 9, providedbelow.

ICICI Bank Energy Audit Report - October 2015 Page 15
Table 9Fixture-Wise Lighting Load and Energy Consumption Summary
Fixture Type Application Qty Load(kW) Energy Consumption(kWh/yr)
Energy Cost(INR/yr)
CFL Indoor Lighting 6 0.11 300 3,110
LED Indoor Lighting 52 0.94 2,600 26,957
Total 58 1.04 2,900 30,067
The assessment indicates that the facility has 58 lighting fixtures leading to an annual energy consumption of approximately 2,900 kWh and leading to an energy cost of INR 30,067 per year. In terms of the annual energy consumption and annual energy cost, the identified figure represents approximately 4% of the total kWh per year consumed and energy bill paid by the ICICI Dadar Branch. The figure below shows the fixture type wise lighting load distribution. It has been observed that LED light contributes for 89.7% load of the entire lighting system.
Figure 3Lighting Load Fixtures Type-wise Distribution
A vital parameter for assessing the effectiveness of Lighting Systems is, the Installed Load
Efficacy Ratios [ILER]; a ratio of the average maintained illuminance, provided on a horizontal
workingplane per circuit watt with the general lighting of an interior to a recommended target
level. It is a dimensionless quantity comprised of a ratio of two quantities (lux per watt per
square meter, lux/W/m²). It is defined by the following mathematical relationship, which
necessitates the calculation of another dimensionless quantity, the Room Index which quantifies
the relative shape of a given room and incorporates the impact of the mounting height of
lighting fixtures.
CFL10.3%
LED89.7%
ICICI Energy Audit - Fixture Type Wise Lighting Load Distribution
CFL
LED
Total Lighting Load = 1.044 kW
ICICI Bank Energy Audit Report - October 2015 Page 16
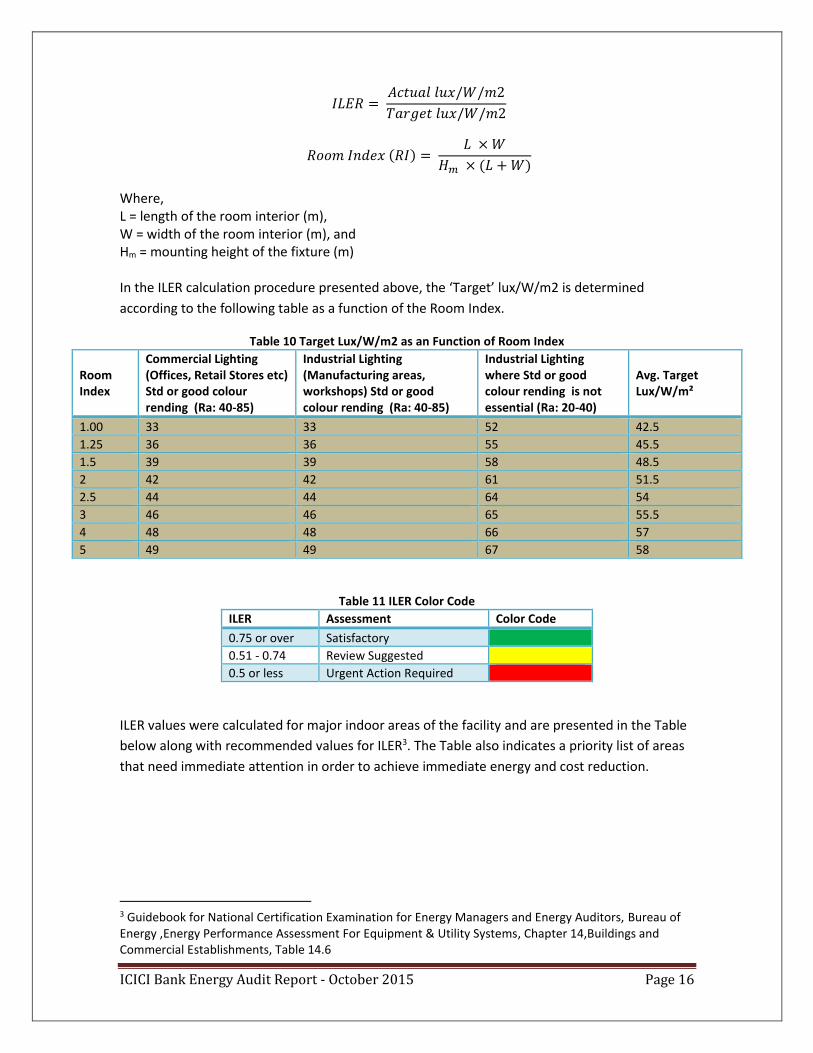
𝐼𝐿𝐸𝑅 = 𝐴𝑐𝑡𝑢𝑎𝑙 𝑙𝑢𝑥/𝑊/𝑚2
𝑇𝑎𝑟𝑔𝑒𝑡 𝑙𝑢𝑥/𝑊/𝑚2
𝑅𝑜𝑜𝑚 𝐼𝑛𝑑𝑒𝑥 (𝑅𝐼) = 𝐿 × 𝑊
𝐻𝑚 × (𝐿 + 𝑊)
Where, L = length of the room interior (m), W = width of the room interior (m), and Hm = mounting height of the fixture (m) In the ILER calculation procedure presented above, the ‘Target’ lux/W/m2 is determined
according to the following table as a function of the Room Index.
Table 10 Target Lux/W/m2 as an Function of Room Index
Room Index
Commercial Lighting (Offices, Retail Stores etc) Std or good colour rending (Ra: 40-85)
Industrial Lighting (Manufacturing areas, workshops) Std or good colour rending (Ra: 40-85)
Industrial Lighting where Std or good colour rending is not essential (Ra: 20-40)
Avg. Target Lux/W/m²
1.00 33 33 52 42.5
1.25 36 36 55 45.5
1.5 39 39 58 48.5
2 42 42 61 51.5
2.5 44 44 64 54
3 46 46 65 55.5
4 48 48 66 57
5 49 49 67 58
Table 11 ILER Color Code
ILER Assessment Color Code
0.75 or over Satisfactory
0.51 - 0.74 Review Suggested
0.5 or less Urgent Action Required
ILER values were calculated for major indoor areas of the facility and are presented in the Table
below along with recommended values for ILER3. The Table also indicates a priority list of areas
that need immediate attention in order to achieve immediate energy and cost reduction.
3 Guidebook for National Certification Examination for Energy Managers and Energy Auditors, Bureau of Energy ,Energy Performance Assessment For Equipment & Utility Systems, Chapter 14,Buildings and Commercial Establishments, Table 14.6

ICICI Bank Energy Audit Report - October 2015 Page 17
Table 12ILER Assessment
Area Name ILER Assessment
Branch Entry 1.17 Satisfactory
CSE Desk 1.01 Satisfactory
Cash Counter & Loan Service 0.60 Review Suggested
Branch Manager 0.77 Satisfactory
Deputy Branch Manager 1.22 Satisfactory
Meeting Room 0.88 Satisfactory
Back Office 0.83 Satisfactory
Storage 0.36 Urgent Action Required
Corridor in-front of Back Office 1.93 Satisfactory
Corridor near Pantry Area 0.60 Review Suggested
Pantry Area 1.34 Satisfactory
UPS Room 0.03 Urgent Action Required
Locker Room 0.96 Satisfactory
Toilet 0.43 Urgent Action Required
ATM 0.75 Satisfactory
4.2.2 Lighting System Recommendations and Energy Conservation Opportunities
4.2.2.1 ILER Improvement
ILER Ratios of 0.75 and above are desired and are considered satisfactory, while values within
the range of 0.51 to 0.74 represent areas wherein improvement of lighting efficiency through
the following measures can be considered:
Higher Lumens/watt fixtures through more efficient technologies.
Increasing the height of the fixtures from the working plan height.
Improved maintenance and cleaning of luminaries and room walls to reduce impact
of dust and dirt accumulation leading to illuminations losses
Wall repainting
Reducing lux levels (by eliminating a fraction of the installed fixtures) if higher than
required or by recommendingilluminancelevel, which is prevalent.
ILER values lower than 0.5 should serve as an alarm for immediate action to improve lighting
efficiency according to the measures above. The ILER values which are generally much lower
than 0.5 in most areas require immediate attention. The potential energy and associated cost
savings from improving ILER values can be estimated by comparing the energy requirement in
the current situation relative to the energy requirement for a perfect scenario with ILER equal to
1.0. The savings estimate for the branch is presented in Table 13and indicates a total energy
savings potential of approximatelyINR 5,579 through an improvement in the ILER values across
the Branch.

ICICI Bank Energy Audit Report - October 2015 Page 18
Table 13Energy and Cost Savings from ILER Improvement
Area Energy Saving (kWh/yr) Cost Saving (INR/yr) GHG Savings (MT CO₂e/yr)
Cash Counter &Loan Service 40 411 0.05
Branch Manager 46 481 0.06
Meeting Room 24 253 0.03
Back Office 34 350 0.04
Storage 63 658 0.08
Corridor near Pantry Area 20 206 0.02
UPS Room 193 1,998 0.23
Locker Room 8 85 0.01
Toilet 85 882 0.10
ATM 25 256 0.03
Total 538 5,579 0.59
4.2.2.2 Reduce Excess Illuminance
As indicated in the illuminance assessment earlier, some of the Indoor areas of the branch are provided with excess lighting that greatly supersedes the standard lux requirements. The most prominent of these areas are the Branch Entry, Locker Room, Toilet, and Corridor near the back office. The analysis conducted to ascertain potential energy conservation benefits of eliminating excess lighting fixtures led to the conclusion that aligning lux levels across the Branch with standard lux levels could yield energy savings of 576kWh per year and an annual cost saving of approximately INR 5,974,without any capital investment.
Table 14 Energy and Cost Saving by Reducing the Lighting Fixtures
Area Power Reduction (kW)
Energy Savings by Reducing Fixtures (kWh/yr)
Demand Reduction (kVA)
Cost Savings - Energy (INR/yr)
GHG Savings (MT CO₂e/yr)
Branch Entry 0.07 186 0.07 1,931 0.22
Back office 0.01 22 0.01 223 0.03
Storage 0.02 68 0.02 709 0.08
Corridor (in front of Back Office) 0.03 73 0.03 752 0.09
Corridor (near pantry area) 0.01 18 0.01 190 0.02
Pantry Area 0.00 4 0.00 41 0.00
Locker Room 0.05 126 0.05 1,302 0.15
Toilet 0.03 80 0.03 826 0.10
Total 0.21 576
5,974 0.69
4.2.2.3 Use of Occupancy/Vacancy Sensors4
Occupancy/Vacancy sensors function by switching the lights ON and OFF based on the occupancy of the room and are a smart and easy way to save energy in commercial applications.Energy consumption from building interiors and exteriors that do not require continual lighting and cooling due to infrequent occupancy (eg. stairwell and compound lighting in buildings and fan/light operation in toilets and elevators in commercial and residential premises) can be significantly diminished by use of Occupancy/Vacancy sensors to control HVAC and lighting fixtures. As in illustration, incorporating these sensors in tubelights, used 12 hours
4LUTRON – Occupancy/Vacancy Sensor Design and Application Guide, Page no - 4
ICICI Bank Energy Audit Report - October 2015 Page 19
per day (approximate usage in stairwell lighting applications), can mitigate energy consumption by approximately 160 kWh per fixture. This alternative is even more viable when multiple fittings can be sensed and controlled by a single sensor. The types of technology used in these sensors are defined below:
1. Passive Infrared (PIR): Detects change in temperature when someone enters the
room. They are suited for small and enclosed spaces with high level of occupant motion.
2. Ultrasonic Technology: Sensors using this technology sense the occupancy ofa room by bouncing the ultrasonic waves off an object in space and detects frequency shift in emitted and reflected sound waves. This technology is suitable for applications requiring minute detection of motion.
3. Dual Technology: Use both PIR and Ultrasonic technology.Both technologies within the sensor must detect someone in a room in order to turn the lights on, but only one of the technologies needs to continually sense the person in order for the lights to stay on. Dual-technology sensors are self-adaptive to automatically adjust sensitivity and timing.
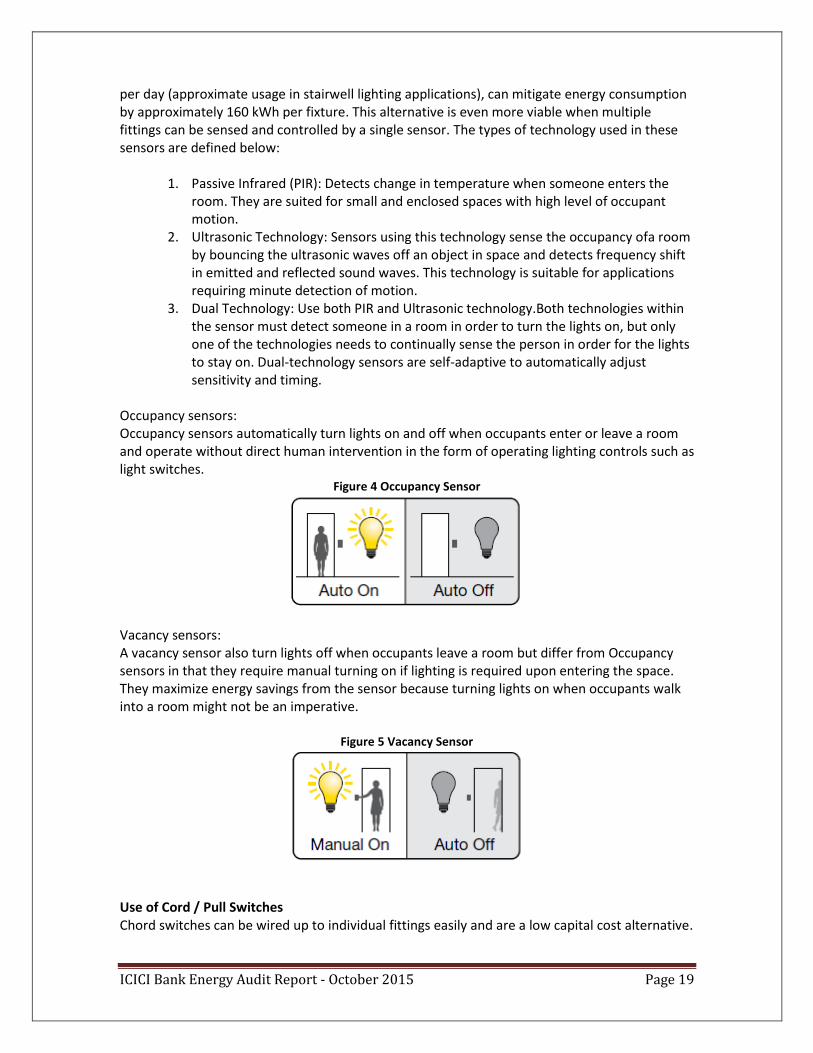
Occupancy sensors: Occupancy sensors automatically turn lights on and off when occupants enter or leave a room and operate without direct human intervention in the form of operating lighting controls such as light switches.
Figure 4 Occupancy Sensor
Vacancy sensors: A vacancy sensor also turn lights off when occupants leave a room but differ from Occupancy sensors in that they require manual turning on if lighting is required upon entering the space. They maximize energy savings from the sensor because turning lights on when occupants walk into a room might not be an imperative.
Figure 5 Vacancy Sensor
Use of Cord / Pull Switches Chord switches can be wired up to individual fittings easily and are a low capital cost alternative.

ICICI Bank Energy Audit Report - October 2015 Page 20
4.3 HVAC-Refrigeration System
4.3.1 HVAC Performance Assessment
The Table below provides an estimate of the operational performance of the Split and Ductable
Unit ACs audited at the Branch. The branch possesses 3 Split and 3 Ductable Units comprising
mainly 1.8 TR and 3 TR ACs The assessment conducted indicates that the total rated ACs
capacity at the branch is 14.4 TR and the corresponding rated power consumption is 18.7 kW.
Table 15 HVAC System Rated Details
AC Type Brand/Model Qty AC_TAG No Rated Power Consumption (kW)
Rated TR/Unit
Rated EER
Rated Star Rating
Split Hitachi - RAU022HQD 1 SAC_01 1.85 1.80 3.41 5 Star
Split Blue Star_ 2HW24RA 1 SAC_02 2.56 1.80 2.55 2 Star
Split Blue Star 2HW24RA 1 SAC_03 2.56 1.80 2.55 2 Star
Ductable Hitachi Packaged AC 1 DAC_01 3.90 3.00 2.68 1 Star
Ductable Hitachi Packaged AC 1 DAC_02 3.90 3.00 2.68 1 Star
Ductable Hitachi Packaged AC 1 DAC_03 3.90 3.00 2.68 1 Star
Total 18.7 14.40 2.745
The total installed load is 14.4 TR, which represents the most critical component of the energy
management and conservation plan that emerges as the outcome of this Energy Audit.It is
observed from Figure 6that Ductable ACs contribute 62.5% and Spit ACs contribute 37.5% to the
total rated cooling capacity.
5Weighted avg. EER based on rated equipment TR

ICICI Bank Energy Audit Report - October 2015 Page 21
Figure 6 AC - Type Wise HVAC Load Distribution
Split AC37.5%
Ductable AC62.5%
ICICI Energy Audit - AC Type Wise HVAC Load Distribution
Split
Ductable
Total Cooling Capacity = 14.4 TR

ICICI Bank Energy Audit Report - October 2015 Page 22
Figure 7HVAC Energy Consumption Details
The measurements presented in the Table below indicate that the system consumes an
estimated 2,97,910 kWh/year. The key efficiency parameter for ACs is the Energy Efficiency
Ratio (EER) Efficiency. Power and delivered TR measurements were used to derive the delivered
EER which serves as a means to compare in-operation energy efficiency of the system relative to
the rated energy efficiency.
The overarching conclusions drawn from the HVAC baseline measurements are:
- the delivered TR (8.5 TR) is notably lower than the rated TR (14.4 TR) of the system;
delivered TR was seen to be 41 % lower than rated TR
- the weighted-average delivered EER (2.28) is substantially lower than the weighted-
average rated EER (2.74); operational EER is approximately 17% lower than rated EER
- the estimated energy consumption due to this depleted EER6 is approximately 20% higher
than if the equipment operated at rated EER.
- the average EER of the 1.8 TR Split ACs is relatively higher at 2.27 while the average EER
of Ductable ACs is generally lower than 1.95.
The above analysis indicates a clear opportunity for energy savings from the replacement of the
1.8 TR Split and 3 TR Ductable ACs. To clarify this potential, the % ‘inefficient’ and ‘efficient’ AC
capacity across small and large ACs was calculated. ‘Efficient’ ACs were defined as those with a
6Calculated by comparison of inverse of rated and delivered EERs (i.e. energy consumption)
3,058.0
4,950.04,554.0
4,620.0
6,974.07,370.0
3.1
1.4
2.3
1.4
1.6
2.8
0.00
0.50
1.00
1.50
2.00
2.50
3.00
3.50
0.0
1,000.0
2,000.0
3,000.0
4,000.0
5,000.0
6,000.0
7,000.0
8,000.0
SAC_01 SAC_02 SAC_03 DAC_01 DAC_02 DAC_03
De
live
red
EE
R
Ene
rgy
Co
nsu
mp
tio
n (
kWh
/ye
ar)
ICICI Energy Audit - HVAC Energy Consumption Summary
Measured Energy Consumption (kWh/yr.) Delivered EER

ICICI Bank Energy Audit Report - October 2015 Page 23
field-measured EER that would qualify for at least a BEE 3-Star Rating (EER of 2.9 to 3.1). Those
with lower field-measured EERs were classified as ‘Inefficient’. The conclusion of this
assessment is provided in the Tables below. The analysis indicates that the percentage of
inefficient equipment is approximately 84% while efficient capacity is only 16 %7.
Table 16 HVAC Result Summary
Location AC _Tag No
Cooling Delivered (TR)
Delivered EER
Star Ratings
Classification Energy Consumption (kWh/yr.)
Operational Cost (INR/yr.)
Cashier SAC_01 1.22 3.09 3 Star Efficient 3,058 31,706
UPS Room SAC_02 0.90 1.40 No Star Inefficient 4,950 51,322
Storage Room SAC_03 1.38 2.34 No Star Inefficient 4,554 47,216
Entrance DAC_01 0.86 1.44 No Star Inefficient 4,620 47,901
Near Cash Machine
DAC_02 1.46 1.62 No Star Inefficient 6,974 72,307
Pantry Room DAC_03 2.68 2.81 2 Star Inefficient 7,370 76,413
Total 8.5 2.288
31,526 3,26,864
4.3.2 Thermal ComfortAssessment
Technical literature related to HVAC system design indicates that a temperature band of 24 ⁰C –
28 ⁰C with a relative humidity of 55% is the most appropriate combination for human comfort.
Furthermore, research by the Indian Green Building Council (IGBC) specifies that an indoor
temperature range of 260C±20C and Relative humidity of 50%-60% is an ideal for thermal
comfort for Indians9. These criteria were used to assessment thermal comfort performance of all
comfort cooled areas of the facility and the resulting analysis is presented in the Table below.
Table 17 Area Wise Thermal Comfort of Branch
Sub Area Temperature (Deg C) Humidity (%) Thermal Comfort
Branch Entry and lobby area 27.1 67 Not Acceptable
Branch manager 24.5 66 Not Acceptable
Deputy branch manager 24.5 59 Acceptable
Meeting room 24.5 64 Not Acceptable
Back office 25.5 65 Not Acceptable
Corridor in front of back office 26 69 Not Acceptable
Corridor near pantry area 25.8 79 Not Acceptable
Pantry area 26.5 76 Not Acceptable
UPS Room 25 80 Not Acceptable
Toilet 25 70 Not Acceptable
7% efficient and inefficient equipment calculated based on delivered TR ratios 8Weighted avg. EER based on delivered equipment TR 9Indian Green Building Council – Green Interiors Rating System – Version -1 Indoor Environment IE Credit 3 Thermal Comfort : Page 61

ICICI Bank Energy Audit Report - October 2015 Page 24
From the above Table, itis observed that except for the Deputy Branch Manager Cabin, all other
areas of the Branch did not meet acceptable thermal comfort standards. Relative Humidity
exceeded 60% in most areas with the highest recorded RH being 80%. The assessments make it
abundantly clear that the HVAC system requires immediate redressing to achieve thermal
comfort by achieving greater higher dehumidification through the evaporator cooling coil or
reducing humidity levels in the cooled space through other means.
4.3.3 HVAC System Recommendations and Energy Conservation Opportunities
4.3.3.1 Improve Thermal Comfort – Maintenance of HVAC systems
The unacceptably high humidity levels are an outcome of compromised cooling capacity. As noted earlier, HVAC system’s delivered cooling capacity was 8.5 as compared to the rated cooling capacity of 14.5 TR. This implies improper maintenance of the HVAC system which must be treated as an exigency.
It recommended that the air conditioning system condensate capture and drainage systems be inspected to ensure proper functioning. Constrained flow of condensate in away from the air handler and inadequate draining of the blower compartment can wet adjacent ductwork causing generation of rust and mold in the ducts.
It is conceivable that the air conditioning compressor unit is oversized (higher than
required BTU/hr. rating) and leads to excessively rapid sensible cooling of the airat low
air flowrate across the cooling coil such that the set-point temperature condition (for
sensible dry-bulb temperature) is met while achieving grossly unsatisfactory humidity
removal. Inspecting and possible downsizing of compressor capacity might be warranted
post investigation and diagnosis.
4.3.3.2 Improve Thermal Comfort – Use of Direct Mechanical Dehumidifiers
Humidity control in an air-conditioned space is achieved by controlling the amount of water vapor present in the air. When relative humidity at the desired temperature set point is too high to permit thermal comfort, dehumidification is required to reduce the amount of water vapor in the air.
Direct Mechanical dehumidifiers (or active dehumidifiers), can be used to perform humidity control in such spaces. These systems are essentially air conditioners with both the hot and cold coils working in the same box. A fan draws the room's air over the cold coil of the AC to condense the moisture, which is often collected in a bucket. Dry air then passes through the hot coil to heat it back up to its original temperature. Therefore, mechanical dehumidifiers slightly raise the air temperature, as opposed to air conditioners, which cool the air by dehumidifying it.

ICICI Bank Energy Audit Report - October 2015 Page 25
Figure 8 Mechanical Dehumidifier Diagram
4.3.3.3 Direct-Indirect (DX Hybrid) Evaporative System
An evaporative cooler produces effective cooling by combining a natural process - water evaporation - with a simple, reliable air-moving system. In the Direct Evaporative cooler type, the fresh air from outside is pulled through moist pads where it is cooled by evaporation and circulated through a house or a building by a large blower. As this happens, the temperature of the outside air is lowered by 30 degrees. This technology can provide significant savings relative to conventional electric compressor-based AC systems in areas with low humidity.
In indirect evaporative cooling, a secondary (scavenger) air stream is cooled by water. The cooled secondary air stream goes through a heat exchanger, where it cools the primary air stream. A blower then circulates the cooled primary air stream. Indirect evaporative cooling does not add moisture to the primary air stream. Furthermore, this system drastically improves the air quality for the occupational health of the office staff, since these systems do not re-circulate the air, as an air conditioning system would. Incidences of building-sickness with these systems will be largely eliminated, which would further improve the overall workforce’s productivity.
An Indirect/Direct evaporative cooling system provides cooler air than either process by itself. In certain climates, this combined process alone provides true comfort cooling. In this system, the external air stream is cooled with indirect evaporative cooling, and then further cooled with direct evaporative cooling. Once the temperature of the external air is reduced in the evaporative heat exchanger, its ability to hold water also reduces along with the temperature. Hence, the relative humidity of the interior air supply is lower than that of any direct evaporative cooling system.

ICICI Bank Energy Audit Report - October 2015 Page 26
Figure 9 Indirect Evaporative Cooling/DX
The facility is located in a warm and humid climatic zone characterized by many months of high humidity. It is therefore suggested thata Direct/Indirect Hybrid DX system be deployed to achieve substantive energy conservation while also meeting the challenging thermal comfort requirements encountered at the facility. The recommended system is a two-stage hybrid system which combines a indirect evaporative cooling unit (first stage) with a conventional DX or chilled water coil in the second stage. The system wouldoperate in a largely evaporative mode most of the year and employ the DX cooling system for months wherein humidity control requirements exceed the dehumidification potential of the indirect evaporative cooling process.
The analysis presented below indicates that implementation of this alternative could yield energy savings of 34,177kWh/yr(59% over BAU energy consumption) and associated operational cost savings of INR 3,54,346/yr. The implementation cost would be approximately INR 9,27,201 witha payback period of 3.73 years.
4.3.3.4 Replacement with Highly Efficient 5 Star/6 Star ACs
All ACs that are functioning at a EER (Energy Efficiency Ratio) of less than 3 Star and/or are more
than 5 years old are recommended for immediate replacement by Godrej EON Natural
Refrigerant (R290) ACs if the distance between the indoor and outdoor units is less than 20 ft. or
else can be replaced by R-32 Refrigerant-based 5 Star-rated ACs.
Natural Refrigerant ACs present significantly competitive life-cycle energy, cost and carbon
footprint characteristics for commercial consumers in India relative to the business-as-usual
Window or Split-ACs (of 2 to 3 BEE Star Rating) using conventional HCFC or HFC refrigerants (f-
gases). Commonly encountered HCFCs (R22, R124, R141b, R142b) have GWPs ranging from 470
to 1,800. The refrigerant industry seeks to replace R22 and other HCFCs with HFCsthe have very
low Ozone Depletion Potential (ODP) but still have very high GWPs ranging from 650 to 1,300.
Globally, Natural Refrigerants such as Hydrocarbons (R290 or Propane) have been identified to
be the best alternatives. This class of refrigerants has zero ODP and a negligible GWP of 3.3; they
are also cheaper and more energy efficient than their conventional f-gas counterparts.
The analysis presented below indicates that implementation of this alternative could yield energy savings of 25,421kWh/yr (44% over BAU energy consumption) and associated operational cost savings of INR 2,71,049/yr. The implementation cost would be approximately INR 4,16,722 with a payback period of 2.81years.

ICICI Bank Energy Audit Report - October 2015 Page 27
Table 18 Use of Direct/Indirect DX Evaporative Cooler
AC _Tag No Revised EER (W/W)
BAU Energy Consumption (kWh/yr)
Intervention Energy Consumption (kWh/yr)
Energy Savings (kWh/yr)
Energy Saving %
Power Saving (kW)
Cost Savings (INR/yr)
Capital Cost (INR)
Payback Period (yrs)
SAC_01 4.60 4,154 2,775 1,379 33% 0.68 14,295 1,15,160 8.06
SAC_02 4.60 10,160 3,084 7,076 70% 3.24 73,364 1,19,218 1.63
SAC_03 4.60 5,949 3,010 2,939 49% 1.38 30,471 1,19,218 3.91
DAC_01 4.60 15,883 4,951 10,932 69% 5.00 1,13,344 1,91,202 1.69
DAC_02 4.60 13,507 4,732 8,775 65% 4.20 90,978 1,91,202 2.10
DAC_03 4.60 7,858 4,782 3,076 39% 1.46 31,894 1,91,202 5.99
Total
57,510 23,334 34,177 59% 15.96 3,54,346 9,27,201 3.73
Table 19Replace existing system with 5 Star AC
AC _Tag No Revised EER (W/W)
BAU Energy Consumption (kWh/yr)
Energy Consumption (kWh/yr)
Energy Savings (kWh/yr)
Energy Saving %
Power Saving (kW)
Cost Savings(INR/yr)
Capital Cost (INR)
Payback Period (yrs)
SAC_02 3.40 10,160 4,191 5,969 59% 2.73 61,890 61,180 0.99
SAC_03 3.40 5,949 4,089 1,859 31% 0.87 19,275 61,180 3.17
DAC_01 3.40 15,883 6,728 9,155 58% 4.19 94,923 98,121 1.03
DAC_02 3.40 13,507 6,430 7,077 52% 3.39 73,373 98,121 1.34
DAC_03 3.40 7,858 6,498 1360 17%
14,104 98,121 6.96
Total 53,357 27,936 25,421 44% 11.82 2,63,565 4,16,723 281
Table 20 Replacing existing system with 6 Star AC
AC _Tag No Revised EER (W/W)
BAU Energy Consumption (kWh/yr)
Energy Consumption (kWh/yr)
Energy Savings (kWh/yr)
Energy Saving %
Power Saving (kW)
Cost Savings(INR/yr)
Capital Cost (INR)
Payback Period (yrs)
SAC_01 3.70 4,154 3,746 408 10% 0.34 4,228 51,875 12.3
SAC_02 3.70 10,160 3,878 6,282 62% 2.89 65,131 53,703 0.82
SAC_03 3.70 5,949 3,878 2,070 35% 1.03 21,466 53,703 2.50
Total
20,263 11,502 8,760 43% 4.26 90,826 1,59,281 5.12

ICICI Bank Energy Audit Report - October 2015 Page 28
The analysis for replacement with R290 based 6-Star ACs indicates that implementation of this
alternative could yield energy savings of 8,760 kWh/yr(43% over BAU energy consumption) and
associated operational cost savings of INR 90,826/yr. The implementation cost would be
approximately INR 1,59,281with a payback period of 5.12 years.
4.3.3.5 Radiant Cooling Technology A radiant cooling system circulates chilled water through a network of pipes. In this system, heat transfer occurs through thermal radiation. This system removes only sensible heat, and cools a floor or ceiling by absorbing heat radiation from the room. This system also provides fresh air to the occupants, maintaining healthy indoor air conditions, and removes moisture in the air. Its uniform cooling reduces the Mean Radiant Temperature (MRT) and increases the thermal comfort. Radiant systems are especially effective in spaces with large ceiling height and in non-partitioned spaces, where a traditional system will need a lot of forced air to condition the space. They are also useful in semi-open spaces, such as outdoor entrances, stadiums, etc. Since the radiant systems typically operate at relatively milder temperatures the cooling plants can be much smaller. These systems do not depend on air movement for heat transfer, thus the ventilation rates are typically cut down by up to 75%, just to meet the fresh air requirements. A Dedicated Outdoor Air System (DOAS), sometimes with energy recovery, can also be used to provide this quality of air.
There are primarily two types of Radiant cooling systems: 1.Slab Integrated System 2. Panel System
Systems using concrete slabs are generally cheaper than panel systems and offer the advantage of thermal mass (the ability to store heat for longer duration) while panel systems offer faster temperature control and flexibility.
Figure 10 Radiant Cooling System
Radiant cooling can be integrated within any type of surface depending on the need and
feasibility of the project. These cold surfaces are generated by embedding pipes inside the
surface, and then circulating the water through these pipes. Delivering cooling from ceiling has
an advantage, as it is easier to leave ceilings exposed to room than floors. Also there is a greater
convective heat exchange through chilled ceiling as warm air rises up, leading to more air
coming in contact with cold surface.

ICICI Bank Energy Audit Report - October 2015 Page 29
The analysis for Radiant Cooling replacement indicates that implementation of this alternative
could yield energy savings of 18,356 kWh/yr (32% over BAU energy consumption) and
associated operational cost savings of INR 1,90,321/yr. The implementation cost would be
approximately INR 10,98,124 with a payback period of 5.57 years.
Table 21 Cost and Energy savings with Radiant Cooling
Current System EER
Revised EER (W/W)
BAU Energy Consumption (kWh/yr)
Intervention Energy Consumption (kWh/yr)
Energy Savings (kWh/yr)
Energy Saving %
Power Saving (kW)
Cost Savings(INR/yr)
Capital Cost (INR)
Payback Period (yrs)
2.12 2.75 57,510 39,154 18,356 32% 8.49 1,90,321 10,98,124 5.57
4.3.4 Passive Design Techniques
4.3.4.1 Use of Low Emissivity Coated Glasses
Low E Coatings are microscopically thin metal or metal oxide layers, deposited on the surface of
glass, that prevent heat transfer across the glass. These coatings reduce the SHGC (Solar Heat
Gain Coefficient) value, which indicates the proportion of infrared radiation passing through the
glazing, as well as the heat transfer coefficient(U value). It must be noted that all Low-E glasses
have a reduced U Value which confers an advantage in cold as well as warm climates. In warm
climates, Low-E coatings are usually applied on the inner surface as this helps to reflect the solar
radiation back outside,whereas in cold climates, coating are usually applied on the outer surface
to allow useful solar radiation to pass through to passively heat the interior, and to diminish the
ability for infrared radiation to pass out.Therefore, applying a Low-E coating either reduces the
heat load by reducing the heat loss through the glazing, or reduces the cooling load by reducing
the solar heat gain. As compared to other active cooling measures, passive design measures
such as Low-E coated glazing which reduce cooling demand should be implemented before
implementation of active cooling interventions which require higher capital cost investment for
equipment overhaul and replacement10.
Building Energy Modelling results indicate that adding Low-E coating to glazingwould reduce
annual energy consumption by about 5.4% andthe associated operating cost saving would be
approximately INR 33,966 per year. The implementation cost would be approximately INR
16,368 witha payback period of 0.5 years. Table 22 Energy and Cost Saving with Low E Coated Glass
Type of Glass Used
Average Building Energy Consumption (kWh/yr)
Type of Glass
Expected Building Energy Consumption (kWh/yr)
Energy Saving(kWh/yr)
Energy Savings (%)
Cost Savings (INR/yr)
Capital Cost (INR)
Payback (yrs)
BAU 60,828 Low E Coated with 0.45 SHGC
57,552 3,276 5.4% 33,966 16,368 0.50
10Excellence in Design for Greater Efficiency(EDGE) User Guide for Offices, Version 1.0, Low E Coated Glass, Page no - 34

ICICI Bank Energy Audit Report - October 2015 Page 30
4.3.4.2 Use of High Thermal Performance Glass
High Thermal Performance Glasses (double or triple glazed) are characterized by even lower
SHGC and U values than Low E-coated glasses. Consequently, thermal performance of the
building envelope is enhanced by these interventions more than it is by coating to existing
glazing11.
By implementation of High thermal performance glasses the potential saving of the entire
building energy consumption would be around 13.8%, and the associated operating cost saving
would be approximately INR 87,092 per year. The implementation cost would be approximately
INR 2,92,298 witha payback period of 3.36 years.
Table 23 Energy and Cost Saving with High Thermal Performance Glass
Type of Glass Used
Average Building Energy Consumption (kWh/yr)
Type of Glass -
Expected Building Energy Consumption (kWh/yr)
Energy Savings (kWh/yr)
Energy Savings (%)
Cost Savings (INR/yr)
Capital Cost (INR)
Payback (yrs)
BAU 60,828 High Thermal Performance Glass - 0.28 SHGC
52,428 8,400 13.8% 87,092 292,298 3.36
4.3.4.3 Reduce Window to Wall Ratio (For New Construction Only)
Solar radiation is a vital light source but is also a source of significant heat gain and cooling load for artificially cooled buildings. Achieving the correct balance between the transparent (glass) and the opaque surfaces in the external façades helps maximize daylight while minimizing unwanted heat transfer, resulting in reduced energy consumption. Glass windows are the weakest links in the building envelope since glass does not resist the flow of heat as much as other building materials; heat flows through a glazed window more than 10 times faster than it does through a well-insulated wall. A correct balance between the transparent (glass) and the opaque surfaces in the facades not only maximizes the daylight but also minimizes the heat transfer, thereby reducing the energy consumption12. The Window to Wall Ratio (WWR) is the ratio of glazing area to the gross exterior wall area. Glazing area is the area covered by glass on the walls regardless of their orientation. The gross exterior wall area includes opaque and transparent elements, such as doors, windows, and walls from the outside. Exteriors of the building, not exposed directly to the environment are excluded from calculations.
The WWR is calculated with the following equation:
WWR (%)= Σ Glazing area (m2)
Gross exterior wall area (m2)
11Excellence in Design for Greater Efficiency(EDGE) User Guide for Offices, Version 1.0, High Thermal Performance
Glass, Page no - 36 12Excellence in Design for Greater Efficiency(EDGE) User Guide for Offices, Version 1.0, Reduced Window to Wall Ratio, Page no - 18

ICICI Bank Energy Audit Report - October 2015 Page 31
Since windows generally transmit heat into the building at a higher rate than walls do, a building with a higher WWR will transfer more heat than a building with a lesser WWR. Conversely, higher WWR in warm climates will require implementation of passive design features such as shading devices or low solar heat gain coefficient (SHGC) glass should to offset the energy gain. In cold climates, when the WWR is higher, increasing the insulation of glass using double or triple glazing would be warranted. The table below shows the potential saving that can be achieved by reducing the Window to Wall ratio to 30%. Theapproximate energy saving would be 4,728 kWh per year and the associated operating cost savings would beINR 49,020 per year.
Table 24 Energy and Cost Savings achieved by reducing Window to Wall Ratio
BAU Case WWR (%)
Average Building Energy Consumption (kWh/yr)
Proposed WWR for New Construction Building (%)
Expected Building Energy Consumption (kWh/yr)
Energy Savings (kWh/yr)
Energy Savings (%)
Cost Savings (INR/yr)
45% 60,828 30% 56,100 4,728 7.8% 49,020

ICICI Bank Energy Audit Report - October 2015 Page 32
4.5 UPS System
Small standalone UPS system used for feeding power to the computers and other sensitive loads in the branch was also identified. The rated UPS capacity and measured input power recorded is presented in the Table below.
Table25 UPS Details
Rating/Capacity Measurement Detail Voltage Current P.F Power (kW) kVA
5 kVA Input 210.30 5.00 0.61 0.65 1.07
5 kVA Output 213.05 4.45 0.61 0.60 0.98
It was noted that the input apparent power (1.07 kVA) is significantly lower than the rated
apparent power of the UPS system; 5kVA. The measured PF was 0.61 which is evidently poor.
Output apparent power from the UPS system was measured to be 0.98 kVA which yields a 8.4%
energy loss across the UPS system or a 91.5% energy efficiency ratio which is within the range of
acceptable performance. Considering that the UPS is oversized, future designs for branches
could consider considerable reduction in UPS system capacity to reduce capital cost by right-
sizing the system. However, the current system performs efficiently, consumes much lower
energy than rated for (commensurate with the load on the system) and therefore and does not
warrant replacement.

ICICI Bank Energy Audit Report - October 2015 Page 33
5. Conclusion The total current annual electrical energy consumption of the ICICI Bank, Dadar Branch is
approximately 65,081 kWh peryear (5,432 kWh per month). Considering a floor area of
approximately 1,895 sq. ft., the EPI (as defined by the Bureau of Energy Efficiency, India) of the
branch is approximately 370 kWh/m2/year. This leads to a anticipated Building Star Rating of
No Star for a Warm & Humid Climatic zone with more than 50% air conditioned area.
The average electricity cost being paid by the facility is INR 77,600 per month (including all
Charges) and INR 9,31,202per year. The system-wise electrical energy breakdown clearly
underscores the importance of the HVAC-Refrigeration system, which is the most critical
component of the energy consumption, accounting for approximately 78% of the load. The
overall benefits of proceeding with the implementation of the various interventions proposed in
the earlier section are substantial; the ICICI Dadar Branch has the invaluable opportunity to
reduce its energy consumption and improve EPI by 65% through implementation of passive
design features to reduce cooling loads, replacement of existing system with 5 Star ACs or
Indirect-Evaporative+ DX Hybrid ACs,. The consolidated environmental, cost and energy
conservation impacts of all the proposed alternatives is presented in the table below.
It must be noted that the actual savings may vary between the ranges of ± 20% depending upon
the site conditions and other unforeseen variables.
Summary Energy Conservation Opportunities –
Lighting System - Luminance Assessment: Reducing the number of fixtures can result in
savings of INR 5,974 annually.
Lighting System - ILER Improvement: By improving ILER to 0.75 or more can result in
savings of INR 5,579 yearly.
HVAC System –Current AC System’s Replacement with Direct/Indirect Hybrid
Evaporative Cooling System : Replacement of AC system with Direct/Indirect Hybrid
Evaporative cooling can result in energy savings of 34,177 kWh/year and associated cost
The overarching conclusion from the Energy Audit process was that ICICI can achieve the
following positive impacts on the environment and its operational costs:
Reduce Greenhouse Gas Emissions by 53.65 metric tonnes of CO2 per year
(equivalent to planting approximately 215 trees every year)
Conserve 42,312 units of electricity every year (enough to power 35 average Indian
homes per year)
Reduce its operational cost by INR 4.38 lacsevery year
The capital cost for implementing all the proposed projects is approximately INR 11.1
lacs (Only Equipment Cost)
The payback period for these investments is a very feasible 2.52 years*.

ICICI Bank Energy Audit Report - October 2015 Page 34
savings of INR 3,54,346 per year,with an equipment capital cost of INR 9,27,201 and a
payback period of 3.73years.
HVAC System –Current AC System’s Replacement with 5 star system : Replacement of
theexisting AC system with 5 star AC system can result in energy savings of
25,421kWh/year andassociated cost savings of INR 2,63,565per year,with an equipment
capital cost of INR 4,16,722 and a payback period of 2.81years.
HVAC System – Current split AC systems’ (SAC_02 and SAC_03) replacement with 6
star system :Replacement of Split AC system with 6 star AC system can result in energy
savings of 8,352 kWh/year and associated cost savings of INR 86,598 per year, with an
equipment capital cost of INR 1,07,406 and a payback period of 1.66 years.
HVAC System – Current AC system’s replacement with Radiantcooling system:
Replacement of the existing AC system with Radiant cooling system can result in energy
savings of 18,356 kWh/year andassociated cost savings of INR 1,90,321 per year, with an
equipment capital cost of INR 10,98,124 and a payback period of 5.57years.
Passive Design Technique – Low Emissivity Coated Glasses: Use of low e coated glasses
with SHGC value of 0.45 can result in energy savings of 3,276 kWh/year and associated
cost savings of INR 33,966 per year, with a capital cost of INR 16,368 witha payback
period of 0.5 years.
Passive Design Technique – Higher Thermal Performance Glasses:Use of high thermal
performance glasses with SHGC value of 0.28 can result in energy savings of 8,400
kWh/year and associated cost savings of INR 87,092 per year, with a capital cost of INR
2,92,298and a payback period of 3.36 years.
Passive Design Technique – Reduce Wall to Window Ratio:By reducing WWR by 30%,
energy savings of 4,728 kWh/year and associated cost savings of INR 49,020 per year
can be achieved.
The recommended priority list for implementation of all energy related interventions proposed
follows the order of the relative Marginal Abatement Cost Curve specifically developed for the
facility as the culminating outcome of the Energy Audit.
The MACC Curves for the facility are presented below in Figure 11

ICICI Bank Energy Audit Report - October 2015 Page 35
Figure 11 ICICI MACC Curve
-8000
-7000
-6000
-5000
-4000
-3000
-2000
-1000
0
1000
2000
3000
0.00 20.00 40.00 60.00 80.00 100.00 120.00 140.00
MA
C: I
NR
/tC
O2
Tonnes of carbon saved/year
A B C D E F G H I J K L M N O P Q R S T

ICICI Bank Energy Audit Report - October 2015 Page 36
Table 26 MACC Project Details
Project ID
Project Detail Energy Savings (kWh/yr)
Cost Savings (INR/Yr)
Capital cost (INR)
GHG Savings (Tonnes/yr)
Payback Period
MAC (Carbon Not Discounted)
A Reduce Lighting Fixtures 576 5,974 0 0.69 0.00 -7050
B Improve ILER by Reducing RI 538 5,579 0 0.64 0.00 -7050
C Reduce Wall to Window Ratio from 45% to 30% (Applicable to New Construction Only)
4,728 49,020 0 6.16 0.00 -6453
D Replace Blue Star SAC_02 - Split AC with 5Star Split System
5,969 61,890 61,180 7.12 0.99 -6191
E Replace Hitachi DAC_01-Ductable AC with 5 Star Split System
9,155 94,923 98,121 10.92 1.03 -6151
F Use of Low Emissivity Glasses 3,276 33,966 16,368 4.25 0.48 -6100
G Replace Hitachi DAC_02-Ductable AC with 5 Star Split System
7,077 73,373 98,121 8.44 1.34 -5887
H Replace Blue Star SAC_02 - Split AC with 6 Star Split System
6,282 65,131 53,703 8.11 0.82 -5853
I Replace Blue Star SAC_02 - Split AC with DX Hybrid System
7,076 73,364 1,19,218 8.78 1.63 -5421
J Replace Hitachi DAC_01-Ductable AC with DX Hybrid System
10,932 1,13,344 1,91,202 13.58 1.69 -5361
K Replace Hitachi DAC_02-Ductable AC with DX Hybrid System
8,775 90,978 1,91,202 11.01 2.10 -4966
L Replace Blue Star SAC_03 - Split AC with 5Star Split System
1,859 19,275 61,180 2.22 3.17 -4291
M Replace Blue Star SAC_03 - Split AC with 6 Star Split System
2,070 21,466 53,703 3.08 2.50 -3903
N Use of High Thermal Performance Glasses 8,400 87,092 2,92,298 10.90 3.36 -3797
O Replace Blue Star SAC_03- Split AC with DX Hybrid System
2,939 30,471 1,19,218 3.84 3.91 -3329
P Replace Entire HVAC System with Radiant Cooling
18,356 1,90,321 10,98,125 23.76 5.77 -1875
Q Replace Hitachi DAC_03-Ductable AC with 3,076 31,894 1,91,202 4.21 5.99 -1603

ICICI Bank Energy Audit Report - October 2015 Page 37
DX Hybrid System
R Replace Hitachi DAC_02-Ductable AC with 5 Star Split System
1,360 14,104 98,121 1.62 6.96 -1003
S Replace Hitachi SAC_01- Split AC with DX Hybrid System
1,379 14,295 1,15,160 1.97 8.06 -40
T Replace Blue Star SAC_01 - Split AC with 6 Star Split System
408 4,228 51,875 1.08 12.27 1627
Total (for selected projects) 42,312 4,38,695 11,04,340 53.65 2.52

ICICI Bank Energy Audit Report - October 2015 Page 38
Appendix – I Monthly Energy Consumption Detail
Month TOD Tariff
Structure
Units
(kWh/month)
Current Contract
Demand Charges
(INR)
Recorded PF
Current Total
Demand Charges
(Base+Excess,INR)
Time of
day
Charges
(INR)
Energy
Charges (INR)
PF Incentive
(INR)
Bill Amount
(INR)
Sep-15 LT- 2b # New 5,199 4,494 1.00 4,494 876 54,426 5,256 86,852
Aug-15 LT- 2b # New 5,471 4,494 1.00 4,494 904 57,255 5,080 84,059
Jul-15 LT- 2b # New 5,373 4,494 1.00 4,494 961 56,303 4,921 81,442
Jun-15 LT- 2b # New 5,713 4,494 1.00 4,494 978 59,822 4,934 81,728
May-15 LT- 2b # New 4,831 4,494 1.00 4,494
49,759 77,077
Apr-15 LT- 2b # New 4,114 4,494 1.00 4,494 710 43,084 3,434 54,441
Mar-15 LT- 2b # New 3,991 - - 41,107
Feb-15 LT- 2b # Old 4,399 - - 45,309
Jan-15 LT- 2b # Old 5,185 - - 53,405
Dec-14 LT- 2b # Old 6,204 - -
63,901
Nov-14 LT- 2b # Old 7,140 - - 73,542
Oct-14 LT- 2b # Old 7,461 - - 76,848
Annual Total 65,081 26,966 1.00 26,966 674,765 23,626 465,601
ICICI Bank Energy Audit Report - October 2015 Page 39
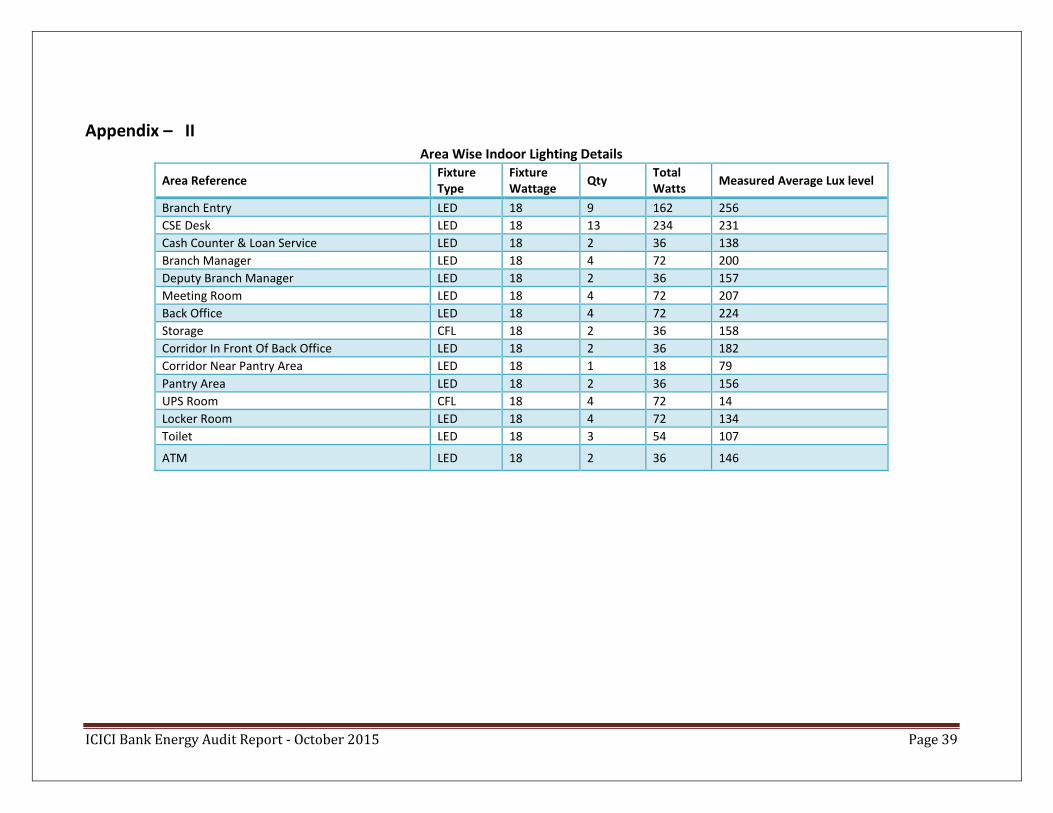
Appendix – II Area Wise Indoor Lighting Details
Area Reference Fixture Type
Fixture Wattage
Qty Total Watts
Measured Average Lux level
Branch Entry LED 18 9 162 256
CSE Desk LED 18 13 234 231
Cash Counter & Loan Service LED 18 2 36 138
Branch Manager LED 18 4 72 200
Deputy Branch Manager LED 18 2 36 157
Meeting Room LED 18 4 72 207
Back Office LED 18 4 72 224
Storage CFL 18 2 36 158
Corridor In Front Of Back Office LED 18 2 36 182
Corridor Near Pantry Area LED 18 1 18 79
Pantry Area LED 18 2 36 156
UPS Room CFL 18 4 72 14
Locker Room LED 18 4 72 134
Toilet LED 18 3 54 107
ATM LED 18 2 36 146

ICICI Bank Energy Audit Report - October 2015 Page 40
Appendix – III
o The ‘Scott-transformer’ consists of two single-phase transformers, with special winding ratios, hooked up to a three-phase system.
They are connected in such a way that at the output, a two-phase orthogonal voltage system is generated allowing the connection
of two single-phase systems. This set-up presents a balanced three-phase power to the grid.
o A ‘Steinmetz-transformer’ is in fact a three-phase transformer with an extra power balancing load, consisting of a capacitor and
an inductor rated proportional to the single phase load. When the reactive power rating of the inductor and the capacitor equals
the active power rating of the load, divided by √3, the three-phase grid sees a balanced load. The three-phase rated power of the
transformer equals the single-phase load’s active power13.
Finally, special fast-acting power electronic circuits, such as ‘Static Var Compensators’ can be configured to limit the unbalance. These
behave as if they were rapidly changing complementary impedances, compensating for changes in impedance of the loads on each phase.
Also, they are capable of compensating unwanted reactive power. However, these are expensive devices, and are only used for large loads
(e.g. arc furnaces) when other solutions are insufficient. Other types of power conditioners that can deal with unbalanced systems as well
as other power quality problems are in development but are not yet ready for general application.
Appendix – IV
Note on Energy Savings Lighting Transformers
The branch has installed a voltage modulating device (ELCON) at the main incomer panel which reduces the incoming phase voltage from
approximately 230-240 V to approximately 210-215 V for the purposes of energy conservation since active power consumption (kW) is
directly proportional to phase voltage and current according to the following mathematical relationship:
Power Consumption (W) = √3𝑥 𝑉 𝑥 cos 𝛷 𝑥 𝐼
Where;
13 Balancing through this device is only perfect for loads with an active power equal to the value used to design the system.

ICICI Bank Energy Audit Report - October 2015 Page 41
V = line voltage (V)
I = line current (A)
cosΦ = Power Factor
Such voltage reduction systems are instrumental in achieving energy savings from dimmable electrical-ballast based lighting systems
(conventional FTLs and CFLs) but not too useful for saving energy from non-dimmable fixtures. Furthermore, their impact on energy
savings from HVAC systems is undocumented and is unlikely to be significant to warrant installation on the main incomer. It is also
plausible that the voltage reduction impact of the installed transformer might adversely affect the performance of inductive loads such as
compressor motors of HVAC systems which require a desired set voltage as opposed to dimmable lighting fixtures which can perform at
lower voltages while producing lesser light.
It is therefore recommended that such a system only be installed in facilities where the lighting load is significant and consists of dimmable
fixtures. Their impact on energy savings from highly-efficient LED based systems is marginal.
Finally, when such a system is installed, it is advised that it be installed on the lighting panel rather than the main incomer so that other
equipments that require higher voltages (such as HVAC systems etc.) do not suffer from low-voltage and consequent system failure.
Appendix – V
Note on Energy Savings from Spectrally Selective Films
Per degree of temperature reduction achieved across the building air volume, energy savings from chillers is expected to be in the range
of 3% to 5 %
Per BTU per 100 sq. ft. per hour of thermal load mitigation from these films, chiller power consumption can be reduced by approximately
10 W