caustic recovery from highly alkaline denim … · denim üretimi yapan bir tekstil fabrikasının...
TRANSCRIPT
CAUSTIC RECOVERY FROM HIGHLY ALKALINE DENIM MERCERIZING WASTEWATERS USING MEMBRANE TECHNOLOGY
A THESIS SUBMITTED TO THE GRADUATE SCHOOL OF NATURAL AND APPLIED SCIENCES
OF MIDDLE EAST TECHNICAL UNIVERSITY
BY
CİHANGİR VAROL
IN PARTIAL FULFILLMENT OF THE REQUIREMENTS FOR
THE DEGREE OF MASTER OF SCIENCE IN
ENVIRONMENTAL ENGINEERING
SEPTEMBER 2008

Approval of the thesis:
CAUSTIC RECOVERY FROM HIGHLY ALKALINE DENIM MERCERIZING WASTEWATERS USING MEMBRANE TECHNOLOGY
submitted by CİHANGİR VAROL in partial fulfillment of the requirements for the degree of Master of Science in Environmental Engineering Department, Middle East Technical University by, Prof. Dr. Canan Özgen Dean, Gradute School of Natural and Applied Sciences Prof. Dr. Göksel N. Demirer Head of Department, Environmental Engineering Prof. Dr. Ülkü Yetiş Supervisor, Environmental Engineering Dept., METU Examining Committee Members: Dr. Haluk Çeribaşı Environmental Engineering Dept., METU Prof. Dr. Ülkü Yetiş Environmental Engineering Dept., METU Prof. Dr. Levent Yılmaz Chemical Engineering Dept., METU Prof. Dr. Nalan Kabay Chemical Engineering Dept., Ege University Prof. Dr. Filiz B. Dilek Environmental Engineering Dept., METU
Date:
iii
I hereby declare that all information in this document has been obtained and presented in accordance with academic rules and ethical conduct. I also declare that, as required by these rules and conduct, I have fully cited and referenced all material and results that are not original to this work.
Name, Last Name : Cihangir Varol
Signature :

iv
ABSTRACT
CAUSTIC RECOVERY FROM HIGHLY ALKALINE DENIM MERCERIZING
WASTEWATERS USING MEMBRANE TECHNOLOGY
Varol, Cihangir
MSc., Department of Environmental Engineering
Supervisor: Prof. Dr. Ülkü Yetiş
September 2008, 97 pages
Recovery of caustic solution from mercerizing wastewaters of a denim producing
textile mill was performed by using membrane technologies. A comprehensive
characterization study was conducted to develop the treatment scheme. Highly
alkaline and warm condition of wastewater has induced using membranes made of
Polyethersulfone (PES). Conducted pretreatment applications such as microfiltration,
flocculation and centrifuge have been found unsuccessful to improve further
treatment capacities. Hence recovery studies which are UF, NF and pilot-system
membrane applications have been implemented without any pretreatment. Effects
of TMP and CFV on UF and NF processes were investigated and optimum operating
conditions have been defined. UF has accomplished almost complete caustic
solution recovery beside high COD and color retentions 84 % and 94 % under 4.03
bar TMP and 0.79 m/s CFV at 20±2 0C. Because of higher capacity of NF
membranes also in acid and alkali recovery area, NF process has been studied in
addition to UF. NF has also provided nearly complete NaOH recoveries with 92 %
COD and 98 % color retentions under 4.03 bar TMP and 0.79 m/s CFV at 20±2 0C.
Furthermore temperature effect was also studies by repeating the same processes
at 40±2 0C considering the real operating conditions. Temperature has affected the
v
system performance positively with regards to flux increases with insignificant loses
in recovery and retention capacities. Lastly a pilot plant study has been conducted
and it was found successful despite some operational difficulties due to high
inorganic content and temperature of wastewater.
Keywords: Caustic, Mercerization Wastewater, Membrane, Alkaline Recovery,
Textile Industry

vi
ÖZ
YÜKSEK ALKALİ DENİM MERSERİZE ATIKSULARINDAN MEMBRAN
TEKNOLOJİSİ İLE KOSTİK GERİ KAZANIMI
Varol, Cihangir
Yüksek Lisans, Çevre Mühendisliği Bölümü
Tez Yöneticisi: Prof. Dr. Ülkü Yetiş
Eylül 2008, 97 sayfa
Denim üretimi yapan bir tekstil fabrikasının merserizasyon atık sularından kostik
soda geri kazanımı gerçekleştirilmiştir. Arıtım tasarılarını geliştirmek amacıyla
kapsamlı bir karakterizasyon çalışması yürütülmüştür. Atık suyun oldukca alkali ve
sıcak yapısı çalışmalarda Polyethersulfone (PES) bazlı membran kullanımına
yöneltmiştir. İleriki aırıtımlardaki verimi artırmak amacıyla yürütülmüş
mikrofiltrasyon, flokülasyon ve santrifüj ön arıtım uygulamaları başarısız
bulunmuştur. Bu yüzden çalışılmış UF, NF ve pilot sistem membran uygulamaları her
hangibir ön arıtım olmadan gerçekleştirilmiştir. UF ve NF çalışmaları transmembran
basıncı ve yatay geçiş hızının etkileri bakımından incelenmiş, en verimli çalışma
koşulları belirlenmiştir. UF prosesi en iyi 20±20C de 4.03 bar transmembran basıncı
ve 0.79 m/s yatay geçiş hızında %84 renk ve %94 KOİ giderimiyle birlikte başarılı
kostik çözeltisi geri kazanımı sağlamıştır. Permeat kalitesini artırmak amacıyla yüksek
arıtım kapasitesi yanında asit ve alkali geri kazanımı alanındaki avantajlarıda
düşünülerek NF prosesi çalışılmıştır. NF prosesi de en iyi olarak 20±20C de 4.03 bar
transmembran basıncı ve 0.79 m/s yatay geçiş hızında başarılı kostik çözeltisi geri
kazanımı sağlamış, %92 renk ve %98 KOİ giderimlerine olanak sağlamıştır. Bu
çalışmalara ek olarak bu membran proseslerde sıcaklığın etkisi çalışılmıştır. Gerçek
çalışma koşulları değerlendirilip 40±20C de arıtım çalışmaları tekrarlandığında;

vii
sıcaklığın akı üzerindeki olumlu etkisinin yanında, geri kazanım ve giderim
oranlarında az miktarlarda kayıplara yol açtığı görülmüştür. Son olarak bir pilot
sistem çalışması yürütülmüş ve yüksek inorganic içeriği ve sıcaklık kaynaklı işletim
problemlerine rağmen oldukça başarılı olduğu görülmüştür.
Anahtar kelimeler: Kostik, Merserizasyon Atıksuyu, Membran, Alkali Geri
Kazanımı, Tekstil Endüstrisi

viii
To My Parents

ix
ACKNOWLEDGEMENTS
I would like to express my deepest gratitude to my supervisor Prof. Dr. Ülkü Yetis
for her guidance, trust, support and encouragement during this study. I would like
to say it has been a pleasure for me to know her and study with her.
My greatest gratitude is extended to my committe members Prof. Dr. Nalan Kabay,
Prof. Dr. Levent Yılmaz, Prof. Dr. Filiz B. Dilek and Dr. Haluk Çeribaşı for their
valuable recommendations.
My special thanks go to Dr. Nimet Uzal, who supported me during this study, with
her experience, understanding, encouragement and also her never ending help
during the experiments and being near me whenever I needed.
I would like to express my thanks to ‘Adaptation of IPPC Directive to a Textile Mill in
Turkey’-105Y088 project with the supportive and motivated team mates. The textile
plant staffs are also appreciated for their cooperation.
Finally and especially my appreciations are dedicated to Bahtıgül Kepenek and my
family for their patience and encouragement throughout my research.

x
TABLE OF CONTENTS
ABSTRACT ........................................................................................................ iv
ÖZ ................................................................................................................... vi
DEDICATION ................................................................................................... viii
ACKNOWLEDGEMENTS ...................................................................................... ix
TABLE OF CONTENTS ......................................................................................... x
LIST OF TABLES ............................................................................................... xii
LIST OF FIGURES ............................................................................................. xiv
ABBREVIATIONS .............................................................................................. xvi
CHAPTERS
1. INTRODUCTION ............................................................................................. 1
1.1 General .................................................................................................... 1
1.2 Objective and Scope of the Study ............................................................... 3
2. BACKGROUND ................................................................................................ 6
2.1 TEXTILE INDUSTRY ................................................................................... 6
2.1.1 Yarn Formation ................................................................................... 7
2.1.2 Fabric Formation ................................................................................. 8
2.1.3 Wet Processing ................................................................................... 9
2.1.3.1 Fabric Preparation ....................................................................... 11
2.1.3.2 Dyeing ....................................................................................... 14
2.1.3.3 Printing ...................................................................................... 14
2.1.3.4 Finishing .................................................................................... 15
2.2 TEXTILE WASTEWATERS ......................................................................... 15
2.2.1 Sources of Wastewater in Textile Industry .......................................... 16
2.2.2 Textile Wastewater Treatment ........................................................... 20
2.2.2.1 Replacement and Minimization ..................................................... 21
2.2.2.2 Optimization of Processes ............................................................ 22
2.2.2.3 Separation and Recycling ............................................................. 22
2.2.2.4 Final Treatment .......................................................................... 23
2.3 MEMBRANE PROCESSES .......................................................................... 25

xi
2.3.1 Principles of Membrane Processes ...................................................... 26
2.3.2 Pressure Driven Membrane Processes ................................................. 27
2.3.2.1 Microfiltration ............................................................................. 29
2.3.2.2 Ultrafiltration .............................................................................. 31
2.3.2.3 Reverse Osmosis and Nanofiltration ............................................. 32
2.3.3 Polarization Phenomena and Membrane Fouling .................................. 32
2.3.3.1 Concentration Polarization in Pressure Driven Processes ................ 32
2.4 CAUSTIC RECOVERY FROM MERCERIZING WASTEWATERS ....................... 33
3. MATERIALS AND METHODS .......................................................................... 36
3.1 Experimental Methods ............................................................................. 36
3.1.1 Characterization of the Wastewater .................................................... 36
3.1.2 Pretreatment Experiments ................................................................. 37
3.1.3 Caustic Recovery Experiments ............................................................ 39
3.1.3.1 UF Experiments .......................................................................... 39
3.1.3.2 NF Experiments .......................................................................... 41
3.1.3.3 Pilot Plant Studies ....................................................................... 42
3.2 Analytical Methods .................................................................................. 45
4. RESULTS AND DISCUSSION .......................................................................... 46
4.1 Wastewater Characterization .................................................................... 46
4.2 Pretreatment .......................................................................................... 49
4.3 Precipitation ............................................................................................ 55
4.4 UF Experiments ....................................................................................... 55
4.5 NF Experiments ....................................................................................... 61
4.6 Pilot Plant Studies ................................................................................... 71
5. SUMMARY .................................................................................................... 76
6. CONCLUSIONS ............................................................................................. 79
7. RECOMMENDATIONS ................................................................................... 81
REFERENCES ................................................................................................... 82
APPENDIX A .................................................................................................... 87

xii
LIST OF TABLES
Table 2.1 General characteristics of textile effluents (16) .................................... 17
Table 2.2 Evaluation of Various Technologies for the Treatment of Textile Effluents
(22) ................................................................................................................ 24
Table 2.3 Classification of membrane processes according to their driving forces
(29) ................................................................................................................ 26
Table 2.4 Comparison of various pressure driven membrane processes (30) ......... 28
Table 2.5 Two classes of polymeric membranes ................................................. 30
Table 3.1 General specifications of the MF membranes used ............................... 39
Table 3.2 Characteristics of membranes used in caustic recovery experiments ...... 41
Table 3.3 Applied operational conditions during NF studies .................................. 42
Table 3.4 Operating information of SelRO MPT-34 Pilot System ........................... 43
Table 3. 5 Treatment scheme and operational conditions of MPF-34 NF experiments
...................................................................................................................... 45
Table 4.1 General wastewater characteristics of washing stages of the denim
mercerizing processes ...................................................................................... 47
Table 4.2 Variable characteristics of mercerizing process final effluents ................ 47
Table 4.3 Clean Water Fluxes and Flux Declines from 5 and 10 µm PES membranes
...................................................................................................................... 54
Table 4.4 Steady state performance of GR95PP UF membrane at 4.03 bar TMP, 0.42
m/s CFV and 20 ± 20C ...................................................................................... 56
Table 4.5 Effect of TMP on UF process efficiency of GR95PP UF membrane at steady
state ............................................................................................................... 58
Table 4.6 Effect of CFV on UF process efficiency of GR95PP UF membrane at steady
state ............................................................................................................... 58
Table 4.7 Comparative performances of NP030 and NP010 NF membranes at steady
state ............................................................................................................... 62
Table 4.8 Comparison of the first rinsing tank effluents from indigo dyeing and
mercerizing processes of the textile mill ............................................................. 66

xiii
Table 4.9 Caustic recovery test results by SelRO MPT-34 pilot plant at TMP = 20 bar
...................................................................................................................... 72
Table 4.10 NF and MF+NF tests results with MPF-34 and MF-45 membranes at
steady state and 20 ± 20C ................................................................................ 74

xiv
LIST OF FIGURES
Figure 2.1 Typical textile processing flow chart ..................................................... 7
Figure 2.2 General fabric formation processes ...................................................... 8
Figure 2.3 Typical wet processing steps for fabrics ............................................. 10
Figure 2.4 Effects of mercerization [12] ............................................................. 12
Figure 2.5 Electron microscope image of mercerized cotton fibers in section
magnified x 2200 [12] ...................................................................................... 12
Figure 2.6 Electron microscope image of natural (untreated) cotton fibers in section
magnified x 2200 [12] ...................................................................................... 12
Figure 2.7 Flow structure of a textile plant with treatment options [17] ................ 20
Figure 2.8 Representation of a 3 stage evaporation system ................................. 35
Figure 3.1 General flow diagram of a denim mercerizing line ............................... 36
Figure 3.2 Computerized dead-end MF unit ........................................................ 38
Figure 3.3 DSS LabStak M20 Membrane Module ................................................. 40
Figure 3.4 SelRO MPT34 Pilot Plant set up in the mercerizing unit of the mill ........ 44 Figure 4.1 Particle size distribution of the mixed mercerizing wastewater ................ 49
Figure 4.2 Filtration results for 5 µm PVDF MF membrane (∆P = 0.925 bars) ......... 51
Figure 4.3 Filtration results for 10 µm PTFE MF membrane (∆P = 0.925 bars) ........ 51
Figure 4.4 Clean water and wastewater flux development for 5 µm PES MF
membrane (∆P = 0.925 bars) ........................................................................................... 52
Figure 4.5 Clean water and wastewater flux development for 10 µm PES MF
membrane (∆P = 0.925 bars) ........................................................................................... 53
Figure 4.6 2nd hour feed and permeate samples of UF process with GR95PP at 4.03
bar TMP, 0.42 m/s CFV and 20 ± 20C ............................................................................. 57
Figure 4.7 Effect of TMP on Flux for the GR95PP UF Membrane ................................. 59
Figure 4.8 Effect of CFV on Flux for the GR95PP UF Membrane ................................. 60
Figure 4.9 Comparison of GR95PP (UF), NP010 (NF) and NP030 (NF) membranes at
4.03 bars TMP and 0.79 m/s CFV at 20±20C for steady state ..................................... 63
Figure 4.10 Flux comparisons of GR95PP (UF), NP010 (NF) and NP030 (NF)
membranes at 4.03 bars TMP and 0.79 m/s CFV at 20±20C ....................................... 64

xv
Figure 4.11 Effect of CFV on NF permeate flux when TMP=4.03 bars at 20±20C .... 65
Figure 4.12 Effect of TMP on NF (NP010) permeate flux when CFV=0.79 m/s at
20±20C ................................................................................................................................. 67
Figure 4.13 Effect of TMP and CFV on NaOH recovery, Color and COD retentions at
steady state (membrane: NP010 and T = 20±20C) ...................................................... 68
Figure 4.14 Effect of temperature on permeate flux at TMP = 4.03 bars for CFV =
0.79 & 0.40 m/s .................................................................................................................. 70
Figure 4.15 Effect of temperature on NF retentions ...................................................... 71
Figure 4.16 SelRO MPT-34 Pilot system feeding tank coarse filtration unit ............... 73
Figure 4.17 Permeate flux variations with time of MPF-34 and MF-45+MPF-34 NF
processes at 20 ±2 0C ........................................................................................................ 75
xvi
ABBREVIATIONS
BOD Biochemical Oxygen Demand
CFV Cross Flow Velocity
COD Chemical Oxygen Demand
MF Microfiltration
MWCO Molecular weight cut-off
NF Nanofiltration
PES Polyethersulfone
PTFE Polytetrafluoroethylene
PVA Polyvinyl alcohol
PVDF Polyvinylidene fluoride
RO Reverse Osmosis
TDS Total Dissolved Solids
TMP Transmembrane pressure
TSS Total Suspended Solids
UF Ultrafiltration
Be Baume

1
CHAPTER 1
INTRODUCTION
1.1 General
Cloth has been the second main necessity of human being after food. Producing
fibers and then processing them to make clothes constitutes fundamental
milestones of the textile industry. This mandatory need makes the textile industry
develop faster through the ages with increasing population and living standards.
Therefore, the textile industry has taken its place near the largest export and import
markets of countries.
Turkey has been an important contributor to the World textile industry in terms of
both raw material and production since 16th and 17th centuries. Relations with the
European Union have influenced the Turkish textile industry positively and helped
Turkey to get its place among the World’s largest textile exporters.
Typically textile processing starts with yarn formation continues with fabrication of
this yarn and finally ends with dyeing and finishing stages. Dyeing and finishing
called as “wet processing” are the most important production phases of the textile
industry. Wet processes improve the value of fabric in appearance, durability and
serviceability considering consumer needs. However, these processes are
responsible for making the textile industry such a highly water and chemical
intensive sector. In a typical textile facility; 200-400 L of water is consumed to
produce 1 kg of fabric [1] and therefore large quantities of wastewaters are
generated.
Textile wastewaters are highly colored and mainly constitute inorganic and organic
contaminants at high concentrations [2]. Moreover these wastewaters are highly
variable in both quality and quantity as the textile industry is primarily dependent on
trends in product base. Therefore chemicals or additives used in processes shows
serious alterations with time. There are nearly 8000 coloring and 6900 additive

2
contaminants which contribute to organic and inorganic pollution in textile effluents
[3].
Textile companies often face shortage of water resources not only because of water
scarcity but also discharge limits [4]. These facts have shifted considerations toward
water saving and recovery alternatives for the textile industry [2], [3] and implied
that treating textile wastewaters in an end of pipe approach is unsuitable.
In general, it is accepted that membrane processes are realistic solutions for the
treatment of textile wastewaters targeting at recovery [5]. Traditionally used
methods (e.g. biological degradation with activated sludge) are insufficient not only
for obtaining the required water quality [4] but also for water and chemical
recovery.
Mercerization is one of the major finishing processes of cotton textile production
where caustic (NaOH) is the main chemical used. This process is generally applied
to increase dye affinity, luster and strength of fiber. Wherever it is applied,
mercerization process is followed by an intensive hot water rinsing or washing
process to remove excess caustic. As a result, a highly alkaline (60-70 g/L NaOH)
and relatively hot wastewater which includes various other organic and inorganic
impurities is generated.
Wastes from mercerizing processes bring problems of wastewater with a highly
alkaline content and high amount of caustic soda losses for textile mills [6].
However, there is an opportunity of recovering caustic from these wastewaters.
There are two types of caustic recovery methods from mercerizing wastewater in
practice. One of them is a staged evaporation technique which has been applied
since 1900 for both woven and nonwoven industries. This process provides
complete recovery of the caustic in the wastewater. Although there are good
examples of this system, it becomes unsuitable for some manufacturers due to
operational difficulties arising from wide range of chemicals applied. For example
surfactants which are used in almost all of the textile processes or its by-products
may results in foaming problems in boiling thanks. These problems have induced
the development of membrane based caustic recovery methods from mercerizing

3
wastewaters. Beside wider usage area of membranes in textile wastewater
treatment, it has proven its applicability in caustic recovery purposes also. Yet,
caustic recovery by membrane processes does not provide full recovery of the
caustic or NaOH existing in alkaline wastewaters. A caustic containing permeate that
is subjected to be a proceeding evaporation step, is produced from the feed to the
membrane recovery system.
UF is accepted as a caustic recovery method by membrane technology. Although it
has been applied for recovering caustic from mercerizing process effluents [7], it is
generally regarded as satisfactory for the removal of particles and macromolecules,
generally further treatment is needed for decolorization purposes. On the other
hand, NF is applicable for the separation of low molecular weight organic
compounds and divalent salts and hence for decolorization. It provides a particular
softening effect too [8]. This makes the usage of NF a better alternative for caustic
recovery purposes. In a few of recent investigations, NF has been applied
successfully to recover caustic from mercerizing process effluents from both cotton
and polyester fabric manufacturing [9], [10]. Although they have achieved
successful caustic recoveries, membrane performances were not assessed according
to any pollutant parameters such as COD or color removal. Moreover, only one type
of NF membrane was evaluated in both of these studies. In addition to all, due to
nature of the mercerizing processes, treatment options should also be evaluated in
high temperature conditions. However, none of these studies investigates the effect
of temperature on membrane performance.
1.2 Objective and Scope of the Study
The objective of this study is to evaluate caustic recovery from mercerizing
wastewaters by membrane processes with the ultimate goal of producing a caustic
stream at reusable concentrations (22% NaOH). After membrane separation, further
processing (evaporation) is to be applied using waste heat from stack gases for the
production of a caustic stream at the desired concentration. Therefore, the goal in
this investigation is to produce a purified caustic stream from mercerizing
wastewaters.

4
In the present study, for the purpose of caustic solution recovery, applicability of
membrane technology which is a new but becoming a prevalent technology in this
area has been investigated. With this intend, UF and NF processes have been
studied. Furthermore some pretreatment options prior to these membrane
processes were evaluated using finishing wastewater samples obtained from a
cotton textile mill.
The textile mill in which the present study weas conducted is one of the largest
textile producers in the World located in Kayseri-Turkey. Fiber and fabric production,
dyeing and finishing are the main processes of a textile production. The mill
performs all these production stages; such that 20.000 meters of fiber is produced
and 12 million meters fabric dyeing and finishing is applied in a year. Such a huge
production capacity constitutes an important environmental threat with high level of
water and chemical consumption. Caustic is one of the most frequently applied and
exhausted chemical by washing after dyeing and especially after finishing operations
in the mill. The two major cost items arising from caustic consumption are indicated
as the cost of caustic itself and also the cost of neutralization applied to this waste
during waste treatment. According to the mill, the estimated monthly total cost is
about US$ 250,000 and hence caustic solution recovery and reuse should be
investigated due to both environmental and also economical reasons.
This research strikes into caustic solution recovery from finishing wastewater
subject basically in 3 stages. In the first part of the study, caustic containing
wastewaters of the interested mill are characterized. By means of the
characterization study major sources of caustic discharge of the mill are revealed.
These sources are mainly the rinsing effluents after denim mercerization processes.
Effluents from these stages of production reach up to nearly 60 - 70 g/L NaOH
concentrations. Furthermore, they are highly colored (4000 – 10000 Pt-Co) and high
in temperature (40 – 500C). Stating from where and in which conditions the caustic
will be recovered, available techniques and researches conducted about alkaline
recovery is investigated. This study forms the second part of the study which has
accorded the advantage of setting the best alternative for recovering purpose for
the specified mill. Membrane processes have been decided to be the best alternative

5
for this mill. Because, recently, studies about chemical recovery and reuse are being
shifted to membrane processes due to the technological progress in this area.
Within the scope of the present study; first of all, several pretreatment alternatives
are tested for the specified wastewater. MF is evaluated primarily for the
pretreatment studies. Beside commonly used microfiltration membranes, different
kind of membranes which are known as highly durable to alkaline working
conditions are evaluated. In the light of pretreatment studies, UF process is studied
first to evaluate caustic solution recovery. Within the context of UF experiments
COD and color retentions are also evaluated beside the main purpose caustic
recovery. Considering the studies reported in the Literature in this area and also the
caustic recovery systems used in practice, evaluation of NF is considered necessary.
COD and color retentions by NF process beside caustic recovery are also evaluated.
Bearing in mind real operating conditions of mercerization operations, temperature
effect on these processes are also evaluated. After evaluating caustic recovery
performance of membrane processes under laboratory conditions, a pilot plant
study is also conducted. This study is carried out within the finishing unit of the mill
by means of a ready pilot plant manufactured by a membrane company to recover
caustic solution from the alkaline finishing effluents. Pilot plant studies were
cooperated with the mill itself and finally a performance evaluation of this system is
performed.

6
CHAPTER 2
BACKGROUND
2.1 TEXTILE INDUSTRY
The textile manufacturing is a comprehensive process which produces or process
fiber, yarn or fabric to generate clothes, home furnishing and industrial goods. A
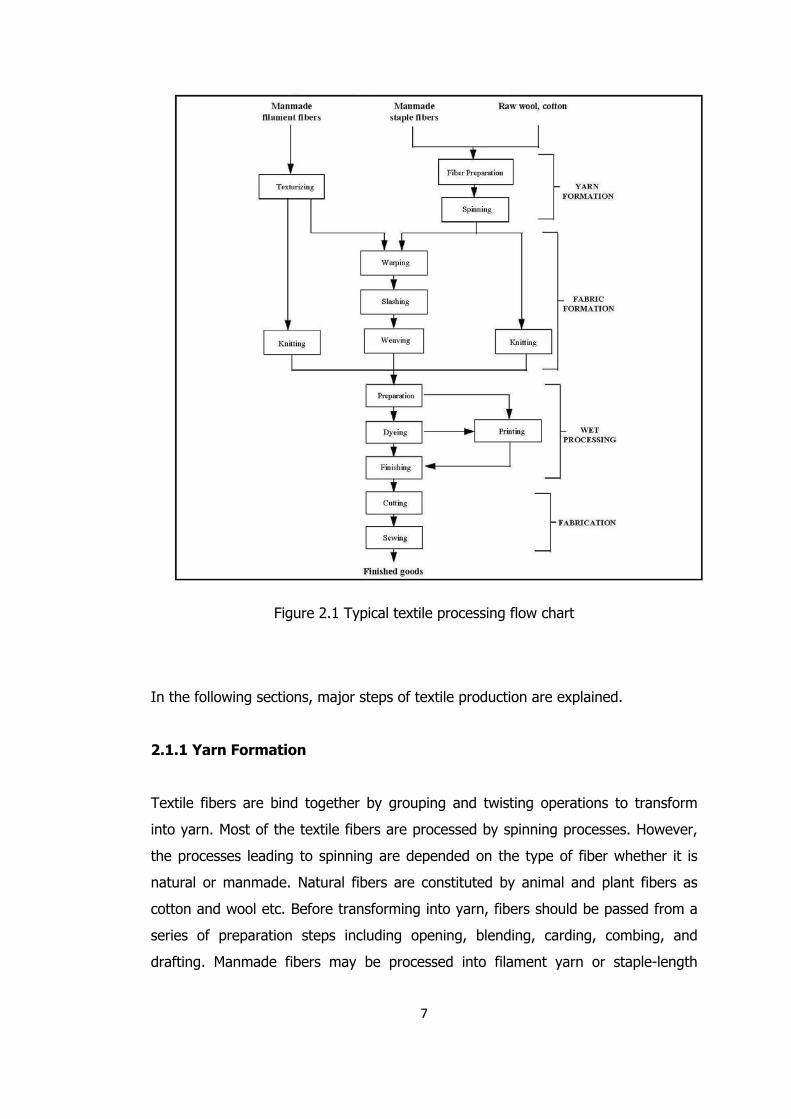
typical textile processing flow chart is given in Figure 2.1. As briefly described in
Chapter 1, in general, fibers are produced or received by textile mills. Then fibers
converted into yarns. After that yarn is transformed into fabric or related products;
and these produced materials are dyed and finished at various stages of production.
With this approach it can be summarized that textile industry includes mainly the
production of yarn, fabric, and finished goods [11].
7
Figure 2.1 Typical textile processing flow chart
In the following sections, major steps of textile production are explained.
2.1.1 Yarn Formation
Textile fibers are bind together by grouping and twisting operations to transform
into yarn. Most of the textile fibers are processed by spinning processes. However,
the processes leading to spinning are depended on the type of fiber whether it is
natural or manmade. Natural fibers are constituted by animal and plant fibers as
cotton and wool etc. Before transforming into yarn, fibers should be passed from a
series of preparation steps including opening, blending, carding, combing, and
drafting. Manmade fibers may be processed into filament yarn or staple-length

8
fibers (similar in length to natural fibers) so that they can be spun. Filament yarn
may be used directly or following further shaping and texturizing [11].
2.1.2 Fabric Formation
Weaving and knitting are the two major methods in fabric manufacturing. Fabric
formation processes for flat fabrics can be seen in Figure 2.2 [11].
Figure 2.2 General fabric formation processes
Weaving is one of the most common processes used to create fibers. By weaving
process, yarns are assembled together on a loom and a woven fabric is obtained.
Lubricants and oils can be used to lubricate the loom.

9
Knitting is also a mechanical process and by this process yarns are knotted together
with a series of needles. Mostly mineral oils are used to lubricate the needles and
machinery [6].
2.1.3 Wet Processing
Wet processes are the essential processes which prepare woven and knit fabrics for
being apparel or other finished goods. Therefore, these fabrics first should be
passed from some wet processing stages. Wet processing improves fabrics in terms
of appearance, durability, and serviceability. Wet processing mainly includes four
stages, which are fabric preparation, dyeing, printing and finishing, for converting
fabrics into finished consumers’ goods. These steps can be followed by the Figure
2.3 [11].

10
Figure 2.3 Typical wet processing steps for fabrics

11
2.1.3.1 Fabric Preparation
Pretreatment of fabric is mainly done for improving the wetting capacity and
adsorption, dye take-up capacity, purity of the fabric, to lighten and for better
material development [12]. According to the dyeing scheme, position of the
pretreatment can change. Moreover, the techniques used for pretreatment is
depended on the conditions of fabric, such as kind of fiber, form of fiber or amount
of fiber to be treated [6].
There are mainly five pretreatment processes; i) singeing, ii) desizing, iii) scouring,
iv) mercerizing, and v) bleaching. Singeing is a dry process which removes fiber
ends protruding from yarns or fabrics. This removal is provided by passing the fibers
over a flame or heated copper plates. If a smooth end product is desired, singeing
is an essential process. Desizing is another preparation step used to remove
previously applied sizing materials. Sizing should be applied before weaving and
knitting operations. However, for preventing the sizing materials react with
chemicals which are going to be applied in further processes, desizing is necessary.
In order to remove impurities from fibers or yarns, a cleaning process named as
Scouring is applied. Mainly alkaline solutions (sodium hydroxide), in some cases
solvent solutions are used in this process. Bleaching is also a chemical pretreatment
process to eliminate matters which effect whiteness adversely from fibers or yarns.
By several bleaching agents such as hydrogen peroxide and sodium hypochlorite
fibers or yarns are decolorized and prepared for dyeing or printing processes [11].
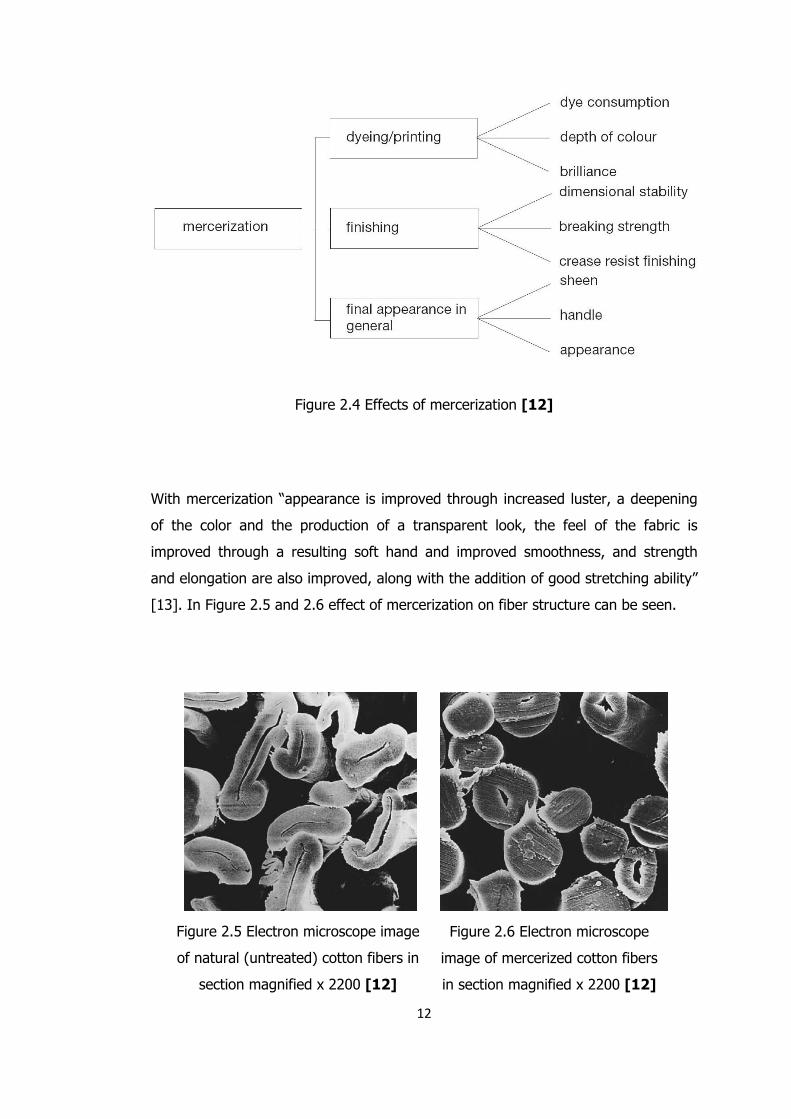
Mercerization is a kind of alkaline treatment applied for attaining a permanent
shining and good handling of cotton in both pretreatment and finishing steps of
production. Figure 2.4 shows in which production stages mercerizing is applied and
its effects on fabric.
12
Figure 2.4 Effects of mercerization [12]
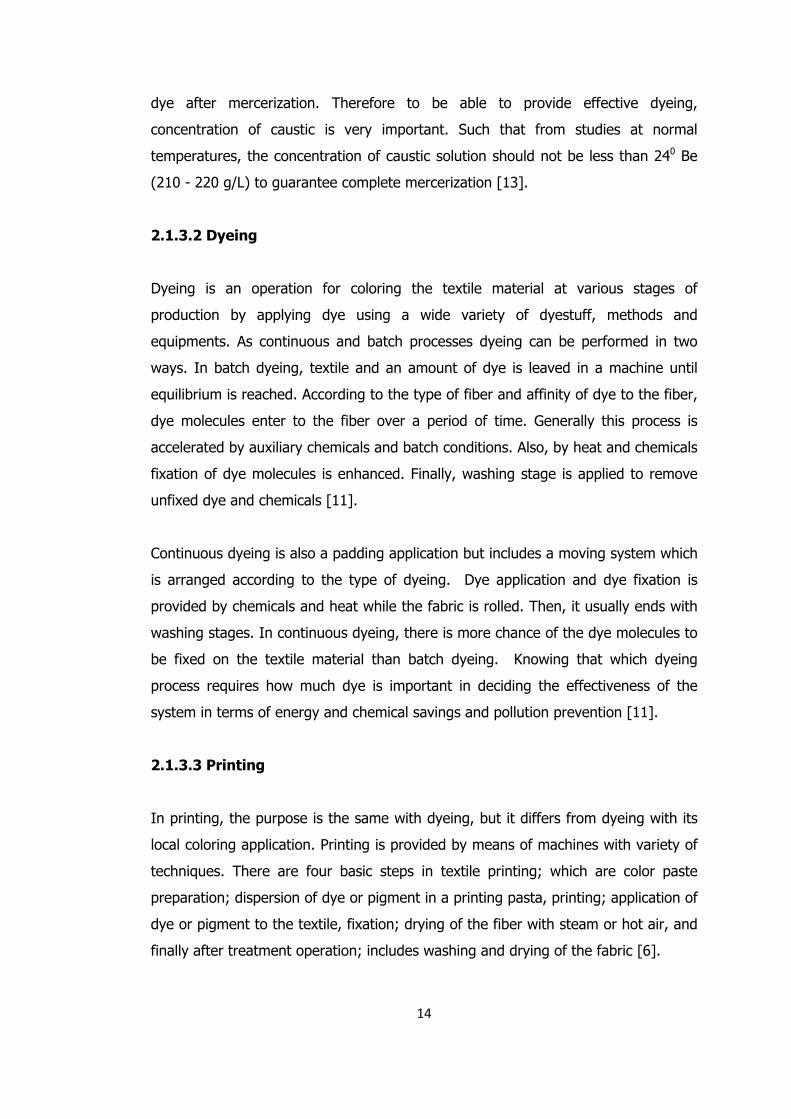
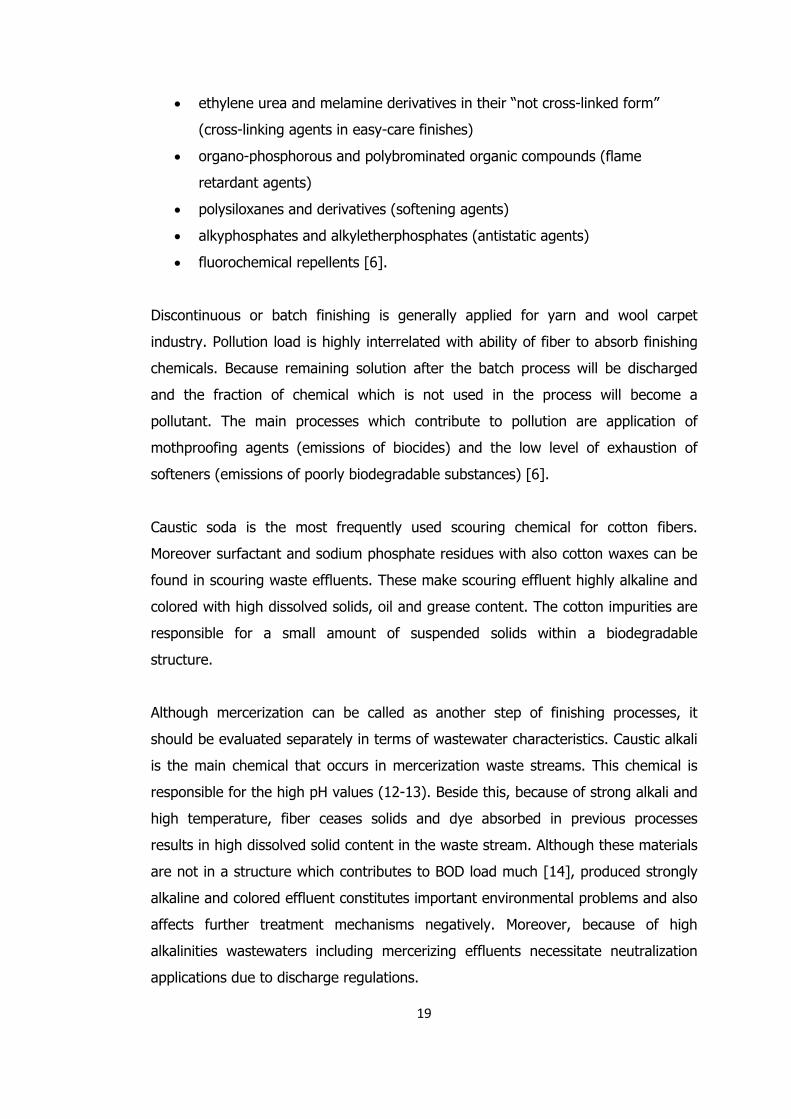
With mercerization “appearance is improved through increased luster, a deepening
of the color and the production of a transparent look, the feel of the fabric is
improved through a resulting soft hand and improved smoothness, and strength
and elongation are also improved, along with the addition of good stretching ability”
[13]. In Figure 2.5 and 2.6 effect of mercerization on fiber structure can be seen.
Figure 2.5 Electron microscope image
of natural (untreated) cotton fibers in
section magnified x 2200 [12]
Figure 2.6 Electron microscope
image of mercerized cotton fibers
in section magnified x 2200 [12]

13
There are mainly two methods for mercerizing of cotton fibers. Conventionally
mercerizing process is called as alkaline treatment because the fabric is treated with
sodium hydroxide (NaOH) in other words “caustic” solution. Mercerization with
caustic can be divided as mercerization with or without tension. Most commonly
fabric is treated by 270 - 300 g/L caustic solution under tension for less than 1 min.
In this common method temperature is tried to be kept between 5-180C, since the
reaction between caustic and fiber is exothermic. Furthermore caustic mercerization
can be applied at hot temperatures also. This method has an increasing usage area
in the field of cotton mercerization. In both of these methods tension is required.
However there is also another way for the application for caustic mercerization. In
this way caustic is applied without tension at 20 – 30°C temperature within lower
concentration caustic (145 – 190 g/L). This process is also called as slack
mercerization, causticizing or caustification [6], [12]. There is also another
mercerization technique with ammonia. Cotton in yarn or fabric formation is treated
by anhydrous liquid ammonia in ammonia mercerizing. Although its results are
similar to caustic mercerizing, it does not have a wide usage area [6].
In terms of chemical processes of mercerization following parameters are the most
important ones;
• Caustic concentration
• Provenance
• Machinery and ambient temperature
• Time period of application
• Tension
Concentration of caustic is the most important performance determinant parameter
of mercerization. There are optimum mercerization bath caustic soda concentrations
depending on many variables. However concentration is the most difficult parameter
that should be kept constant during operation. For example, when the mercerization
in fabric pretreatment step is considered, the amount of caustic applied is very
important for further dying process efficiency. Because caustic is one of the major
factor in mechanism of fibers to absorb dye molecules. With the advantage of high
affinity of caustic to fibers, it becomes more difficult to washout caustic and also
14
dye after mercerization. Therefore to be able to provide effective dyeing,
concentration of caustic is very important. Such that from studies at normal
temperatures, the concentration of caustic solution should not be less than 240 Be
(210 - 220 g/L) to guarantee complete mercerization [13].
2.1.3.2 Dyeing
Dyeing is an operation for coloring the textile material at various stages of
production by applying dye using a wide variety of dyestuff, methods and
equipments. As continuous and batch processes dyeing can be performed in two
ways. In batch dyeing, textile and an amount of dye is leaved in a machine until
equilibrium is reached. According to the type of fiber and affinity of dye to the fiber,
dye molecules enter to the fiber over a period of time. Generally this process is
accelerated by auxiliary chemicals and batch conditions. Also, by heat and chemicals
fixation of dye molecules is enhanced. Finally, washing stage is applied to remove
unfixed dye and chemicals [11].
Continuous dyeing is also a padding application but includes a moving system which
is arranged according to the type of dyeing. Dye application and dye fixation is
provided by chemicals and heat while the fabric is rolled. Then, it usually ends with
washing stages. In continuous dyeing, there is more chance of the dye molecules to
be fixed on the textile material than batch dyeing. Knowing that which dyeing
process requires how much dye is important in deciding the effectiveness of the
system in terms of energy and chemical savings and pollution prevention [11].
2.1.3.3 Printing
In printing, the purpose is the same with dyeing, but it differs from dyeing with its
local coloring application. Printing is provided by means of machines with variety of
techniques. There are four basic steps in textile printing; which are color paste
preparation; dispersion of dye or pigment in a printing pasta, printing; application of
dye or pigment to the textile, fixation; drying of the fiber with steam or hot air, and
finally after treatment operation; includes washing and drying of the fabric [6].

15
2.1.3.4 Finishing
Finishing is the final step in the textile production. It has the capacity of adding
some important features to the textile considering the end-use purposes. There are
two types of finishing processes which are mechanical and chemical finishing.
Physical treatments such as brushing or ironing are called as mechanical finishing
and help to increase the luster and feel of textiles [11]. Chemical treatments such
as easy-care, water-repellent, softening and flame retardant can bring in variety of
properties. Although finishing in general takes place after dyeing process, it can
change with production. While some finishing processes applied before dyeing,
some can take place within a dyeing process. Generally in many of chemical
finishing applications, the process is ended with drying, curing and cooling steps [6].
As discussed before, mercerization is one of the most frequently applied chemical
finishing processes. By means of mercerization at this stage of production, fabric
has been exposed to caustic second time. However purpose of mercerization at the
finishing stage is generally to provide some good handle properties. Since the yarn
or fabric at the finishing stage of production has been already processed by the
various pretreatment and treatment processes, the textile which is going to be
caustified is different. Therefore application method may differ from other
mercerizing operations.
2.2 TEXTILE WASTEWATERS
There are thousands of textile plants in the World which apply wet processes and
discharge large quantities of wastewater to the environment. These wastewaters
are either treated on site, or in municipal wastewater treatment plants. In some
cases, these wastewaters are discharged without treatment. The major pollutant
parameters in the textile wastewaters are solids, biochemical oxygen demand
(BOD), chemical oxygen demand (COD), nitrogen and phosphate, temperature,
toxic chemicals such as phenols, heavy metals, pH, alkalinity and acidity, oils and
grease, sulfides and coliform bacteria [14].

16
In the proceeding sections, wastewater generation in different textile manufacturing
stages is discussed.
2.2.1 Sources of Wastewater in Textile Industry
Weaving, dyeing, printing and finishing are the major textile production steps and
each of these produces waste in different characteristics. Although the process
effluents are the major waste sources, generalization of these wastes is highly
difficult. Because textile wastes are highly dependent on the processes and these
processes are frequently changing according to new demands [14].
Textile wastewaters can be described as colored, having high BOD and COD values
with high solids content and also as highly alkaline waters at high temperatures.
These are generated from mainly rinsing operations after production processes. In
textile processes 85% of the dyes and most of the auxiliary chemicals are removed
by the washing stages [15]. They include both fiber origin and processing chemicals
origin pollutants. Therefore, type of fibers, finishing operations, process chemicals
and recycle procedures are the main factor defines characteristics and amount of
wastewater. This makes the characterization and generalization of wastewaters
difficult for textile effluents [14]. Before giving detailed information about major
sources of textile wastewaters, general characteristics of textile effluents can be
summarized in Table 2.1.
Bleaching process is one of the major processes that generate effluents including
dissolved solids as inorganic and organics at small amounts. Cotton bleaching can
result some suspended solids in the effluent [14]. Furthermore, bleaching agents
such as caustic soda, hydrogen peroxide and sodium hypochlorite are the
responsible for highly alkaline effluents from this process.

17
Table 2.1 General characteristics of textile effluents [16]
Process Composition Nature
Sizing starch, waxes, carboxymethyl cellulose,
polyvinyl alcohol High in BOD and COD
Desizing
starch, glucose, carboxymethyl
cellulose, polyvinyl alcohol,
fats and waxes
high BOD, COD,
suspended solids,
dissolved solids
Scouring
caustic soda, waxes, grease, soda ash,
sodium silicate,
fibres, surfactants, sodium phosphate
dark coloured, high pH,
high COD,
dissolved solids
Bleaching
hypochlorite, chlorine, caustic soda,
hydrogen peroxide, acids, surfactants,
sodium silicate, sodium phosphate
alkaline, suspended solids
Mercerizing caustic soda high pH, low COD, high
dissolved solids
Dyeing various dyes, mordants, reducing
agents, acetic acid, soap
strongly coloured,
high COD,
dissolved solids, low
suspended
solids, heavy metals
Printing pastes, starch, gums, oil, mordants,
acids, soaps
highly-coloured, high
COD, oily appearance,
suspended solids
Finishing inorganic salts, toxic compounds slightly alkaline, low BOD
Desizing is another major waste generating process that produces both dissolved
and suspended solids including effluent also with oil and grease content. With this
contribution, desizing constitutes nearly half of the total solid load in the total textile
waste stream. As a treatment approach desizing wastewaters generally goes under
a separation process of sizing material from the effluent in a kind of recycle system.
With such a system, sizing material is extracted from rinsing water of the desizing
process, so that it can be reused. A hyperfiltration procedure can be applied for the

18
separation process. So that, undissolved part of the sizing material could be
departed from the degraded portion for concentrating and finally reusing it [14].
Dyeing relatively has a higher pollution load capacity in terms of both visible and
invisible pollutant content according to other production processes. In dyeing
processes, used various additives and complexing agents beside dyestuff material
under alkaline conditions at high temperatures generate high amounts of organically
and inorganically polluted waste streams. Dye preparation kitchen is one of the
emission sources of dyeing. With cleaning process of dye preparation tanks, a
discontinuous and low-concentrated wastewater is generated. Batch dyeing results
both continuous and discontinuous waste loads but at considerable concentrations.
Discontinuous waste load is generated during washing of dyeing tanks. However,
the rinsing operations after dyeing application produce continuous and also
concentrated effluents. Continuous dyeing has a lower pollution capacity than
discontinuous. Waste generation occurs when the dye baths are being drained or
rinsing tanks are being washed [6].
As discussed before there are two types of finishing methods which are mechanical
and chemical finishing. For mechanical finishing waste water emission is negligible.
However, chemical finishing has a substantial contribution on waste water
characteristic of textile mill. Like dyeing processes, there are different effects of
continuous and discontinuous finishing. Since there is not any washing application in
continuous finishing processes, the only chance of contribution to water pollution is
via system loses and machine cleanings. As predicted, the amount of waste is too
small, but the concentrations reach high values. Moreover, some of these wastes
can be non-biodegradable and toxic. According to the processes and chemicals
applied, type of pollutant differs. Some of the important pollutants produced in
finishing processes are as follows;
19
• ethylene urea and melamine derivatives in their “not cross-linked form”
(cross-linking agents in easy-care finishes)
• organo-phosphorous and polybrominated organic compounds (flame
retardant agents)
• polysiloxanes and derivatives (softening agents)
• alkyphosphates and alkyletherphosphates (antistatic agents)
• fluorochemical repellents [6].
Discontinuous or batch finishing is generally applied for yarn and wool carpet
industry. Pollution load is highly interrelated with ability of fiber to absorb finishing
chemicals. Because remaining solution after the batch process will be discharged
and the fraction of chemical which is not used in the process will become a
pollutant. The main processes which contribute to pollution are application of
mothproofing agents (emissions of biocides) and the low level of exhaustion of
softeners (emissions of poorly biodegradable substances) [6].
Caustic soda is the most frequently used scouring chemical for cotton fibers.
Moreover surfactant and sodium phosphate residues with also cotton waxes can be
found in scouring waste effluents. These make scouring effluent highly alkaline and
colored with high dissolved solids, oil and grease content. The cotton impurities are
responsible for a small amount of suspended solids within a biodegradable
structure.
Although mercerization can be called as another step of finishing processes, it
should be evaluated separately in terms of wastewater characteristics. Caustic alkali
is the main chemical that occurs in mercerization waste streams. This chemical is
responsible for the high pH values (12-13). Beside this, because of strong alkali and
high temperature, fiber ceases solids and dye absorbed in previous processes
results in high dissolved solid content in the waste stream. Although these materials
are not in a structure which contributes to BOD load much [14], produced strongly
alkaline and colored effluent constitutes important environmental problems and also
affects further treatment mechanisms negatively. Moreover, because of high
alkalinities wastewaters including mercerizing effluents necessitate neutralization
applications due to discharge regulations.

20
2.2.2 Textile Wastewater Treatment
Substances which are critical and hazardous for the environment are defined by the
regulations and strategies are proposed to minimize these substances. However,
these proposals have to be integrated into processes and production steps of textile.
Figure 2.7 explains the general treatment approach for a textile plant. It shows the
formation steps for a fabric to become a textile product. By the way, it gives an idea
about precautions and activities to prevent pollution. Legal prohibitions or cost
saving purposes of chemicals defines the type of precaution. Beside that the
treatment options can change according to the type of the product [17].
Figure 2.5 Flow structure of a textile plant with treatment options [17]
General approaches for the management of textile wastes can be grouped
according to sources and production stages of wastes. These management
approaches are;

21
• Replacement and minimization
• Optimization of Processes
• Separation and Recycling
• Final Treatment.
In the proceeding sections, the above-mentioned approaches are described in
detail.
2.2.2.1 Replacement and Minimization
Replacement and minimization can be taken as a primary treatment option for
hazardous chemicals and substances used in the textile industry. As a result
hazardous chemicals can be substituted with less hazardous ones, for example [17];
• Man-made fiber preparation agents with improved environmental
performance,
• Mineral oils substitution for wool and knitted fabrics,
• Selection of sizing agents with improved environmental performance,
• Minimizing sizing agent add-on by pre-wetting the warp yarns,
• Use of compact spinning like techniques allow reduced load of sizing agents,
• Minimizing residues of organochlorine, organophosphate and synthetic
pyrethroid ectoparasiticides in raw material by substitution,
• Selection of textile dyes and auxiliaries to their waste water relevance,
• Substitution for hazardous surfactants,
• Selection of biodegradable/bioeliminable complexing agents in pretreatment
and dyeing processes,
• Selection of antifoaming agents with improved environmental performance
[6].
Applying these replacement and minimization options not only decreases chemical
load of the total wastewater but also makes easier the further treatment
applications.
22
2.2.2.2 Optimization of Processes
Optimization applications during the production steps are another treatment option
for textile wastes. It is more economical and beneficial for the final treatment [17].
General processes for optimization can be given as follows;
• Chemical system evaluations
− Solution preparation system evaluations
− Water pre-treatment studies
• Auxiliary process optimization
− Heat exchanger temperature optimization
− Hot water/steam system analysis
− Compressed air analysis
• Product flow optimization
• Process simplification
• Energy conservation audits
− Thermal efficiency of process piping and vessels
− Plant-wide energy use profiling
− Water reuse studies [18]
2.2.2.3 Separation and Recycling
Separation and recycling is the final option before treatment application. Although
textile industry is one of the most water and chemical consumer, it also has the
highest capacity for intensive water recycling approaches and chemical recovery
options [19]. Both limits about water resources and also regulations make recycling
process essential for industries [20].
During the processes like dyeing, printing or finishing variant chemical is added to
the textile material. Types and amount of dyes, detergents, sulphide, compounds,
solvents, heavy metals and inorganic salts changes drastically composition of
wastewater [19]. High amount of these chemicals are released at the rinsing stages
and conveyed to the general waste treatment plant. Activated sludge system is
commonly applied for textile wastewaters. However effluent quality from these

23
plants does not meet reuse criterion. Moreover, there is a risk that high amount of
persistent pollutants remains untreated with biological systems [21]. As a result,
any kind of separation and recycling will not only provide conservation of resources,
but it will also improve performance of further treatment units [22]. Some examples
of separation and recycling are as follows;
Waters that do not expose to pollution can be directly reused; for example, system
cooling waters;
• countercurrent washing of textile; for example, rinsing processes,
• treatment of wastewater from one source for reuse in another process,
• recycling of materials, by-products or energy in the same process,
• total wastewater treatment and its reuse [1].
2.2.2.4 Final Treatment
Whatever intermediate process is applied, remaining wastewater has to be
discharged to a receiving body. Therefore, in order to obey the discharge limitations
final wastewater treatment is applied. There are different final treatment options for
textile wastewaters. With detergents, enzymes, dyes, acids, sodas and salts
contents these wastes are highly variable in strength and quantity depending on the
mill [23]. As aerobic or anaerobic, biological treatment is the most applied treatment
process in textile industry. Moreover in order to increase efficiency physical and
chemical treatments such as adjustment of pH, temperature, sedimentation, and
flocculation are applied [17]. General textile wastewater treatment methods and
their efficiencies are summarized Table 2.2.

24
Table 2.2 Evaluation of Various Technologies for the Treatment of Textile Effluents
[22]
Process Stage Performance Limitations
Fenton oxidation Pre-treatment
Full decolorization; low
capital and running
costs
Electrolysis Pre-treatment Full decolorization;
cheap
Foaming and
electrode lifespan
Foam
flotation Pre-treatment
Removes 90% color
and 40% COD; cheap,
compact
Membrane
Filtration
Main-or post-
treatment
High performance;
reuse of water, salts,
and heat
Handling and
disposal of
concentrate stream
Biodegradation
- Activated sludge
- Sequential
anaerobic aerobic
- Fixed-bed
Main
treatment
Main
treatment
Main
treatment
Removes bulk COD, N
Better removal of COD,
color, and toxicants
Better removal of COD,
color
High residual COD,
N, color, surfactants
High residual color
and COD
Coagulation
Flocculation
Pre, main or
post
treatment
Full decolorization;
water reuse
Not always
effective; sludge
disposal
Fungi/H2O2 Main
treatment Full decolorization
O3 Post-
treatment
Full decolorization;
water reuse
Expensive;
aldehydes formed
Sorption (carbon,
clay, biomass)
Pre-or post
treatment
New sorbents are
effective and cheap;
water reuse
High disposal or
regeneration costs
Photocatalysis Post-
treatment
Near-complete color
removal; detoxication
Only as final
polishing step

25
Among these treatment alternatives membrane processes that are used in this
thesis are explained in the following section.
2.3 MEMBRANE PROCESSES
Membrane processes have been used in treatment of textile wastewaters for a long
time. They have proven their applicability for the variable and strongly polluted
textile industry effluents. Moreover, membrane processes are being applied for
recovery purposes in textile industry. Currently, there are many applications of
membrane systems for chemical and water recoveries such as size, caustic or indigo
dye recovery [7].
Choosing the appropriate membrane system and technology for the specific
wastewater is an important issue. However, if the previous studies about textile
industry are investigated, generally a kind of pretreatment method is applied before
membrane unit. Beside that pretreatment is necessary and also more efficient with
respect to chemical cleaning for preventing and detaining fouling mechanism in
further membrane operations [24]. By pretreatment performance of the membrane
is improved and less operational costs are achieved. Especially due to high solids
content of the textile wastewaters membrane fouling is unavoidable if pretreatment
is not applied [25]. Therefore to prevent membrane fouling and also deterioration
pretreatment is necessary [8], [26].
Membrane is a kind of tool for separation of two phases or chemicals in a selective
attitude. Although membranes are thought to be a newer separation method, it has
a wide application area with continuing improvements. Currently there are variable
membranes with different structures such as homogenous or heterogeneous,
symmetric or asymmetric, solid or liquid, positive, negative or neutral charge. With
this discrepancy transport phenomenon within these membranes can be affected
with variety of conditions such as pressure or temperature gradient or electrical field
or concentration [27].
Today water sources are more limited and valuable. This makes industries the
highest raw water consumers use their sources much more efficiently. Current
26
investigations show that treating wastewaters generated from processes for its
reuse instead discharging to the waste stream is the best option for industries.
Pressure driven membrane processes are more satisfying than the classical
techniques for reuse and recovery purposes [28].
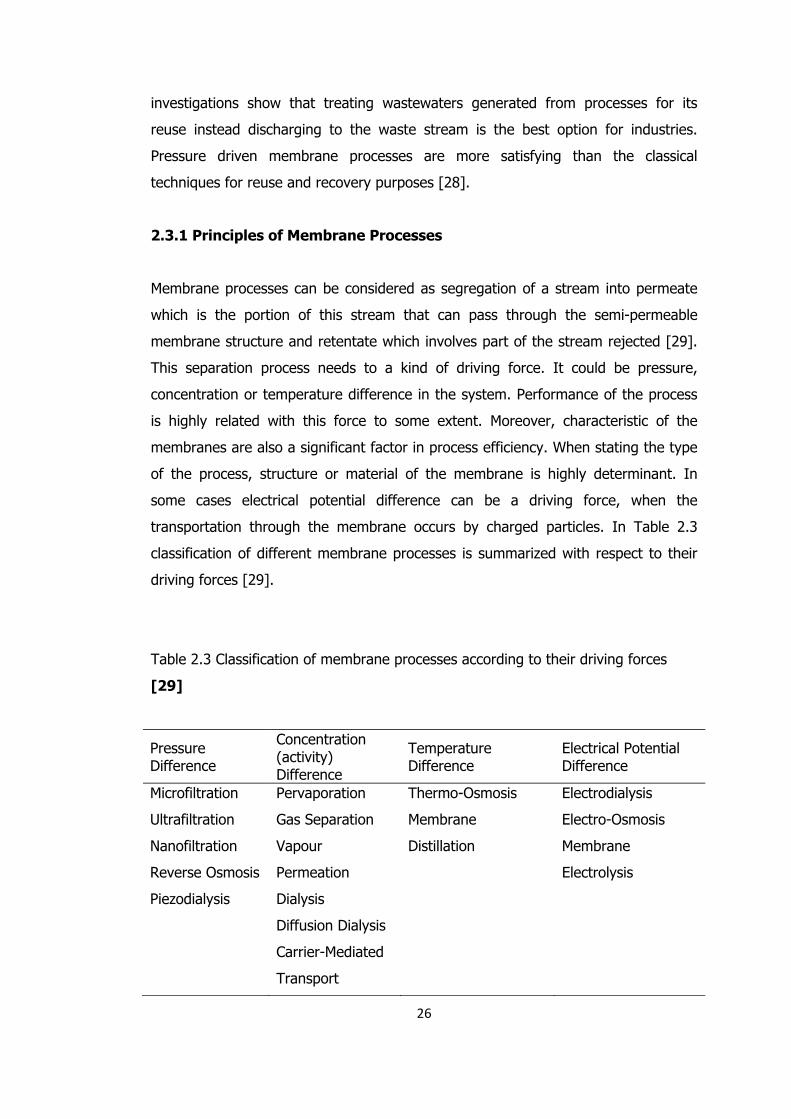
2.3.1 Principles of Membrane Processes
Membrane processes can be considered as segregation of a stream into permeate
which is the portion of this stream that can pass through the semi-permeable
membrane structure and retentate which involves part of the stream rejected [29].
This separation process needs to a kind of driving force. It could be pressure,
concentration or temperature difference in the system. Performance of the process
is highly related with this force to some extent. Moreover, characteristic of the
membranes are also a significant factor in process efficiency. When stating the type
of the process, structure or material of the membrane is highly determinant. In
some cases electrical potential difference can be a driving force, when the
transportation through the membrane occurs by charged particles. In Table 2.3
classification of different membrane processes is summarized with respect to their
driving forces [29].
Table 2.3 Classification of membrane processes according to their driving forces
[29]
Pressure Difference
Concentration (activity) Difference
Temperature Difference
Electrical Potential Difference
Microfiltration
Ultrafiltration
Nanofiltration
Reverse Osmosis
Piezodialysis
Pervaporation
Gas Separation
Vapour
Permeation
Dialysis
Diffusion Dialysis
Carrier-Mediated
Transport
Thermo-Osmosis
Membrane
Distillation
Electrodialysis
Electro-Osmosis
Membrane
Electrolysis

27
2.3.2 Pressure Driven Membrane Processes
The common feature of all pressure driven membranes is the pressure difference
that is used to passing solvent through the membrane to differentiate it into
permeate and retantate or concentrate. In various pressure driven membrane
processes purpose is both concentrating and purifying a dilute solution. During this
filtration process retained soluble or insoluble content is depended on the
membrane properties which are defined according to solute characteristics. For
example particle size or chemical properties of solute states the required membrane
pore size.
Pressure driven membranes can be classified as microfiltration (MF), ultrafiltration
(UF), nanofiltration (NF) and reverse osmosis (RO) according to characteristics of
the membrane, size and charge of the retained particles and pressure exerted on
the membrane [29]. When we compare these processes pore size of the membrane
decreases from ultrafiltration to reverse osmosis. As a result size of the particle
retained by the membrane gets smaller also. However, as the pore size decreases,
required pressure gradient increases because of higher resistances. As discussed
before structure of the pressure driven membrane shows discrepancies such as
most microfiltration membranes are in asymmetric structure build up with a top
layer thickness in the order of 1 µm. Whereas ultrafiltration, nanofiltration and
reverse osmosis membranes have an asymmetric as well with a thin, relatively
dense toplayer (0.1 – 1.0 µm) supported by a porous substructure (≈ 50-150 µm)
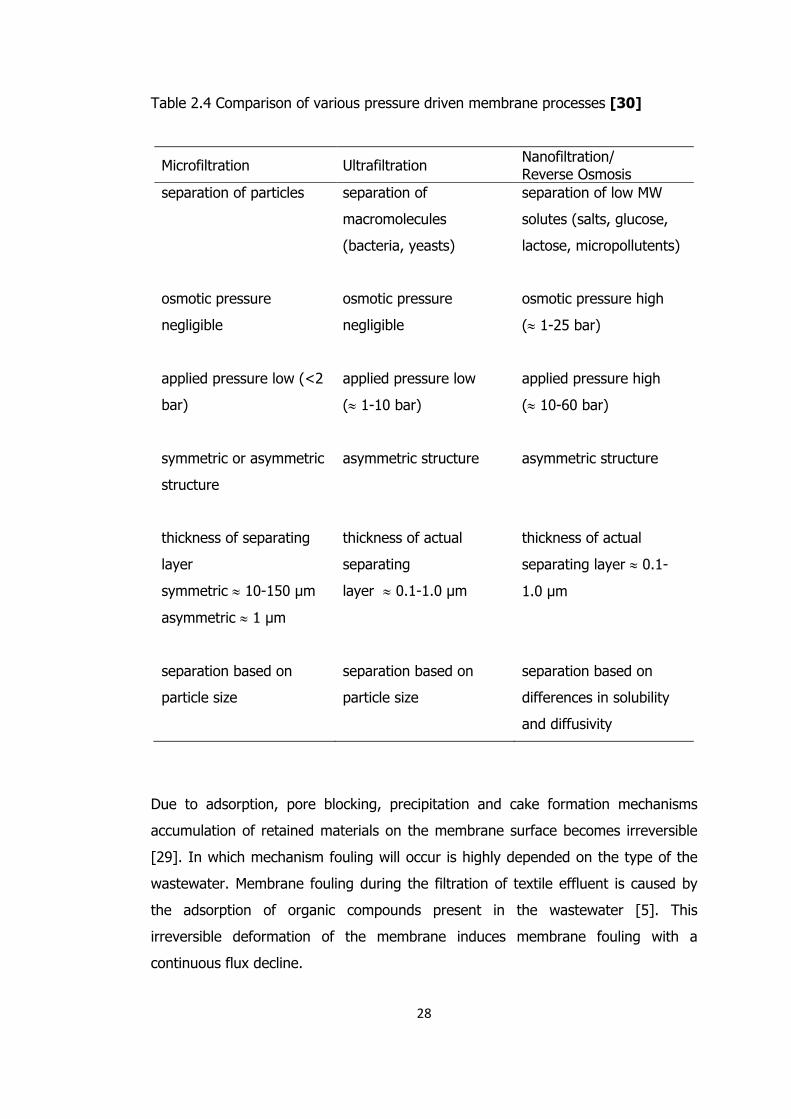
[29]. In Table 2.4, comparison of the pressure driven membranes is summarized.
28
Table 2.4 Comparison of various pressure driven membrane processes [30]
Microfiltration Ultrafiltration Nanofiltration/ Reverse Osmosis
separation of particles
separation of
macromolecules
(bacteria, yeasts)
separation of low MW
solutes (salts, glucose,
lactose, micropollutents)
osmotic pressure
negligible
osmotic pressure
negligible
osmotic pressure high
(≈ 1-25 bar)
applied pressure low (<2
bar)
applied pressure low
(≈ 1-10 bar)
applied pressure high
(≈ 10-60 bar)
symmetric or asymmetric
structure
asymmetric structure
asymmetric structure
thickness of separating
layer
symmetric ≈ 10-150 µm
asymmetric ≈ 1 µm
thickness of actual
separating
layer ≈ 0.1-1.0 µm
thickness of actual
separating layer ≈ 0.1-
1.0 µm
separation based on
particle size
separation based on
particle size
separation based on
differences in solubility
and diffusivity
Due to adsorption, pore blocking, precipitation and cake formation mechanisms
accumulation of retained materials on the membrane surface becomes irreversible
[29]. In which mechanism fouling will occur is highly depended on the type of the
wastewater. Membrane fouling during the filtration of textile effluent is caused by
the adsorption of organic compounds present in the wastewater [5]. This
irreversible deformation of the membrane induces membrane fouling with a
continuous flux decline.
29
In order to have better process designs, amount of flux decline due to fouling
mechanisms should be evaluated. However, fouling depends on variety of chemical
and physical parameters such as concentration, temperature, pH, ionic strength and
specific interactions. Therefore, fouling mechanism is not an easily definable issue.
Concentration polarization is another phenomena cause flux decline during
membrane processes. It occurs due to higher concentrations at the membrane
surface due to rejected material accumulation than bulk solution [31].
2.3.2.1 Microfiltration
MF is a low-pressure cross-flow membrane process which is for separating colloidal
and suspended particles in range of 0.05-10 microns. It is generally used for
clarification purposes and similar to conventional coarse filtration [32]. In terms of
process efficiency; high porosity and narrow pore size distribution for microfiltration
membranes are better.
Although MF membranes can be prepared from many types of materials such as
polymers or inorganic materials; they are generally made from a thin polymer film
with a uniform pore size and a high pore density of approximately 80% [33]. There
are two types of synthetic polymeric membranes as hydrophobic and hydrophilic
polymeric membranes. Some of the hydrophobic and hydrophilic membranes can be
seen in Table 2.5. Furthermore, pore size in MF membranes can be controlled
better by inorganic membranes which show high chemical and thermal resistance
[29].

30
Table 2.5 Two classes of polymeric membranes
Hydrophobic Polymeric Membranes Hydrophilic Polymeric Membranes
Polytetrafluoroethylene (PTFE, teflon)
Poly(vinylidene fluoride) (PVDF)
Polypropylene (PP)
Polyethylene (PE)
Cellulose esters
Polycarbonate (PC)
Polysulfone/poly(ether sulfone)
(PSf/PES)
Polyimide/poly(ether imide) (PI/PEI)
(aliphatic) polyamide (PA)
Polyetheretherketone (PEEK)
Flux decline is a common problem for MF applications mainly due to concentration
polarization and fouling mechanisms. In order to decrease the flux decline, selection
of membrane process is important. There are two types of microfiltration application
which are dead-end and cross-flow filtration. Dead-end operation is a more common
microfiltration application. In this process feed flow is perpendicular to the
membrane surface. This creates a filter cake on the membrane surface due to
accumulation of particles with time. As the thickness of this cake layer increases,
rate of the permeate flux decreases. This situation necessitates cleaning or
replacement of the membrane. In cross-flow operation, forming of cake layer is
reduced to some extent. In this process feed flows parallel to the membrane
surface. By means of driving force filtered particles forms permeate. Meanwhile
species which cannot pass through the membrane surface forms retantate stream of
the process. This part of the stream can also be further treated. Moreover
adsorption on the membrane surface is an important problem in terms of fouling.
Therefore selection of membrane material gets more important. For example
hydrophobic membranes have more chance of fouling due to their non-wettability
property. As a result flux decline and fouling in microfiltration processes cannot be
exactly prevented. This makes a chemical cleaning unavoidable.
In many industrial applications, for large particle (> 0.1µm) filtration requirements
microfiltration is preferred. Today, dead-end operation is the most widely applied

31
technique. For large scale industries cross-flow microfiltration systems are used
[29].
2.3.2.2 Ultrafiltration
UF constitutes the membrane process between MF and NF. UF is used to separate
lower molecular weight particles from the macromolecules with a membrane pore
size of 0.001 – 0.5 µm. Although MF and UF have the same filtration principle, UF
differs from microfiltration with its structure. UF membranes have an asymmetric
structure with a much denser top layer. This structure results a higher
hydrodynamic resistance. As microfiltration, polymeric materials are preferred more
for UF membranes. UF membranes are chosen in variety of industry for the
separation of high molecular components from low molecular ones. Some of UF
membrane materials are listed below.
• Polysulfone/poly(ether sulfone)/sulfonated polysulfone
• Poly(vinylidene fluoride)
• Polyacrylonitrile (and related block-copolymers)
• Cellulosics (e.g. cellulose acetate)
• Polyimide/poly(ether imide)
• Aliphatic polyamides
• Polyetheretherketone [29]
When selecting suitable UF membrane, cut-off becomes an important parameter.
Cut-off is the molecular weight which is 90% rejected by the membrane. However
cut off parameter as alone is not enough to determine the separation characteristics
of membrane. Shape and flexibility of the molecules in the solute and their
interaction with membrane material should be taken into consideration.
Concentration polarization and fouling is also important performance indicator for
UF process. Therefore chemical and thermal resistances of the membrane materials
become a serious matter. Furthermore physical conditions such as membrane
process system design affect the fouling event [29].
32
2.3.2.3 Reverse Osmosis and Nanofiltration
NF and RO are basically similar processes by which low molecular solutes such as
inorganic or small organic solutes are separated from solvents. Much denser and
hydrologically resistant membranes are used. This structure requires more pressure
gradients. The pressure used in the reverse osmosis range from 20 to 100 bars and
in NF from about 10 to 20 bars [29]. In NF membrane material is much more
related to process efficiency than MF and UF.
Generally NF membranes have MWCO between 200 and 1000. Whereas reverse
osmosis membranes have denser MWCO values about 100. Despite this, both of
these semi-permeable membranes do not have definable pores [34]. Although they
are both pressure driven systems, reverse osmosis has a better efficiency in terms
of separation of dissolved substances.
2.3.3 Polarization Phenomena and Membrane Fouling
Membrane performance is the primary factor for the separation process efficiency.
Several mechanisms such as adsorption, gel layer formation or plugging of the
pores can affect membrane performance. Concentration polarization and fouling
phenomena are the most prevailing determinants of this performance. In order
proceed the system in an efficient and economic way, measures should be taken.
However it is better to evaluate concentration polarization and fouling separately
[29].
2.3.3.1 Concentration Polarization in Pressure Driven Processes
From the nature of the filtration process, while permeable part of the solvent passes
through the membrane another stream permeate starts to be formed. Concentration
of this accumulation increases as the process continues. As a result concentration
polarization phenomenon which is the result of convection and back diffusion from
the membrane surface is constituted [30].
33
Due to concentration polarization the retention could be lower than it is expected.
By the way in the presence of macromolecular particles, concentration polarization
could have a positive effect on retention of low molecular solutes. Furthermore the
negative effect of polarization on the flux is unavoidable due to additional resistance
to the driving force [29].
2.4 CAUSTIC RECOVERY FROM MERCERIZING WASTEWATERS
In textile production as mentioned before various chemicals and additives are used
to process fibers for improving process efficiency or providing some features to the
fibers. Basic chemicals used in textile processing are alkali, acids, salts and solvents
[35]. There are various techniques used for the separation of these valuable
materials from wastewater by membrane filtration, chemical precipitation, and
adsorption by activated carbon and evaporation. Among these membrane
applications are the only one separates impurities without any chemical addition [9].
There are many examples of recovery and reuse applications of chemicals due to
environmental and economical reasons.
Porter has conducted a study about the recovery of polyvinyl alcohol (PVA) and hot
water from textile wastewater [15]. In this study, membrane based methods to
recover PVA which is one of the sizing process chemicals used in high amounts were
examined. Moreover, it has been emphasized that by recovering PVA, due to the
cleaning affect of membrane operation, hot process wastewater effluent will be also
reusable.
Eun Jong Son has implemented two different studies about recovery of caustic soda
from mercerizing of cotton [9] and polyester fabrics [10]. In both of the studies NF
process with SelRO MPT-34 membrane module of Koch Membrane Company has
been used to separate caustic from wastewater. Quality of feed and permeate, flux
behavior and caustic recovery were the main performance evaluation parameters of
these studies. In conclusion, although the systems used for membrane operations
differ in capacities, they have achieved caustic recoveries between 86 – 96 %.

34
Schlesinger has implemented a study about the evaluation of different NF and UF
membranes for the separation of hemicelluloses from the viscose fiber production
process liquors [36]. All of these membranes used to evaluate recovery potential are
polyethersulfone based membranes. Since the wastewater containing hemicelluloses
is highly alkaline (200 g/L NaOH) and high in temperature, membranes used in the
study were chosen as stable to these difficult operating conditions. In conclusion, it
has been stated that all the membranes tested have achieved successful separation
of hemicelluloses and caustic.
Caustic is one of the most frequently used chemical in the textile industry for dyeing
and especially finishing purposes. As discussed before due to harmful effects when
disposed to environment and economical reasons caustic should be recovered.
Caustic recovery becomes economic when caustic use exceeds 11,300 tons per year
of 100% cotton goods or 22,700 tons per year of 50/50 cotton polyester fabrics
[37]. Therefore for the big textile mills which apply wet processes and especially
mercerization caustic recovery is highly recommended.
There are two types of alkali recovery techniques;
• Caustic recovery by evaporation
• Caustic recovery by membrane technology
Rinsing waters from washing stages of caustification process can be recovered by
evaporation technique. Caustic in rinsing water does not have high concentrations
(40 - 50 g NaOH/L) to be reused in the process. With a multi staged evaporation
technique weak caustic can be concentrated up to reusable values. After
concentrating caustic soda it should be purified. Depending on the process from
which caustic is going to be recovered by simple sedimentation or
oxidation/flotation with injection of hydrogen peroxide purification can be provided.
In Figure 2.5 an example of a three stage evaporation process can be seen [6].

35
Figure 2.6 Representation of a 3 stage evaporation system
Evaporation method has the disability of recovering contaminated caustic solutions.
Although there are various techniques for recovery of water and chemicals,
membrane filtration has the capability of recovering raw materials by eliminating
impurities without need of additional chemicals [9]. In salt and alkali recovery area
NF systems are successful for separation of water, sodium hydroxide and
monovalent ions from large organic compounds [10]. Membrane systems have an
increasing tendency to be applied in textile alkaline recovery purposes. The same
waste stream with evaporation is applied to membrane system. There are various
membrane systems which provide 100% caustic recovery. After application of
membrane filtration, pure and concentrated caustic soda is obtained. However
recovered concentration is not enough to be reused in the process again. Therefore
membrane systems are generally supported by a following evaporation unit to
increase concentration of the caustic soda up to reusable values. However, due to
nature of the process and extreme corrosiveness of caustic soda solutions makes
membrane operation more difficult [36]. As a result resistant membranes should be
preferred for caustic recovery purposes.

36
CHAPTER 3
MATERIALS AND METHODS
3.1 Experimental Methods
3.1.1 Characterization of the Wastewater
Experimental studies started with the characterization of the caustic wastewater
that originates from mercerization processes. As indicated before, there are a
number of different mercerizing lines in the plant, of which two most commonly
used are Over-Dye and Pad-Steam. Throughout the study, several samples were
taken from Flat-Optic process of these two caustic discharging mercerizing lines of
the mill to characterize caustic mercerizing effluents. Commons schematic
representation of these mercerizing lines is given in Figure 3.1.
Figure 3.1 General flow diagram of a denim mercerizing line
Caustic effluents are generated from each post-rinsing or washing tanks and they
together form the total wastewater of that mercerizing processing line. Therefore,
sampling was done for both rinsing tanks effluents separately and for the total

37
discharge channel. At the inlet of discharge channel, the plant uses a coarse drum
filter so the sampling was done on the effluent from this filtration stage. These
samples collected were analyzed in terms of some general water quality parameters
such as pH, conductivity, TSS, TDS, COD, color, alkalinity, turbidity and NaOH
content. Based on the results of these characterization studies, wastewater
discharge locations of mercerizing units where further treatability studies will be
conducted have been defined.
3.1.2 Pretreatment Experiments
Within the context of pretreatment evaluations flocculation, centrifugation and MF
processes were applied. In flocculation, 500 mL glass beakers were employed with a
conventional jar-test apparatus (Aqua Lytic, Germany). In these batch tests,
wastewater samples taken from the first two rinsing tank effluents of the
mercerizing machinery were mixed and placed in jars and mixed slowly at 30 rpm
for 45 min at room temperature (20±20C).
Considering the results obtained from flocculation experiments, the application of
centrifugation as pretreatment was evaluated. Caustic wastewater samples taken
from the first two rinsing tank effluents of the mercerizing machinery were mixed
and centrifuged at 2500 rpm for 30 min by a Hettich Universal, USA centrifugation
device. In both of these pretreatment alternatives, settleability of highly alkaline
mercerizing wastewaters were experienced.
MF experiments were applied at two stages. At the first stage, a dead-end
conventional vacuum filtration unit operated at 25 in Hg vacuum level was used. In
order to evaluate filterability of the wastewater, different pore sized; 1.2, 8 and 20-
25 µm cellulose acetate microfiltration membranes were applied at room
temperature (20±20C) and the wastewater samples taken from the first two rinsing
tank effluents of the mercerizing machinery were mixed and utilized. At the second
stage of the MF studies, a computer based controlled filtration unit was used for
filtering the same wastewater sample. The system was also a dead-end operated
unit as schematically represented in Figure 3.2.

38
Figure 3.2 Computerized dead-end MF unit
In addition to the MF membranes given above, by taking the wastewater
characteristics into consideration, alternative MF membranes which are much more
durable to difficult alkaline and thermal conditions were evaluated. For this purpose
5 and 10 µm pore sized PTFE and PVDF membranes were applied at room
temperature (18±2°C). With further researches PES found as the most suitable
membrane material for caustic recovery purposes. After that 5 and 10 µm pore
sized PES membranes were obtained and their performances were tested at the
same system and conditions. All of the used membranes used throughout the study
and their specifications are summarized below in Table 3.1.

39
Table 3.1 General specifications of the MF membranes used
Filter Material Pore Size (µm)
Effective Membrane Area (m2)
Maximum Operating
Temperature (0C) Whatman 41 Cellulose Acetate 20-25 1.7x10⁻³ -
SCWP04700 Nitrocellulose 8 1.7x10⁻³ 75
RAWP04700 Nitrocellulose 1.2 1.7x10⁻³ 75
LCWP04700 Unsupported
PTFE 10 1.7x10⁻³ 260
SVLP04700 PVDF 5 1.7x10⁻³ 85
S50WP320F5
S99WP320F5 PES 5 and 10 1.7x10⁻³ 130
3.1.3 Caustic Recovery Experiments
Throughout the caustic recovery studies cross-flow UF and NF tests were carried
out.
3.1.3.1 UF Experiments
In UF experiments, non pretreated but coarsely filtered wastewater samples were
used. Prior to UF, wastewater samples were passed through a 500 µm pore sized
metallic strainer for coarse filtration purposes. Based on the experience gained
during pretreatment tests, it was decided to use a PES structured UF membrane in
this part of the study. General specifications of the chosen membranes for UF tests
can be seen in Table 3.2.
UF experiments were performed in total-recycle mode in a cross-flow plate and
frame module, DSS LabStak M20 membrane filtration system (Figure 3.3) with a
total membrane area of 0.036 m2. In this operation mode, both permeate and
retentate are recycled back to the feed tank. The membrane filtration system is
equipped with a temperature controlling mechanism; so that during filtration
operation temperature is kept constant at 18±20C within the filtration module. The

40
filtration module owns a 6 – 6.5 L feed tank volume and also 2 – 2.5 L in the tubes
of installation.
Figure 3.3 DSS LabStak M20 Membrane Module
Throughout the experiments, permeate flow rate was recorded manually to monitor
permeate flux. This was continued until a steady permeate flux rate was reached. In
addition, in order to evaluate the system performance COD, color, pH, conductivity
and NaOH content parameters were measured both in feed and permeate samples
taken at different time intervals of the membrane operation.
Cooling Water Inlet
Feed
Cooling Water Outlet
Permeate
Retantate
Feed Manometer Retantate Manometer

41
3.1.3.2 NF Experiments
Wastewater that is going to be used in NF experiments was only coarsely filtered as
in UF. For this purpose three types of NF membranes were tested on this
wastewater. General specifications of the NF membranes are given in Table 3.2.
Table 3.2 Characteristics of membranes used in caustic recovery experiments
Membrane Material Maximum
temperature, °C
Nominal MWCO (g/mol)
Max. pressure
(bar)
pH Range Type
MF-45 Fluoropolymer 60 0.45 µm 1.5 1 – 11 MF
GR95PP Polyethersulfone on polypropylene 75 2000 10 1 – 13 UF
NP010 Polyethersulfone Hydrophilized 95 1000 40 0 – 14 NF
NP030 Polyethersulfone Hydrophilized 95 500 40 0 – 14 NF
MPT-34 /MPF-34
Polyethersulfone on polypropylene 70 300 35 0 – 14 NF
NF studies were performed with the membrane module as in UF experiments.
Moreover, the same operational conditions and performance indicating parameters
were controlled. Being different from UF studies, a concentration-mode membrane
study was performed additionally. Furthermore to see the effect of temperature
wastewater is heated up to 45 – 500C and provided to be kept constant by means of
a heater in the feed tank of the module. Both concentration mode and high
temperature studies have provided better understanding about the real conditions
of caustic recovery.

42
Throughout the NF studies, optimum operating conditions and the most effective
membrane was determined for caustic recovery. For this purpose, the effects of
different TMP’s and cross-flow velocities were investigated. Attempted operational
conditions relative to membrane type can be summarized in Table 3.3.
Table 3.3 Applied operational conditions during NF studies
Membrane TMP (bar) CFV (m/sec) Temperature (0C) GR95PP 2.38 0.79 20 ± 2
GR95PP 4.03 0.42 20 ± 2
GR95PP 4.03 0.79 20 ± 2
GR95PP 6.23 1.40 20 ± 2
NP030 4.03 0.79 20 ± 2
NP010 4.03 0.79 20 ± 2
NP010 4.03 0.79 40 ± 2
NP010 4.03 0.40 40 ± 2
NP010 4.03 0.40 20 ± 2
NP010 4.03 1.40 20 ± 2
NP010 6.23 0.79 20 ± 2
MPT-34 4.03 0.79 20 ± 2
3.1.3.3 Pilot Plant Studies
This study was conducted in the finishing unit of the textile mill using a SelRO MPT-
34 pilot plant system (Figure 3.4) manufactured by KOCH Membrane Systems. Since
it is manufactured for acid and caustic recovery and specifically caustic recovery
from textile wastewaters, the membrane of the pilot plant system that is MPT-34
membrane (tubular) is durable to high alkaline, acidic and temperature conditions.
Allowed operating conditions of the system are given in Table 3.4.

43
Table 3.4 Operating information of SelRO MPT-34 Pilot System
Pilot Plant SelRO MPT-34
Typical Operating Pressure 15-35 bar
Maximum Operating Temperature 70 0C
Allowable pH - Continuous operation 0 – 14
Pilot plant was set up and connected to the first rinsing tank of one of the most
frequently used mercerizing machinery (Over-Dye). Instead of diverting rinsing
effluent directly to the pilot system, manual feeding of the wastewater was applied,
since the system capacity was inadequate for the total flow. Besides since the pilot
system does not have its own prefiltration unit, manual filtration by means of a
coarse filter was applied to remove fiber residues and other inorganic particles
before introducing the wastewater into the pilot plant. During the operation of the
system, when drastic decrease occurs in permeate flux due to clogging of the
membrane or due to the accumulation of particulate matter on the membrane
surface and/or within the membrane pores, cleaning has been applied using 1 %
HNO3 at first and then pure water.

44
Figure 3.4 SelRO MPT34 Pilot Plant set up in the mercerizing unit of the mill
After testing the pilot plant, it was decided to investigate clogging problem of the
system under laboratory conditions. For that purpose flat sheet form of the MPF-34
NF membrane which is used in the pilot system was obtained and a series of tests
were performed. As a treatment scheme, this membrane was evaluated as;
• NF without pretreatment in total recycle mode like the previous NF tests
and,
• MF after NF in concentrated mode.
Unlike the previous studies MF process was investigated under a high TMP prior to
NF using MF-45 membrane. Table 3.2 presents the characteristics of MPF-34 and

45
MF-45 membranes. Operating conditions of these experiments are summarized in
Table 3.5.
Table 3.5 Treatment scheme and operational conditions of MPF-34 NF experiments
Membrane TMP (bar) CFV (m/sec) Temperature (0C)
MPF-34 NF 4.03 0.79 20 ± 2
MF-45 + MPF-34 MF 1.73 - 20 ± 2
NF 4.03 0.79 20 ± 2
3.2 Analytical Methods
COD HACH Sension 378 pH-conductivity-dissolved oxygen meter was used for pH
and conductivity measurements. Color measurements were conducted by a HACH
DR-2000 Model spectrophotometer and applying USEPA approved HACH Method
#8000. A wavelength of 455 nm was employed for the calibration of the
spectrophotometer with Pt-Co standard solution. COD measurements were done by
using the same spectrophotometer and following the same method at the
wavelength of 620 nm for high COD concentrations and at 420 nm for low COD
concentrations. In turbidity measurement, a HACH Model 2100A turbidimeter was
used. For total solids (TSS) content determination gravimetric analysis were applied.
Particle size distribution of the mixed finishing wastewater was determined by a
Malvern Nano ZS90 unit at the METU Central Laboratory. In order to evaluate
caustic content of the wastewater, NaOH and alkalinity measurements were done.
Alkalinity measurements were conducted according to Standard Methods (2320 B-
titrimetric method) [38]. For NaOH determinations, first Na values were measured
by Standard Methods with a Jenway Flame Photometer device. Since there is no
other Na compound except NaOH, caustic content has been calculated directly from
the measured Na concentrations by the following formula;
A : NaOH, g/L B : Na, g/L
Na = 23, O = 16, H =1

46
CHAPTER 4
RESULTS AND DISCUSSION
4.1 Wastewater Characterization
Before starting to evaluate treatment options, mercerization wastewaters of the mill
were characterized. Characterization studies were conducted with the effluents from
the most commonly used two mercerization machineries (Over-Dye machine and
Pad-Steam machines) of the mill. For this purpose, effluents from each post rinsing
tank of these two machineries or mercerizing process lines and the mixed
wastewater from these lines (after a coarse filtration unit) were collected and
characterized separately. Five different samples were taken at different times and
analyzed for their constituents. Table 4.1 presents the general characteristics of
these mercerizing effluents in the mill.
As can be seen from Table 4.1, the finishing wastewaters are heavily loaded with
organic matter, suspended solids, dissolved solids and color. These wastewaters are
produced at very high volumes (200-300 L/min) like the other major units of textile
production .This heavy pollution load is mainly due to many different chemicals
applied during mercerizing processes and also previous dyeing processes. Table 4.2
also indicates that wastewaters coming from different post-washing stages of these
mercerization processes are highly variable in characteristics. Marcucci et al., have
indicated that finishing wastewater quality is highly affected by the used variant
type of dyes, detergents, sulfate compounds, heavy metals and inorganic
compounds [21]. Therefore any change in previous production steps affects directly
the mercerizing process and its resulting waste characteristics.

47
Table 4.1 General wastewater characteristics of washing stages of the denim
mercerizing processes
Washing
Stages 1 2 3 4 5 6 7
After
Filtration
pH 12.3 12.1 11.8 11.7 11.4 11.1 8.9 11.3
Conductivity 150 60 20 13 9 5 1 18
TSS 1632 793 248 172 144 131 40 132
TDS 61947 23043 8348 5186 4279 3154 1151 6236
Alkalinity 41163 15002 4920 3204 2246 1216 382 4196
Color 10113 7059 3689 3651 3568 3078 844 2994
Turbidity 879 584 534 561 406 379 138 289
COD 8524 5202 2296 2080 2330 2007 542 1863
NaOH 67.5 34.7 6.3 2.8 1.9 1.4 - -
(Unit for conductivity mS/cm, color Pt-Co, turbidity NTU, NaOH g/L, alkalinity mg/L
CaCO3 and TSS, TDS, and COD mg/L.)
Table 4.2 Variable characteristics of mercerizing process final effluents
Parameter Minimum Maximum
pH 6 12.8
Conductivity, mS/cm 2.5 26
COD, mg/L 706 6755
Color, Pt-Co 1179 6775
Alkalinity, mg/L CaCO3 310 6140
TSS 58 467
Turbidity 154 488
As can be seen from Table 4.1 as we move along the post-washing stages of the
mercerization line, pollution load in the wastewater decreases and nearly 80 % of
the total load from finishing is discharged from the first two rinsing tanks. More
importantly, more than 85 % of NaOH discharged from mercerizing process is in the
48
wastewater from the first two stages of washing (water consumption and hence
wastewater discharge from each post-washing tank are equal in volume). Based on
this observation, it was thought that the wastewater mixture from the first two
rinsing tanks would be tried to be treated for the alkali recovery instead of using the
whole system effluent, considering the possible cost of the full-scale NaOH recovery
system to be installed in the mill. It was also considered that this would be better in
terms of performance of the recovery system too. Thus all pretreatment and
treatment studies were run with the wastewater mixture originating from the first
two post-washing tanks of the finishing mill.
For a further analysis of wastewater characteristics, particle size distribution was
also analyzed and the results presented in Figure 4.1 were obtained. As can be
depicted from the figure, the particles in the wastewater are mainly in the size
range of 255-1000 nm; although, there are also particles in the range of 5000-6000
nm. But these larger particles are not high in intensity when compared with the
other ones. From this distribution intensity based average pore size appeared to be
570.4 nm.
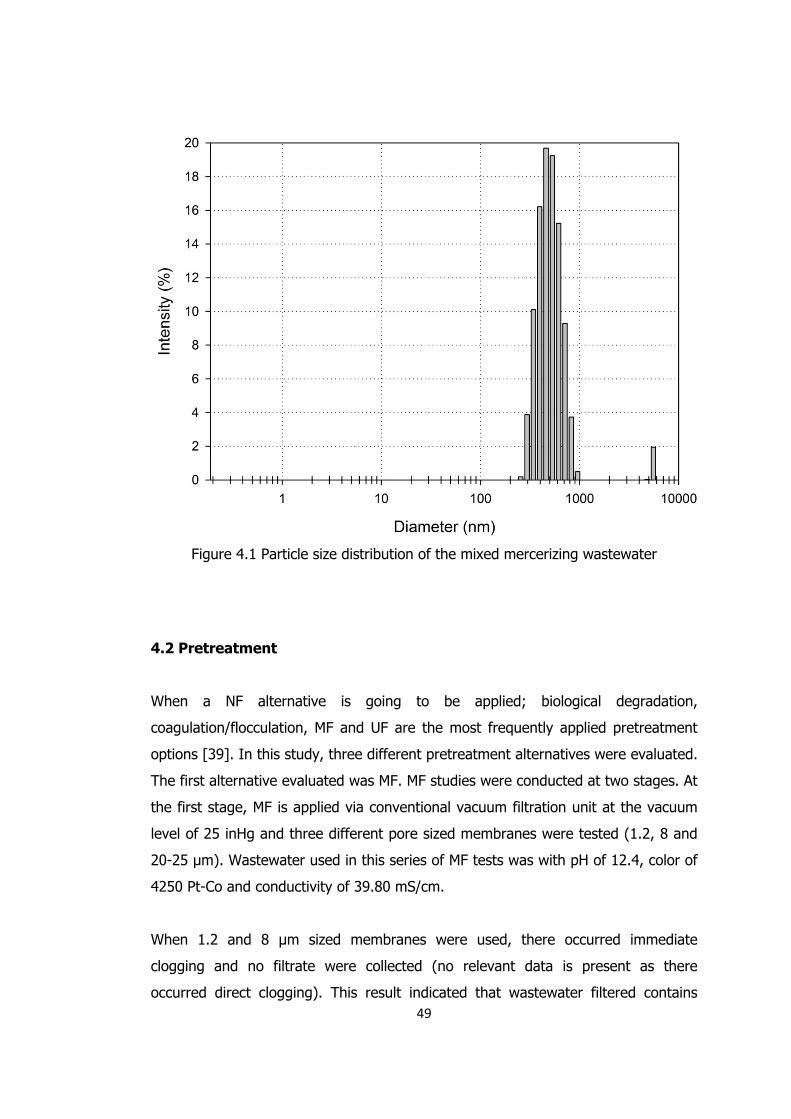
49
Figure 4.1 Particle size distribution of the mixed mercerizing wastewater
4.2 Pretreatment
When a NF alternative is going to be applied; biological degradation,
coagulation/flocculation, MF and UF are the most frequently applied pretreatment
options [39]. In this study, three different pretreatment alternatives were evaluated.
The first alternative evaluated was MF. MF studies were conducted at two stages. At
the first stage, MF is applied via conventional vacuum filtration unit at the vacuum
level of 25 inHg and three different pore sized membranes were tested (1.2, 8 and
20-25 µm). Wastewater used in this series of MF tests was with pH of 12.4, color of
4250 Pt-Co and conductivity of 39.80 mS/cm.
When 1.2 and 8 µm sized membranes were used, there occurred immediate
clogging and no filtrate were collected (no relevant data is present as there
occurred direct clogging). This result indicated that wastewater filtered contains

50
particles which are fine and sufficient enough to clog both the pores of the sizes 1.2
and 8 µm and also possibly larger ones too. When the membrane with the average
pore size 20-25 µm was used, filtration lasted only for 30 seconds. After that time,
there was no filtrate flow coming out. This observation implied that the finishing
wastewater contains particles that cause sudden clogging of the 20-25 µm
membrane surface due to high solids content of the wastewater and also due to the
presence of particles which are of the sizes above 20-25 µm. As presented in Table
4.1, the wastewater filtered in this filtration test was with a TSS content of 2425
mg/L.
At the second stage of the MF study, a computerized dead-end filtration unit was
used and two sets of experiments were run. In this filtration system, the mass of
filtrate collected is recorded on a computer for every 2 seconds. As the filter
medium, two different kinds of membranes made from Polyvinylidene fluoride
(PVDF) and Polytetrafluoroethylene (PTFE) of the pore sizes 5 and 10 µm,
respectively were utilized. Both of these membranes are durable to highly alkaline
and thermal conditions.
Filtration experiments with each membrane were repeated seven times in order to
produce reproducible data. The experimental results of seven parallel MF
experiments run with the two membranes are presented in Figure 4.2 and Figure
4.3.

51
Figure 4.2 Filtration results for 5 µm PVDF MF membrane (∆P = 0.925 bars)
Figure 4.3 Filtration results for 10 µm PTFE MF membrane (∆P = 0.925 bars)

52
From Figure 4.2 and 4.3, it is clearly seen that both membranes run into clogging
problem within a very short time interval (about 10 sec) after the start of the
filtration cycle. This rapid clogging mainly originated from the heavy particulate load
of the wastewater. The filtrate flux from both membranes was very rapid at the
start and there was linear decrease with time until about 10th second. After 10th
second, the decrease in flux was relatively gradual until almost complete clogging at
about 20th second.
These filtration tests carried out with 5 µm PVDF and 10 µm PTFE membranes have
indicated that although these membranes are durable to alkaline conditions, they
experience rapid flux declines with finishing wastewater and this makes the usage
of 5 µm PVDF and 10 µm PTFE membranes inefficient as a MF alternative.
Figure 4.4 Clean water and wastewater flux development for 5 µm PES MF
membrane (∆P = 0.925 bars)
Subsequently, polyethersulfone (PES) based membranes which are hydrophilic and
resistant to very high temperatures (1350C) were tested. For this purpose two

53
different pore sized (5 and 10 µm) PES structured MF membranes were applied. As
being different from previous MF experiments, clean water fluxes were also
evaluated, before and after filtrating wastewater in order to assess fouling behavior.
These filtration tests were run at a pressure difference of 0.925 bar and the results
presented in Figures 4.4 and 4.5 for the 5 and 10 µm PES membranes were
achieved.
CLEAN WATER 1 -> Flux of virgin membrane with clean water
WASTEWATER 1 -> Membrane flux with wastewater
CLEAN WATER 2 -> Membrane flux with clean water following wastewater filtration
WASTEWATER 2 -> Membrane flux with wastewater following second clean water filtration
CLEAN WATER 3 -> Membrane flux with clean water following second wastewater filtration
Figure 4.5 Clean water and wastewater flux development for 10 µm PES MF membrane (∆P = 0.925 bars)
A quick look at Figures 4.4 and 4.5 directly indicates that there occurs very rapid
clogging of the 5 and 10 µm PES membranes with the wastewater and the
permeate fluxes from these membranes are well below the initial clean water fluxes.

54
At the start, clean water fluxes from 5 and 10 µm virgin membranes reached to
their steady values of about 25 L/m2-h and 21 L/m2-h, respectively within a similar
short time period of about 20-30 sec. However, after being used for wastewater
filtration, these clean water fluxes decreased to 14 and 17.5 L/m2-h for 5 µm and 10
µm membranes respectively. These results have indicated that clogging or fouling of
5 µm membrane is more severe as compared to 10 µm membrane. As a
confirmation of this observation, the clean water flux from the 5 µm membrane
after its second usage for wastewater filtration was lower than that for 10 µm
membrane. The total decrease in clean water flux from 5 µm PES membrane after
its two consecutive usage was about 75%, while that for 10 µm membrane was
only 45 % (Table 4.3). These values designate the serious clogging problems with
this wastewater. Consequently, wastewater filtration with these membranes
presented very rapid flux decline with time. For both membranes, a time period of
10 sec was sufficient to reach almost complete clogging and to experience a drastic
decrease in filtration rate. The wastewater flux from 5 µm virgin membrane was
about 14.5 L/m2-h while that from 10 µm was 19.7 L/m2-h. This result was
somehow unusual as one expects to get a higher filtrate flow from a coarser
membrane. One should not forget that 5 and 10 µm membranes are quite similar in
pore size and are MF membranes that might have a certain pore size distribution
resulting in such an unexpected observation. The wastewater filtered is heavily
loaded with suspended solids and the size distribution of particles is another major
parameter influencing filtration rate.
Table 4.3 Clean Water Fluxes and Flux Declines from 5 and 10 µm PES membranes
Membrane CW Flux % decrease
CW1 CW2 CW3 After 1st WW
Filtration
After 2nd WW
Filtration
5 µm 24.8 14.5 6.2 42 57
10 µm 22.8 19.7 13.5 14 31

55
Nevertheless, the clear finding from this series of filtration tests along with the
previous microfiltration trials is that MF pretreatment option is not a successful
option for the pretreatment of finishing wastewater.
4.3 Precipitation
Getting ineffective results from prefiltration studies have induced investigation of
other pretreatment options and in this framework flocculation was considered as the
second pretreatment alternative. During a flocculation period of 45 min at 30 rpm
any flocculation mechanism was observed. Because of charged high variety of
inorganic and organic content originated from sizing, spinning, weaving, desizing,
dyeing or scouring, no stability has been reached.
After testing the applicability of flocculation as a pretreatment alternative and
finding it unsuccessful, centrifugation was considered as the third alternative and a
centrifugation study was conducted. However, even 30 minutes of centrifugation at
a rotational speed of 2500 rpm was not satisfactory and did not provide a
considerable precipitation of settleable material and color removal.
All above findings have indicated that centrifugation and flocculation have been
found also not satisfactory to be applied for the pretreatment of finishing
wastewaters. Looking the consequences of applied pretreatment alternatives, it was
decided to continue the evaluation of recovery alternatives without any
pretreatment.
4.4 UF Experiments
In membrane applications, generally MF processes are used as a pretreatment for
UF and NF processes [40]. However characteristics of the wastewater investigated
in the present study for caustic recovery brought about the failure of MF as a
pretreatment alternative. Eun Jong Son has reported that when the wastewater was
filtered from 10, 100 or 500 µm filters prior to membrane unit, it was realized that
effect of filter size on permeate flux is minor. Therefore it was stated that filtering
only visible materials which are fiber and lint for a textile wastewater will be enough

56
to avoid instant membrane fouling [9]. Results of the studies conducted for
pretreatment purposes leaded to the idea of applying UF process without any
pretreatment. However, only simple coarse filtration with a strainer has been
applied to the raw finishing wastewater for eliminating visible textile residues.
UF experiments were performed in total-recycle mode using a cross-flow plate and
frame module with a PES UF membrane coded as GR95PP having a MWCO of 2000.
Two sets of experiments were performed with this membrane. Firstly, a UF test was
conducted at 4.03 bar TMP and 0.42 m/s CFV and the steady-state results
summarized in Table 4.4 were obtained. In the second part of the studies, TMP and
CFV were varied in order to investigate their possible influences on the performance
of UF in caustic recovery and also in the removal of wastewater constituents.
Table 4.4 Steady state performance of GR95PP UF membrane at 4.03 bar TMP, 0.42
m/s CFV and 20 ± 20C
Color (Pt-Co)
COD (mg/L)
NaOH (g/L)
pH Conductivity (mS/cm)
Feed 10250 16110 32 13.24 144
Permeate 517 2885 32 13.26 150
Retention 94.9% 82.1% N.A. N.A. N.A.
Table 4.4 shows the successful operation results of UF system in terms of caustic
separation with significant color and COD removal. Since the NaOH is the main
contributor to the alkalinity and conductivity, there is no significant change in pH
and conductivity values was observed. Figure 4.6 shows the 2nd hour feed and
permeate samples of the UF process applied at 4.03 bar TMP, 0.42 m/s CFV and 20
± 20C.

57
Figure 4.6 2nd hour feed and permeate samples of UF process with GR95PP at 4.03
bar TMP, 0.42 m/s CFV and 20 ± 20C
All above findings have indicated that UF process without any pretreatment except a
coarse filtration is successful in caustic recovery. However this process cannot be
found satisfactory when color and COD retentions were considered. These two
parameters are evaluated taking into account the reusability of this permeate in the
production processes. As can be seen from Table 4.4 the permeate from UF process
contains 517 Pt-Co color and 2885 mg/L COD. This indicates that the permeate
cannot be used in the finishing process without further treatment as it is highly
colored and contains high amount of COD causing organic matter.
In order to evaluate possible improvement in the UF performance, in the second
part of the UF experiments; the effects of CFV and TMP on the permeate quality
were investigated and the results presented in Table 4.5 and 4.6 were achieved. In
investigating the effect CFV, TMP was kept at 4.03 bar and the CFV was varied as
0.42 and 0.79 m/s. On the other side, to investigate the effect of TMP; CFV was
constant at 0.79 m/s and TMP was varied from 2.38 and 4.03 bar. Furthermore,
Feed (2nd hour) Permeate (2nd hour)

58
behavior of the system was also examined in a different condition by increasing
both CFV and TMP, which were 1.40 m/s and 6.23 bars respectively.
Table 4.5 Effect of TMP on UF process efficiency of GR95PP UF membrane at steady state
Operating
Conditions
COD
Retention,%
Color
Retention,%
NaOH
g/L
Flux
L/m2-h
∆P =2.38 bars 91.98 92.82 32 6.72
CFV = 0.79 m/s
∆P = 4.03 bars 83.84 93.86 32 13.55
CFV = 0.79 m/s
∆P = 6.23 bars 87.77 94.83 32 11.11
CFV = 1.40 m/s
Table 4.6 Effect of CFV on UF process efficiency of GR95PP UF membrane at steady state
Operating
Conditions
COD
Retention,%
Color
Retention,%
NaOH
g/L
Flux
L/m2-h
∆P = 4.03 bars 83.95 94.96 32 11.44
CFV = 0.42 m/s
∆P = 4.03 bars 83.84 93.86 32 13.55
CFV = 0.79 m/s
∆P = 6.23 bars 87.77 94.83 32 11.11
CFV = 1.40 m/s
As seen from the steady state results, increase in TMP and CFV have resulted in
higher fluxes with lower COD and color retentions and caustic separations (Table
4.5 and 4.6). On the other side, a comparison of the magnitude effects of CFV and

59
TMP, show that TMP has influenced the system performance more than CFV. Effect
of TMP and CFV on flux values can be seen in Figure 4.7 and Figure 4.8.
Figure 4.7 Effect of TMP on Flux for the GR95PP UF Membrane

60
Figure 4.8 Effect of CFV on Flux for the GR95PP UF Membrane
In a recent study, S. Barredo-Damas investigated the effect of CFV on COD removal
from textile wastewaters by a number of UF membranes and reported that for all UF
membranes tested there was no influence of CFV on COD removal. It was also
stated that due to higher solid deposition chance on the membrane surface at low
cross flow velocities, lower fluxes are expectable [41]. This behavior was similar in
terms of color removal efficiency. If the effect of TMP is analyzed it is obviously
seen that flux increases drastically up to a point (Figure 4.7). This point has been
6.23 bars TMP for this experiment. The reason why flux increases when the
pressure is increased is that membrane resistance is brought down and then flux
increases with the increased driving force [42]. However after a point thickness of
the filter cake starts to increase with an increased convection of solute to the
membrane surface [43]. Then flux decreases with increased TMP. Beside that
Ahmad has reported a research which investigated the effect of pressure on dye
rejection with UF process. It was stated that as the TMP was increased, dye
rejection has slightly decreased beside the increased flux [44]. In summary when

61
the operation of the system is taken into consideration higher fluxes are more
desirable unless an obvious reduction in retentions is observed. So that 4.03 bar
TMP and 0.79 m/s CFV was accepted as the most efficient UF condition for the
mentioned wastewater.
4.5 NF Experiments
In this series of experiments, two different NF membranes (NP010 and NP030) were
tested at different operating conditions in order to evaluate the performance of NF
in the recovery of caustic and to select the best membrane among these two
alternatives. Characteristics of the NF membranes used are presented in Table 3.2.
The wastewater used in NF experiments was not pretreated except a coarse
filtration as in UF experiments with the characteristics depicted in Table 4.4.
Firstly NP010 and NP030 membranes were tested at the same conditions of 4.03
bar TMP and 0.79 m/s CFV at 20±20C, in order to compare the performances of
these two membranes and the results presented in Table 4.7 were obtained. As can
be depicted from this table, these two NF membranes were quite similar in
performance and they both provided successful NaOH separation along with more
than 90 % COD rejection. NP030 membrane rejected 90.47 % of the feed COD
while NP010 rejected more; 92.37 % of it. Color removals by these two NF
membranes were similar and 98.45 and 97.65 % for NP030 and NP010 membranes,
respectively. However, in terms of permeate flux; NP010 was much better in
performance than NP030 membrane. The permeate flux from the NP010 membrane
was more than three times greater than that from the NP030 membrane. When the
particle size distribution of the wastewater (Figure 4.1) is considered, MWCO
parameters of these membranes (Table 3.2) could be the main reason for this flux
difference.

62
Table 4.7 Comparative performances of NP030 and NP010 NF membranes at steady state
Membrane
Operating
Conditions
(∆P in bar,
CVF in m/s)
Final permeate quality Retention (%) Flux
L/m2-h COD
(mg/L)
Color
(Pt-Co)
NaOH
(g/L) COD Color
NP0
30 ∆P = 4.03
1535 119 32 90.47 98.45 6.02 CFV = 0.79
NP0
10
∆P = 4.03 1229 176 32 92.37 97.65 20.62
CFV = 0.79
∆P = 4.03 2278 238 31 85.06 94.91 18.26
CFV = 0.42
∆P = 4.03 1843 209 32 88.20 95.78 25.16
CFV = 1.40
∆P = 6.23 2210 245 31 85.64 94.56 18.96
CFV = 0.79
The operational conditions that had been maintained during the above mentioned
NF tests were identical to those maintained during UF tests. This was a deliberate
selection for the purpose of comparison. The target was to select either UF or NF
for the recovery of caustic from the finishing effluent from the mill. Figure 4.9
presents the performances of GR95PP UF and NP010 and NP030 NF membranes in
a comparative way. As can be depicted easily, these three membranes are equal in
performance in terms of NaOH recovery. But, as regards COD and color retentions,
NF membranes are superior to UF membrane. Meanwhile, different NF membranes
provided different performances. While NP010 was better in color retention, NP030
was more efficient in terms of COD retention.

63
Figure 4.9 Comparison of GR95PP (UF), NP010 (NF) and NP030 (NF) membranes at
4.03 bars TMP and 0.79 m/s CFV at 20±20C for steady state
Nevertheless, when evaluating membrane performances and selecting the most
appropriate membrane, permeate flux is obviously of the primary concern. Time
dependent permeate flux data for the tested NP010 and NP030 NF membranes and
also GR95PP UF membrane is presented in Figure 4.10. As stated before, during all
these NF and UF tests, the operational conditions were kept constant. Wastewater
temperature was 20±20C, TMP was 4.03 bars and CFV was 0.79 m/s.

64
Figure 4.10 Flux comparisons of GR95PP (UF), NP010 (NF) and NP030 (NF)
membranes at 4.03 bars TMP and 0.79 m/s CFV at 20±20C
When the time-variation of permeate flux from NP010 and NP030 membranes data
presented in Figure 4.10 is evaluated, it is right away seen that the tested NF
membranes perform drastically different and permeate flux from NP010 membrane
having 1000 g/mol MWCO is much higher than that from NP030 membrane having
500 g/mol MWCO. Moreover, permeate flux from NP010 NF membrane is even
higher than that from GR95PP UF membrane. This instantly recognizable advantage
of the NP010 membrane in terms of permeate flux makes it a better choice among
the tested membranes.
After finding out that NP010 is the most appropriate membrane for caustic recovery,
the effect of operational parameters on the performance of this membrane was
evaluated. Because rejection and permeate flux are the two most important
performance parameters [45], the effect of operational parameters; TMP and CFV
on rejection and permeate flux were evaluated for this membrane. A lower and a

65
higher CFV than the previously tested TMP of 0.79 m/s was maintained and
permeate flux data presented in Figure 4.10 was achieved. Similarly, TMP was
varied and the experimental findings given in Figure 4.11 were obtained.
Figure 4.11 Effect of CFV on NF permeate flux when TMP=4.03 bars at 20±20C
As shown in Figure 4.11, NF CFV variations affected the system performance in the
same manner as UF in terms of flux decline. Such that as the cross flow velocity
increased from 0.40 to 1.40 m/s, steady-state permeate flux increased from 18.3
L/m2-h to 25.2 L/m2-h. In other words, with a three-fold increase in CFV, there was
about 50 % increase in permeate flux. In the meantime, increasing CFV from 0.40
m/s to 0.79 m/s, caused only a 18 % increase in permeate flux; it increased from
18.3 L/m2-h to 21.6 L/m2-h. In addition, increasing CFV also increased the flux
decline and also the time to reach steady state. The initial flux at the highest CFV
tested was much greater than its steady state value; while that at the lowest CFV
tested was slightly greater than that at steady state. It is known that higher

66
velocities are the main reason for the distortion of filter cake that forms on
membrane surface during filtration operation. Therefore permeate flux increases by
an increase in CFV by this reducing effect on the cake resistance [46]. In agreement
with this, Koyuncu has also reported that dye deposition and concentration
polarization are one of the main reasons for flux declines at low cross-flow velocities
[45]. Based on the results obtained under different CFV conditions, it can be
concluded that NF using NP010 membrane at a high CFV is useful to extent the
membrane cleaning cycles and hence to provide a longer membrane service life.
Although dyeing is mainly applied before mercerization steps, due to higher alkaline
conditions and high temperature, fabric ceases its dye content at every post-rinsing
or washing step of mercerization process. This fact further supports the above-
mentioned argument that relates flux decline to the deposition of dye particles over
the surface of the membrane. Characterization of the first post-rinsing tank
wastewater of the indigo dyeing process as reported by Uzal [47] and the first post-
rinsing tank wastewater of the mercerization process of the same textile mill in
which caustic recovery studies conducted is compared in Table 4.8. As can be
depicted, the wastewater from the first post-rinsing tank after mercerization is much
higher in pollution load as compared to the wastewater from the first post-rinsing
tank after indigo dyeing. The mercerization wastewater is with a COD of 8524 mg/L
while dyeing wastewater is with a COD of only 1547 mg/L. More importantly, color
in the mercerizing wastewater is more than twice that in the dyeing wastewater.
Therefore, it is likely to have dye deposition and concentration polarization problems
that are encountered in NF of dyeing wastewater [47] in the NF of mercerizing
wastewaters.
Table 4.8 Comparison of the first rinsing tank effluents from indigo dyeing and
mercerizing processes of the textile mill
Wastewater Source pH COD (mg/L) Color (Pt-Co) Alkalinity (mg/L CaCO3)
Indigo Dyeing 1st Post – rinsing 11.2 1547 4824 4000
Mercerizing 1st Post - rinsing 12.3 8524 10113 41163

67
Figure 4.12 Effect of TMP on NF (NP010) permeate flux when CFV=0.79 m/s at
20±20C
TMP is one of the most important operational parameter that determines membrane
performance. In order to evaluate how TMP does affect the flux behavior of NF
process, the system was operated with the selected NP010 NF membrane at the
TMP’s of 4.03 and 6.23 bars and the flux decline was followed. The results obtained
are presented in Figure 4.12. As can be depicted from this figure, although the flux
decline trend was quite similar, permeate flux at 4.03 bar TMP was greater than at
6.23 bar. In general higher permeate fluxes are expected at higher TMP; as
increasing pressure difference affect filtration driving force through the membrane
or increase it [48]. However the results are contrary to this general expectation. As
can be seen, steady-state permeate flux at 4.03 bar TMP is about 1.6 L/m2-h higher
than that at 6.23 bars. Similarly, initial flux observed at 4.03 bar TMP (21.5 L/m2-h)
is well above that observed at 6.23 bar (19.8 L/m2-h). This unexpected result was
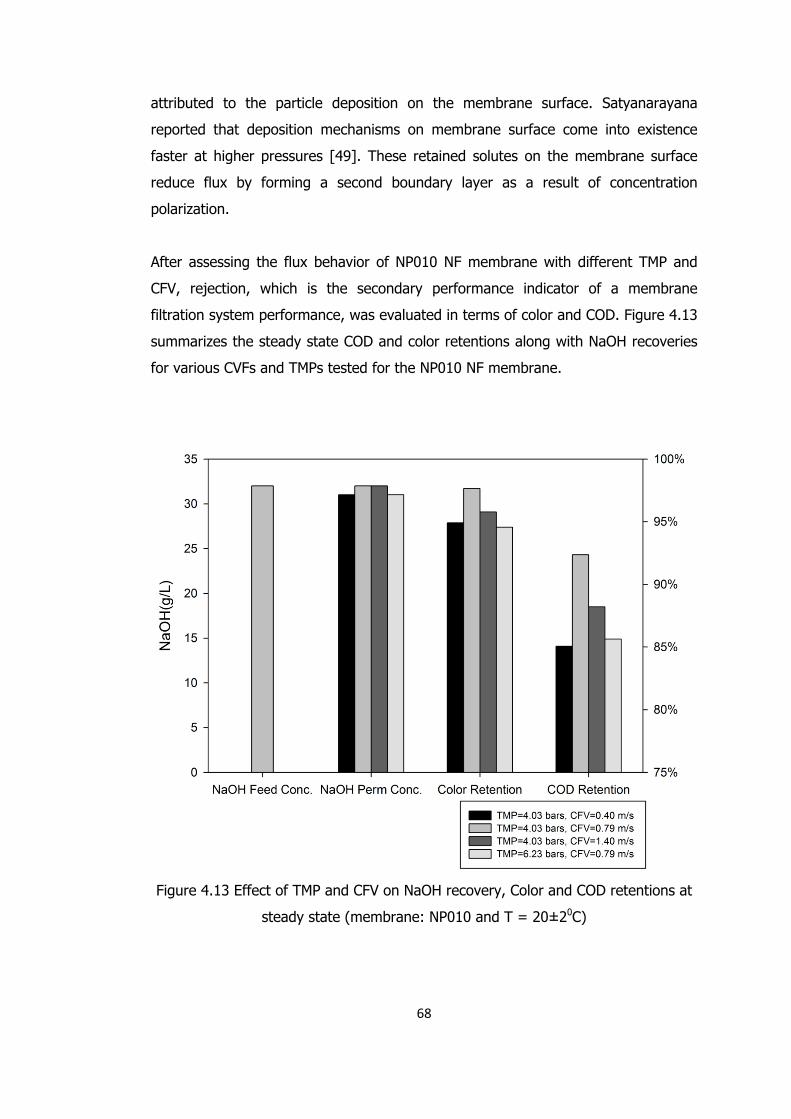
68
attributed to the particle deposition on the membrane surface. Satyanarayana
reported that deposition mechanisms on membrane surface come into existence
faster at higher pressures [49]. These retained solutes on the membrane surface
reduce flux by forming a second boundary layer as a result of concentration
polarization.
After assessing the flux behavior of NP010 NF membrane with different TMP and
CFV, rejection, which is the secondary performance indicator of a membrane
filtration system performance, was evaluated in terms of color and COD. Figure 4.13
summarizes the steady state COD and color retentions along with NaOH recoveries
for various CVFs and TMPs tested for the NP010 NF membrane.
Figure 4.13 Effect of TMP and CFV on NaOH recovery, Color and COD retentions at
steady state (membrane: NP010 and T = 20±20C)

69
As seen from Figure 4.13 for all the experimental conditions, membrane filtration
using NP010 membrane provided successful caustic separations. When the COD and
color retentions are also considered, it is immediately seen that NF with NP010
membrane provides the best performance at a TMP of 4.03 bar and a CFV of 0.79
m/s. What is also seen from Figure 4.13 is that the greatest effect of operational
parameters is on COD retention and the effect on color retention is not that large.
Such that increasing CFV for the same TMP increased COD and color retentions until
it reaches to 0.79 m/s. After that point increasing velocity more, affected the system
inversely. If TMP effect is examined, it can be seen that increasing the pressure
from 4.03 to 6.23 bars at the same CFV (0.79 m/s) resulted in a slight increase in
COD and a slight decrease in color retention (Figure 4.13). Generally rejection is
expected to increase with the increase in flux due to convective transport. By the
way concentration polarization, which cause decrease in retentions, starts to
increase with pressure [46]. As a result, possibility of both pressure side effects
concentration polarization and convective transport could have prevented
considerable changes in COD and color retentions.
Real operating conditions of mercerizing or caustification processes in the textile mill
was discussed before. It was emphasized that rinsing operations after alkaline
processes are applied at very high temperatures (80-90 0C) to remove impurities
coming from previous production stages and to provide a resistant silk shine and
good handle features to the fabric. On account of this high temperature,
temperature effect on NF performance was investigated in order to better evaluate
caustic recovery and to generate results applicable under real operating conditions
of the textile mill,.
NP010 NF membrane was again used to investigate the effect of temperature on
membrane filtration process in terms of flux, NaOH recovery, COD and color
retentions. Two different CFVs (0.79 and 0.40 m/s) were applied at the same TMP
(4.03 bars) at 400C. Considering the process conditions at the mill, 400C was chosen
as the elevated temperature to work with. In the process, rinsing waters are
generated at the temperature of 80-900C and then cooled down to 40-450C by
passing thru heat exchangers. Flux behavior of NP010 membrane at 40±20C is
shown in Figure 4.14.

70
Figure 4.14 Effect of temperature on permeate flux at TMP = 4.03 bars for CFV =
0.79 & 0.40 m/s
As shown in Figure 4.14, increasing the feed temperature from 20 to 400C has
improved the permeate flux for both cross-flow velocities. There occurred about a
50 % increase in permeate flux when the temperature was increased from 20 to
40° at the cross-flow velocity of 0.79 m/s. However, the increase in permeate flux
with temperature was much less at the cross-flow velocity of 0.40 m/s. Due to
decreasing effect of temperature on viscosity, increasing in permeate flux is an
expected phenomena [50]. Schlesinger reported a strong influence of temperature
on NF permeate flux of various NF and UF membranes such that flux is doubled by
increasing temperature from 20 to 490C [36]. Temperature has also an effect on
retention mechanism of membrane processes. Effect of temperature on COD and
color retentions can be compared by the Figure 4.15. As can clearly be seen, the
optimum performance is at the temperature of 40 °C at a CFV of 0.79 m/s when the
flux and retention parameters are considered together.
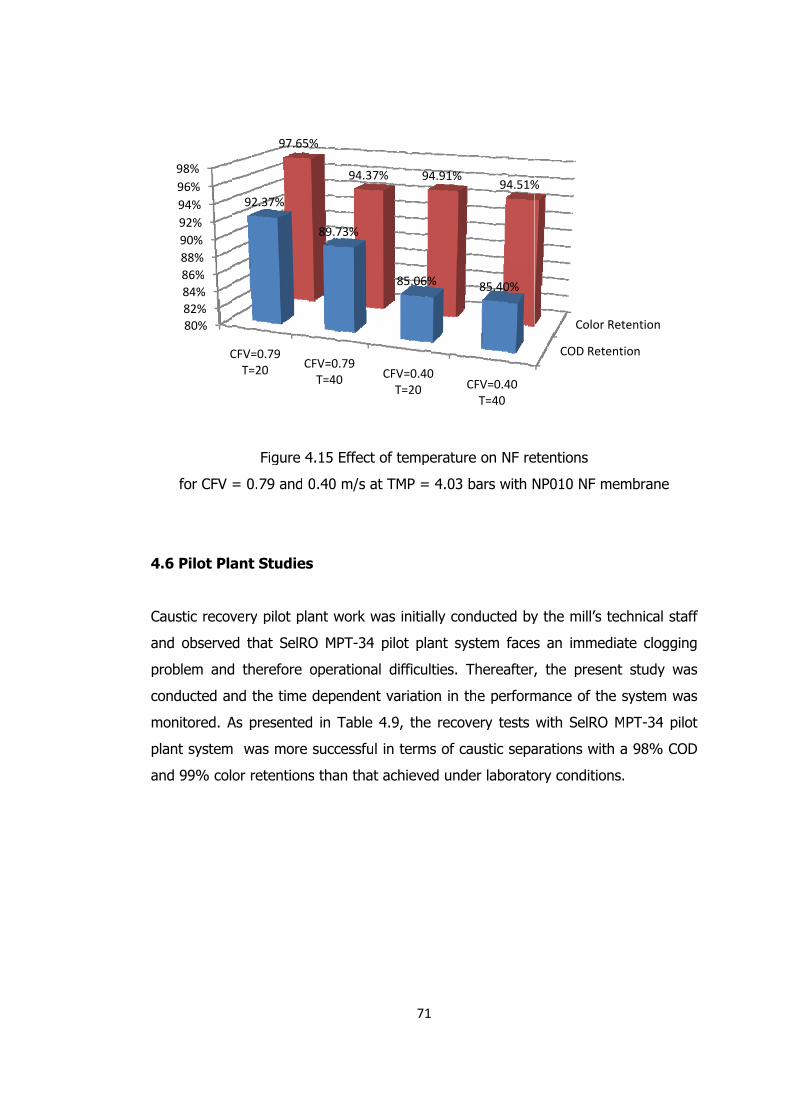
4
C
a
p
c
m
p
a
4
Ca
an
pr
co
m
pl
an
.6
a
nd
ro
on
mo
la
nd
6
u
d
ob
n
on
an
d
f
P
us
b
d
ni
nt
9
9999
fo
P
st
o
le
du
it
t
9
88888992949698
or
Pi
tic
ob
em
uc
to
s
9
808284868802%4%6%8%
r
lo
c
bs
m
ct
or
sy
9%
0%2%4%6%8%%%%%%
C
ot
r
se
m
te
re
ys
%
%%%%%%%%%
CF
t
re
e
a
ed
ed
st
%
%
FV
P
ec
rv
a
d
d.
te
c
V
P
co
ve
n
a
.
em
co
V
Pla
ov
e
nd
an
A
m
ol
C
=
a
ve
d
d
n
As
m
o
CF
=
n
e
d
t
d
s
w
or
FVT
0
nt
ry
t
th
d
p
w
r r
V=T=
9
0.
t
y
th
he
t
p
wa
re
=0=2
2
F
7
S
p
ha
e
h
re
as
et
020
.3
Fi
79
St
p
at
re
he
e
s
te
.70
37
g
9
tu
pil
t
ef
e
s
m
en
79
7%
gu
a
u
o
S
fo
t
e
m
n
9
%
9
ur
an
d
ot
Se
o
tim
en
mo
ti
%
97
re
nd
di
t
e
re
m
nt
or
io
7.6
e
d
e
p
lR
e
me
te
re
on
6
4
0
es
pla
RO
e
ed
e
ns
C
5
4.
0
s
a
O
o
d
d
s
s
CF
%
.1
.4
n
O
op
de
i
su
t
FVT
8
%
15
4
nt
M
pe
e
n
uc
th
V=T=
89
5
0
w
M
er
p
n
cc
ha
=0=4
9.
E
0
w
MP
ra
pe
T
ce
an
0.40
7
Ef
m
wo
PT
at
en
Ta
e
n
70
73
ff
m/
or
T-
ti
nd
a
es
t
9
3%
9
fe
/s
rk
-3
o
de
b
ss
th
9
%
94
ec
s
k
34
on
e
ble
sfu
ha
4.3
ct
a
w
4
na
en
e
u
at
37
t o
at
w
4
al
nt
4
l
t
7%
o
t
wa
p
l
t v
4
i
a
C
%
of
T
as
pi
d
v
4.9
n
ac
CF
%
t
TM
s
lo
di
va
9
n
ch
FVT
8
te
M
in
ot
iff
ar
,
te
h
V=T=
85
em
MP
n
t
ffi
ria
t
e
ie
=0=2
5.
7
m
P
it
p
ic
at
th
rm
ev
0.20
.0
7
mp
=
tia
pl
cu
ti
he
m
ve
.40
06
9
1
pe
=
a
la
ul
o
e
ms
e
40
6%
94
e
4
ll
an
ti
on
s
d
0
%
4.
ra
4.
y
nt
ie
n
re
o
d
9
at
.0
y
t
es
i
ec
of
u
91
tu
03
c
s
s.
n
c
f
un
1%
u
3
co
sy
n
o
c
nd
%
re
b
on
ys
T
t
ov
ca
de
C
e
ba
nd
st
Th
h
ve
au
e
CF
o
a
du
te
h
e
er
us
r
FVT
8
o
rs
u
em
e
e
ry
st
l
V=T=
85
n
s
c
m
er
p
y
ti
a
=0=4
5.
n
w
cte
m
e
pe
t
c
ab
0.40
4
9
N
w
e
f
ea
er
te
c
bo
.40
40
94
NF
wit
ed
fa
af
rf
es
s
or
40
0%
4.
F
th
d
ac
fte
fo
st
e
ra
0
%
.5
r
h
b
ce
e
or
ts
ep
at
51
re
N
by
es
r,
rm
s
pa
to
1%
et
N
y
s
,
m
w
ar
or
%
te
P
t
a
t
a
w
ra
ry
en
P0
th
a
th
an
it
at
y
nt
01
he
n
he
nc
th
tio
c
tio
10
e
n
e
ce
h
o
co
C
o
0
m
i
e
S
on
on
CO
n
N
m
m
p
o
Se
ns
nd
OD
C
ns
N
mi
m
pr
of
e
s
d
D
Co
s
NF
ll
m
re
f
lR
w
it
R
ol
F
’s
me
es
t
RO
w
ti
Re
o
m
s
e
se
th
O
it
o
et
or
m
t
d
en
he
O
th
on
e
R
e
e
dia
nt
e
M
h
ns
n
Re
em
ec
at
t
s
M
a
s.
ti
et
m
ch
te
s
sy
P
a
io
te
mb
hn
e
st
ys
PT
9
on
en
br
ni
tu
st
T-
98
n
nt
ra
ic
c
ud
te
-3
8%
io
an
ca
lo
d
em
34
%
on
ne
al
og
y
m
4
%
n
e
s
g
y
m
C
st
g
w
w
p
C
ta
gin
w
w
pil
CO
af
n
wa
wa
lo
OD
ff
g
as
as
ot
D
f
g
s
s
t
D

72
Table 4.9 Caustic recovery test results by SelRO MPT-34 pilot plant at TMP = 20 bar
Time (hour) Temperature (0C) Feed NaOH (g/L) Permeate NaOH (g/L)
t = 1 70 44 16
t = 2 90 68 52
t = 3 95 60 58
t = 4 98 64 60
As seen from the results, the system reaches up to 80% caustic recovery after a 2
hours period as proportional to volumetric recovery of the system. After this time
on, the caustic recovery became stable making the pilot system successful.
However, the system was found to be not applicable practically as the permeate flux
was very low or almost null by this time and there was a serious increase in the
temperature (Table 4.9). Since there is no cooling system in the pilot plant, the
system temperature had reach up to 98 0C after a short time period. As denoted in
Chapter 3, allowed operating temperature of this system is 70 0C. However, when
the rinsing process temperature (70 – 800C) of the mercerizing operation is
considered, overheating of the membrane after a short time is unavoidable unless
there is a cooling system. Furthermore, in extended use of organic membranes at
highly alkaline conditions, 600C should not be exceeded [36]. Thus, it is not concern
to say that the result obtained from this study do make a complete simulation of the
real scaled system as there is no cooling system within the tested pilot plant.
Temperature rise was not in fact the only operational difficulty with the pilot plant
system. There was very rapid decline in permeate flux from the system due to
heavy solids load in the feed or in the mercerizing effluent. As mentioned before,
the pilot system does not have its own prefiltration unit. However when the high
inorganic and fiber residue content of mercerizing wastewater is considered, at least
a coarse filtration seems to be necessary. In the present study, a very coarse
filtration of about 5 mm has been applied. But, as it is too coarse, it was not
satisfactory in decreasing the solids load to the pilot system. Figure 4.16 shows the
coarse filtration apparatus added to the system and how much fiber residue is
collected on it in half an hour time.

73
Figure 4.16 SelRO MPT-34 Pilot system feeding tank coarse filtration unit
Results obtained from pilot studies have leaded to the investigation of eliminating
the existing clogging problem. Flat sheet type MPF-34 NF membrane has been used
to evaluate the problem under laboratory scale conditions and to assess the possible
improvement in membrane fouling with the application of microfiltration to reduce
clogging.
Microfiltration studies had been found unsuccessful for different kind of membranes
(Table 3.1) pore sized from 1.2 to 25 µm at 25 mm Hg pressure. Therefore it was
decided to apply a high-pressure MF process with a tighter membrane (0.45µm)
prior to NF process. Table 4.10 shows the steady state recovery and retention
performances of NF and MF+NF applications.

74
Table 4.10 NF and MF+NF tests results with MPF-34 and MF-45 membranes at
steady state and 20 ± 20C
Membrane and
operating conditions COD (mg/L) Color (Pt-Co) NaOH (g/L)
Feed 17890 8600 41
MPF-34
TMP = 4.03 bar
CFV = 0.79 m/s
Permeate
Quality 498 26 41
Retention, % 97.22 99.70
Feed 11780 7370 24
MF-45
TMP = 1.73 bar
Permeate
Quality 2350 1288 24
Retention, % 80.05 82.53
MPF-34
TMP = 4.03 bar
CFV = 0.79 m/s
Permeate
Quality 210 14 24
Retention, % 94.78 99.43
When the MPF-34 is applied in total recycle mode like the previous NF tests, it was
seen that caustic separation is satisfactory. Meanwhile, COD and color retentions
reach considerably higher values than the previously applied NF experiments (Table
4.7). Providing such permeate qualities at very low organic content and nearly
colorless states promotes the reuse of caustic solutions.
Another application of MPF-34 is executed under concentrated mode conditions.
Beside that a high-pressure MF application is incorporated with NF application as a
pretreatment option. Results of MF+NF application should be evaluated in terms of
mainly two points. One of them is the effect of MF process on NF permeate flux
values. Figure 4.16 gives the variation of permeate flux of NF with and without
prefiltration.

75
Figure 4.17 Permeate flux variations with time of MPF-34 and MF-45+MPF-34 NF
processes at 20 ±2 0C
Figure 4.16 gives the time variation of NF permeate flux from MPF-34 membrane
with and without MF application. Although process durations highly differ from each
other; an increasing effect of MF process on permeate flux can be observed in
Figure 4.16. Starting from the beginning of NF process, MF application has
influenced the permeate fluxes positively but not higher than 15%. There was an
increasing trend in permeate flux until 23th hour. After that time, membrane fouling
was observed to start resulting in a decrease in permeate flux.
Second effect of MF on NF that should be evaluated is the effect on NF recovery
and retention capacities. There was no increasing effect of MF on NF was observed
with respect to retention and recovery capacities (Table 4.10). However, as another
barrier to wastewater, MF+NF application has yielded lower COD and color
parameters. As a result high-pressure MF process can be incorporated with the NF
operation in order to decrease cleaning cycles and in addition to this final permeate
quality will be increased.

76
CHAPTER 5
SUMMARY
This study is conducted to develop a new caustic recovery process alternative for a
denim producing textile mill located in Kayseri – Turkey. The tests have been
carried out with the mercerization process rinsing effluents of the mill and the
membrane processes have been applied.
Experimental studies have been performed basically in at three stages. At the first
stage of the study, mercerization process rinsing process effluents have been
characterized. Then at the second stage of the study to improve treatment
efficiency of membrane processes some kind of pretreatment alternatives have been
evaluated. At the last stage of the study UF and NF membrane operations have
been applied to accomplish the recovery purpose. After the completion of lab scaled
experiments, a pilot plant study was also conducted to observe process under real
conditions. In the proceedings paragraphs, the results of these studies are
summarized.
In the characterization studies carried out separately for both total finishing effluent
and rinsing effluents, both wastewaters were found as highly alkaline with a
comparatively high pollution load in terms of COD, color, conductivity and solids
content. It has been observed that there was a drastic decrease in the caustic
content and consequently pollution content of the wastewater from rinsing tanks.
Such that the effluents from the first two rinsing tanks were found to constitute
80% of the total wastewater load. Thus, caustic recovery studies were carried out
with the wastewater generated from these first two rinsing tanks.
In the pretreatment studies first of all membrane prefiltration methods have been
applied. None of a wide range of microfiltration membranes from ordinary ones to
special ones which are durable to highly alkaline conditions has shown satisfactory
performance. In both of the simple and computerized dead end microfiltration
experiments carried out at 25 mmHg operating pressure sudden clogging of

77
membranes has been observed in less than 1 min. Furthermore all the membrane
types which were cellulose acetate, PVDF, PTFE and PES have shown similar results
in terms of clogging problems. As a result it was concluded that usual prefiltration
methods which are mostly applied before membrane operations are not proper for
mercerizing effluents.
Flocculation and centrifugation were the other applied pretreatment alternatives.
Both of these methods have been inefficient due to the same reason with
prefiltration such that fiber residues have made removal mechanisms of these
processes unsuccessful.
UF studies which were applied without any pretreatment except a coarse filtration
have been successful in terms of caustic recovery and COD and color retentions.
Despite all the UF tests carried out under different operational conditions have
provided successful caustic soda recovery, performances in terms of COD and color
retentions and also permeate fluxes were different. TMP of 4.03 bars and CFV of
0.79 m/s at 20±20C have been found as the optimum operating condition for the UF
of caustic finishing wastewater. It has resulted in a purified caustic permeate with
93.86% color and 83.84% COD retentions and 13.55 L/m2 permeate flux. When the
effect of TMP and CFV on permeate flux was investigated it was seen that
increasing both TMP and CFV has influenced flux positively. However if the results
were evaluated in terms of COD and color retentions, it can be concluded that
increase in TMP and CFV has yielded decrease in retentions. Meanwhile, when it is
considered that observed decrease in retention capacity is very low, high TMP and
CFV for this system are much more preferable.
NF process which has been evaluated by means of two different membranes has
been found also as successful in caustic recovery. It provided 94.91% color and
85.06% COD retention with 18.26 L/m2 permeate flux at the same operational
conditions with UF. In spite of slightly higher COD and color retentions, NP010 has
been found more successful achieving 3 times higher permeate fluxes than NP030.
When the performance evaluation was done under different operating conditions
4.03 bars TMP and 0.79 m/s CFV at 20±20C has been found as the most efficient.
Although almost the same caustic recoveries have been obtained, increase in TMP

78
and CFV have influenced system performance negatively. When the effect of
temperature was evaluated by increasing feed temperature from 20 to 400C, higher
fluxes with lower recovery and retentions capacities have been acquired. At higher
CFV this reduction in recovery and retention capacities beside serious increase in
flux can be seen more clearly.
Pilot-scale studies which were conducted with a SelRO MPT-34 membrane unit have
been found successful in terms of caustic separations with higher COD and color
retentions than the laboratory-scale experiments. However, due to the lack of
cooling within the pilot-scale system and also prefiltration, rapid heating and
clogging problems were encountered. Therefore, the pilot-scale system could
typically be operated for only 4 hours until there was no permeate flow.

79
CHAPTER 6
CONCLUSIONS
Based on the results obtained in this study; in general, it can be concluded that the
treatment of caustic finishing wastewater by a combination of UF and NF treatment
results in an effluent quality that can be recycled into the finishing process after
evaporation. The dissolved and suspended substance are almost completely
retained and concentrated, while the purified caustic passes through the
membrane. As much as 95% or more of the caustic is recovered, while its
concentration remains unchanged.
The other conclusions drawn from the present study are as follows:
1. All the findings from the laboratory pretreatment tests revealed that MF,
flocculation and centrifugation are not effective and efficient pretreatment
methods for caustic finishing wastewater from denim textile production.
2. The laboratory tests with GR95PP UF membrane having a MWCO of 2000
have shown that UF is successful in providing a relatively clean caustic
solution with 93.86% color and 83.84% COD retentions. As the permeate
from GR95PP is still high in color (513 Pt-Co) and COD (2590 mg/L), it
appears that it is essential to have further purification of it.
3. Further purification of the permeate from UF via NF using NP010 and NP030
membranes was satisfactory providing a clean permeate or caustic solution.
Among these two NF membranes, NP010 membrane was better providing a
higher permeate flux along with 94.9% and 85.06 % color and COD
removals, respectively.
4. Over the range of temperature studied, the NF of the permeate from UF
revealed that the permeate flux increases seriously with an increase in
temperature.

80
5. Pilot-scale tests with the SELRO MPT-34 unit were successful in terms of
caustic purification and recovery. The system provided high COD and color
retentions of 98 % and 99 % respectively producing a permeate or caustic
solution with a COD of 498 mg/L and color of 26 Pt-Co. However, the
operation of the pilot-scale system was disturbed by rapid clogging and
temperature rise problems.
6. When the laboratory filtration system was operated with the NF membrane
MPF-34 employed in the SELRO MPT-34 unit, it was seen that high-pressure
MF prior to NF has increased permeate flux by only 15%.

81
CHAPTER 7
RECOMMENDATIONS
An overall evaluation of the findings from laboratory-scale and pilot-scale tests
reveals that the flux decline and temperature increase problems observed during
pilot-scale tests should be further investigated. Additional prefiltration tests seem to
be essential for a better removal of suspended solids prior to NF. A wide variety of
MF membranes operated under a wide variety of operational conditions may
produce better results and therefore may lessen flux decline problem during NF.

82
REFERENCES
1. Marucci, M., Nosenzo, G., Capannelli, G., Ciabatti, I., Corrieri, D., & Ciardelli,
G. (2001). Treatment and reuse of textile effluents based on new
ultrafiltration and other membrane technologies. Desalination , 138, 75-82.
2. Badani, Z., Ait-Amar, H., Si-Salah, A., Brik, M., & Fuchs, W. (2005).
Treatment of textile waste water by membrane bioreactor and reuse.
Desalination , 185, 411–417.
3. Brik, M., Schoeberl, P., Chamam, B., Braun, R., & Fuchs, W. (2006).
Advanced treatment of textile wastewater towards reuse using a membrane
bioreactor. Process Biochemistry , 41, 1751–1757.
4. Van der Bruggen, B., Curcio, E., & Drioli, E. (2004). Process intensification in
the textile industry: the role of membrane technology. 73, 267–274.
5. Van der Bruggen, B., Cornelis, G., Vandecasteele, C., & Devreese, I. (2005).
Fouling of nanofiltration and ultrafiltration membranes applied for
wastewater regeneration in the textile industry. Desalination , 175, 111-119.
6. European Commission. (2003). Integrated Pollution Prevention and Control
(IPPC) Reference Document on Best Available Techniques for the Textiles
Industry.
7. Sojka-Ledakowicz, J., Koprowski, T., Machnowski, W., & Knudsen, H. H.
(1998). Membrane filtration of textile dyehouse wastewaterfor technological
water reuse. 119, 1-10.
8. Sostar-Turk, S., Simonic, M., & Petrinic, I. (2005). Wastewater treatment
after reactive printing. Dyes and Pigments , 64, 147-152.
9. Son, E., Choe, E., & Kim, J. (2000). Nanofiltration Membrane Technology for
Caustic Soda Recovery. Textile Chemist and Colorist & American Dyestuff
Reporter , 32, 46-52.

83
10. Choe, E. K., Son, E. J., Lee, B. S., Jeong, S. H., Shin, H. C., & Choi, J. S.
(2005). NF process for the recovery of caustic soda and concentration of
disodium terephthalate from alkaline wastewater from polyester fabrics.
Desalination , 186, 29-37.
11. Environmental Protection Agency. (1997). Office of Compliance Sector
Notebook Project: Profile of the Textile Industry. Washington.
12. Hans-Karl Rouette. (2000). Encyclopedia of Textile Finishing. Springer.
13. Matoba, Y. (1985). Lectures on Mercerization. Retrieved 06 07, 2008, from
http://www.textileinfo.com/en/tech/mercerize/page01.html
14. Cooper, S. G. (1978). The Textile Industry, Environmental Control and
Energy Conservation. Noyes Data Corporation.
15. Porter, J., & Goodman, G. (1984). Recovery of hot water, dyes and auxiliary
chemicals from textile waste streams. Desalination , 49, 185.
16. Barclay, S., & Buckley, C. (2000). Waste minimisation guide for the textile
industry, A step towards cleaner production (Volume I). University of Natal
Durban South Africa, The Pollution Research Group.
17. Bechtold, T., Burtscher, E., & Hung, Y.-T. (2004). Treatment of Textile
Wastes. In Y.-T. H. Lawrence K. Wang, Handbook of Industrial and
Hazardous Wastes Treatment, Second Edition.
18. Retrieved 06 07, 2008, from Textile Coloration and Finishing Field Services:
http://www.itt.edu/documents/webdocs/Textile%20Coloration%20and%20fi
nishing%20field%20services.pdf
19. Lopez, A., Ricco, G., Ciannarella, R., Rozzi, A., Di Pinto, A., & Passino, R.
(1999). Textile Wastewater Reuse: Ozonation of Membrane Concentrated
Secondary Effluent. Water Science and Technology , 40, 99-106.
20. Fersi, C., Gzara, L., & Dhahbi, M. (2005). Treatment of textile effluents by
membrane technologies. Desalination , 185, 399–409.
84
21. Marcucci, M., Ciardelli, G., Matteucci, A., Ranieri, L., & Russo, M. (2002).
Experimental campaigns on textile wastewater for reuse by means of
different membrane processes. Desalination , 149, 137-143.
22. Vandevivere, P. C., Bianchi, R., & Verstraete, W. (1998). Treatment and
Reuse of Wastewater from the Textile Wet-Processing Industry: Review of
Emerging Technologies. Chemical Technology and Biotechnology , 72, 289-
302.
23. Aslam, M. M., Baig, M. A., Hassan, I., Qazi, I. A., Malik, M., & Saeed, H.
(2004). Textile wastewater characterization and reduction of its COD & BOD
by oxidation. Environmental Agricultural and Food Chemistry , 3, 804-811.
24. Speth, T. F., Summers, R. S., & Gusses, A. M. (1998). Nanofiltration Foulants
from a Treated Surface Water. Environmental Science & Technology , 32,
3612-3617.
25. Fersi, C., & Dhahbi, M. (2008). Treatment of textile plant effluent by
ultrafiltration and/or nanofiltration for water reuse. Desalination , 222, 263-
271.
26. Petrov, S., & Stoychev, P. (2003). Ultrafiltration purification of waters
contaminated with bifunctional reactive dyes. Desalination , 154, 247-252.
27. Srikanth, G. (n.d.). Retrieved 06 08, 2008, from Membrane Separation
Processes - Technology and Business Opportunities:
http://www.biologica.eng.uminho.pt/PSB/docs/TextoFicha3.pdf
28. Van der Bruggen, B., Vandecasteele, C., Gestel, T. V., Doyen, W., & Leysen,
R. (2003). A review of pressure-driven membrane processes in wastewater
treatment and drinking water production. Environmental Progress , 22, 46-
56.
29. Mulder, M. (1996). Basic principles of membrane technology, Second Edition.
Dordrecht, Netherlands: Kluwer Academic Publishers.
30. Crespo, J. G., & Böddeker, K. W. (1993). Membrane processes in separation

85
and purification. Dordrecht, The Netherlands: Kluwer Academic.
31. Yeh, H., Cheng, T., & Tsai, J. (1999). Modified concentration polarization
model for hollow-fiber membrane ultrafiltration. 16, 189–192.
32. Cheryan, M. (1998). Ultrafiltration and microfiltration handbook, Second
Edition. New York: CRC Press.
33. Scott, K., & Hughes, R. (1996). Industrial membrane separation technology .
Chapman & Hall.
34. EPA. (2003). Membrane filtration guidance manual. U.S. Environmental
Protection Agency Office of Water(4601), EPA 815-d-03-008.
35. Björndal, H. (1980). Low waste technology in textile industries. 52, 2023-
2030.
36. Schlesinger, R., Götzinger, G., Sixta, H., Friedl, A., & Harasek, M. (2006).
Evaluation of alkali resistant nanofiltration membranes for the separation of
hemicellulose from concentrated alkaline process liquors. Desalination , 192,
303–314.
37. Jones, H. R. (1973). Pollution control in the textile industry. New Jersey:
Noyes Data Corporation.
38. APHA, A. W. (1995). Standard Methods for Examination of Water and
Wastewater (19 ed.). Baltimore: United Book Press.
39. Van der Bruggen, B., Segers, D., Vandecasteele, C., Braeken, L., Volodin, A.,
& Van Haesendonck, C. (2004). How a microfiltration pretreatment affects
the performance in nanofiltration. Separation Science and Technology , 39,
1443–1459.
40. Allegre, C., Moulin, P., Maisseu, M., & Charbit, F. (2006). Treatment and
reuse of reactive dyeing effluents. Journal of Membrane Science , 269, 15-
34.
41. Barredo-Damas, S., Alcaina-Miranda, M., Iborra-Clar, M., Bes-Piá, A.,

86
Mendoza-Roca, J., & Iborra-Clar, A. (2006). Study of the UF process as
pretreatment of NF membranes for textile wastewater reuse. Desalination ,
200, 745–747.
42. Tang, C., & Chen, V. (2002). Nanofiltration of textile wastewater for water
reuse. Desalination , 143, 11-20.
43. Woerner, D. L. (n.d.). Membrane Technology in Textile Operations.
44. Ahmad, A., Puasa, S., & Abiding, S. (2006). Crossflow ultrafiltration for
removing Direct-15 dye from wastewater of textile industry. Asian Journal of
Science, Technology and Development , 23, 207-216.
45. Koyuncu, I., Topacik, D., & Wiesner, M. R. (2004). Factors influencing flux
decline during nanofiltration of solutions containing dyes and salts. Water
Research , 38, 432–440.
46. Petrinic, I., Andersen, N. P., Sostar-Turk, S., & Marechal, A. M. (2007). The
removal of reactive dye printing compounds using nanofiltration. Dyes and
Pigments , 74, 512-518.
47. Uzal, N. (2007). Recovery and reuse of indigo dyeing wastwater using
membrane technology, Doctoral Thesis. Ankara: Middle East Technical
University.
48. Chakraborty, S., Purkait, M., DasGupta, S., De, S., & Basu, J. (2003).
Nanofiltration of textile plant effluent for color removal and reduction in COD.
Separation and Purification Technology , 31, 141-151.
49. Satyanarayana, S., Bhattacharya, P., & De, S. (2000). Flux decline during
ultrafiltration of kraft black liquor using different flow modules: a
comparative study. Separation and Purification Technology 20 (2000) 155–
167 , 20, 155-167.
50. Odendaal, P. E., Mallevialle, J., & Wiesner, M. R. (1996). Water Treatment
Membrane Processes. American Water Works Association.

APPENDIX A
Table A1. RAW DATA OF NF MEMBRANE EXPERIMENTS
Membrane : GR95PP Type : UF
Operating Conditions Feed Retantate Pump
Pressure (bar) : 5.00 5.00 5.25 Temperature (0C) : 20 ± 2
TMP (bar) : 4.03 CFV (m/s) : 0.42
Clean Water Experiment Wastewater Experiment
Time (h) Flux (L/m2-h) Time (h) Flux
(L/m2-h) NaOH (g/L)
Feed COD (mg/L)
Perm COD (mg/L)
Feed Color (Pt-Co)
Perm Color (Pt-Co)
1 33.09 1 7.54 32 18856 2590 8750 538 2 25.86 2 10.22 32 17565 2687 9960 535 3 19.15 3 11.11 32 18005 2337 8905 521 4 15.41 4 11.01 32 17590 2243 9200 529 5 13.55 5 11.31 32 17456 2725 9875 520 6 12.23 6 11.44 32 16110 2585 10250 517 7 10.83 8 10.59 9 10.20
87

Membrane : GR95PP Type : UF
Operating Conditions Feed Retantate Pump
Pressure (bar) : 3.50 3.20 4.90 Temperature (0C) : 20 ± 2
TMP (bar) : 2.38 CFV (m/s) : 0.79
Clean Water Experiment Wastewater Experiment
Time (h) Flux (L/m2-h) Time (h) Flux
(L/m2-h) NaOH (g/L)
Feed COD (mg/L)
Perm COD (mg/L)
Feed Color (Pt-Co)
Perm Color (Pt-Co)
1 16.39 1 5.20 32 28240 2173 7050 524 2 12.66 2 5.95 32 24890 2375 8900 544 3 10.70 3 6.22 32 27100 2615 7500 542 4 9.48 4 6.40 32 25680 2345 7500 556 5 8.81 5 6.53 32 22560 2690 7875 558 6 8.47 6 6.72 32 24985 2480 7850 564 7 8.26 7 6.68 32 27155 2178 7855 564
Membrane : GR95PP Type : UF
Operating Conditions Feed Retantate Pump
Pressure (bar) : 7.20 7.20 7.00 Temperature (0C) : 20 ± 2
TMP (bar) : 6.23 CFV (m/s) : 1.40
88
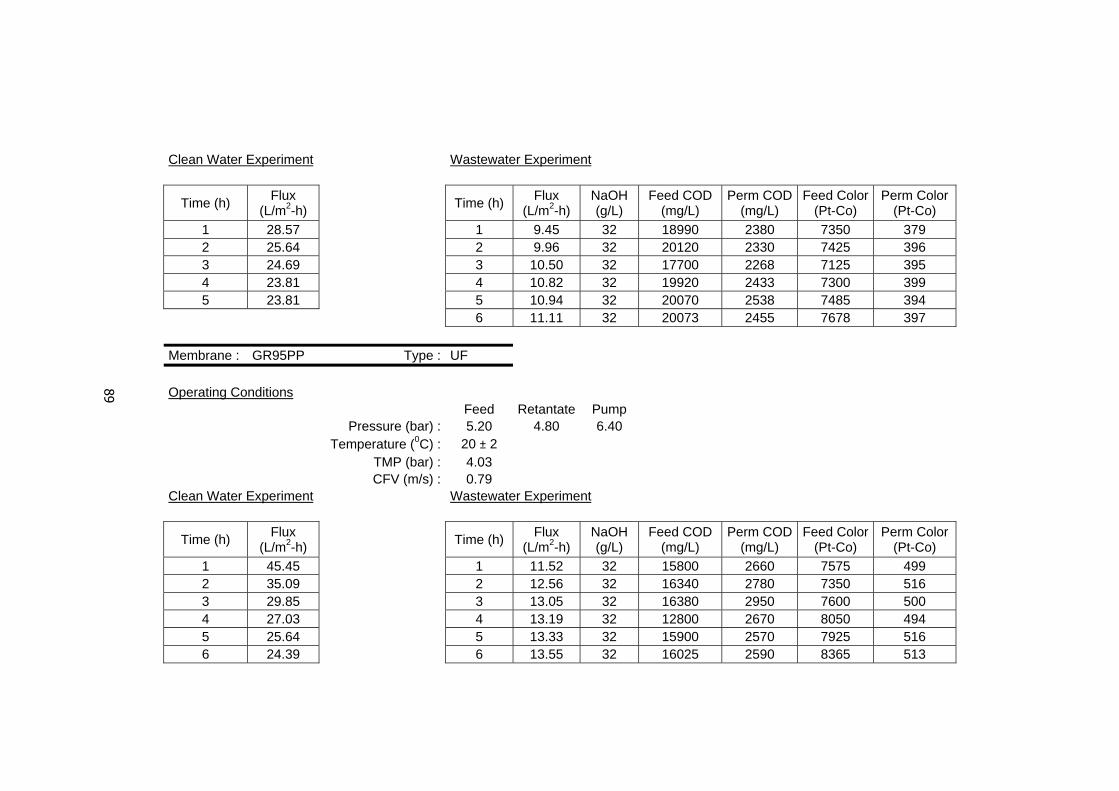
Clean Water Experiment Wastewater Experiment
Time (h) Flux (L/m2-h) Time (h) Flux
(L/m2-h) NaOH (g/L)
Feed COD (mg/L)
Perm COD (mg/L)
Feed Color (Pt-Co)
Perm Color (Pt-Co)
1 28.57 1 9.45 32 18990 2380 7350 379 2 25.64 2 9.96 32 20120 2330 7425 396 3 24.69 3 10.50 32 17700 2268 7125 395 4 23.81 4 10.82 32 19920 2433 7300 399 5 23.81 5 10.94 32 20070 2538 7485 394
6 11.11 32 20073 2455 7678 397
Membrane : GR95PP Type : UF
Operating Conditions Feed Retantate Pump
Pressure (bar) : 5.20 4.80 6.40 Temperature (0C) : 20 ± 2
TMP (bar) : 4.03 CFV (m/s) : 0.79
Clean Water Experiment Wastewater Experiment
Time (h) Flux (L/m2-h) Time (h) Flux
(L/m2-h) NaOH (g/L)
Feed COD (mg/L)
Perm COD (mg/L)
Feed Color (Pt-Co)
Perm Color (Pt-Co)
1 45.45 1 11.52 32 15800 2660 7575 499 2 35.09 2 12.56 32 16340 2780 7350 516 3 29.85 3 13.05 32 16380 2950 7600 500 4 27.03 4 13.19 32 12800 2670 8050 494 5 25.64 5 13.33 32 15900 2570 7925 516 6 24.39 6 13.55 32 16025 2590 8365 513
89
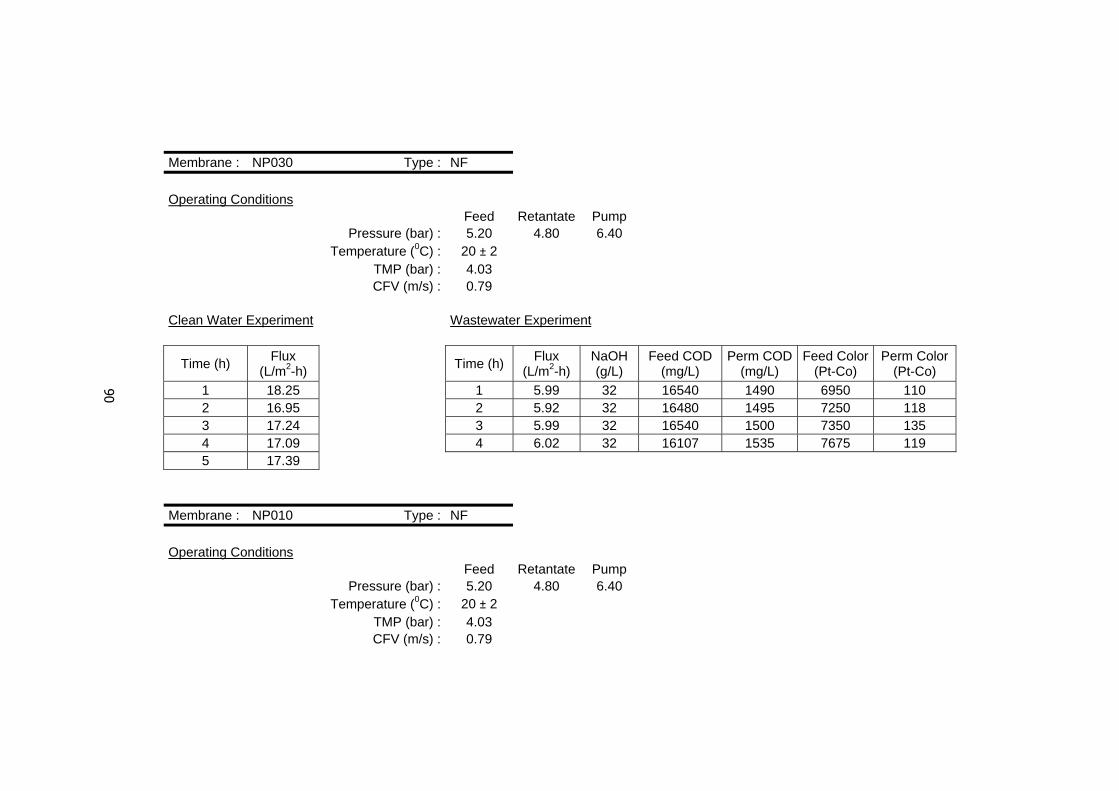
Membrane : NP030 Type : NF
Operating Conditions Feed Retantate Pump
Pressure (bar) : 5.20 4.80 6.40 Temperature (0C) : 20 ± 2
TMP (bar) : 4.03 CFV (m/s) : 0.79
Clean Water Experiment Wastewater Experiment
Time (h) Flux (L/m2-h) Time (h) Flux
(L/m2-h) NaOH (g/L)
Feed COD (mg/L)
Perm COD (mg/L)
Feed Color (Pt-Co)
Perm Color (Pt-Co)
1 18.25 1 5.99 32 16540 1490 6950 110 2 16.95 2 5.92 32 16480 1495 7250 118 3 17.24 3 5.99 32 16540 1500 7350 135 4 17.09 4 6.02 32 16107 1535 7675 119 5 17.39
Membrane : NP010 Type : NF
Operating Conditions Feed Retantate Pump
Pressure (bar) : 5.20 4.80 6.40 Temperature (0C) : 20 ± 2
TMP (bar) : 4.03 CFV (m/s) : 0.79
90

Clean Water Experiment Wastewater Experiment
Time (h) Flux (L/m2-h) Time (h) Flux
(L/m2-h) NaOH (g/L)
Feed COD (mg/L)
Perm COD (mg/L)
Feed Color (Pt-Co)
Perm Color (Pt-Co)
1 37.04 1 21.55 32 13030 1405 6875 191 2 39.22 2 21.28 32 14340 1505 7000 172 3 40.00 3 20.62 32 14540 1400 7000 205
4 20.73 32 15980 1350 7100 182 5 20.62 32 16110 1229 7475 176
Membrane : NP010 Type : NF
Operating Conditions Feed Retantate Pump
Pressure (bar) : 5.15 4.85 6.10 Temperature (0C) : 40 ± 2
TMP (bar) : 4.03 CFV (m/s) : 0.79
Clean Water Experiment Wastewater Experiment
Time (h) Flux (L/m2-h) Time (h) Flux
(L/m2-h) NaOH (g/L)
Feed COD (mg/L)
Perm COD (mg/L)
Feed Color (Pt-Co)
Perm Color (Pt-Co)
1 71.43 1 32.26 32 9760 1525 6000 357 2 74.63 2 34.19 32 11090 1898 6225 305 3 76.92 3 33.61 32 12730 1895 6125 288 4 78.13 4 34.62 32 15070 1445 6175 247 5 78.13 6 78.13
91
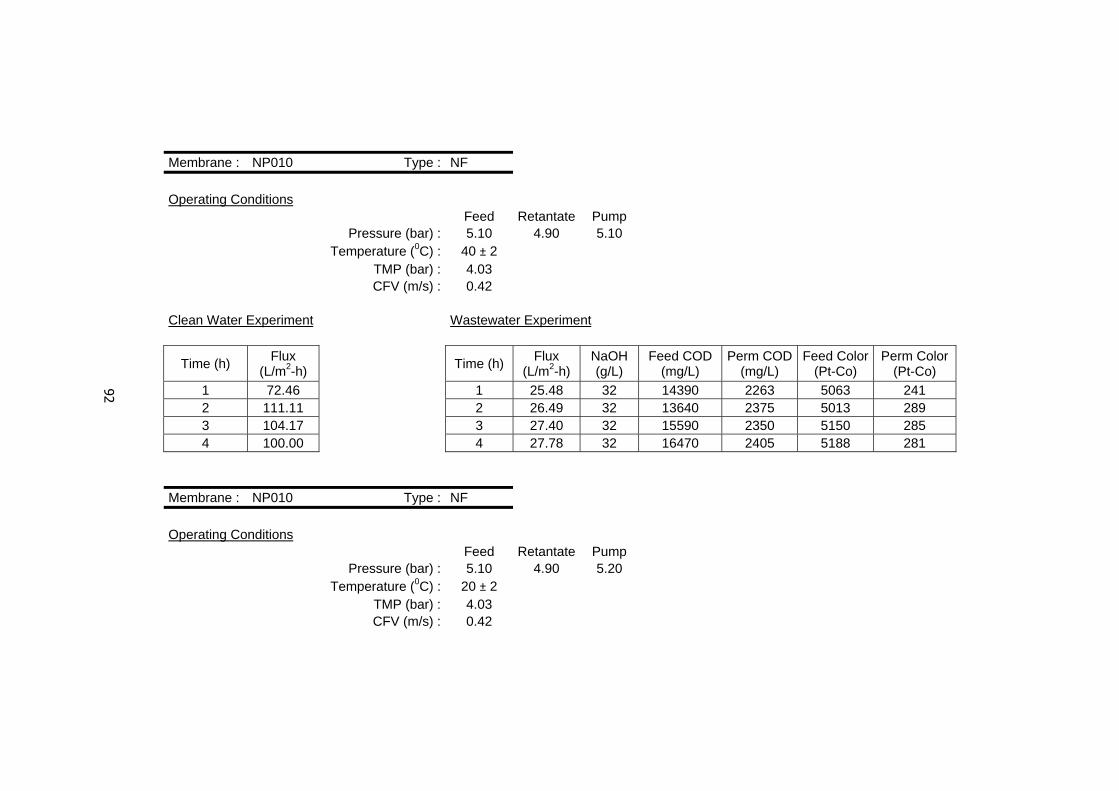
Membrane : NP010 Type : NF
Operating Conditions Feed Retantate Pump
Pressure (bar) : 5.10 4.90 5.10 Temperature (0C) : 40 ± 2
TMP (bar) : 4.03 CFV (m/s) : 0.42
Clean Water Experiment Wastewater Experiment
Time (h) Flux (L/m2-h) Time (h) Flux
(L/m2-h) NaOH (g/L)
Feed COD (mg/L)
Perm COD (mg/L)
Feed Color (Pt-Co)
Perm Color (Pt-Co)
1 72.46 1 25.48 32 14390 2263 5063 241 2 111.11 2 26.49 32 13640 2375 5013 289 3 104.17 3 27.40 32 15590 2350 5150 285 4 100.00 4 27.78 32 16470 2405 5188 281
Membrane : NP010 Type : NF
Operating Conditions Feed Retantate Pump
Pressure (bar) : 5.10 4.90 5.20 Temperature (0C) : 20 ± 2
TMP (bar) : 4.03 CFV (m/s) : 0.42
92

Clean Water Experiment Wastewater Experiment
Time (h) Flux (L/m2-h) Time (h) Flux
(L/m2-h) NaOH (g/L)
Feed COD (mg/L)
Perm COD (mg/L)
Feed Color (Pt-Co)
Perm Color (Pt-Co)
1 37.04 1 19.05 32 15050 2063 4725 268 2 36.70 2 18.87 32 15190 1990 4975 261 3 36.70 3 18.52 32 16470 1920 4663 220
4 18.26 32 15240 2278 4675 238
Membrane : NP010 Type : NF
Operating Conditions Feed Retantate Pump
Pressure (bar) : 7.10 6.90 7.20 Temperature (0C) : 20 ± 2
TMP (bar) : 6.03 CFV (m/s) : 0.79
Clean Water Experiment Wastewater Experiment
Time (h) Flux (L/m2-h) Time (h) Flux
(L/m2-h) NaOH (g/L)
Feed COD (mg/L)
Perm COD (mg/L)
Feed Color (Pt-Co)
Perm Color (Pt-Co)
1 70.42 1 19.80 32 15930 2120 4500 291 2 68.49 2 19.23 32 14450 2150 4550 247 3 70.42 3 18.96 32 16710 2073 4600 260
4 18.52 32 14700 2185 4388 259 5 18.96 32 15390 2210 4500 245
93

Membrane : NP010 Type : NF
Operating Conditions Feed Retantate Pump
Pressure (bar) : 5.20 4.80 8.40 Temperature (0C) : 20 ± 2
TMP (bar) : 4.03 CFV (m/s) : 1.36
Clean Water Experiment Wastewater Experiment
Time (h) Flux (L/m2-h) Time (h) Flux
(L/m2-h) NaOH (g/L)
Feed COD (mg/L)
Perm COD (mg/L)
Feed Color (Pt-Co)
Perm Color (Pt-Co)
1 43.48 1 26.67 32 15410 1908 4625 171 2 43.48 2 25.97 32 15310 2010 5088 211 3 43.96 3 25.16 32 15290 1848 5063 213
4 25.16 32 15620 1843 4950 209
Membrane : MPT-34 Type : NF
Operating Conditions Feed Retantate Pump
Pressure (bar) : 5.10 4.90 6.50 Temperature (0C) : 20 ± 2
TMP (bar) : 4.03 CFV (m/s) : 0.79
94

Clean Water Experiment Wastewater Experiment
Time (h) Flux (L/m2-h) Time (h) Flux
(L/m2-h) NaOH (g/L)
Feed COD (mg/L)
Perm COD (mg/L)
Feed Color (Pt-Co)
Perm Color (Pt-Co)
1 6.73 1 3.21 41 17410 510 8225 51 2 7.09 2 3.28 41 16940 525 8075 37 3 7.27 3 3.36 41 16420 505 8500 40 4 7.49 4 3.44 41 17710 502 8350 29 5 7.49 5 3.55 41 17890 498 8600 26
95

Membrane : MF-45 Type : MF
Operating Conditions Feed Retantate Pump
Pressure (bar) : 2.80 2.60 4.80 Temperature (0C) : 20 ± 2
TMP (bar) : 1.73 CFV (m/s) :
Clean Water Experiment Wastewater Experiment
Time (h) Flux (L/m2-h) Time (h) Flux
(L/m2-h) NaOH (g/L)
Feed COD (mg/L)
Perm COD (mg/L)
Feed Color (Pt-Co)
Perm Color (Pt-Co)
1 454.55 1 81.08 24 7490 1520 6390 980 2 416.67 2 71.43 24 7370 1470 6125 1070
4 57.47 24 7650 1460 6588 1005 5 53.19 24 7805 1560 6980 995 6 49.02 24 8900 1695 7600 1305 7 47.62 24 8700 1560 7495 1245 8 45.87 24 9050 1565 8885 1345 9 45.05 24 9635 1745 9050 1465 10 45.05 24 10160 1880 10005 1540
11.5 42.02 24 11130 1890 9870 1590 14.5 38.17 24 12890 2140 9805 1600 23 26.46 24 11780 2350 9675 1690
96

Membrane : MPT-34 (after MF-45) Type: NF Operating Conditions
Feed Retantate Pump Pressure (bar) : 5.10 4.90 6.50
Temperature (0C) : 20 ± 2 TMP (bar) : 4.03 CFV (m/s) : 0.79
Wastewater Experiment
Time (h) Flux (L/m2-h)
NaOH (g/L)
Feed COD (mg/L)
Perm COD (mg/L)
Feed Color (Pt-Co)
Perm Color (Pt-Co)
2 3.94 24 3120 258 1080 5 4 4.11 24 5500 308 2470 15 7 3.87 24 2980 185 1250 25 15 4.66 24 3575 193 1220 7 23 4.83 24 3355 175 1395 8 29 4.44 24 3605 218 1545 17 38 4.66 24 4040 208 1605 23 55 4.03 24 4315 190 1820 21 63 4.65 24 4540 225 1900 23 73 4.33 24 4785 263 2005 20 86 4.02 24 4890 290 2165 49 96 3.98 24 4405 230 2655 4
108 3.42 24 4275 210 2940 7 122 3.21 24 4305 190 2760 12 131 2.82 24 3910 220 2890 18 142 2.31 24 3990 210 2455 14
97