cattle and calves predator death loss in the united states ... · cattle and calves predator death...
TRANSCRIPT
Cattle and Calves Predator Death Loss in the United States, 2010
United States Department of Agriculture
Animal and Plant Health Inspection Service Veterinary Services Wildlife Services National Animal Health Monitoring System February 2012
Cover photo courtesy of National Cattlemen’s Beef Association
The U.S. Department of Agriculture (USDA) prohibits discrimination in all its programs and activities on the basis of race, color, national origin, age, disability, and where applicable, sex, marital status, familial status, parental status, religion, sexual orientation, genetic information, political beliefs, reprisal, or because all or part of an individual’s income is derived from any public assistance program. (Not all prohibited bases apply to all programs.) Persons with disabilities who require alternative means for communication of program information (Braille, large print, audiotape, etc.) should contact USDA’s TARGET Center at (202) 720-2600 (voice and TDD). To file a complaint of discrimination, write to USDA, Director, Office of Civil Rights, 1400 Independence Avenue, S.W., Washington, D.C. 20250-9410, or call (800) 795-3272 (voice) or (202) 720-6382 (TDD). USDA
is an equal opportunity provider and employer. Mention of companies or commercial products does not imply recommendation or endorsement by the U.S. Department of Agriculture over others not mentioned. USDA neither guarantees nor warrants the standard of any product mentioned. Product names are mentioned solely to report factually on available data and to provide specific information. USDA–APHIS–VS–CEAH NRRC Building B, M.S. 2E7 2150 Centre Avenue Fort Collins, CO 80526-8117 970.494.7000 E-mail: [email protected] http://nahms.aphis.usda.gov #643.0212

i
Items of Note
This report focuses on beef operations because in 2010 the vast majority of cattle and calf predator losses occurred on beef operations—89.4 percent of all cattle predator losses and 94.0 percent of all calf predator losses were on beef operations. The remainder of losses was on dairy, mixed, or other operation types. Beef operations lost 7.4 cattle per 10,000 head to predators in 2010. Coyotes were the single largest predator cause, accounting for about one-third of predator losses. There were some regional differences, with producers in the western United States attributing a lower percentage of losses to coyotes and a higher percentage of losses to unknown predators. A total of 61.7 calves per 10,000 born were lost to predators on beef operations in 2010. Small operations (1 to 49 cows) lost almost double the number of calves to predators (95.3 calves lost per 10,000 born) than the larger operation sizes (50 or more cows) [about 50 calves lost per 10,000 born]. Coyotes were the single largest predator cause of calf loss and accounted for over one-half (56.9 percent) of calf predator losses. In the Southwest and South Central regions, mountain lions were also an important cause of death loss, accounting for about 12 percent of calf predator losses. More than 10 percent of calf predator losses were attributed to dogs in the Southeast and South Central regions, a much higher percentage than in the other regions. The percentage of beef operations that used nonlethal predator control methods increased since 2000. In 2010, 12.4 percent of beef operations used at least one nonlethal predator control method, compared with 5.4 percent of operations in 2000. The most common nonlethal method was guard animals, followed by frequent checks, fencing, and culling. Of operations that used any nonlethal predator control method, 41.8 percent used two or more methods.
ii
Acknowledgments This report was a cooperative effort between two U.S. Department of Agriculture (USDA) Agencies: the National Agricultural Statistics Service (NASS) and the Animal and Plant Health Inspection Service (APHIS). We’d like to thank the NASS enumerators who contacted cattle producers and collected the data. Their hard work and dedication were invaluable. We’d also like to thank the personnel at the USDA–APHIS–Veterinary Services’ Centers for Epidemiology and Animal Health for their efforts in generating and distributing this report, and the USDA-APHIS–Wildlife Services for their involvement. All participants are to be commended, particularly the producers whose voluntary efforts made this report possible.
Larry Granger Director Centers for Epidemiology and Animal Health

iii
Suggested bibliographic citation for this report: USDA. 2012. “Cattle and Calves Predator Death Loss in the United States, 2010". USDA–APHIS–VS–CEAH, National Animal Health Monitoring System, Fort Collins, CO #643.0312 Contacts for further information: Questions or comments on the Cattle and Calves Predator Death Loss in the United States, 2010 report: Dr. David Dargatz (970)-494-7000 Information on reprints or other reports: Ms. Abby Zehr (970) 494-7000 Feedback Feedback, comments, and suggestions regarding the Cattle and Calves Predator Death Loss report are welcomed. You may submit feedback via online survey at: http://nahms.aphis.usda.gov (Click on “FEEDBACK on NAHMS reports.”)

iv
Table of Contents
Introduction 1 Terms Used in This Report 2 Section I: Historical Overview—Number of Head 4 A. U.S. Demographics 4 1. Inventory—January 1, 1992-2011 4 2. Operations—1991-2010 4 3. Calf crop—1991-2010 7 B. Regional Demographics 7 1. Cattle and calves inventory—January 1, 1992, 1996, 2001, 2006, and 2011 7 2. Beef and dairy cow inventory—January 1, 1992, 1996, 2001, 2006, and 2011 8
3. Calf crop—1991, 1995, 2000, 2005, and 2010 9
C. Death Loss 9 1. Loss from all causes—1991–2010 9 2. Nonpredator and predator death loss (excluding Alaska)—1991, 1995, 2000, 2005, and 2010 11
3. Regional death loss—1991, 1995, 2000, 2005, and 2010 12 4. Regional nonpredator and predator death loss—1995, 2000, 2005, and 2010 14
Section II: Population Estimates—Losses Due to Predators 18 A. Operation Classification 18 1. Operation classification process 18 2. Operation characteristics 18 B. Cattle Death Loss on Beef Operations Due to Predators 21 1. Predator losses as a proportion of inventory—2005 21 2. Cause of predator loss—1991, 1995, 2000, and 2005 22 3. Cause of predator loss by size of operation—2005 23 4. Cause of predator loss by region—2005 24 C. Calf Death Loss on Beef Operations Due to Predators 26 1. Predator losses as a percentage of calves born—2010 26 2. Cause of predator loss—1991, 1995, 2000, 2005, and 2010 27 3. Cause of predator loss by size of operations—2010 28 4. Cause of predator loss by region—2010 29 D. Nonlethal Predator Control on Beef Operations 31 1. Frequency of use 31 2. Operations that used nonlethal control methods 34 Section III: Methodology 38 A. Cattle and Calf Death Loss Estimates 38 1. Survey procedures 38 2. Estimation procedures 38 3. Reliability 38 4. Revision 38 Appendix: U.S. Population and Operations 39

1
Introduction Each January, the U.S. Department of Agriculture’s (USDA) National Agricultural Statistics Service (NASS) collects cattle data on inventory, calf crop, and total death losses for State and national estimating programs. Inventory and calf crop estimates (number of head) are published in January, while cattle and calves death losses (number of head) are published annually in April via the “Meat Animals: Production, Disposition and Income” report. For the January 1992, 1996, 2001, 2006, and 2011 surveys, USDA’s Animal and Plant Health Inspection Service (APHIS) provided funding for a detailed breakdown of total losses for producer-attributed cause of loss occurring the previous year. Death losses (number of head) by cause for predator and nonpredator losses were estimated and subsequently published by NASS (Cattle Death Loss, May 12, 2011). This report provides additional analysis of cattle and calves losses in 2010 from all causes. Death losses by size group and region are also provided, with special emphasis on predator causes of loss. When possible the 1991, 1995, 2000, and 2005 death losses are provided for comparison.
2
Terms Used in This Report NA: Not available. Operation classification:
Beef: If an operation had more beef cows than milk cows and the milk cows numbered fewer than five head, the operation was classified as a beef cattle operation.
Dairy: If an operation had more milk cows than beef cows and beef cows numbered fewer than five head, the operation was classified as a dairy cattle operation.
Mixed: If an operation had more than five beef cows and more than five milk cows, or if the number of beef cows equaled the number of milk cows, the operation was classified as a mixed operation.
Other: Operation that did not meet the criteria to be classified as beef, dairy, or mixed operation.
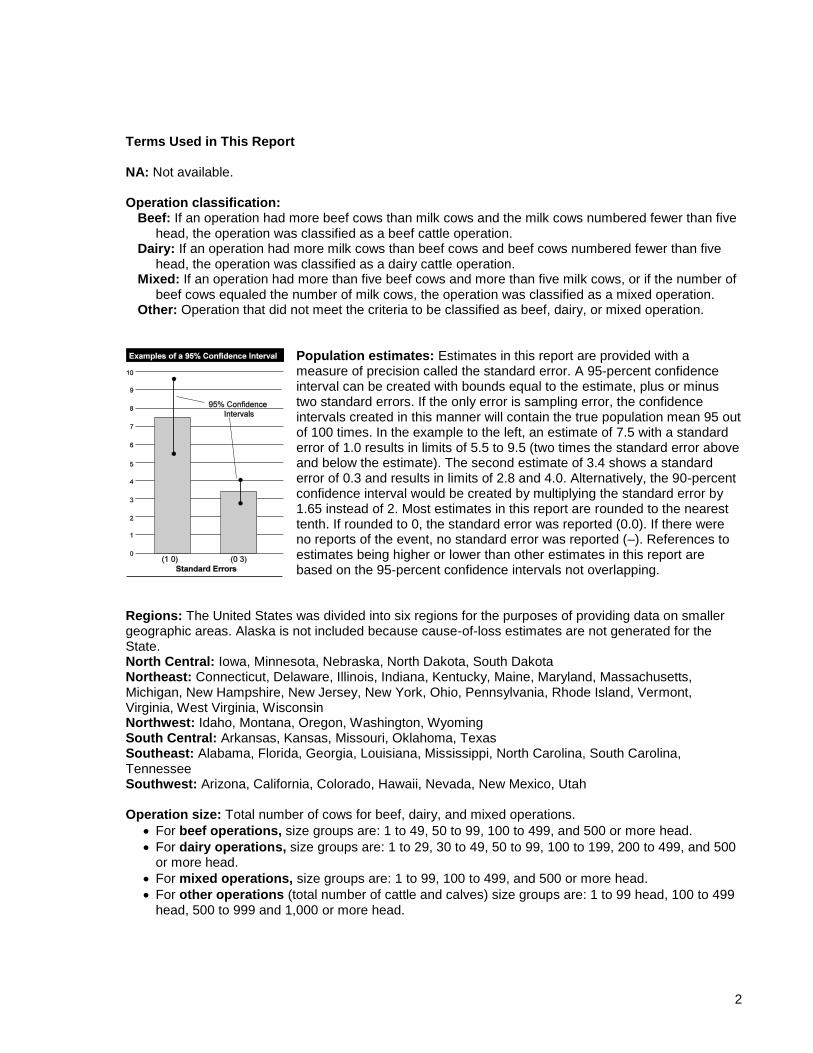
Population estimates: Estimates in this report are provided with a measure of precision called the standard error. A 95-percent confidence interval can be created with bounds equal to the estimate, plus or minus two standard errors. If the only error is sampling error, the confidence intervals created in this manner will contain the true population mean 95 out of 100 times. In the example to the left, an estimate of 7.5 with a standard error of 1.0 results in limits of 5.5 to 9.5 (two times the standard error above and below the estimate). The second estimate of 3.4 shows a standard error of 0.3 and results in limits of 2.8 and 4.0. Alternatively, the 90-percent confidence interval would be created by multiplying the standard error by 1.65 instead of 2. Most estimates in this report are rounded to the nearest tenth. If rounded to 0, the standard error was reported (0.0). If there were no reports of the event, no standard error was reported (–). References to estimates being higher or lower than other estimates in this report are based on the 95-percent confidence intervals not overlapping.
Regions: The United States was divided into six regions for the purposes of providing data on smaller geographic areas. Alaska is not included because cause-of-loss estimates are not generated for the State. North Central: Iowa, Minnesota, Nebraska, North Dakota, South Dakota Northeast: Connecticut, Delaware, Illinois, Indiana, Kentucky, Maine, Maryland, Massachusetts, Michigan, New Hampshire, New Jersey, New York, Ohio, Pennsylvania, Rhode Island, Vermont, Virginia, West Virginia, Wisconsin Northwest: Idaho, Montana, Oregon, Washington, Wyoming South Central: Arkansas, Kansas, Missouri, Oklahoma, Texas Southeast: Alabama, Florida, Georgia, Louisiana, Mississippi, North Carolina, South Carolina, Tennessee Southwest: Arizona, California, Colorado, Hawaii, Nevada, New Mexico, Utah Operation size: Total number of cows for beef, dairy, and mixed operations.
For beef operations, size groups are: 1 to 49, 50 to 99, 100 to 499, and 500 or more head.
For dairy operations, size groups are: 1 to 29, 30 to 49, 50 to 99, 100 to 199, 200 to 499, and 500 or more head.
For mixed operations, size groups are: 1 to 99, 100 to 499, and 500 or more head.
For other operations (total number of cattle and calves) size groups are: 1 to 99 head, 100 to 499 head, 500 to 999 and 1,000 or more head.

3
4
Section I: Historical Overview—Number of Head
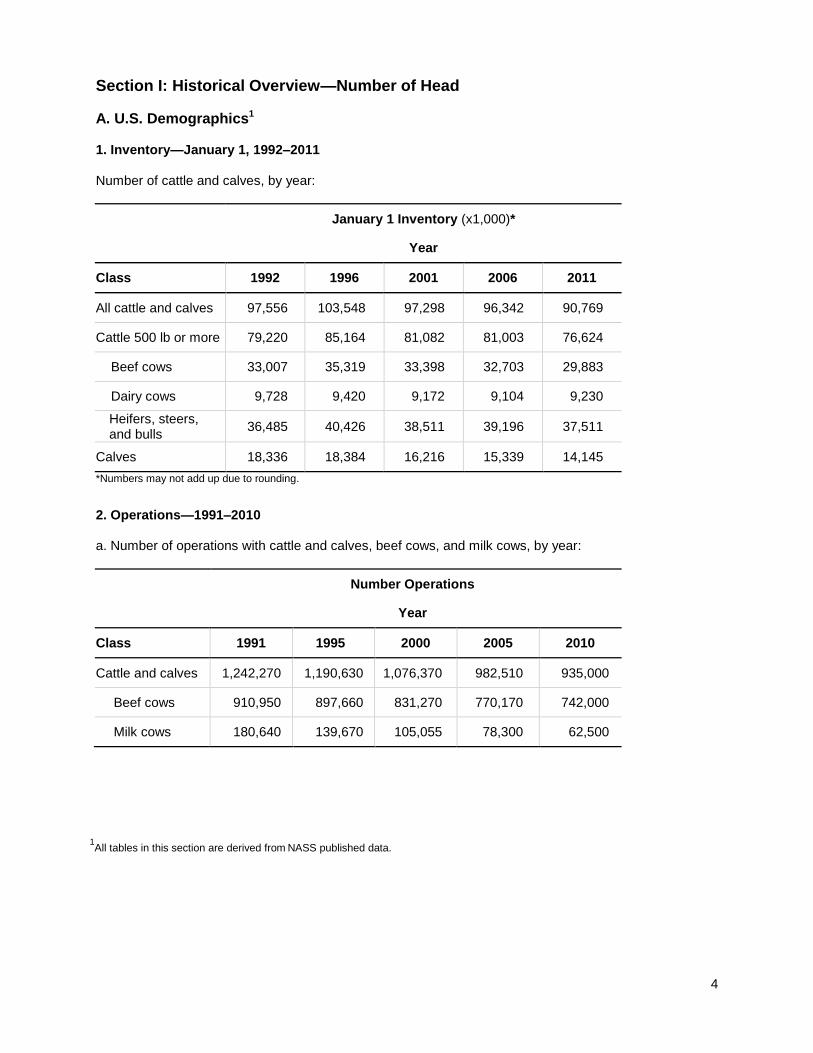
A. U.S. Demographics1 1. Inventory—January 1, 1992–2011 Number of cattle and calves, by year:
January 1 Inventory (x1,000)*
Year
Class 1992 1996 2001 2006 2011
All cattle and calves 97,556 103,548 97,298 96,342 90,769
Cattle 500 lb or more 79,220 85,164 81,082 81,003 76,624
Beef cows 33,007 35,319 33,398 32,703 29,883
Dairy cows 9,728 9,420 9,172 9,104 9,230
Heifers, steers, and bulls
36,485 40,426 38,511 39,196 37,511
Calves 18,336 18,384 16,216 15,339 14,145
*Numbers may not add up due to rounding.
2. Operations—1991–2010 a. Number of operations with cattle and calves, beef cows, and milk cows, by year:
Number Operations
Year
Class 1991 1995 2000 2005 2010
Cattle and calves 1,242,270 1,190,630 1,076,370 982,510 935,000
Beef cows 910,950 897,660 831,270 770,170 742,000
Milk cows 180,640 139,670 105,055 78,300 62,500
1All tables in this section are derived from
NASS published data.

5
b. Percentage of operations with beef cows, by size of operation and by year:
Percent Operations
Year
Size of operation (number of beef cows) 1991 1995 2000 2005 2010
1–49 81.2 79.8 78.8 77.5 79.2
50–99 11.2 11.8 12.0 12.3 11.1
100–499 7.6* 7.8 8.5 9.5 8.9
500 or more NA 0.6 0.7 0.7 0.8
Total 100.0 100.0 100.0 100.0 100.0
*100 head or more.
c. Percentage of operations with dairy cows, by size of operation and by year:
Percent Operations
Year
Size of operation (number of dairy cows) 1991 1995 2000 2005 2010
1–29 39.8 34.5 29.3 28.7 32.0
30–49 22.8 22.2 21.1 19.0 17.6
50–99 25.9 28.1 29.7 29.6 24.8
100–199 11.5* 10.2 12.2 12.8 13.8
200 or more NA 5.0 7.7 9.9 11.8
200–499 NA NA 5.1 6.0 6.4
500 or more NA NA 2.6 3.9 5.4
Total 100.0 100.0 100.0 100.0 100.0
*100 head or more.
6
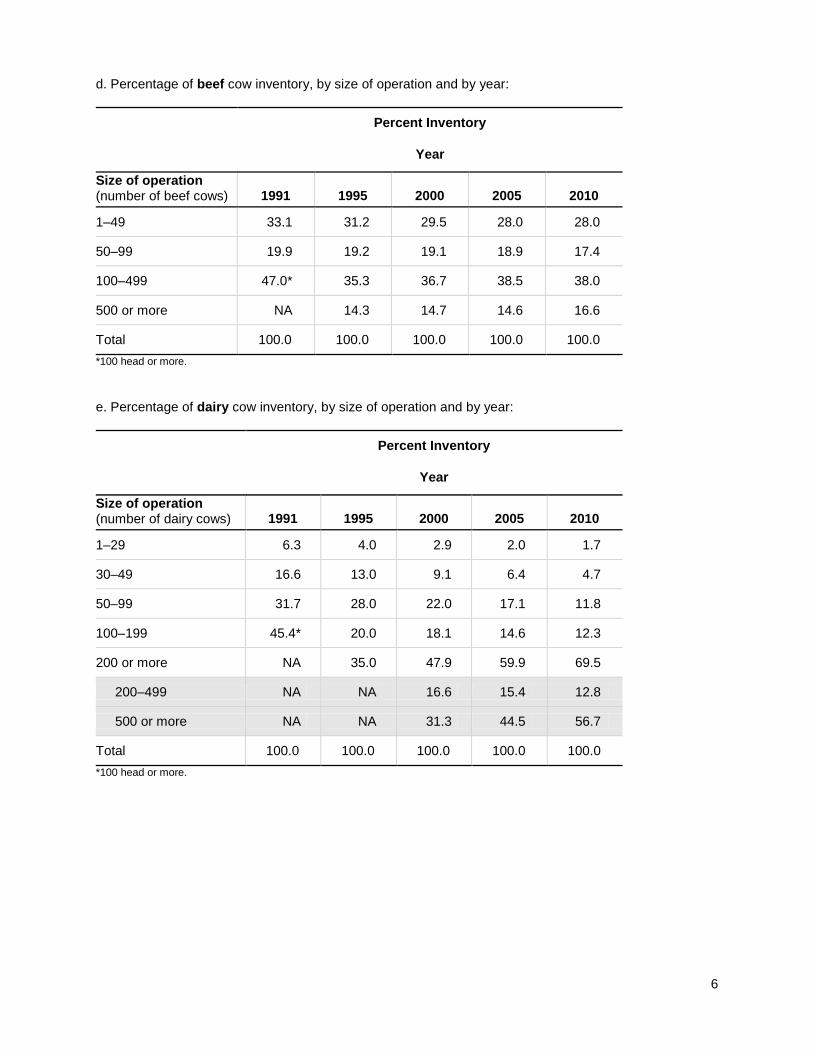
d. Percentage of beef cow inventory, by size of operation and by year:
Percent Inventory
Year
Size of operation (number of beef cows) 1991 1995 2000 2005 2010
1–49 33.1 31.2 29.5 28.0 28.0
50–99 19.9 19.2 19.1 18.9 17.4
100–499 47.0* 35.3 36.7 38.5 38.0
500 or more NA 14.3 14.7 14.6 16.6
Total 100.0 100.0 100.0 100.0 100.0
*100 head or more.
e. Percentage of dairy cow inventory, by size of operation and by year:
Percent Inventory
Year
Size of operation (number of dairy cows) 1991 1995 2000 2005 2010
1–29 6.3 4.0 2.9 2.0 1.7
30–49 16.6 13.0 9.1 6.4 4.7
50–99 31.7 28.0 22.0 17.1 11.8
100–199 45.4* 20.0 18.1 14.6 12.3
200 or more NA 35.0 47.9 59.9 69.5
200–499 NA NA 16.6 15.4 12.8
500 or more NA NA 31.3 44.5 56.7
Total 100.0 100.0 100.0 100.0 100.0
*100 head or more.
7
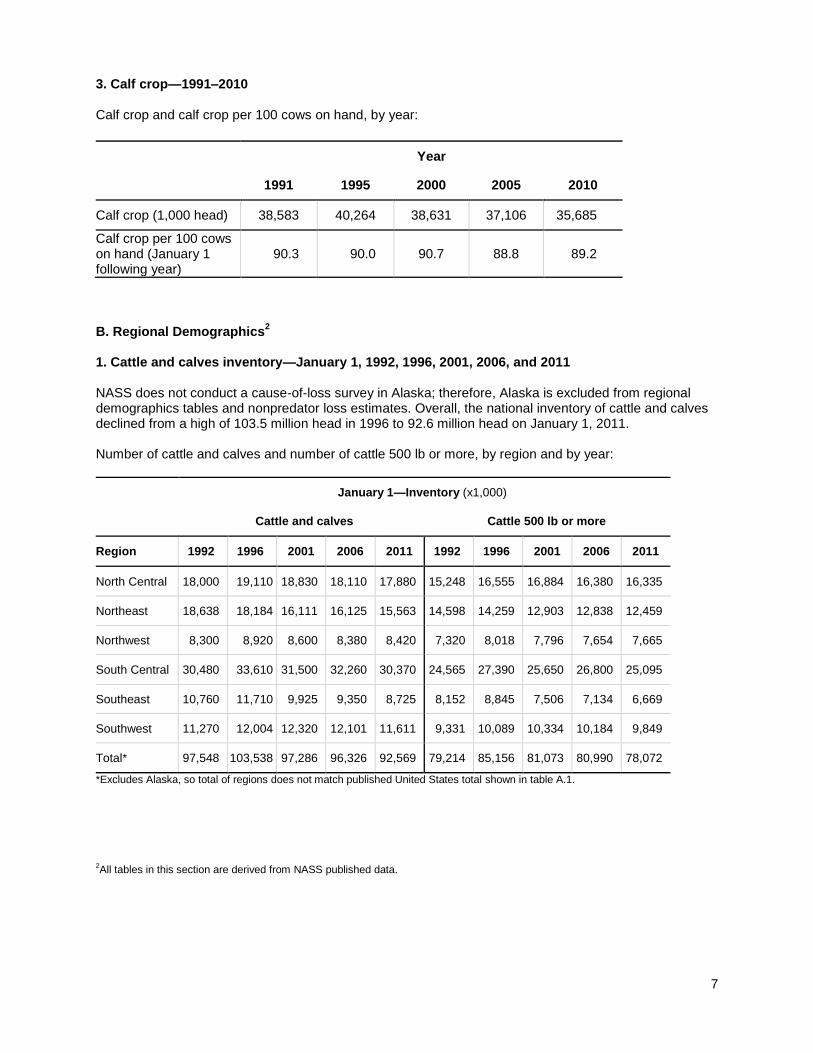
3. Calf crop—1991–2010 Calf crop and calf crop per 100 cows on hand, by year:
Year
1991 1995 2000 2005 2010
Calf crop (1,000 head) 38,583 40,264 38,631 37,106 35,685
Calf crop per 100 cows on hand (January 1 following year)
90.3 90.0 90.7 88.8 89.2
B. Regional Demographics
2
1. Cattle and calves inventory—January 1, 1992, 1996, 2001, 2006, and 2011 NASS does not conduct a cause-of-loss survey in Alaska; therefore, Alaska is excluded from regional demographics tables and nonpredator loss estimates. Overall, the national inventory of cattle and calves declined from a high of 103.5 million head in 1996 to 92.6 million head on January 1, 2011. Number of cattle and calves and number of cattle 500 lb or more, by region and by year:
January 1—Inventory (x1,000)
Cattle and calves Cattle 500 lb or more
Region 1992 1996 2001 2006 2011 1992 1996 2001 2006 2011
North Central 18,000 19,110 18,830 18,110 17,880 15,248 16,555 16,884 16,380 16,335
Northeast 18,638 18,184 16,111 16,125 15,563 14,598 14,259 12,903 12,838 12,459
Northwest 8,300 8,920 8,600 8,380 8,420 7,320 8,018 7,796 7,654 7,665
South Central 30,480 33,610 31,500 32,260 30,370 24,565 27,390 25,650 26,800 25,095
Southeast 10,760 11,710 9,925 9,350 8,725 8,152 8,845 7,506 7,134 6,669
Southwest 11,270 12,004 12,320 12,101 11,611 9,331 10,089 10,334 10,184 9,849
Total* 97,548 103,538 97,286 96,326 92,569 79,214 85,156 81,073 80,990 78,072
*Excludes Alaska, so total of regions does not match published United States total shown in table A.1.
2All tables in this section are derived from NASS published data.
8
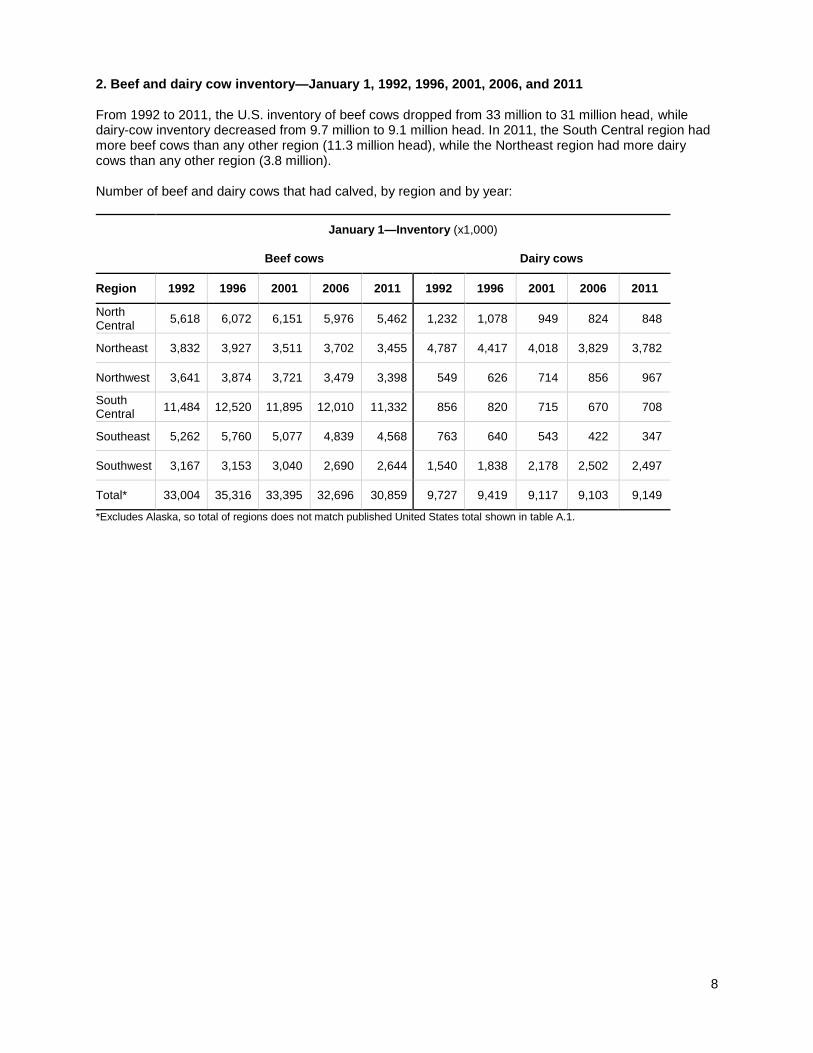
2. Beef and dairy cow inventory—January 1, 1992, 1996, 2001, 2006, and 2011 From 1992 to 2011, the U.S. inventory of beef cows dropped from 33 million to 31 million head, while dairy-cow inventory decreased from 9.7 million to 9.1 million head. In 2011, the South Central region had more beef cows than any other region (11.3 million head), while the Northeast region had more dairy cows than any other region (3.8 million). Number of beef and dairy cows that had calved, by region and by year:
January 1—Inventory (x1,000)
Beef cows Dairy cows
Region 1992 1996 2001 2006 2011 1992 1996 2001 2006 2011
North Central
5,618 6,072 6,151 5,976 5,462 1,232 1,078 949 824 848
Northeast 3,832 3,927 3,511 3,702 3,455 4,787 4,417 4,018 3,829 3,782
Northwest 3,641 3,874 3,721 3,479 3,398 549 626 714 856 967
South Central
11,484 12,520 11,895 12,010 11,332 856 820 715 670 708
Southeast 5,262 5,760 5,077 4,839 4,568 763 640 543 422 347
Southwest 3,167 3,153 3,040 2,690 2,644 1,540 1,838 2,178 2,502 2,497
Total* 33,004 35,316 33,395 32,696 30,859 9,727 9,419 9,117 9,103 9,149
*Excludes Alaska, so total of regions does not match published United States total shown in table A.1.

9
3. Calf crop—1991, 1995, 2000, 2005, and 2010 About 30 percent of the 35.7 million beef and dairy calves born in 2010 were born in the South Central region. Calendar year calf crop, by region and by year:
Calf Crop (x1,000)
Year
Region 1991 1995 2000 2005 2010
North Central 6,570 6,770 6,730 6,340 6,000
Northeast 7,823 7,5767 6,813 6,560 6,256
Northwest 3,945 4,280 4,410 4,140 4,190
South Central 11,070 11,910 11,330 11,180 10,770
Southeast 5,205 5,475 4,880 4,520 4,175
Southwest 3,968 4,249 4,464 4,361 4,290
Total* 38,581 40,261 38,627 37,101 35,681
*Excludes Alaska, so total of regions does not match published United States total shown in table A.1.
C. Death Loss
3
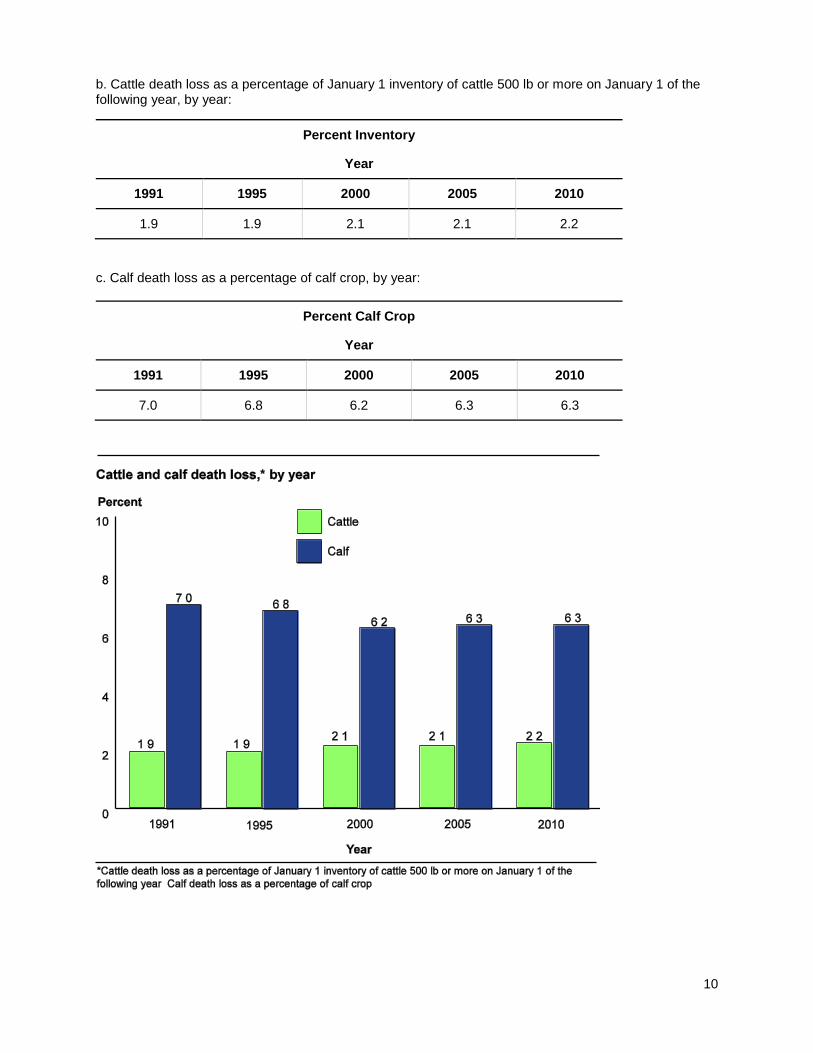
1. Loss from all causes—1991–2010 During 2010, 1.7 million cattle and 2.3 million calves were lost to all causes. These totals represent 2.2 and 6.3 percent of cattle inventory and calf crop, respectively. The percentage of cattle inventory lost, and the actual losses, increased slightly from 1.9 percent in 1991 to 2.2 percent in 2010. The percentage of calf crop lost declined from 7.0 percent in 1991 to 6.3 percent in 2010. a. Number of cattle and calf death losses due to all causes, by year
:
Number (x1,000)
Year
1991 1995 2000 2005 2010
Cattle 1,540 1,645 1,711 1,718 1,735
Calves 2,707 2,739 2,387 2,335 2,260
Total 4,247 4,384 4,098 4,053 3,993
3Source: NASS published data.
10
b. Cattle death loss as a percentage of January 1 inventory of cattle 500 lb or more on January 1 of the following year, by year:
Percent Inventory
Year
1991 1995 2000 2005 2010
1.9 1.9 2.1 2.1 2.2
c. Calf death loss as a percentage of calf crop, by year:
Percent Calf Crop
Year
1991 1995 2000 2005 2010
7.0 6.8 6.2 6.3 6.3
11
2. Nonpredator and predator death loss (excluding Alaska)—19912, 1995
2, 2000
2, 2005, and 2010
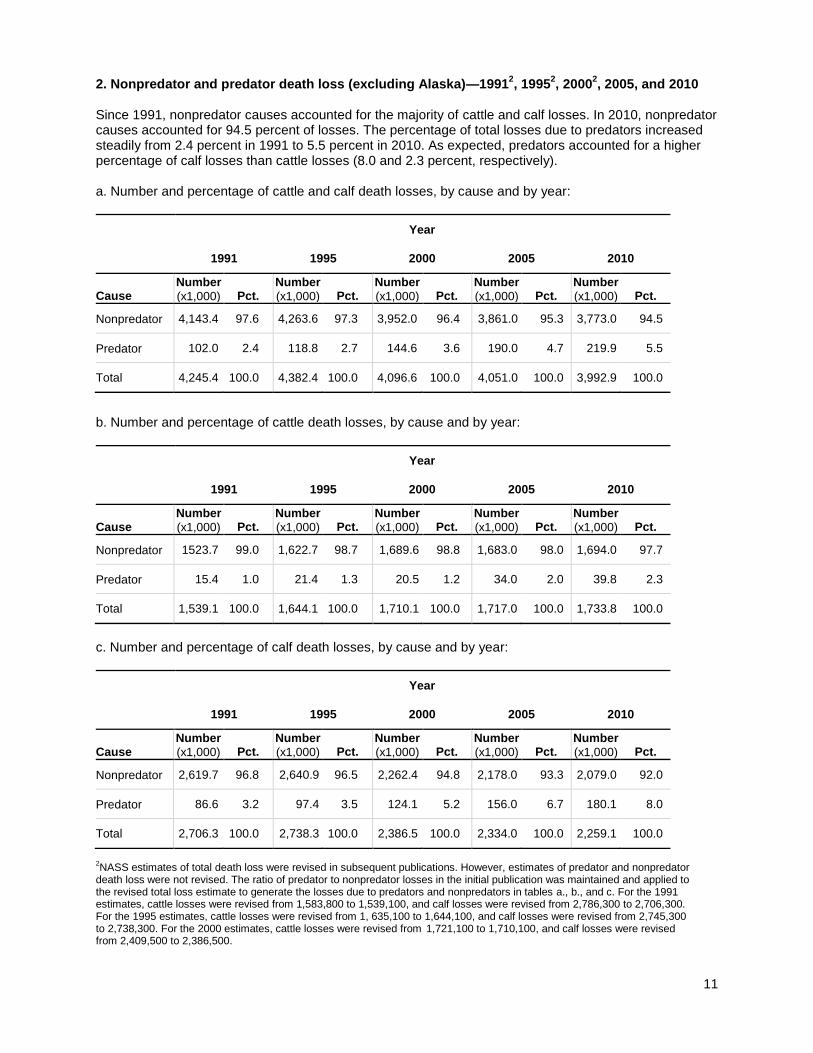
Since 1991, nonpredator causes accounted for the majority of cattle and calf losses. In 2010, nonpredator causes accounted for 94.5 percent of losses. The percentage of total losses due to predators increased steadily from 2.4 percent in 1991 to 5.5 percent in 2010. As expected, predators accounted for a higher percentage of calf losses than cattle losses (8.0 and 2.3 percent, respectively). a. Number and percentage of cattle and calf death losses, by cause and by year:
Year
1991 1995 2000 2005 2010
Cause Number
(x1,000) Pct. Number
(x1,000) Pct. Number
(x1,000) Pct. Number
(x1,000) Pct. Number
(x1,000) Pct.
Nonpredator 4,143.4 97.6 4,263.6 97.3 3,952.0 96.4 3,861.0 95.3 3,773.0 94.5
Predator 102.0 2.4 118.8 2.7 144.6 3.6 190.0 4.7 219.9 5.5
Total 4,245.4 100.0 4,382.4 100.0 4,096.6 100.0 4,051.0 100.0 3,992.9 100.0
b. Number and percentage of cattle death losses, by cause and by year:
Year
1991 1995 2000 2005 2010
Cause Number
(x1,000) Pct. Number
(x1,000) Pct. Number
(x1,000) Pct. Number
(x1,000) Pct. Number
(x1,000) Pct.
Nonpredator 1523.7 99.0 1,622.7 98.7 1,689.6 98.8 1,683.0 98.0 1,694.0 97.7
Predator 15.4 1.0 21.4 1.3 20.5 1.2 34.0 2.0 39.8 2.3
Total 1,539.1 100.0 1,644.1 100.0 1,710.1 100.0 1,717.0 100.0 1,733.8 100.0
c. Number and percentage of calf death losses, by cause and by year:
Year
1991 1995 2000 2005 2010
Cause Number
(x1,000) Pct. Number
(x1,000) Pct. Number
(x1,000) Pct. Number
(x1,000) Pct. Number
(x1,000) Pct.
Nonpredator 2,619.7 96.8 2,640.9 96.5 2,262.4 94.8 2,178.0 93.3 2,079.0 92.0
Predator 86.6 3.2 97.4 3.5 124.1 5.2 156.0 6.7 180.1 8.0
Total 2,706.3 100.0 2,738.3 100.0 2,386.5 100.0 2,334.0 100.0 2,259.1 100.0
2NASS estimates of total death loss were revised in subsequent publications. However, estimates of predator and nonpredator
death loss were not revised. The ratio of predator to nonpredator losses in the initial publication was maintained and applied to the revised total loss estimate to generate the losses due to predators and nonpredators in tables a., b., and c. For the 1991 estimates, cattle losses were revised from 1,583,800 to 1,539,100, and calf losses were revised from 2,786,300 to 2,706,300. For the 1995 estimates, cattle losses were revised from 1, 635,100 to 1,644,100, and calf losses were revised from 2,745,300 to 2,738,300. For the 2000 estimates, cattle losses were revised from 1,721,100 to 1,710,100, and calf losses were revised from 2,409,500 to 2,386,500.
12
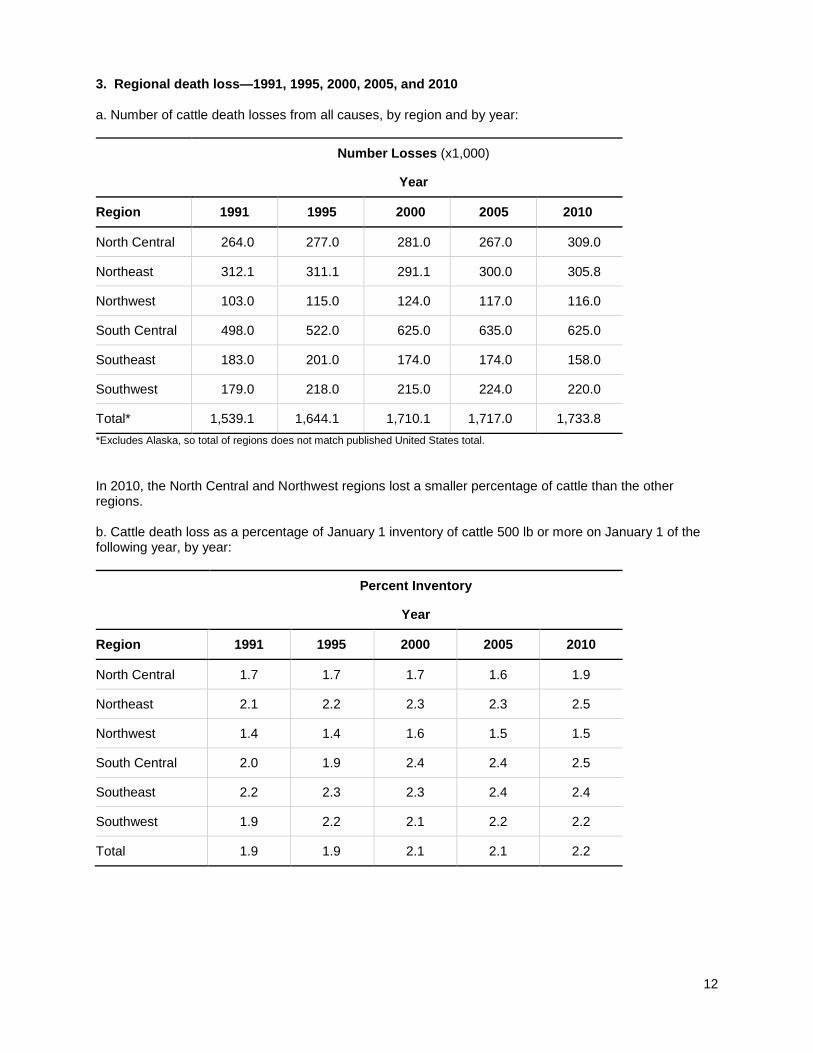
3. Regional death loss—1991, 1995, 2000, 2005, and 2010 a. Number of cattle death losses from all causes, by region and by year:
Number Losses (x1,000)
Year
Region 1991 1995 2000 2005 2010
North Central 264.0 277.0 281.0 267.0 309.0
Northeast 312.1 311.1 291.1 300.0 305.8
Northwest 103.0 115.0 124.0 117.0 116.0
South Central 498.0 522.0 625.0 635.0 625.0
Southeast 183.0 201.0 174.0 174.0 158.0
Southwest 179.0 218.0 215.0 224.0 220.0
Total* 1,539.1 1,644.1 1,710.1 1,717.0 1,733.8
*Excludes Alaska, so total of regions does not match published United States total.
In 2010, the North Central and Northwest regions lost a smaller percentage of cattle than the other regions. b. Cattle death loss as a percentage of January 1 inventory of cattle 500 lb or more on January 1 of the following year, by year:
Percent Inventory
Year
Region 1991 1995 2000 2005 2010
North Central 1.7 1.7 1.7 1.6 1.9
Northeast 2.1 2.2 2.3 2.3 2.5
Northwest 1.4 1.4 1.6 1.5 1.5
South Central 2.0 1.9 2.4 2.4 2.5
Southeast 2.2 2.3 2.3 2.4 2.4
Southwest 1.9 2.2 2.1 2.2 2.2
Total 1.9 1.9 2.1 2.1 2.2
13
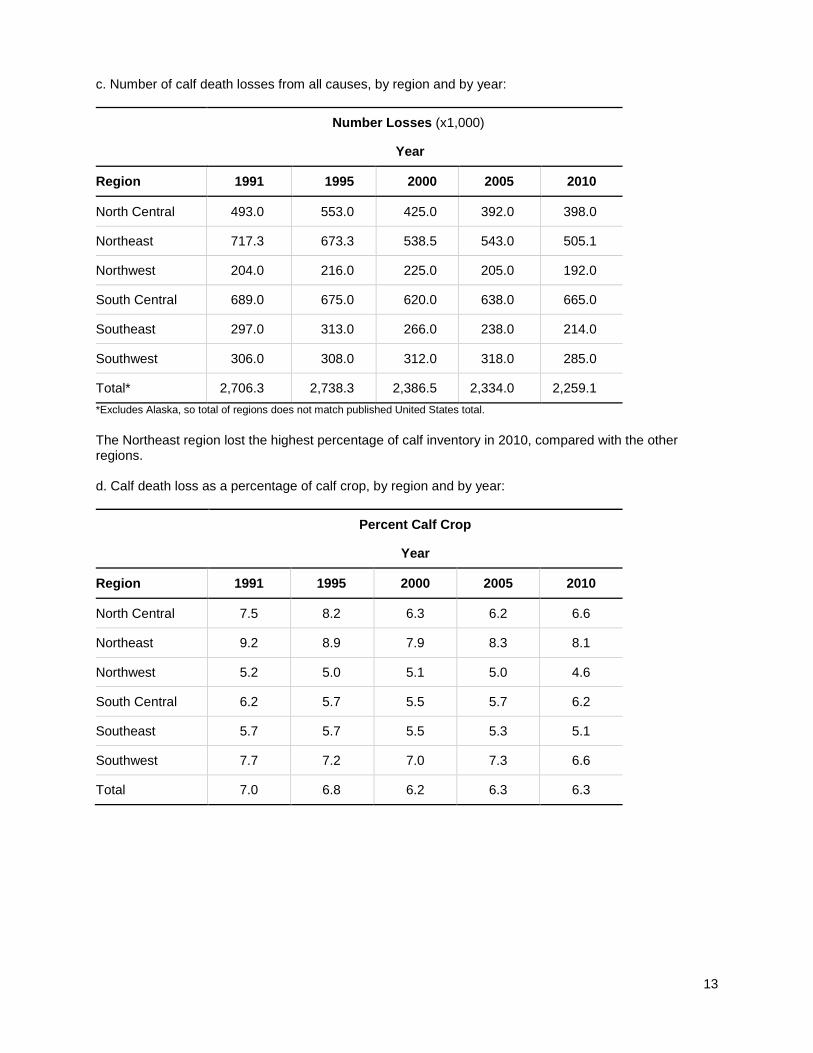
c. Number of calf death losses from all causes, by region and by year:
Number Losses (x1,000)
Year
Region 1991 1995 2000 2005 2010
North Central 493.0 553.0 425.0 392.0 398.0
Northeast 717.3 673.3 538.5 543.0 505.1
Northwest 204.0 216.0 225.0 205.0 192.0
South Central 689.0 675.0 620.0 638.0 665.0
Southeast 297.0 313.0 266.0 238.0 214.0
Southwest 306.0 308.0 312.0 318.0 285.0
Total* 2,706.3 2,738.3 2,386.5 2,334.0 2,259.1
*Excludes Alaska, so total of regions does not match published United States total.
The Northeast region lost the highest percentage of calf inventory in 2010, compared with the other regions. d. Calf death loss as a percentage of calf crop, by region and by year:
Percent Calf Crop
Year
Region 1991 1995 2000 2005 2010
North Central 7.5 8.2 6.3 6.2 6.6
Northeast 9.2 8.9 7.9 8.3 8.1
Northwest 5.2 5.0 5.1 5.0 4.6
South Central 6.2 5.7 5.5 5.7 6.2
Southeast 5.7 5.7 5.5 5.3 5.1
Southwest 7.7 7.2 7.0 7.3 6.6
Total 7.0 6.8 6.2 6.3 6.3
14
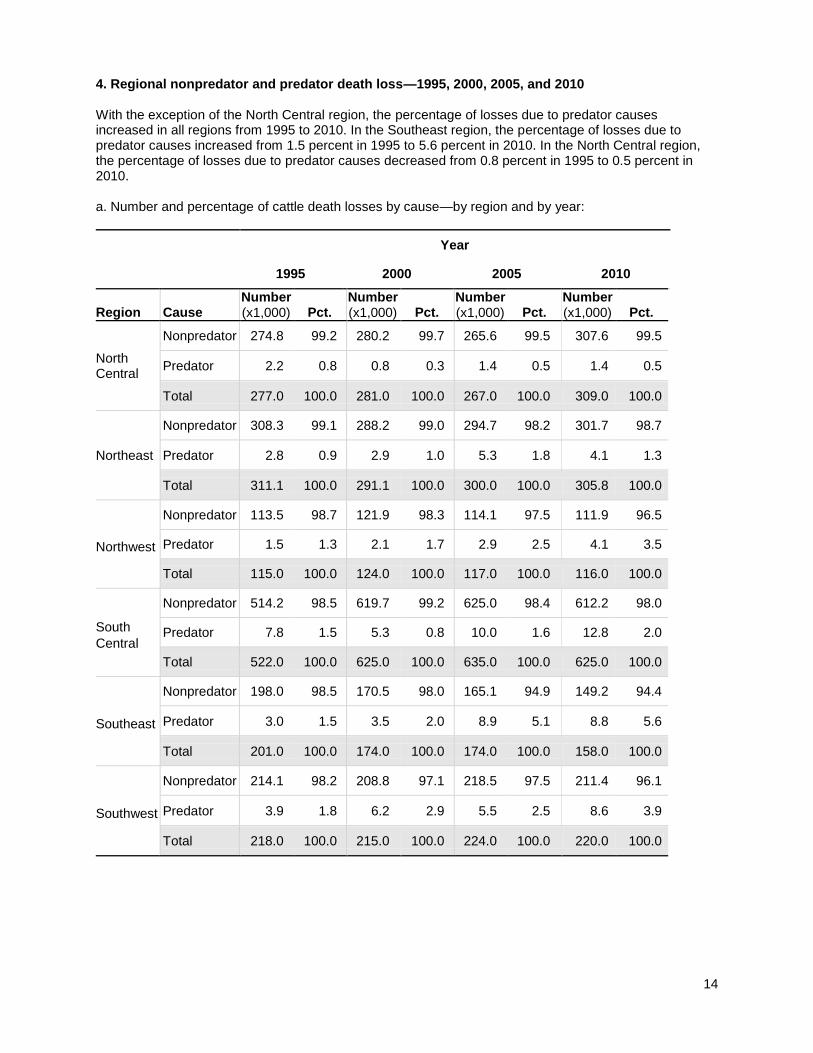
4. Regional nonpredator and predator death loss—1995, 2000, 2005, and 2010 With the exception of the North Central region, the percentage of losses due to predator causes increased in all regions from 1995 to 2010. In the Southeast region, the percentage of losses due to predator causes increased from 1.5 percent in 1995 to 5.6 percent in 2010. In the North Central region, the percentage of losses due to predator causes decreased from 0.8 percent in 1995 to 0.5 percent in 2010. a. Number and percentage of cattle death losses by cause—by region and by year:
Year
1995 2000 2005 2010
Region Cause Number (x1,000) Pct.
Number(x1,000) Pct.
Number(x1,000) Pct.
Number(x1,000) Pct.
North Central
Nonpredator 274.8 99.2 280.2 99.7 265.6 99.5 307.6 99.5
Predator 2.2 0.8 0.8 0.3 1.4 0.5 1.4 0.5
Total 277.0 100.0 281.0 100.0 267.0 100.0 309.0 100.0
Northeast
Nonpredator 308.3 99.1 288.2 99.0 294.7 98.2 301.7 98.7
Predator 2.8 0.9 2.9 1.0 5.3 1.8 4.1 1.3
Total 311.1 100.0 291.1 100.0 300.0 100.0 305.8 100.0
Northwest
Nonpredator 113.5 98.7 121.9 98.3 114.1 97.5 111.9 96.5
Predator 1.5 1.3 2.1 1.7 2.9 2.5 4.1 3.5
Total 115.0 100.0 124.0 100.0 117.0 100.0 116.0 100.0
South
Central
Nonpredator 514.2 98.5 619.7 99.2 625.0 98.4 612.2 98.0
Predator 7.8 1.5 5.3 0.8 10.0 1.6 12.8 2.0
Total 522.0 100.0 625.0 100.0 635.0 100.0 625.0 100.0
Southeast
Nonpredator 198.0 98.5 170.5 98.0 165.1 94.9 149.2 94.4
Predator 3.0 1.5 3.5 2.0 8.9 5.1 8.8 5.6
Total 201.0 100.0 174.0 100.0 174.0 100.0 158.0 100.0
Southwest
Nonpredator 214.1 98.2 208.8 97.1 218.5 97.5 211.4 96.1
Predator 3.9 1.8 6.2 2.9 5.5 2.5 8.6 3.9
Total 218.0 100.0 215.0 100.0 224.0 100.0 220.0 100.0
15
16
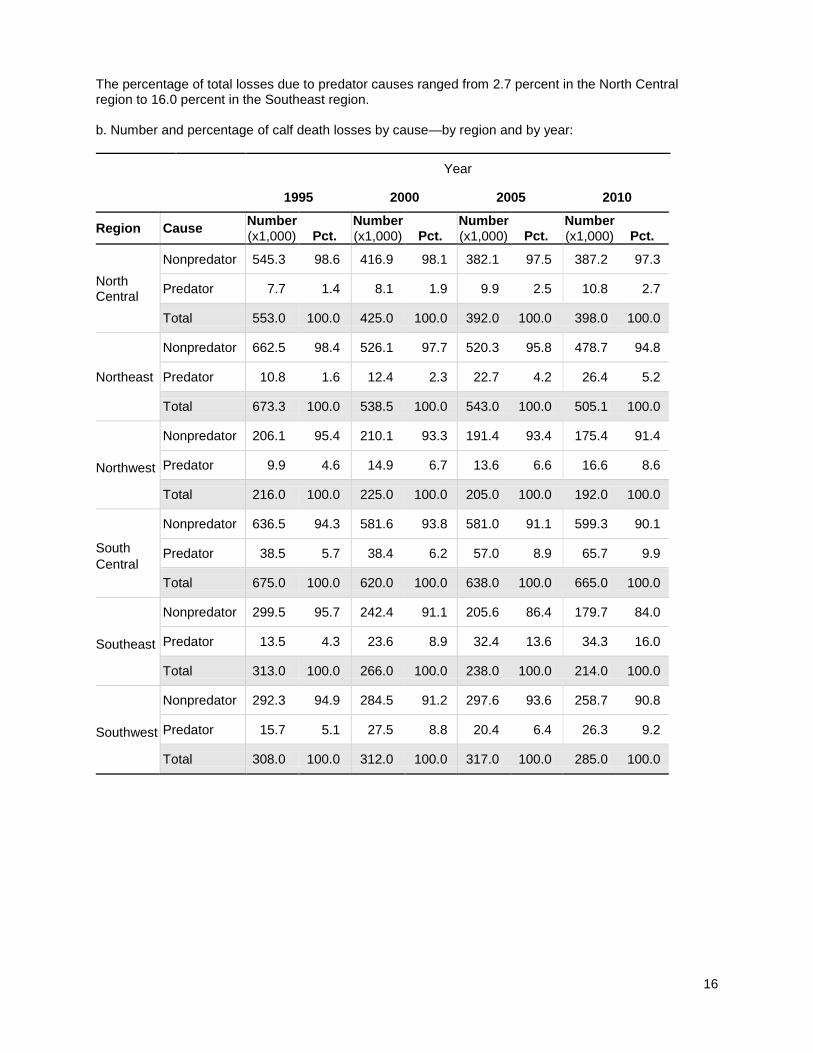
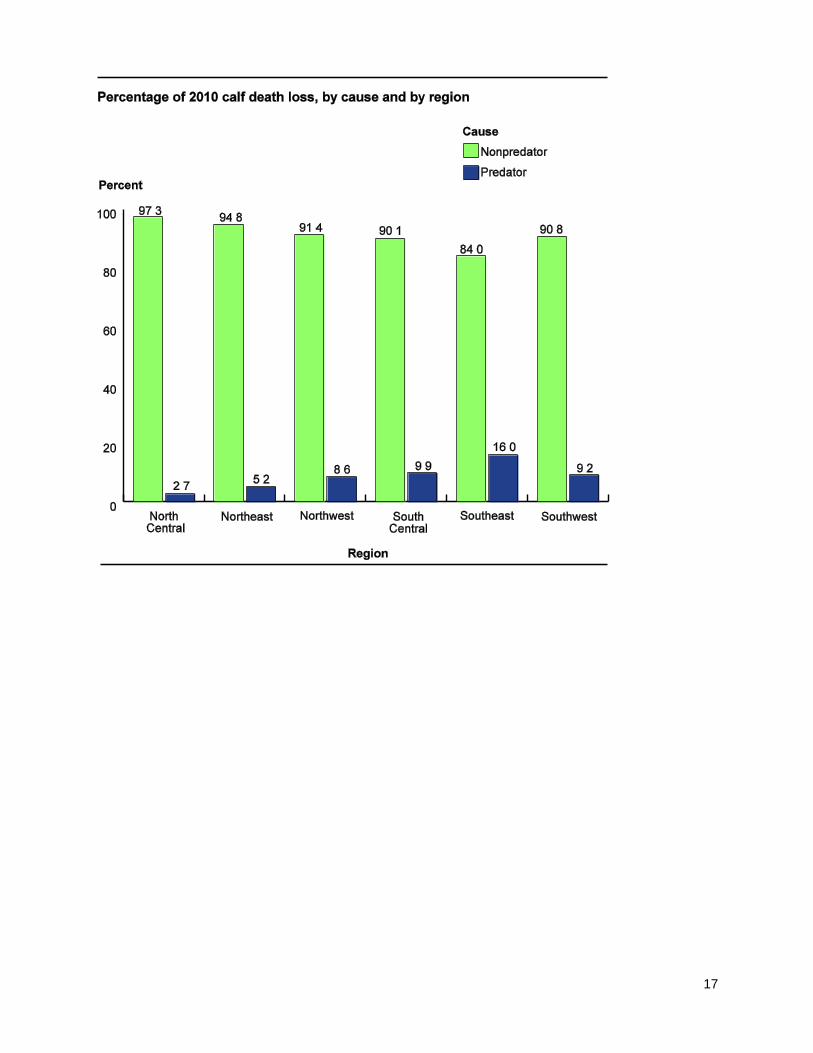
The percentage of total losses due to predator causes ranged from 2.7 percent in the North Central region to 16.0 percent in the Southeast region. b. Number and percentage of calf death losses by cause—by region and by year:
Year
1995 2000 2005 2010
Region Cause Number (x1,000) Pct.
Number (x1,000) Pct.
Number (x1,000) Pct.
Number (x1,000) Pct.
North Central
Nonpredator 545.3 98.6 416.9 98.1 382.1 97.5 387.2 97.3
Predator 7.7 1.4 8.1 1.9 9.9 2.5 10.8 2.7
Total 553.0 100.0 425.0 100.0 392.0 100.0 398.0 100.0
Northeast
Nonpredator 662.5 98.4 526.1 97.7 520.3 95.8 478.7 94.8
Predator 10.8 1.6 12.4 2.3 22.7 4.2 26.4 5.2
Total 673.3 100.0 538.5 100.0 543.0 100.0 505.1 100.0
Northwest
Nonpredator 206.1 95.4 210.1 93.3 191.4 93.4 175.4 91.4
Predator 9.9 4.6 14.9 6.7 13.6 6.6 16.6 8.6
Total 216.0 100.0 225.0 100.0 205.0 100.0 192.0 100.0
South
Central
Nonpredator 636.5 94.3 581.6 93.8 581.0 91.1 599.3 90.1
Predator 38.5 5.7 38.4 6.2 57.0 8.9 65.7 9.9
Total 675.0 100.0 620.0 100.0 638.0 100.0 665.0 100.0
Southeast
Nonpredator 299.5 95.7 242.4 91.1 205.6 86.4 179.7 84.0
Predator 13.5 4.3 23.6 8.9 32.4 13.6 34.3 16.0
Total 313.0 100.0 266.0 100.0 238.0 100.0 214.0 100.0
Southwest
Nonpredator 292.3 94.9 284.5 91.2 297.6 93.6 258.7 90.8
Predator 15.7 5.1 27.5 8.8 20.4 6.4 26.3 9.2
Total 308.0 100.0 312.0 100.0 317.0 100.0 285.0 100.0
17
18
Section II: Population Estimates—Losses Due to Predators
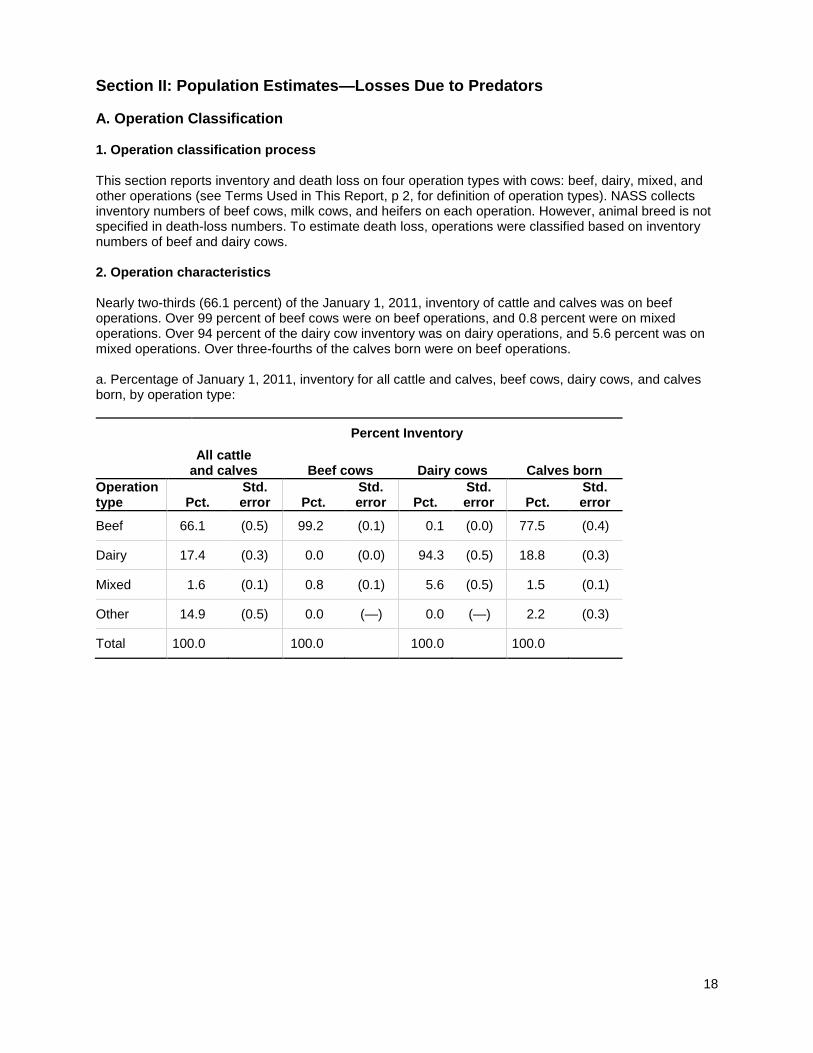
A. Operation Classification 1. Operation classification process This section reports inventory and death loss on four operation types with cows: beef, dairy, mixed, and other operations (see Terms Used in This Report, p 2, for definition of operation types). NASS collects inventory numbers of beef cows, milk cows, and heifers on each operation. However, animal breed is not specified in death-loss numbers. To estimate death loss, operations were classified based on inventory numbers of beef and dairy cows. 2. Operation characteristics Nearly two-thirds (66.1 percent) of the January 1, 2011, inventory of cattle and calves was on beef operations. Over 99 percent of beef cows were on beef operations, and 0.8 percent were on mixed operations. Over 94 percent of the dairy cow inventory was on dairy operations, and 5.6 percent was on mixed operations. Over three-fourths of the calves born were on beef operations. a. Percentage of January 1, 2011, inventory for all cattle and calves, beef cows, dairy cows, and calves born, by operation type:
Percent Inventory
All cattle
and calves Beef cows Dairy cows Calves born
Operation type Pct.
Std. error Pct.
Std. error Pct.
Std. error Pct.
Std. error
Beef 66.1 (0.5) 99.2 (0.1) 0.1 (0.0) 77.5 (0.4)
Dairy 17.4 (0.3) 0.0 (0.0) 94.3 (0.5) 18.8 (0.3)
Mixed 1.6 (0.1) 0.8 (0.1) 5.6 (0.5) 1.5 (0.1)
Other 14.9 (0.5) 0.0 (—) 0.0 (—) 2.2 (0.3)
Total 100.0
100.0
100.0 100.0
19
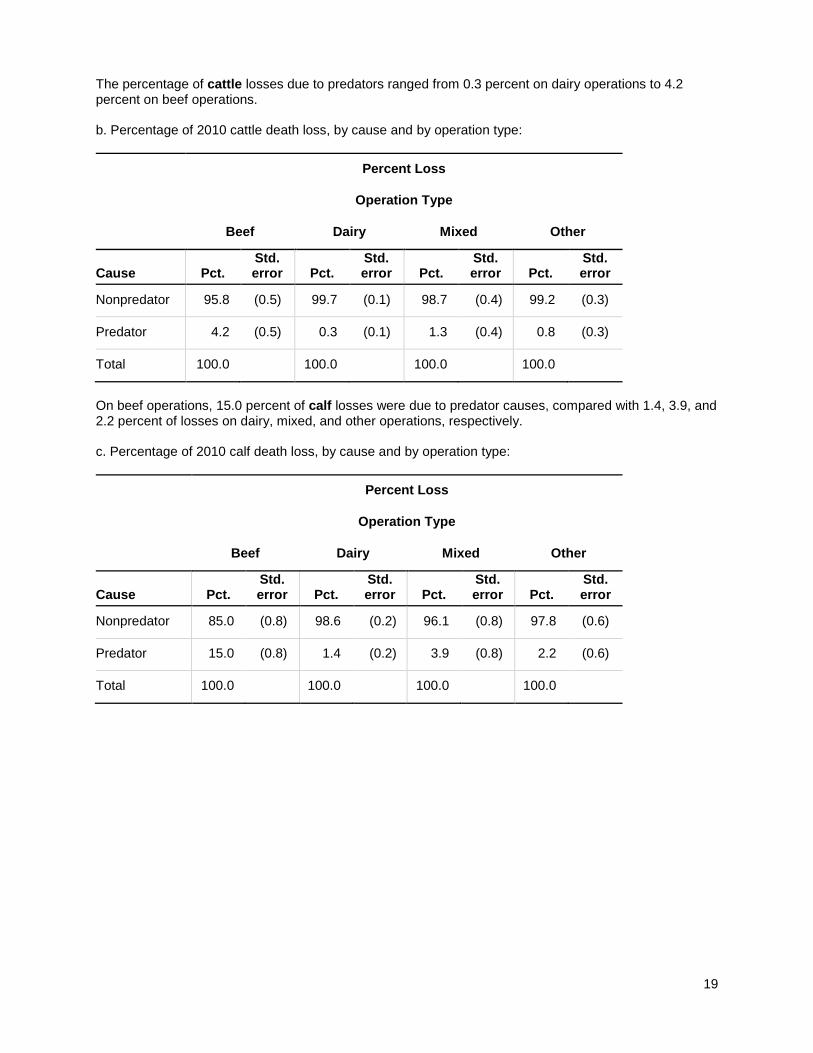
The percentage of cattle losses due to predators ranged from 0.3 percent on dairy operations to 4.2 percent on beef operations. b. Percentage of 2010 cattle death loss, by cause and by operation type:
Percent Loss
Operation Type
Beef Dairy Mixed Other
Cause Pct. Std. error Pct.
Std. error Pct.
Std. error Pct.
Std. error
Nonpredator 95.8 (0.5) 99.7 (0.1) 98.7 (0.4) 99.2 (0.3)
Predator 4.2 (0.5) 0.3 (0.1) 1.3 (0.4) 0.8 (0.3)
Total 100.0 100.0 100.0 100.0
On beef operations, 15.0 percent of calf losses were due to predator causes, compared with 1.4, 3.9, and 2.2 percent of losses on dairy, mixed, and other operations, respectively. c. Percentage of 2010 calf death loss, by cause and by operation type:
Percent Loss
Operation Type
Beef Dairy Mixed Other
Cause Pct. Std. error Pct.
Std. error Pct.
Std. error Pct.
Std. error
Nonpredator 85.0 (0.8) 98.6 (0.2) 96.1 (0.8) 97.8 (0.6)
Predator 15.0 (0.8) 1.4 (0.2) 3.9 (0.8) 2.2 (0.6)
Total 100.0 100.0 100.0 100.0

20
A total of 89.4 percent of cattle predator losses and 94.0 percent of calf predator losses occurred on beef operations, which is a reflection of the percentages of cattle and calves inventories on beef operations, and a reflection of the animal rearing environment and associated management practices. d. Percentage of 2010 cattle and calves predator death losses, by type of operation:
Operation type Percent cattle
Std. error
Percent calves
Std. error
Beef 89.4 (2.4) 94.0 (0.7)
Dairy 3.0 (0.5) 2.8 (0.4)
Mixed 1.0 (0.3) 0.7 (0.2)
Other 6.6 (2.3) 2.5 (0.5)
Total 100.0 100.0
21
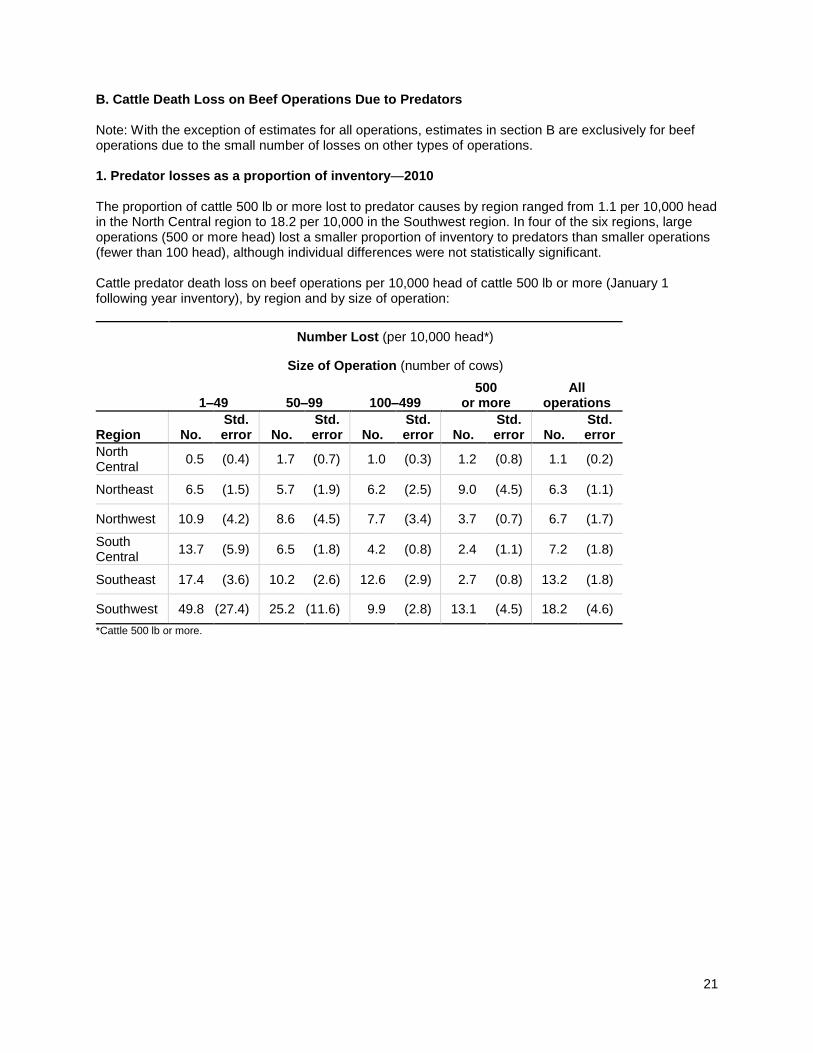
B. Cattle Death Loss on Beef Operations Due to Predators Note: With the exception of estimates for all operations, estimates in section B are exclusively for beef operations due to the small number of losses on other types of operations. 1. Predator losses as a proportion of inventory—2010 The proportion of cattle 500 lb or more lost to predator causes by region ranged from 1.1 per 10,000 head in the North Central region to 18.2 per 10,000 in the Southwest region. In four of the six regions, large operations (500 or more head) lost a smaller proportion of inventory to predators than smaller operations (fewer than 100 head), although individual differences were not statistically significant. Cattle predator death loss on beef operations per 10,000 head of cattle 500 lb or more (January 1 following year inventory), by region and by size of operation:
Number Lost (per 10,000 head*)
Size of Operation (number of cows)
1–49 50–99 100–499 500
or more All
operations
Region No. Std. error No.
Std. error No.
Std. error No.
Std. error No.
Std. error
North Central
0.5 (0.4) 1.7 (0.7) 1.0 (0.3) 1.2 (0.8) 1.1 (0.2)
Northeast 6.5 (1.5) 5.7 (1.9) 6.2 (2.5) 9.0 (4.5) 6.3 (1.1)
Northwest 10.9 (4.2) 8.6 (4.5) 7.7 (3.4) 3.7 (0.7) 6.7 (1.7)
South Central
13.7 (5.9) 6.5 (1.8) 4.2 (0.8) 2.4 (1.1) 7.2 (1.8)
Southeast 17.4 (3.6) 10.2 (2.6) 12.6 (2.9) 2.7 (0.8) 13.2 (1.8)
Southwest 49.8 (27.4) 25.2 (11.6) 9.9 (2.8) 13.1 (4.5) 18.2 (4.6)
*Cattle 500 lb or more.
22
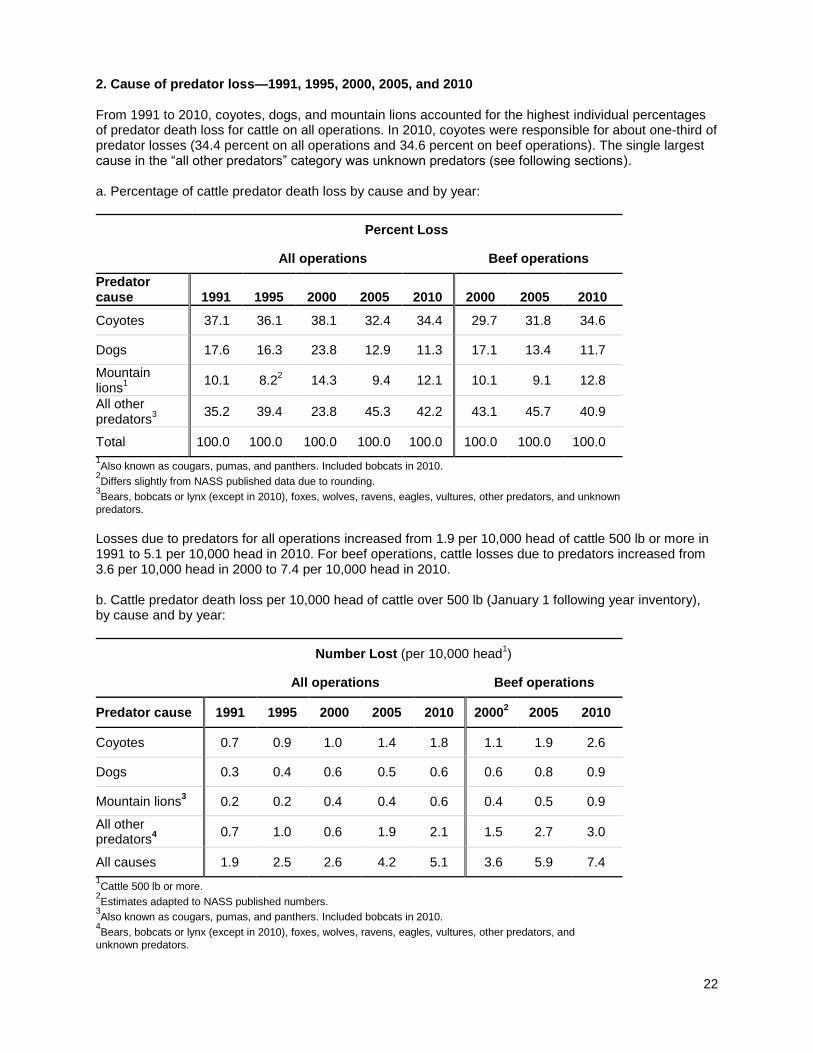
2. Cause of predator loss—1991, 1995, 2000, 2005, and 2010 From 1991 to 2010, coyotes, dogs, and mountain lions accounted for the highest individual percentages of predator death loss for cattle on all operations. In 2010, coyotes were responsible for about one-third of predator losses (34.4 percent on all operations and 34.6 percent on beef operations). The single largest cause in the “all other predators” category was unknown predators (see following sections). a. Percentage of cattle predator death loss by cause and by year:
Percent Loss
All operations Beef operations
Predator cause 1991 1995 2000 2005 2010 2000 2005 2010
Coyotes 37.1 36.1 38.1 32.4 34.4 29.7 31.8 34.6
Dogs 17.6 16.3 23.8 12.9 11.3 17.1 13.4 11.7
Mountain lions
1
10.1 8.22 14.3 9.4 12.1 10.1 9.1 12.8
All other predators
3
35.2 39.4 23.8 45.3 42.2 43.1 45.7 40.9
Total 100.0 100.0 100.0 100.0 100.0 100.0 100.0 100.0
1Also known as cougars, pumas, and panthers. Included bobcats in 2010.
2Differs slightly from NASS published data due to rounding.
3Bears, bobcats or lynx (except in 2010), foxes, wolves, ravens, eagles, vultures, other predators, and unknown
predators.
Losses due to predators for all operations increased from 1.9 per 10,000 head of cattle 500 lb or more in 1991 to 5.1 per 10,000 head in 2010. For beef operations, cattle losses due to predators increased from 3.6 per 10,000 head in 2000 to 7.4 per 10,000 head in 2010. b. Cattle predator death loss per 10,000 head of cattle over 500 lb (January 1 following year inventory), by cause and by year:
Number Lost (per 10,000 head
1)
All operations Beef operations
Predator cause 1991 1995 2000 2005 2010 20002 2005 2010
Coyotes 0.7 0.9 1.0 1.4 1.8 1.1 1.9 2.6
Dogs 0.3 0.4 0.6 0.5 0.6 0.6 0.8 0.9
Mountain lions3 0.2 0.2 0.4 0.4 0.6 0.4 0.5 0.9
All other predators
4
0.7 1.0 0.6 1.9 2.1 1.5 2.7 3.0
All causes 1.9 2.5 2.6 4.2 5.1 3.6 5.9 7.4
1Cattle 500 lb or more.
2Estimates adapted to NASS published numbers.
3Also known as cougars, pumas, and panthers. Included bobcats in 2010.
4Bears, bobcats or lynx (except in 2010), foxes, wolves, ravens, eagles, vultures, other predators, and
unknown predators.
23
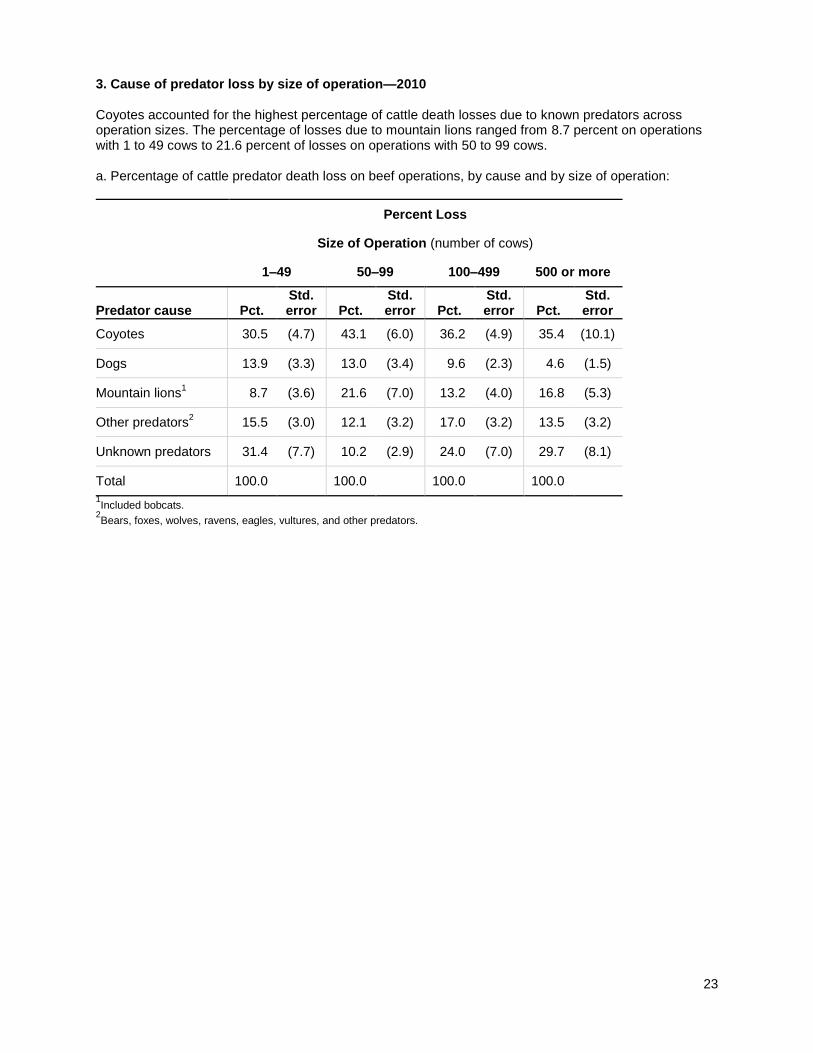
3. Cause of predator loss by size of operation—2010 Coyotes accounted for the highest percentage of cattle death losses due to known predators across operation sizes. The percentage of losses due to mountain lions ranged from 8.7 percent on operations with 1 to 49 cows to 21.6 percent of losses on operations with 50 to 99 cows. a. Percentage of cattle predator death loss on beef operations, by cause and by size of operation:
Percent Loss
Size of Operation (number of cows)
1–49 50–99 100–499 500 or more
Predator cause Pct. Std. error Pct.
Std. error Pct.
Std. error Pct.
Std. error
Coyotes 30.5 (4.7) 43.1 (6.0) 36.2 (4.9) 35.4 (10.1)
Dogs 13.9 (3.3) 13.0 (3.4) 9.6 (2.3) 4.6 (1.5)
Mountain lions1 8.7 (3.6) 21.6 (7.0) 13.2 (4.0) 16.8 (5.3)
Other predators2 15.5 (3.0) 12.1 (3.2) 17.0 (3.2) 13.5 (3.2)
Unknown predators 31.4 (7.7) 10.2 (2.9) 24.0 (7.0) 29.7 (8.1)
Total 100.0 100.0 100.0 100.0
1Included bobcats.
2Bears, foxes, wolves, ravens, eagles, vultures, and other predators.
24
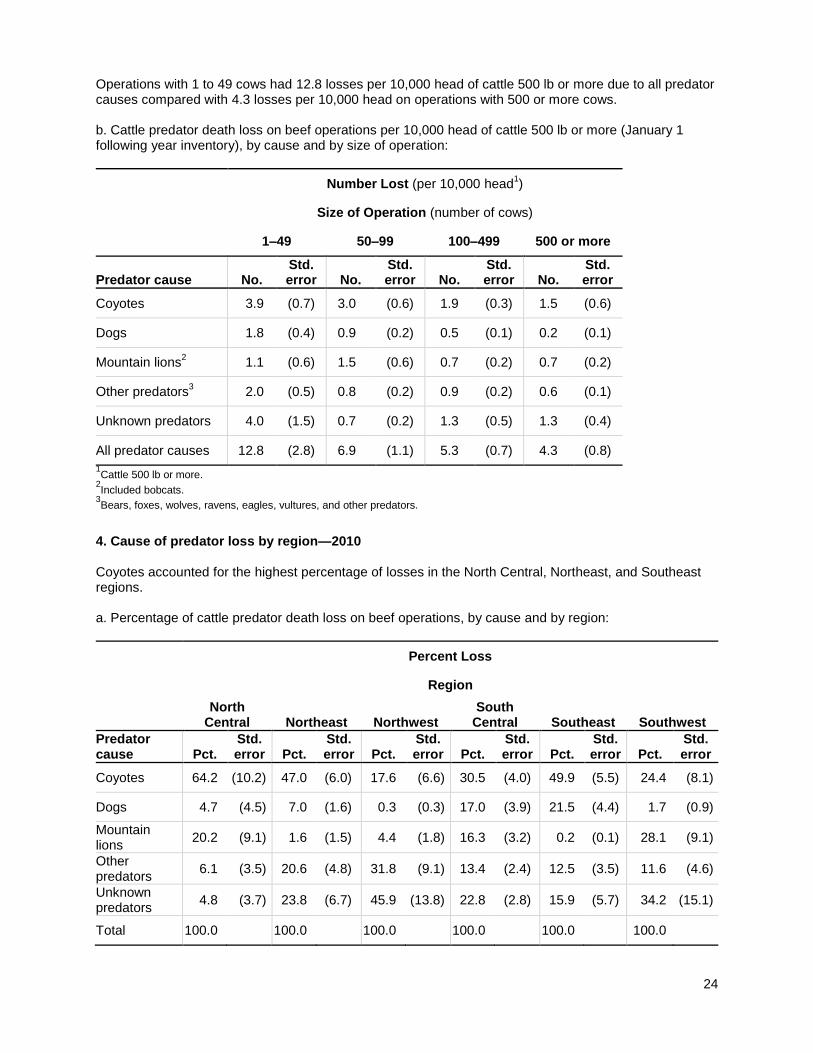
Operations with 1 to 49 cows had 12.8 losses per 10,000 head of cattle 500 lb or more due to all predator causes compared with 4.3 losses per 10,000 head on operations with 500 or more cows. b. Cattle predator death loss on beef operations per 10,000 head of cattle 500 lb or more (January 1 following year inventory), by cause and by size of operation:
Number Lost (per 10,000 head
1)
Size of Operation (number of cows)
1–49 50–99 100–499 500 or more
Predator cause No. Std. error No.
Std. error No.
Std. error No.
Std. error
Coyotes 3.9 (0.7) 3.0 (0.6) 1.9 (0.3) 1.5 (0.6)
Dogs 1.8 (0.4) 0.9 (0.2) 0.5 (0.1) 0.2 (0.1)
Mountain lions2 1.1 (0.6) 1.5 (0.6) 0.7 (0.2) 0.7 (0.2)
Other predators3 2.0 (0.5) 0.8 (0.2) 0.9 (0.2) 0.6 (0.1)
Unknown predators 4.0 (1.5) 0.7 (0.2) 1.3 (0.5) 1.3 (0.4)
All predator causes 12.8 (2.8) 6.9 (1.1) 5.3 (0.7) 4.3 (0.8)
1Cattle 500 lb or more.
2Included bobcats.
3Bears, foxes, wolves, ravens, eagles, vultures, and other predators.
4. Cause of predator loss by region—2010 Coyotes accounted for the highest percentage of losses in the North Central, Northeast, and Southeast regions. a. Percentage of cattle predator death loss on beef operations, by cause and by region:
Percent Loss
Region
North
Central Northeast Northwest South
Central Southeast Southwest
Predator cause Pct.
Std. error Pct.
Std. error Pct.
Std. error Pct.
Std. error Pct.
Std. error Pct.
Std. error
Coyotes 64.2 (10.2) 47.0 (6.0) 17.6 (6.6) 30.5 (4.0) 49.9 (5.5) 24.4 (8.1)
Dogs 4.7 (4.5) 7.0 (1.6) 0.3 (0.3) 17.0 (3.9) 21.5 (4.4) 1.7 (0.9)
Mountain lions
20.2 (9.1) 1.6 (1.5) 4.4 (1.8) 16.3 (3.2) 0.2 (0.1) 28.1 (9.1)
Other predators
6.1 (3.5) 20.6 (4.8) 31.8 (9.1) 13.4 (2.4) 12.5 (3.5) 11.6 (4.6)
Unknown predators
4.8 (3.7) 23.8 (6.7) 45.9 (13.8) 22.8 (2.8) 15.9 (5.7) 34.2 (15.1)
Total 100.0 100.0 100.0 100.0 100.0 100.0

25
Losses due to all predator causes ranged from 1.1 per 10,000 head of cattle 500 lb or more in the North Central region to 18.2 per 10,000 head in the Southwest region. Interestingly, the Northwest region was the only region in which coyotes were not among the leading causes of predator loss. b. Cattle predator death loss on beef operations per 10,000 head of cattle 500 lb or more (January 1 following year inventory), by cause and by region:
Number Lost (per 10,000 head*)
Region
North
Central Northeast Northwest South
Central Southeast Southwest
Predator No. Std. error No.
Std. error No.
Std. error No.
Std. error No.
Std. error No.
Std. error
Coyotes 0.7 (0.2) 3.0 (0.6) 1.2 (0.4) 2.2 (0.5) 6.6 (1.0) 4.4 (1.4)
Dogs 0.1 (0.1) 0.4 (0.1) 0.0 (0.0) 1.2 (0.3) 2.8 (0.7) 0.3 (0.2)
Mountain lions
0.2 (0.1) 0.1 (0.1) 0.2 (0.1) 1.7 (1.6) 0.0 (0.0) 5.0 (1.6)
Other predators
0.1 (0.0) 1.3 (0.4) 2.1 (0.4) 1.0 (0.3) 1.6 (0.5) 2.1 (0.8)
Unknown predators
0.1 (0.0) 1.5 (0.5) 3.1 (1.6) 1.6 (0.5) 2.1 (0.9) 6.2 (4.0)
All predator causes
1.1 (0.2) 6.3 (1.1) 6.7 (1.7) 7.2 (1.8) 13.2 (1.8) 18.2 (4.6)
*Cattle 500 lb or more.
26
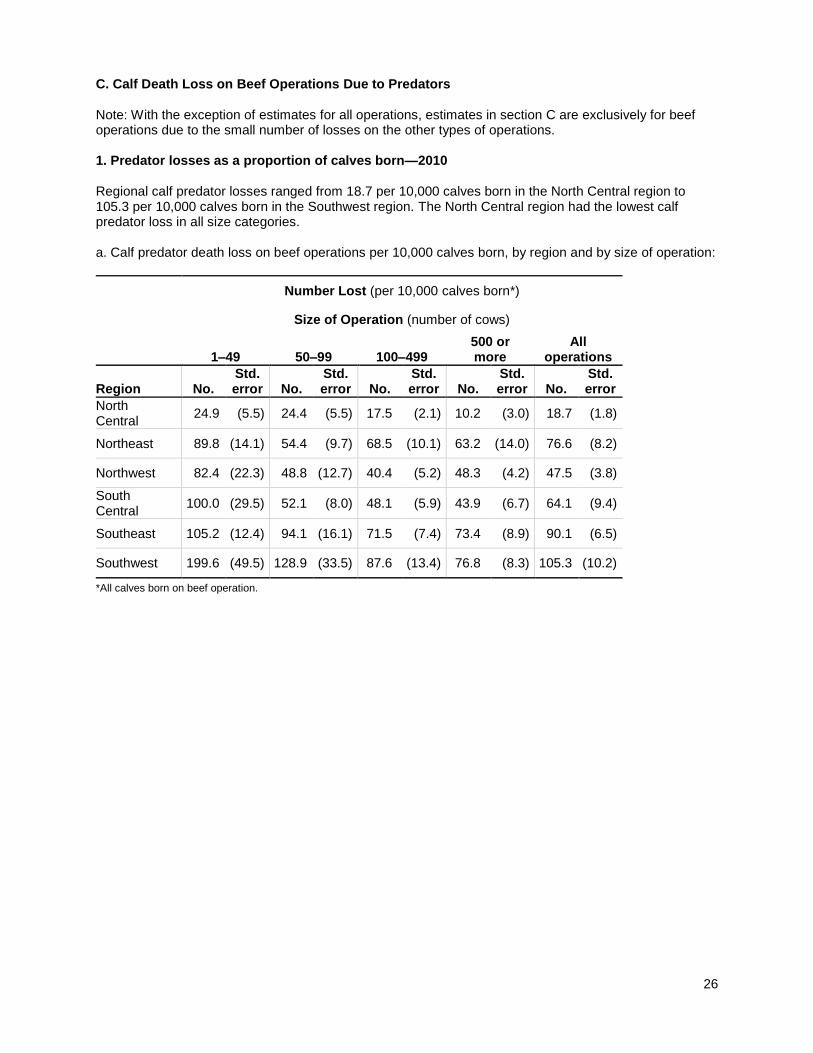
C. Calf Death Loss on Beef Operations Due to Predators Note: With the exception of estimates for all operations, estimates in section C are exclusively for beef operations due to the small number of losses on the other types of operations. 1. Predator losses as a proportion of calves born—2010 Regional calf predator losses ranged from 18.7 per 10,000 calves born in the North Central region to 105.3 per 10,000 calves born in the Southwest region. The North Central region had the lowest calf predator loss in all size categories. a. Calf predator death loss on beef operations per 10,000 calves born, by region and by size of operation:
Number Lost (per 10,000 calves born*)
Size of Operation (number of cows)
1–49 50–99 100–499 500 or more
All operations
Region No. Std. error No.
Std. error No.
Std. error No.
Std. error No.
Std. error
North Central
24.9 (5.5) 24.4 (5.5) 17.5 (2.1) 10.2 (3.0) 18.7 (1.8)
Northeast 89.8 (14.1) 54.4 (9.7) 68.5 (10.1) 63.2 (14.0) 76.6 (8.2)
Northwest 82.4 (22.3) 48.8 (12.7) 40.4 (5.2) 48.3 (4.2) 47.5 (3.8)
South Central
100.0 (29.5) 52.1 (8.0) 48.1 (5.9) 43.9 (6.7) 64.1 (9.4)
Southeast 105.2 (12.4) 94.1 (16.1) 71.5 (7.4) 73.4 (8.9) 90.1 (6.5)
Southwest 199.6 (49.5) 128.9 (33.5) 87.6 (13.4) 76.8 (8.3) 105.3 (10.2)
*All calves born on beef operation.
27
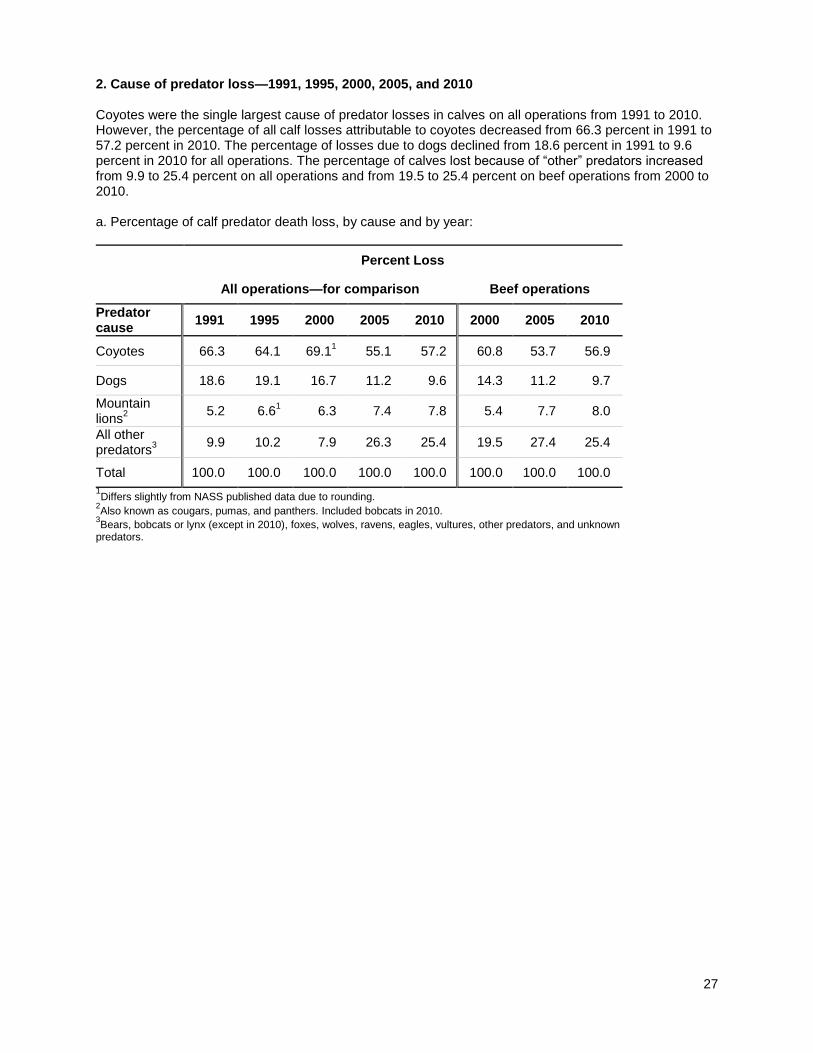
2. Cause of predator loss—1991, 1995, 2000, 2005, and 2010 Coyotes were the single largest cause of predator losses in calves on all operations from 1991 to 2010. However, the percentage of all calf losses attributable to coyotes decreased from 66.3 percent in 1991 to 57.2 percent in 2010. The percentage of losses due to dogs declined from 18.6 percent in 1991 to 9.6 percent in 2010 for all operations. The percentage of calves lost because of “other” predators increased from 9.9 to 25.4 percent on all operations and from 19.5 to 25.4 percent on beef operations from 2000 to 2010. a. Percentage of calf predator death loss, by cause and by year:
Percent Loss
All operations—for comparison Beef operations
Predator cause
1991 1995 2000 2005 2010 2000 2005 2010
Coyotes 66.3 64.1 69.11 55.1 57.2 60.8 53.7 56.9
Dogs 18.6 19.1 16.7 11.2 9.6 14.3 11.2 9.7
Mountain lions
2
5.2 6.61 6.3 7.4 7.8 5.4 7.7 8.0
All other predators
3
9.9 10.2 7.9 26.3 25.4 19.5 27.4 25.4
Total
100.0 100.0 100.0 100.0 100.0 100.0 100.0 100.0
1Differs slightly from NASS published data due to rounding.
2Also known as cougars, pumas, and panthers. Included bobcats in 2010.
3Bears, bobcats or lynx (except in 2010), foxes, wolves, ravens, eagles, vultures, other predators, and unknown
predators.
28
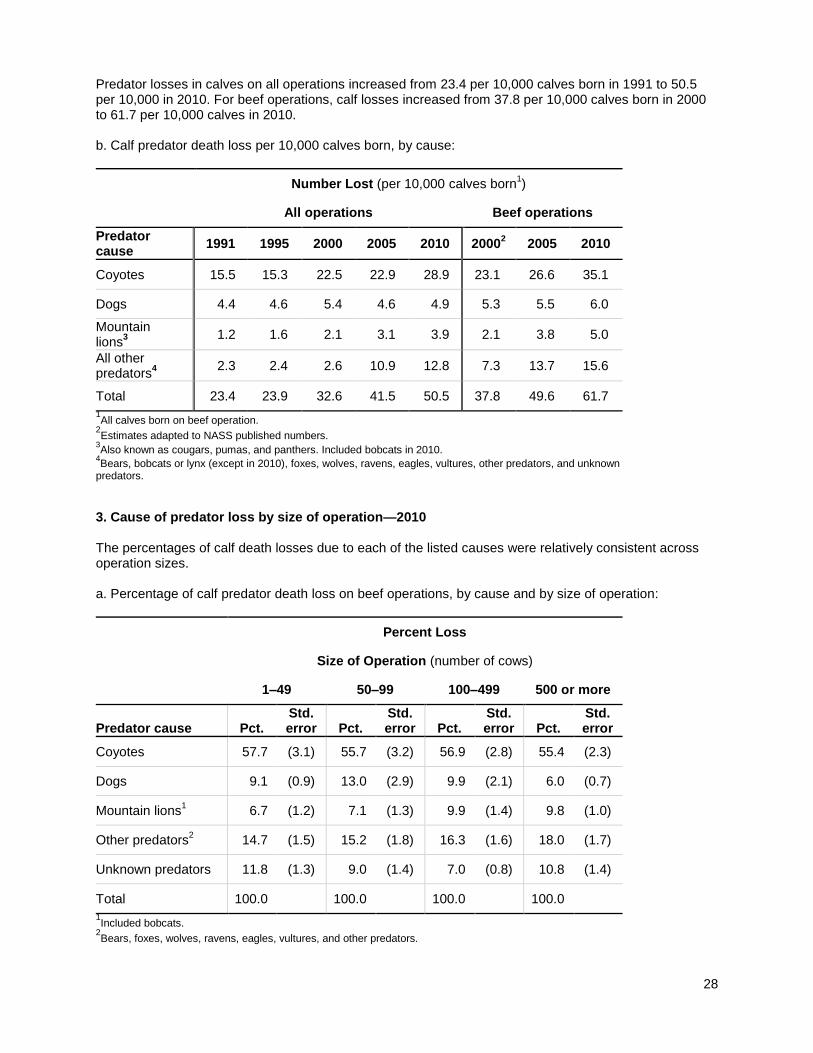
Predator losses in calves on all operations increased from 23.4 per 10,000 calves born in 1991 to 50.5 per 10,000 in 2010. For beef operations, calf losses increased from 37.8 per 10,000 calves born in 2000 to 61.7 per 10,000 calves in 2010. b. Calf predator death loss per 10,000 calves born, by cause:
Number Lost (per 10,000 calves born
1)
All operations Beef operations
Predator cause
1991 1995 2000 2005 2010 20002 2005 2010
Coyotes 15.5 15.3 22.5 22.9 28.9 23.1 26.6 35.1
Dogs 4.4 4.6 5.4 4.6 4.9 5.3 5.5 6.0
Mountain lions
3
1.2 1.6 2.1 3.1 3.9 2.1 3.8 5.0
All other predators
4
2.3 2.4 2.6 10.9 12.8 7.3 13.7 15.6
Total
23.4 23.9 32.6 41.5 50.5 37.8 49.6 61.7
1All calves born on beef operation.
2Estimates adapted to NASS published numbers.
3Also known as cougars, pumas, and panthers. Included bobcats in 2010.
4Bears, bobcats or lynx (except in 2010), foxes, wolves, ravens, eagles, vultures, other predators, and unknown
predators.
3. Cause of predator loss by size of operation—2010 The percentages of calf death losses due to each of the listed causes were relatively consistent across operation sizes. a. Percentage of calf predator death loss on beef operations, by cause and by size of operation:
Percent Loss
Size of Operation (number of cows)
1–49 50–99 100–499 500 or more
Predator cause Pct. Std. error Pct.
Std. error Pct.
Std. error Pct.
Std. error
Coyotes 57.7 (3.1) 55.7 (3.2) 56.9 (2.8) 55.4 (2.3)
Dogs 9.1 (0.9) 13.0 (2.9) 9.9 (2.1) 6.0 (0.7)
Mountain lions1 6.7 (1.2) 7.1 (1.3) 9.9 (1.4) 9.8 (1.0)
Other predators2 14.7 (1.5) 15.2 (1.8) 16.3 (1.6) 18.0 (1.7)
Unknown predators 11.8 (1.3) 9.0 (1.4) 7.0 (0.8) 10.8 (1.4)
Total 100.0 100.0 100.0 100.0
1Included bobcats.
2Bears, foxes, wolves, ravens, eagles, vultures, and other predators.
29
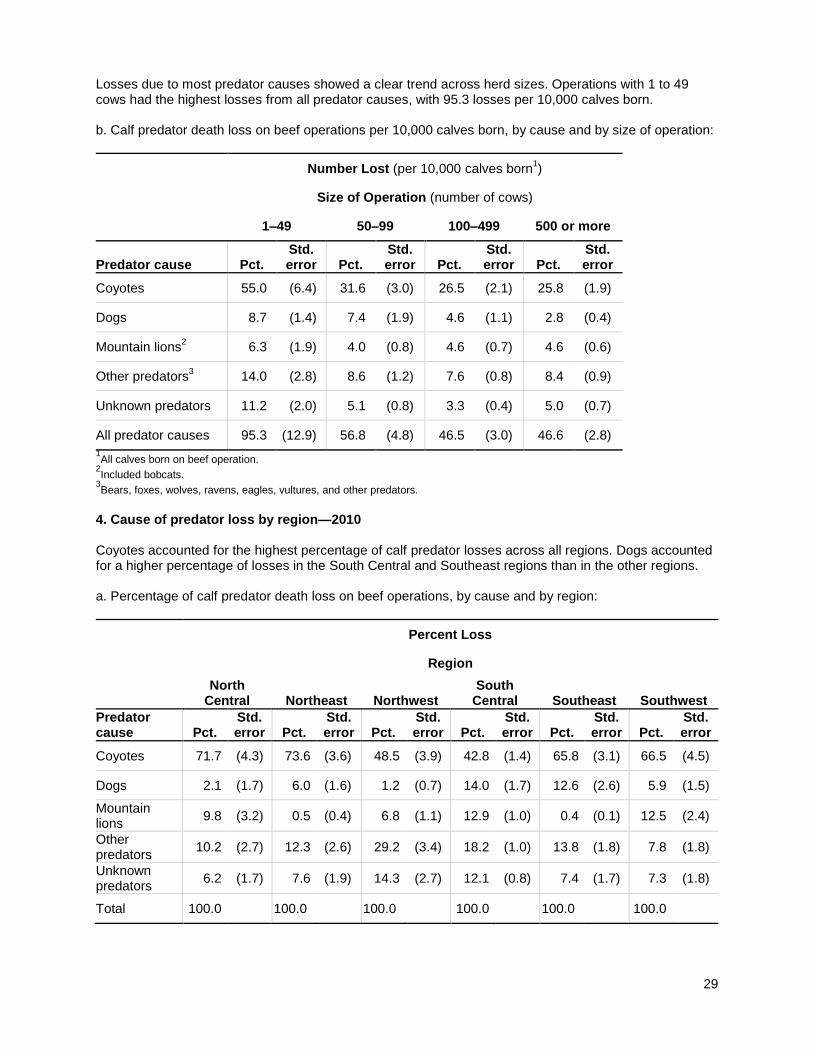
Losses due to most predator causes showed a clear trend across herd sizes. Operations with 1 to 49 cows had the highest losses from all predator causes, with 95.3 losses per 10,000 calves born. b. Calf predator death loss on beef operations per 10,000 calves born, by cause and by size of operation:
Number Lost (per 10,000 calves born
1)
Size of Operation (number of cows)
1–49 50–99 100–499 500 or more
Predator cause Pct. Std. error Pct.
Std. error Pct.
Std. error Pct.
Std. error
Coyotes 55.0 (6.4) 31.6 (3.0) 26.5 (2.1) 25.8 (1.9)
Dogs 8.7 (1.4) 7.4 (1.9) 4.6 (1.1) 2.8 (0.4)
Mountain lions2 6.3 (1.9) 4.0 (0.8) 4.6 (0.7) 4.6 (0.6)
Other predators3 14.0 (2.8) 8.6 (1.2) 7.6 (0.8) 8.4 (0.9)
Unknown predators 11.2 (2.0) 5.1 (0.8) 3.3 (0.4) 5.0 (0.7)
All predator causes 95.3 (12.9) 56.8 (4.8) 46.5 (3.0) 46.6 (2.8)
1All calves born on beef operation.
2Included bobcats.
3Bears, foxes, wolves, ravens, eagles, vultures, and other predators.
4. Cause of predator loss by region—2010 Coyotes accounted for the highest percentage of calf predator losses across all regions. Dogs accounted for a higher percentage of losses in the South Central and Southeast regions than in the other regions. a. Percentage of calf predator death loss on beef operations, by cause and by region:
Percent Loss
Region
North
Central Northeast Northwest South
Central Southeast Southwest
Predator cause Pct.
Std. error Pct.
Std. error Pct.
Std. error Pct.
Std. error Pct.
Std. error Pct.
Std. error
Coyotes 71.7 (4.3) 73.6 (3.6) 48.5 (3.9) 42.8 (1.4) 65.8 (3.1) 66.5 (4.5)
Dogs 2.1 (1.7) 6.0 (1.6) 1.2 (0.7) 14.0 (1.7) 12.6 (2.6) 5.9 (1.5)
Mountain lions
9.8 (3.2) 0.5 (0.4) 6.8 (1.1) 12.9 (1.0) 0.4 (0.1) 12.5 (2.4)
Other predators
10.2 (2.7) 12.3 (2.6) 29.2 (3.4) 18.2 (1.0) 13.8 (1.8) 7.8 (1.8)
Unknown predators
6.2 (1.7) 7.6 (1.9) 14.3 (2.7) 12.1 (0.8) 7.4 (1.7) 7.3 (1.8)
Total 100.0 100.0 100.0 100.0 100.0 100.0
30
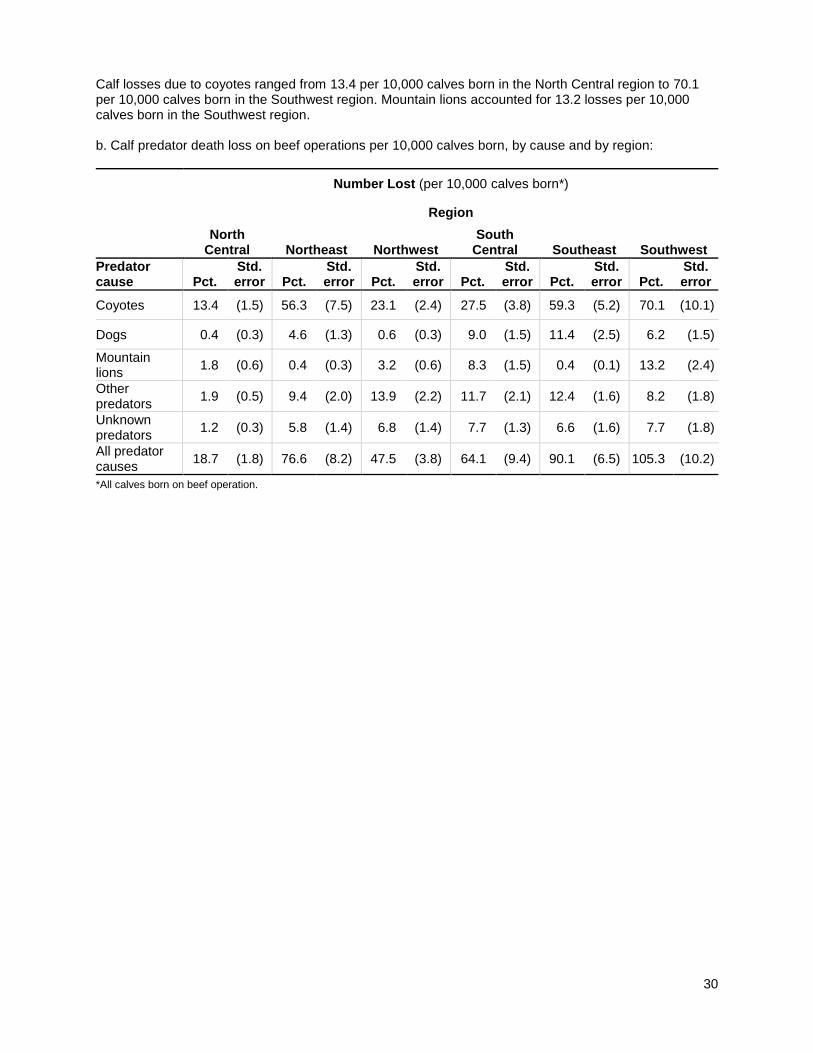
Calf losses due to coyotes ranged from 13.4 per 10,000 calves born in the North Central region to 70.1 per 10,000 calves born in the Southwest region. Mountain lions accounted for 13.2 losses per 10,000 calves born in the Southwest region. b. Calf predator death loss on beef operations per 10,000 calves born, by cause and by region:
Number Lost (per 10,000 calves born*)
Region
North
Central Northeast Northwest South
Central Southeast Southwest
Predator cause Pct.
Std. error Pct.
Std. error Pct.
Std. error Pct.
Std. error Pct.
Std. error Pct.
Std. error
Coyotes 13.4 (1.5) 56.3 (7.5) 23.1 (2.4) 27.5 (3.8) 59.3 (5.2) 70.1 (10.1)
Dogs 0.4 (0.3) 4.6 (1.3) 0.6 (0.3) 9.0 (1.5) 11.4 (2.5) 6.2 (1.5)
Mountain lions
1.8 (0.6) 0.4 (0.3) 3.2 (0.6) 8.3 (1.5) 0.4 (0.1) 13.2 (2.4)
Other predators
1.9 (0.5) 9.4 (2.0) 13.9 (2.2) 11.7 (2.1) 12.4 (1.6) 8.2 (1.8)
Unknown predators
1.2 (0.3) 5.8 (1.4) 6.8 (1.4) 7.7 (1.3) 6.6 (1.6) 7.7 (1.8)
All predator causes
18.7 (1.8) 76.6 (8.2) 47.5 (3.8) 64.1 (9.4) 90.1 (6.5) 105.3 (10.2)
*All calves born on beef operation.

31
D. Nonlethal Predator Control on Beef Operations Note: With the exception of estimates for all operations, estimates in section D are exclusively for beef operations due to the small number of losses on the other types of operations. 1. Frequency of use The percentage of all operations that used any nonlethal predator control methods increased from 3.1 percent in 2000 to 11.3 percent in 2010. In 2000, beef operations were slightly more likely than all operations to use nonlethal methods, although this difference has been diminishing. Most methods showed an increase in usage. The methods used most frequently were guard animals, fencing, culling, and frequent checks. a. Percentage of operations that used a nonlethal predator control method, by method used:
Percent Operations
All operations* Beef operations
2000 2005 2010 2000 2005 2010
Nonlethal control method Pct.
Std. error Pct.
Std. error Pct.
Std. error Pct.
Std. error Pct.
Std. error Pct.
Std. error
Guard animals
1.1 (0.1) 2.9 (0.2) 4.1 (0.2) 2.1 (0.2) 3.2 (0.2) 4.7 (0.3)
Fencing 1.1 (0.1) 2.5 (0.2) 3.8 (0.2) 2.0 (0.2) 2.8 (0.2) 3.8 (0.3)
Herding 0.2 (0.0) 0.3 (0.1) 0.6 (0.1) 0.3 (0.1) 0.3 (0.1) 0.7 (0.1)
Night penning
0.3 (0.0) 0.5 (0.1) 0.8 (0.1) 0.4 (0.1) 0.6 (0.1) 0.7 (0.1)
Fright tactics
0.2 (0.2) 0.2 (0.0) 0.3 (0.1) 0.4 (0.1) 0.2 (0.0) 0.3 (0.1)
Carcass removal
0.8 (0.1) 1.3 (0.1) 2.5 (0.1) 1.1 (0.1) 1.5 (0.1) 2.9 (0.2)
Culling — (—) 1.6 (0.1) 3.0 (0.2) — (—) 2.0 (0.1) 3.6 (0.2)
Frequent checks
— (—) 1.8 (0.1) 3.7 (0.3) — (—) 2.1 (0.1) 4.1 (0.3)
Other 0.3 (0.1) 0.5 (0.1) 0.8 (0.1) 0.6 (0.1) 0.6 (0.1) 0.8 (0.1)
Any methods
3.1 (0.2) 7.5 (0.3) 11.3 (0.4) 5.4 (0.3) 8.6 (0.3) 12.4 (0.4)
*Data on nonlethal predator control methods were not collected in 1991 and 1995.

32
More than 1 of 10 beef operations (12.4 percent) used some type of nonlethal predator control method. The most common nonlethal method was guard animals, followed by frequent checks, fencing, and culling. Operations with 500 head or more were more likely to use any nonlethal predator control method than smaller operations. b. Percentage of beef operations by nonlethal predator control method used in 2010, and by size of operation:
Percent Operations
Size of Operation (number of cows)
1–49 50–99 100–499
500 or more
Nonlethal control method Pct.
Std. error Pct.
Std. error Pct.
Std. error Pct.
Std. error
Guard animals
4.8 (0.3) 4.4 (0.6) 4.5 (0.5) 3.9 (0.7)
Fencing 4.1 (0.3) 3.1 (0.5) 2.2 (0.3) 1.6 (0.4)
Herding 0.7 (0.1) 0.9 (0.4) 1.2 (0.3) 1.9 (0.4)
Night penning
0.7 (0.1) 0.3 (0.1) 1.1 (0.3) 0.9 (0.3)
Fright tactics
0.3 (0.1) 0.3 (0.1) 0.8 (0.2) 1.2 (0.4)
Carcass removal
2.3 (0.2) 3.6 (0.4) 6.8 (0.7) 8.7 (1.5)
Culling 2.9 (0.2) 5.3 (0.6) 7.5 (0.6) 9.0 (0.9)
Frequent checks
3.7 (0.3) 4.1 (0.5) 7.0 (0.5) 10.2 (1.5)
Other 0.7 (0.1) 1.0 (0.2) 1.5 (0.6) 0.9 (0.3)
Any methods 11.9 (0.5) 13.2 (0.9) 15.1 (1.0) 16.5 (1.7)
33
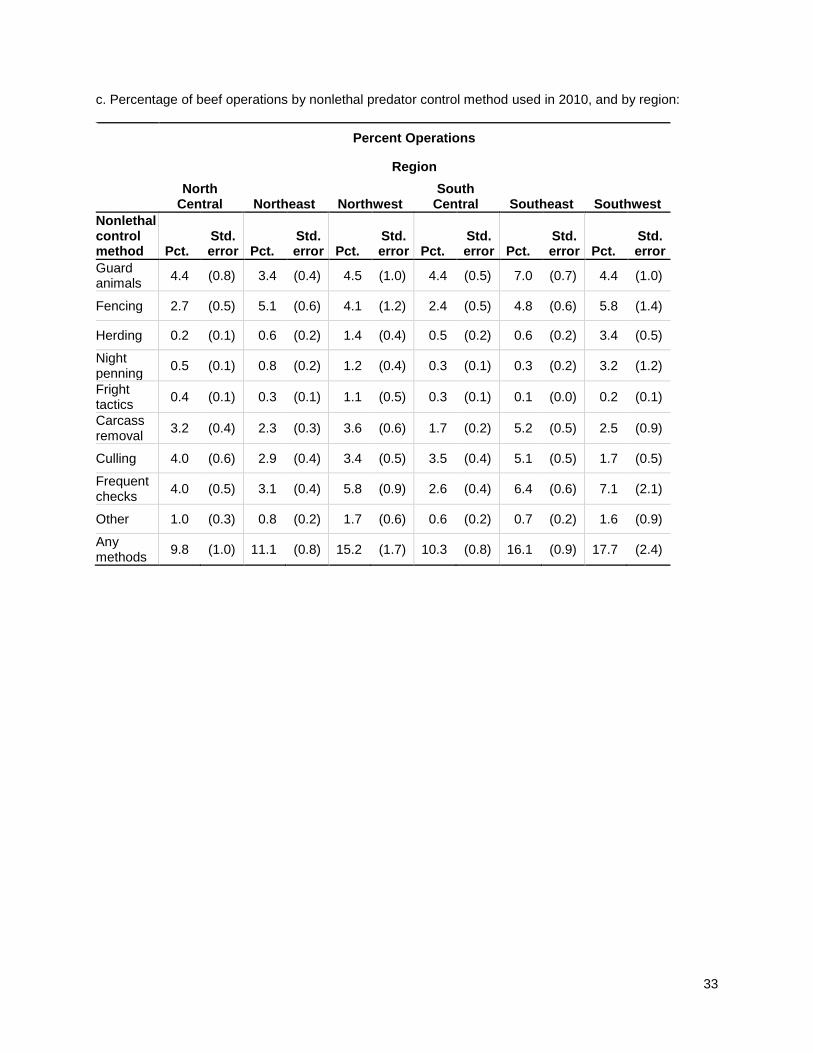
c. Percentage of beef operations by nonlethal predator control method used in 2010, and by region:
Percent Operations
Region
North
Central Northeast Northwest South
Central Southeast Southwest
Nonlethal control method Pct.
Std. error Pct.
Std. error Pct.
Std. error Pct.
Std. error Pct.
Std. error Pct.
Std. error
Guard animals
4.4 (0.8) 3.4 (0.4) 4.5 (1.0) 4.4 (0.5) 7.0 (0.7) 4.4 (1.0)
Fencing 2.7 (0.5) 5.1 (0.6) 4.1 (1.2) 2.4 (0.5) 4.8 (0.6) 5.8 (1.4)
Herding 0.2 (0.1) 0.6 (0.2) 1.4 (0.4) 0.5 (0.2) 0.6 (0.2) 3.4 (0.5)
Night penning
0.5 (0.1) 0.8 (0.2) 1.2 (0.4) 0.3 (0.1) 0.3 (0.2) 3.2 (1.2)
Fright tactics
0.4 (0.1) 0.3 (0.1) 1.1 (0.5) 0.3 (0.1) 0.1 (0.0) 0.2 (0.1)
Carcass removal
3.2 (0.4) 2.3 (0.3) 3.6 (0.6) 1.7 (0.2) 5.2 (0.5) 2.5 (0.9)
Culling 4.0 (0.6) 2.9 (0.4) 3.4 (0.5) 3.5 (0.4) 5.1 (0.5) 1.7 (0.5)
Frequent checks
4.0 (0.5) 3.1 (0.4) 5.8 (0.9) 2.6 (0.4) 6.4 (0.6) 7.1 (2.1)
Other 1.0 (0.3) 0.8 (0.2) 1.7 (0.6) 0.6 (0.2) 0.7 (0.2) 1.6 (0.9)
Any methods
9.8 (1.0) 11.1 (0.8) 15.2 (1.7) 10.3 (0.8) 16.1 (0.9) 17.7 (2.4)

34
2. Operations that used nonlethal predator control methods Of beef operations that used nonlethal predator control methods, about one-third used the following methods: guard animals (37.9 percent), fencing (31.0 percent), culling (29.2 percent), and frequent checks (33.1 percent). a. For the 11.3 percent of all operations and the 12.4 percent of beef operations that used a nonlethal predator control method in 2010, percentage of operations by control method used:
Percent Operations
All operations* Beef operations
Nonlethal control method 2000 2005 2010 2000 2005 2010
Guard animals 27.7 38.0 36.9 37.9 37.6 37.9
Fencing 29.9 34.0 32.8 36.4 32.0 31.0
Herding 7.4 3.8 5.3 5.3 4.0 6.0
Night penning 10.8 9.7 6.6 8.0 6.7 5.4
Fright tactics
6.8 3.0 2.5 7.3 2.9 2.5
Carcass removal 40.4 16.5 23.9 20.6 17.5 23.0
Culling NA 19.6 28.9 NA 22.8 29.2
Frequent checks NA 21.8 32.1 NA 24.9 33.1
Other 11.3 6.2 7.0 10.7 6.6 6.7
*NASS Cattle Predator Loss—2000, May 4, 2001; NASS Cattle Predator Loss—2005, May 5, 2006; NASS Cattle Predator Loss—2010, May 12, 2011.
35
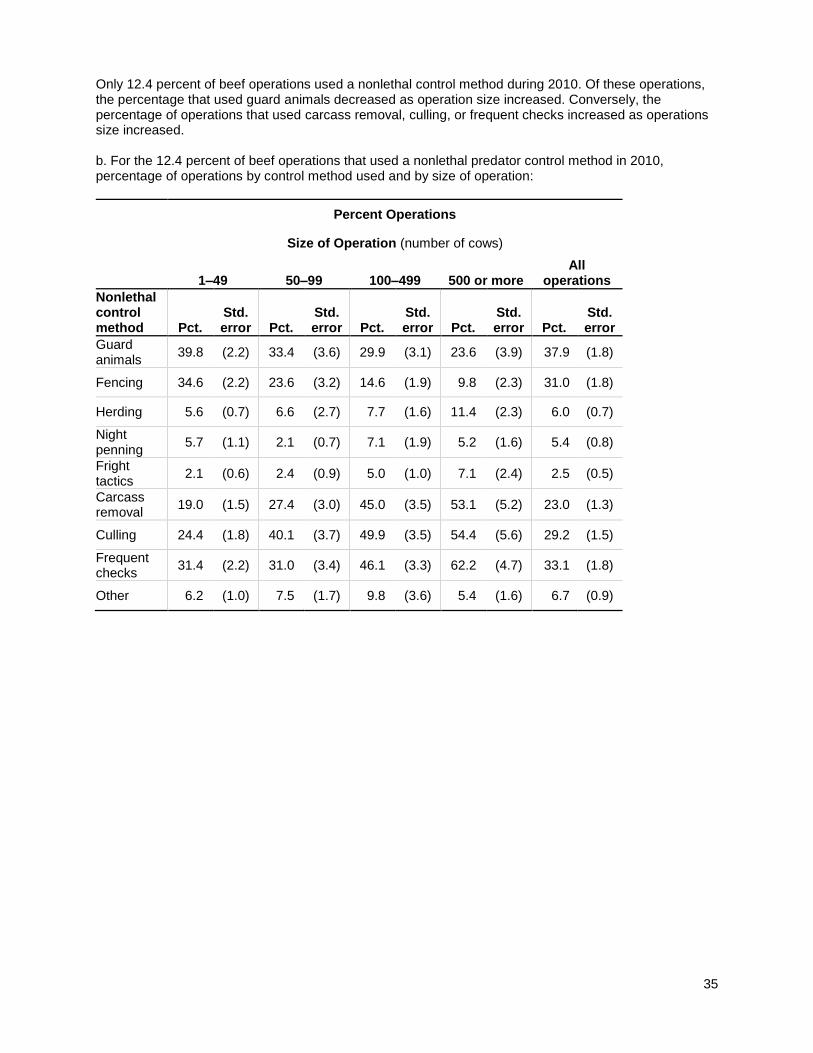
Only 12.4 percent of beef operations used a nonlethal control method during 2010. Of these operations, the percentage that used guard animals decreased as operation size increased. Conversely, the percentage of operations that used carcass removal, culling, or frequent checks increased as operations size increased. b. For the 12.4 percent of beef operations that used a nonlethal predator control method in 2010, percentage of operations by control method used and by size of operation:
Percent Operations
Size of Operation (number of cows)
1–49 50–99 100–499 500 or more All
operations
Nonlethal control method Pct.
Std. error Pct.
Std. error Pct.
Std. error Pct.
Std. error Pct.
Std. error
Guard animals
39.8 (2.2) 33.4 (3.6) 29.9 (3.1) 23.6 (3.9) 37.9 (1.8)
Fencing 34.6 (2.2) 23.6 (3.2) 14.6 (1.9) 9.8 (2.3) 31.0 (1.8)
Herding 5.6 (0.7) 6.6 (2.7) 7.7 (1.6) 11.4 (2.3) 6.0 (0.7)
Night penning
5.7 (1.1) 2.1 (0.7) 7.1 (1.9) 5.2 (1.6) 5.4 (0.8)
Fright tactics
2.1 (0.6) 2.4 (0.9) 5.0 (1.0) 7.1 (2.4) 2.5 (0.5)
Carcass removal
19.0 (1.5) 27.4 (3.0) 45.0 (3.5) 53.1 (5.2) 23.0 (1.3)
Culling 24.4 (1.8) 40.1 (3.7) 49.9 (3.5) 54.4 (5.6) 29.2 (1.5)
Frequent checks
31.4 (2.2) 31.0 (3.4) 46.1 (3.3) 62.2 (4.7) 33.1 (1.8)
Other 6.2 (1.0) 7.5 (1.7) 9.8 (3.6) 5.4 (1.6) 6.7 (0.9)
36
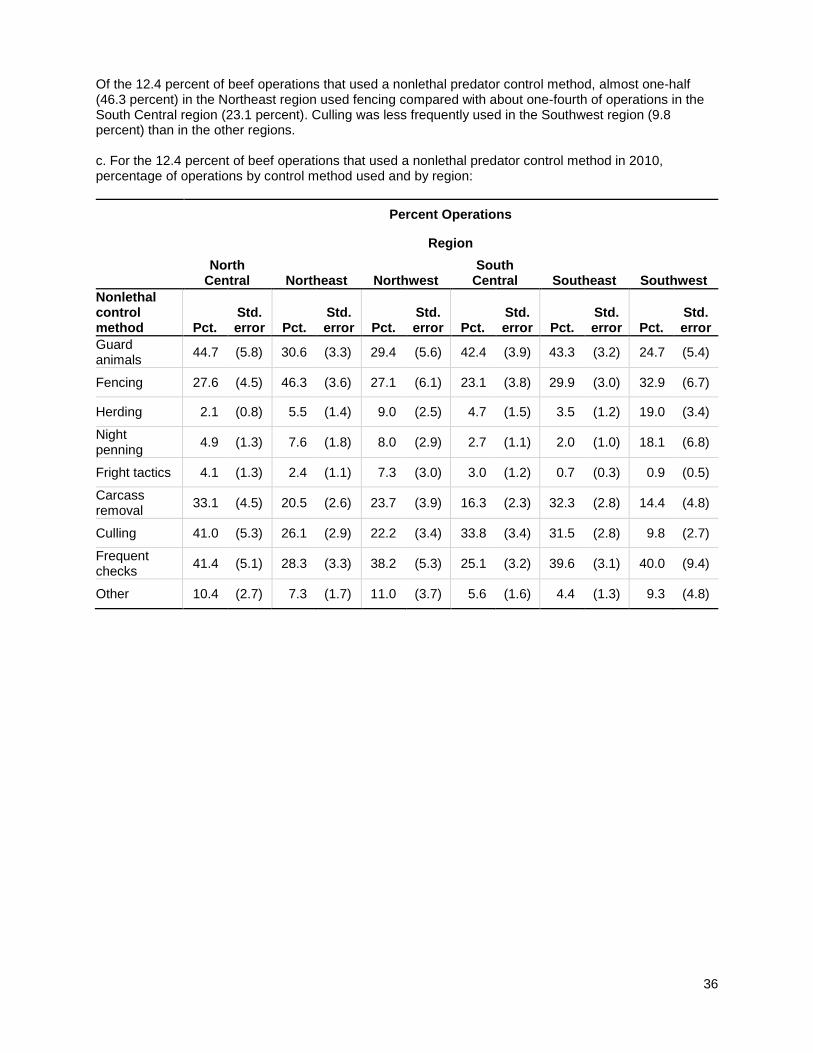
Of the 12.4 percent of beef operations that used a nonlethal predator control method, almost one-half (46.3 percent) in the Northeast region used fencing compared with about one-fourth of operations in the South Central region (23.1 percent). Culling was less frequently used in the Southwest region (9.8 percent) than in the other regions. c. For the 12.4 percent of beef operations that used a nonlethal predator control method in 2010, percentage of operations by control method used and by region:
Percent Operations
Region
North
Central Northeast Northwest South
Central Southeast Southwest
Nonlethal control method Pct.
Std. error Pct.
Std. error Pct.
Std. error Pct.
Std. error Pct.
Std. error Pct.
Std. error
Guard animals
44.7 (5.8) 30.6 (3.3) 29.4 (5.6) 42.4 (3.9) 43.3 (3.2) 24.7 (5.4)
Fencing 27.6 (4.5) 46.3 (3.6) 27.1 (6.1) 23.1 (3.8) 29.9 (3.0) 32.9 (6.7)
Herding 2.1 (0.8) 5.5 (1.4) 9.0 (2.5) 4.7 (1.5) 3.5 (1.2) 19.0 (3.4)
Night penning
4.9 (1.3) 7.6 (1.8) 8.0 (2.9) 2.7 (1.1) 2.0 (1.0) 18.1 (6.8)
Fright tactics
4.1 (1.3) 2.4 (1.1) 7.3 (3.0) 3.0 (1.2) 0.7 (0.3) 0.9 (0.5)
Carcass removal
33.1 (4.5) 20.5 (2.6) 23.7 (3.9) 16.3 (2.3) 32.3 (2.8) 14.4 (4.8)
Culling 41.0 (5.3) 26.1 (2.9) 22.2 (3.4) 33.8 (3.4) 31.5 (2.8) 9.8 (2.7)
Frequent checks
41.4 (5.1) 28.3 (3.3) 38.2 (5.3) 25.1 (3.2) 39.6 (3.1) 40.0 (9.4)
Other 10.4 (2.7) 7.3 (1.7) 11.0 (3.7) 5.6 (1.6) 4.4 (1.3) 9.3 (4.8)
37
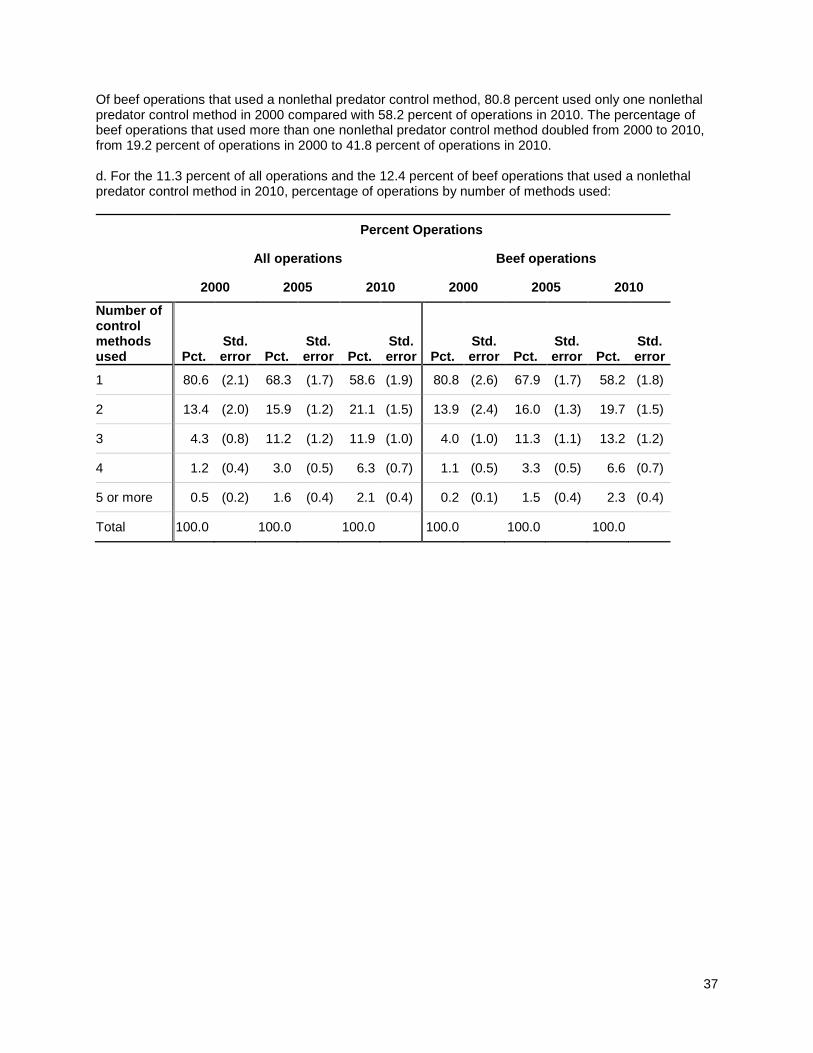
Of beef operations that used a nonlethal predator control method, 80.8 percent used only one nonlethal predator control method in 2000 compared with 58.2 percent of operations in 2010. The percentage of beef operations that used more than one nonlethal predator control method doubled from 2000 to 2010, from 19.2 percent of operations in 2000 to 41.8 percent of operations in 2010. d. For the 11.3 percent of all operations and the 12.4 percent of beef operations that used a nonlethal predator control method in 2010, percentage of operations by number of methods used:
Percent Operations
All operations Beef operations
2000 2005 2010 2000 2005 2010
Number of control methods used Pct.
Std. error Pct.
Std. error Pct.
Std. error Pct.
Std. error Pct.
Std. error Pct.
Std. error
1 80.6 (2.1) 68.3 (1.7) 58.6 (1.9) 80.8 (2.6) 67.9 (1.7) 58.2 (1.8)
2 13.4 (2.0) 15.9 (1.2) 21.1 (1.5) 13.9 (2.4) 16.0 (1.3) 19.7 (1.5)
3 4.3 (0.8) 11.2 (1.2) 11.9 (1.0) 4.0 (1.0) 11.3 (1.1) 13.2 (1.2)
4 1.2 (0.4) 3.0 (0.5) 6.3 (0.7) 1.1 (0.5) 3.3 (0.5) 6.6 (0.7)
5 or more 0.5 (0.2) 1.6 (0.4) 2.1 (0.4) 0.2 (0.1) 1.5 (0.4) 2.3 (0.4)
Total 100.0 100.0 100.0 100.0 100.0 100.0
38
Section III: Methodology A. Cattle and Calf Death Loss Estimates 1. Survey procedures A random sample of U.S. cattle producers was surveyed to provide data for these estimates. Survey procedures ensured that all producers (except those in Alaska) had an opportunity to participate in the survey, regardless of operation size. Large operations were sampled more heavily than small operations. Data were collected from about 77,000 producers in 1991, 50,000 in 1996, 50,000 in 2001, 50,000 in 2006, and 40,000 in 2011. Surveys were conducted during the first half of January by mail, telephone, and face-to-face interviews. During the respective years, producers were asked to report death losses for cattle and calves for the 1991, 1995, 2000, 2005, and 2010 calendar years and the January 1, 1992, 1996, 2001, 2006, and 2011 cattle and calf inventories by class. Based on the original data collected during January, the NASS “Cattle and Calves Death Loss” report was issued in May 1992, May 1996, May 2006, and May 2011. The NASS “Cattle Predator Loss” report was published in May 2001. These reports contained data for death loss by cause, including predator losses and losses from other causes. These estimates were on State and regional levels. The NASS “Cattle” report was issued in February 1992, February 1996, January 2001, January 2006, and January 2011 and contained January 1 inventory estimates. Data in the reports mentioned above as well as additional summaries from the original data provided estimates for this report. The original data were resummarized to break-out the losses by class of operation and by size group based on reported inventory. The operation classes included beef cattle, dairy cattle, mixed, and “other” cattle operations. These classes and size groups are further defined in Terms Used in This Report. 2. Estimation procedures Estimates of total death loss and death loss by cause were prepared by the Livestock, Dairy and Poultry Branch, NASS, and the National Animal Health Monitoring System, APHIS. Total cattle and calf death losses from all causes were published in NASS’s 1991, 1995, 2000, 2005, and 2010 “Meat Animal Production, Disposition, and Income” reports, released in April 1992, April 1996, April 2001, April 2006, and April 2010. Breakdowns by cause of loss and value of loss were published in the NASS “Cattle and Calves Death Loss” reports issued in May 1992, May 1996, May 2006, and May 2011. Only the NASS “Cattle Predator Loss” report was issued in May 2001. 3. Reliability Since all cattle producers are not included in the sample, survey estimates are subject to sampling variability. Survey results also are subject to nonsampling errors such as omissions, duplications, and mistakes in reporting, recording, and processing data. The effects of these nonsampling errors cannot be measured directly. They are minimized through rigid quality controls in the data collection process and through a careful review of all reported data for consistency and reasonableness. 4. Revision Revisions to previous estimates of total death losses are made to improve the current estimates. Previous-year estimates are subject to revision when current estimates are made. Estimates for losses from all causes are subject to revision in the following year’s “Meat Animals, Production, Disposition, and Income” report.
39
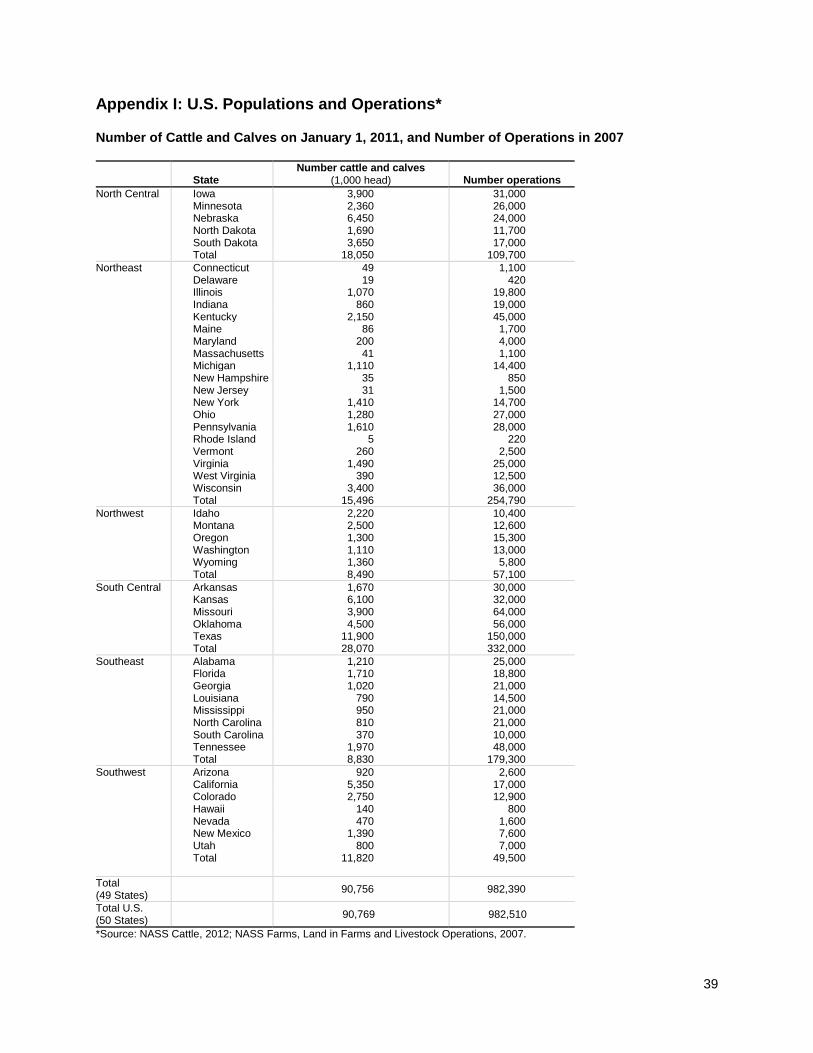
Appendix I: U.S. Populations and Operations* Number of Cattle and Calves on January 1, 2011, and Number of Operations in 2007
State
Number cattle and calves (1,000 head) Number operations
North Central Iowa 3,900 31,000 Minnesota 2,360 26,000 Nebraska 6,450 24,000 North Dakota 1,690 11,700 South Dakota 3,650 17,000 Total 18,050 109,700
Northeast Connecticut 49 1,100 Delaware 19 420 Illinois 1,070 19,800 Indiana 860 19,000 Kentucky 2,150 45,000 Maine 86 1,700 Maryland 200 4,000 Massachusetts 41 1,100 Michigan 1,110 14,400 New Hampshire 35 850 New Jersey 31 1,500 New York 1,410 14,700 Ohio 1,280 27,000 Pennsylvania 1,610 28,000 Rhode Island 5 220 Vermont 260 2,500 Virginia 1,490 25,000 West Virginia 390 12,500 Wisconsin 3,400 36,000 Total 15,496 254,790
Northwest Idaho 2,220 10,400 Montana 2,500 12,600 Oregon 1,300 15,300 Washington 1,110 13,000 Wyoming 1,360 5,800 Total 8,490 57,100
South Central Arkansas 1,670 30,000 Kansas 6,100 32,000 Missouri 3,900 64,000 Oklahoma 4,500 56,000 Texas 11,900 150,000 Total 28,070 332,000
Southeast Alabama 1,210 25,000 Florida 1,710 18,800 Georgia 1,020 21,000 Louisiana 790 14,500 Mississippi 950 21,000 North Carolina 810 21,000 South Carolina 370 10,000 Tennessee 1,970 48,000 Total 8,830 179,300
Southwest Arizona 920 2,600 California 5,350 17,000 Colorado 2,750 12,900 Hawaii 140 800 Nevada 470 1,600 New Mexico 1,390 7,600 Utah 800 7,000 Total 11,820 49,500
Total (49 States)
90,756 982,390
Total U.S. (50 States)
90,769 982,510
*Source: NASS Cattle, 2012; NASS Farms, Land in Farms and Livestock Operations, 2007.