category report nu281mber of reviews it service management ... · service management market. this...
TRANSCRIPT

Category Report
IT ServiceManagement
NUMBER OF REVIEWS
281NUMBER OF VENDORSEVALUATED
6REPORT GENERATED
February 2018
Axios ITSM
TeamDynamix ITSM
Cherwell Service Management
OmniTracker ITSM
ServiceNow Service Management
Spiceworks IT Help Desk

IT Service Management Category Report
Table ofContentsData Quadrant.................................................................................................................. 4
Category Overview ......................................................................................................5
Vendor Capability Summary ................................................................................ 6
Vendor Capabilities.......................................................................................................7
Product Feature Summary ...................................................................................13
Product Features ..........................................................................................................14
Emotional Footprint Summary .......................................................................20
Emotional Footprint.................................................................................................. 21
How to Use the ReportInfo-Tech’s Category Reports provide a comprehensive evaluation of popular products in the ITService Management market. This buyer’s guide is designed to help prospective purchasers makebetter decisions by leveraging the experiences of real users.
The data in this report is collected from real end users, meticulously verified for veracity,exhaustively analyzed, and visualized in easy to understand charts and graphs. Each product iscompared and contrasted with all other vendors in their category to create a holistic, unbiased viewof the product landscape.
Use this report to determine which product is right for your organization. For highly detailed reportson individual products, see Info-Tech’s Product Scorecard.
2
Category Report
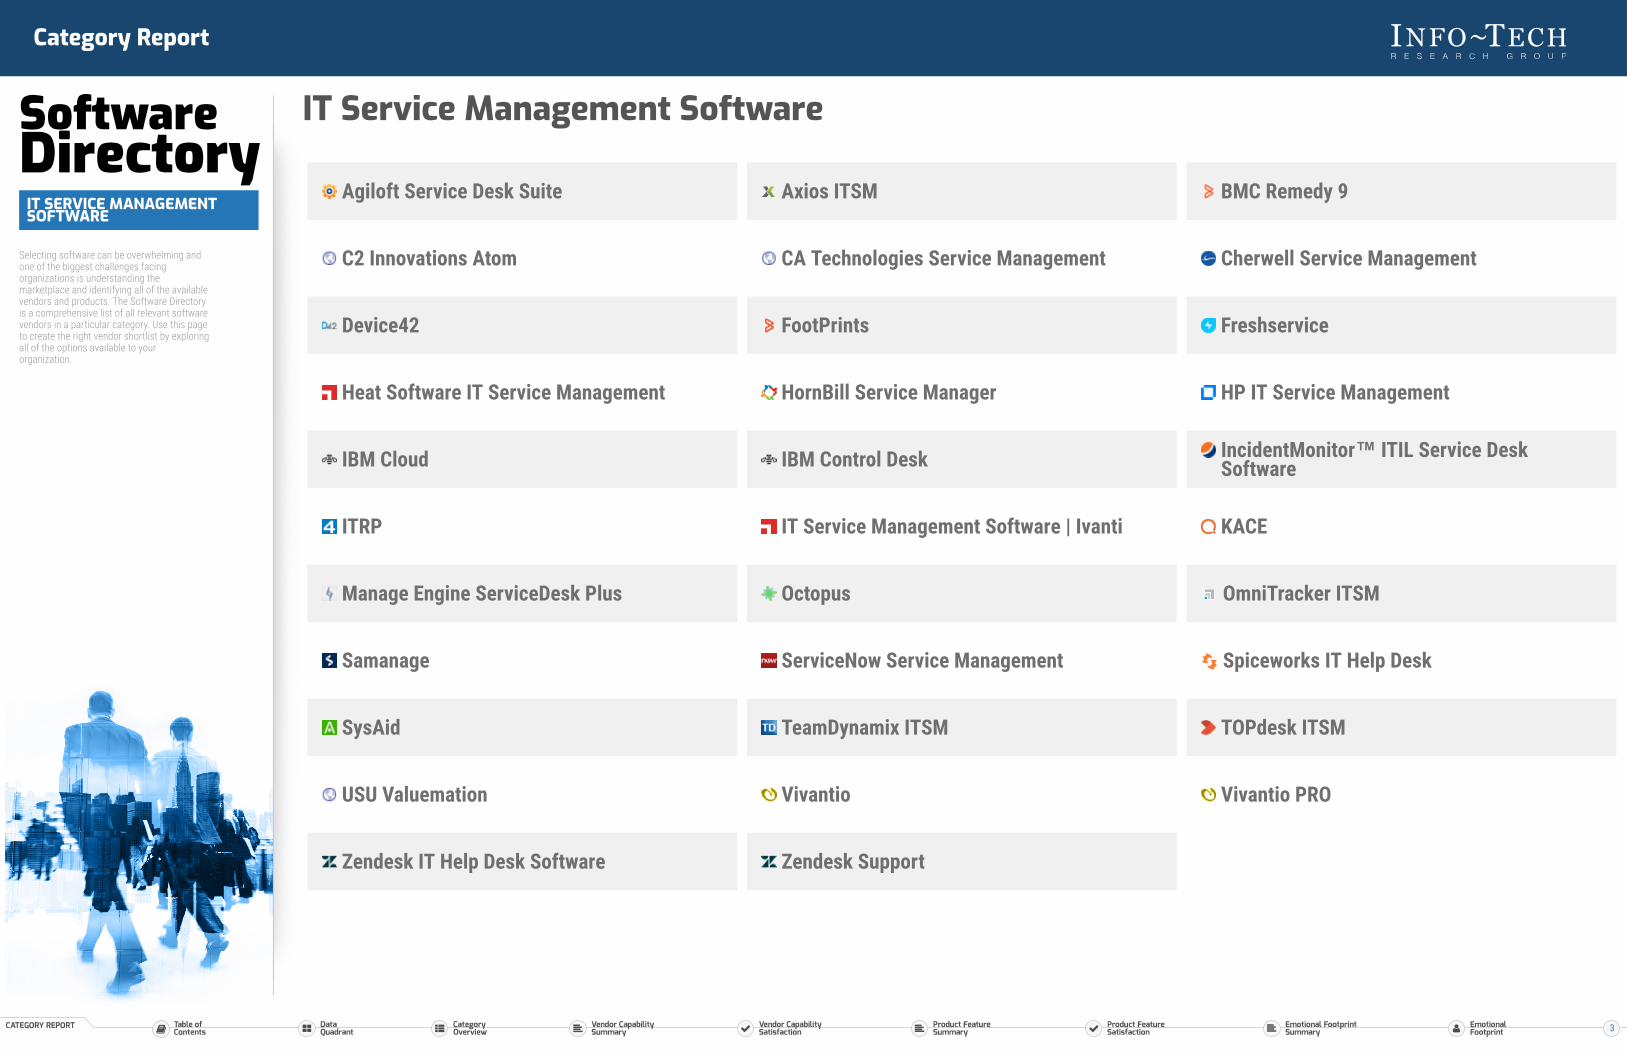
SoftwareDirectoryIT SERVICE MANAGEMENTSOFTWARE
Selecting software can be overwhelming andone of the biggest challenges facingorganizations is understanding themarketplace and identifying all of the availablevendors and products. The Software Directoryis a comprehensive list of all relevant softwarevendors in a particular category. Use this pageto create the right vendor shortlist by exploringall of the options available to yourorganization.
IT Service Management Software
Agiloft Service Desk Suite Axios ITSM BMC Remedy 9
C2 Innovations Atom CA Technologies Service Management Cherwell Service Management
Device42 FootPrints Freshservice
Heat Software IT Service Management HornBill Service Manager HP IT Service Management
IBM Cloud IBM Control Desk IncidentMonitor™ ITIL Service DeskSoftware
ITRP IT Service Management Software | Ivanti KACE
Manage Engine ServiceDesk Plus Octopus OmniTracker ITSM
Samanage ServiceNow Service Management Spiceworks IT Help Desk
SysAid TeamDynamix ITSM TOPdesk ITSM
USU Valuemation Vivantio Vivantio PRO
Zendesk IT Help Desk Software Zendesk Support
3

IT Service Management Category Report
SOFTWARE REVIEWS
Data QuadrantAssess vendor and product performance at a glance and use the Software ReviewsData Quadrant to identify which products and vendors are leadings the pack andwhich are trailing.
PRO
DUCT
FEA
TURE
S AN
D SA
TISF
ACTI
ON
7.3
8.2
VENDOR EXPERIENCE AND CAPABILITIES6.6 8.8
PRODUCT INNOVATOR
FOLLOWER
LEADER
SERVICE STAR
TeamDynamix ITSM
Cherwell Service Management
OmniTracker ITSM
Spiceworks IT Help Desk
Axios ITSM
ServiceNow Service Management
IT ServiceManagementThe Software Reviews Data Quadrant evaluates and ranks products based on feedbackfrom IT and business professionals. The placement of a software in the Data Quadrantindicates its relative ranking as well as its categorization.
The Complete SoftwareExperienceWhen distilled down, the software experience is shaped by both the experience with thesoftware and the relationship with the vendor. Evaluating enterprise software along thesetwo dimensions provides a comprehensive understanding of the product and helpsidentify vendors that can deliver on both.
ProductFeatures andSatisfactionThe satisfaction is captured inthe overall satisfaction score,which is driven by the likelihoodof users to recommend thesoftware, combined with usersatisfaction across top productfeatures.
VendorExperience andCapabilitiesThe vendor relationship is calculated ina weighted average of the satisfactionscores tied to vendor capabilities (e.g.software implementation, training,customer support, product roadmap) aswell as emotional response ratingstoward the vendor (e.g. trustworthy,respectful, fair).
Note: The axes ranges are dynamically adjusted based onminimum and maximum values in the dataset.
4

IT Service Management Category Report
CategoryOverview
This page provides a high level summary of product performance within the IT Service Management category. Products are ranked by a composite satisfaction score(Composite Score) that averages four different areas of evaluation: Net Emotional Footprint, Vendor Capabilities, Product Features, and Likeliness to Recommend. The NetEmotional Footprint Score measures user emotional response ratings of the vendor (e.g. trustworthy, respectful, fair).
Use this data to get a sense of the field, and to see how the products you’re considering stack up.
RANK VENDOR COMPOSITE SCORE NET EMOTIONALFOOTPRINT
NET EMOTIONALFOOTPRINT DISTRIBUTION
VENDORCAPABILITIES
PRODUCTFEATURES
LIKELINESS TORECOMMEND
NUMBER OFREVIEWS
Cherwell ITSM 8.4/10 +854% NEGATIVE 89% POSITIVE
81% 75% 90% 49
TeamDynamix ITSM 8.4/10 +922% NEGATIVE 94% POSITIVE
76% 73% 89% 38
OmniTracker 8.2/10 +852% NEGATIVE 87% POSITIVE
78% 73% 86% 73
4 Spiceworks IT Help Desk 7.9/10 +763% NEGATIVE 79% POSITIVE
80% 78% 83% 18
5 Axios 7.3/10 +717% NEGATIVE 78% POSITIVE
72% 72% 81% 23
6 ServiceNow ITSM 6.9/10 +627% NEGATIVE 69% POSITIVE
73% 62% 84% 22
AVERAGE SCORES 7.9/10 +794% NEGATIVE 83% POSITIVE
77% 72% 85% 37
VENDORS WITH INSUFFICIENT DATA
-- FootPrints -- +1422% NEGATIVE 36% POSITIVE
-- -- 56% 10
-- IBM Cloud -- +635% NEGATIVE 68% POSITIVE
-- -- 66% 9
-- HP IT Service Management -- +4622% NEGATIVE 68% POSITIVE
-- -- 64% 9
5
IT Service Management Category Report
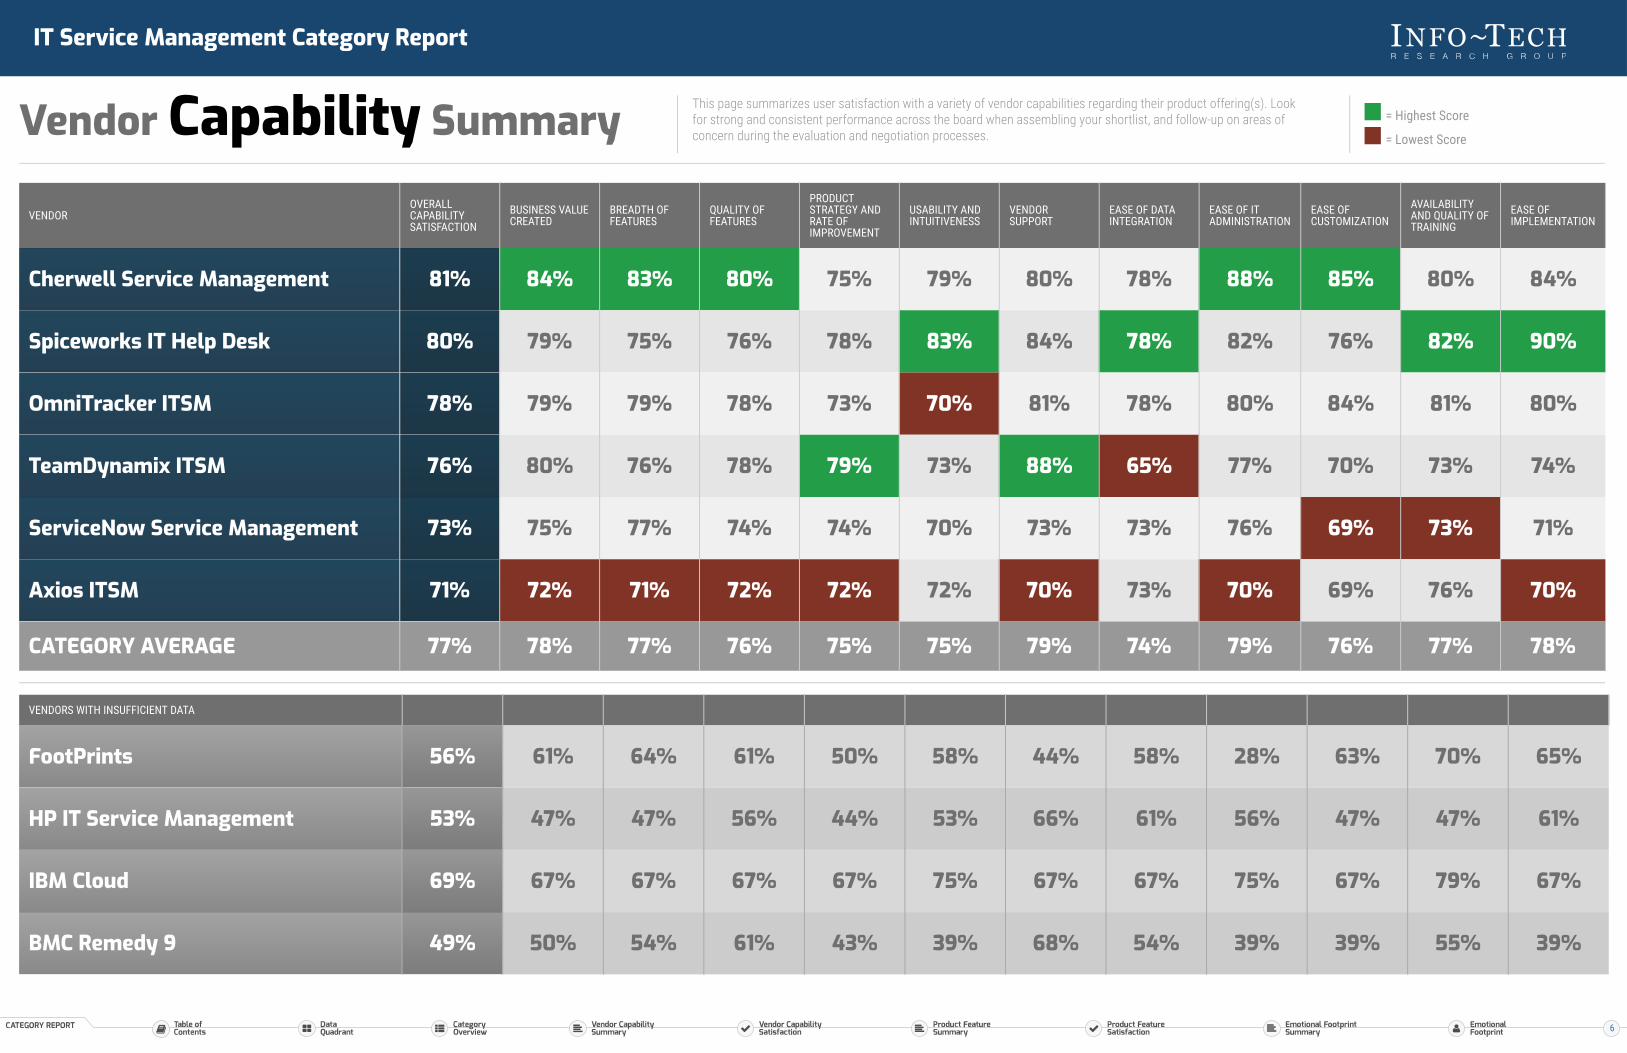
Vendor Capability Summary This page summarizes user satisfaction with a variety of vendor capabilities regarding their product offering(s). Lookfor strong and consistent performance across the board when assembling your shortlist, and follow-up on areas ofconcern during the evaluation and negotiation processes.
= Highest Score
= Lowest Score
VENDOROVERALLCAPABILITYSATISFACTION
BUSINESS VALUECREATED
BREADTH OFFEATURES
QUALITY OFFEATURES
PRODUCTSTRATEGY ANDRATE OFIMPROVEMENT
USABILITY ANDINTUITIVENESS
VENDORSUPPORT
EASE OF DATAINTEGRATION
EASE OF ITADMINISTRATION
EASE OFCUSTOMIZATION
AVAILABILITYAND QUALITY OFTRAINING
EASE OFIMPLEMENTATION
Cherwell Service Management 81% 84% 83% 80% 75% 79% 80% 78% 88% 85% 80% 84%
Spiceworks IT Help Desk 80% 79% 75% 76% 78% 83% 84% 78% 82% 76% 82% 90%
OmniTracker ITSM 78% 79% 79% 78% 73% 70% 81% 78% 80% 84% 81% 80%
TeamDynamix ITSM 76% 80% 76% 78% 79% 73% 88% 65% 77% 70% 73% 74%
ServiceNow Service Management 73% 75% 77% 74% 74% 70% 73% 73% 76% 69% 73% 71%
Axios ITSM 71% 72% 71% 72% 72% 72% 70% 73% 70% 69% 76% 70%
CATEGORY AVERAGE 77% 78% 77% 76% 75% 75% 79% 74% 79% 76% 77% 78%
VENDORS WITH INSUFFICIENT DATA
FootPrints 56% 61% 64% 61% 50% 58% 44% 58% 28% 63% 70% 65%
HP IT Service Management 53% 47% 47% 56% 44% 53% 66% 61% 56% 47% 47% 61%
IBM Cloud 69% 67% 67% 67% 67% 75% 67% 67% 75% 67% 79% 67%
BMC Remedy 9 49% 50% 54% 61% 43% 39% 68% 54% 39% 39% 55% 39%
6
IT Service Management Category Report
Vendor CapabilitySatisfaction
This section provides detailed information on user satisfaction for each vendor capability regarding their product offering(s). Use these pages to dig deeper into areas ofparticular interest or concern.
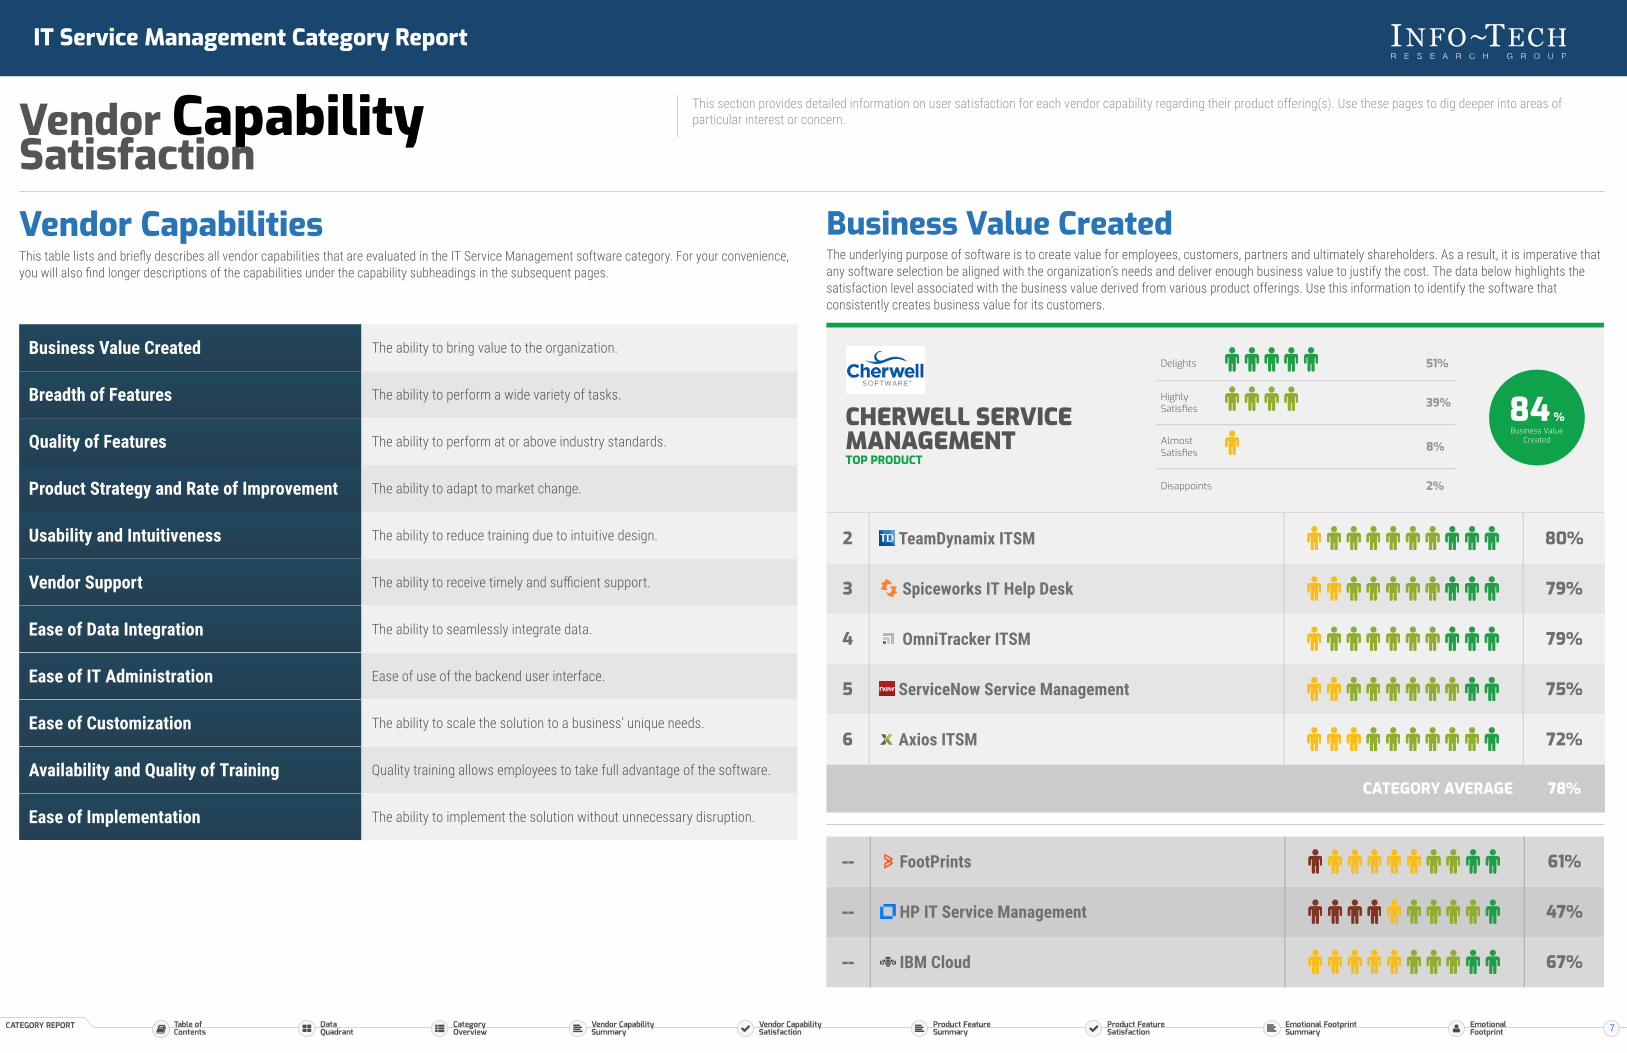
Vendor CapabilitiesThis table lists and briefly describes all vendor capabilities that are evaluated in the IT Service Management software category. For your convenience,you will also find longer descriptions of the capabilities under the capability subheadings in the subsequent pages.
Business Value Created The ability to bring value to the organization.
Breadth of Features The ability to perform a wide variety of tasks.
Quality of Features The ability to perform at or above industry standards.
Product Strategy and Rate of Improvement The ability to adapt to market change.
Usability and Intuitiveness The ability to reduce training due to intuitive design.
Vendor Support The ability to receive timely and sufficient support.
Ease of Data Integration The ability to seamlessly integrate data.
Ease of IT Administration Ease of use of the backend user interface.
Ease of Customization The ability to scale the solution to a business’ unique needs.
Availability and Quality of Training Quality training allows employees to take full advantage of the software.
Ease of Implementation The ability to implement the solution without unnecessary disruption.
Business Value CreatedThe underlying purpose of software is to create value for employees, customers, partners and ultimately shareholders. As a result, it is imperative thatany software selection be aligned with the organization’s needs and deliver enough business value to justify the cost. The data below highlights thesatisfaction level associated with the business value derived from various product offerings. Use this information to identify the software thatconsistently creates business value for its customers.
CHERWELL SERVICEMANAGEMENTTOP PRODUCT
Delights 51%
HighlySatisfies 39%
AlmostSatisfies 8%
Disappoints 2%
84 %Business Value
Created
2 TeamDynamix ITSM 80%
3 Spiceworks IT Help Desk 79%
4 OmniTracker ITSM 79%
5 ServiceNow Service Management 75%
6 Axios ITSM 72%
CATEGORY AVERAGE 78%
-- FootPrints 61%
-- HP IT Service Management 47%
-- IBM Cloud 67%
7

IT Service Management Category Report
Vendor CapabilitySatisfaction
This section provides detailed information on user satisfaction for each vendor capability regarding their product offering(s). Use these pages to dig deeper into areas ofparticular interest or concern.
Breadth of FeaturesUsers prefer to work with feature rich software that enables them to perform diverse series of tasks as opposed to one they find restrictive. The databelow highlights the satisfaction level associated with the breadth of features from various product offerings. Use this information to identify whichsoftware offers valuable comprehensive functionality that extends beyond the basic level.
CHERWELL SERVICEMANAGEMENTTOP PRODUCT
Delights 41%
HighlySatisfies 49%
AlmostSatisfies 10%
Disappoints --
83 %Breadth ofFeatures
2 OmniTracker ITSM 79%
3 ServiceNow Service Management 77%
4 TeamDynamix ITSM 76%
5 Spiceworks IT Help Desk 75%
6 Axios ITSM 71%
CATEGORY AVERAGE 77%
-- FootPrints 64%
-- HP IT Service Management 47%
-- IBM Cloud 67%
Quality of FeaturesFeature quality is just as important as quantity. Software needs to do what you’re purchasing it to do, easily, intuitively, reliably, and effectively. Use thedata in this section to gauge whether or not a product follows through on the marketing hype by delivering high quality features.
CHERWELL SERVICEMANAGEMENTTOP PRODUCT
Delights 43%
HighlySatisfies 43%
AlmostSatisfies 10%
Disappoints 4%
80 %Quality of Features
2 OmniTracker ITSM 78%
3 TeamDynamix ITSM 78%
4 Spiceworks IT Help Desk 76%
5 ServiceNow Service Management 74%
6 Axios ITSM 72%
CATEGORY AVERAGE 76%
-- FootPrints 61%
-- HP IT Service Management 56%
-- IBM Cloud 67%
8

IT Service Management Category Report
Vendor CapabilitySatisfaction
This section provides detailed information on user satisfaction for each vendor capability regarding their product offering(s). Use these pages to dig deeper into areas ofparticular interest or concern.
Product Strategy and Rate of ImprovementPurchasing software can be a significant commitment, so it’s important to know if your vendor is serious about the need for constant improvementand deliberate strategic direction. Vendors who don’t stay on top of emerging needs and trends won’t enable you to meet your business goals. Use thedata in this section to separate innovators from imposters.
TEAMDYNAMIX ITSMTOP PRODUCT
Delights 32%
HighlySatisfies 58%
AlmostSatisfies 8%
Disappoints 3%
79 %Product Strategy
and Rate ofImprovement
2 Spiceworks IT Help Desk 78%
3 Cherwell Service Management 75%
4 ServiceNow Service Management 74%
5 OmniTracker ITSM 73%
6 Axios ITSM 72%
CATEGORY AVERAGE 75%
-- FootPrints 50%
-- HP IT Service Management 44%
-- IBM Cloud 67%
Usability and IntuitivenessEnd user learning curves cost the organization money. Pay attention to your end users’ technical ability to determine how important UX is in yourpurchase.
SPICEWORKS IT HELPDESKTOP PRODUCT
Delights 44%
HighlySatisfies 44%
AlmostSatisfies 11%
Disappoints --
83 %Usability andIntuitiveness
2 Cherwell Service Management 79%
3 TeamDynamix ITSM 73%
4 Axios ITSM 72%
5 ServiceNow Service Management 70%
6 OmniTracker ITSM 70%
CATEGORY AVERAGE 75%
-- FootPrints 58%
-- HP IT Service Management 53%
-- IBM Cloud 75%
9

IT Service Management Category Report
Vendor CapabilitySatisfaction
This section provides detailed information on user satisfaction for each vendor capability regarding their product offering(s). Use these pages to dig deeper into areas ofparticular interest or concern.
Vendor SupportThe importance of vendor support will vary for each organization depending on internal capabilities, but there will always be issues that only thevendor can resolve. Use the data in this section to see which vendors tend to under-service their product and which will offer quality support.
TEAMDYNAMIX ITSMTOP PRODUCT
Delights 58%
HighlySatisfies 34%
AlmostSatisfies 8%
Disappoints --
88 %Vendor Support
2 Spiceworks IT Help Desk 84%
3 OmniTracker ITSM 81%
4 Cherwell Service Management 80%
5 ServiceNow Service Management 73%
6 Axios ITSM 70%
CATEGORY AVERAGE 79%
-- FootPrints 44%
-- HP IT Service Management 66%
-- IBM Cloud 67%
Ease of Data IntegrationThe ability to integrate with other systems is increasingly important; without this, manual data loading and extraction can be time-consuming andprone to error. Use this section to see which vendors will cause headaches and which will make data integration easy.
SPICEWORKS IT HELPDESKTOP PRODUCT
Delights 24%
HighlySatisfies 65%
AlmostSatisfies 12%
Disappoints --
78 %Ease of DataIntegration
2 Cherwell Service Management 78%
3 OmniTracker ITSM 78%
4 ServiceNow Service Management 73%
5 Axios ITSM 73%
6 TeamDynamix ITSM 65%
CATEGORY AVERAGE 74%
-- FootPrints 58%
-- HP IT Service Management 61%
-- IBM Cloud 67%
10

IT Service Management Category Report
Vendor CapabilitySatisfaction
This section provides detailed information on user satisfaction for each vendor capability regarding their product offering(s). Use these pages to dig deeper into areas ofparticular interest or concern.
Ease of IT AdministrationAdministrative interfaces don’t get the same attention as those built for end users, but they shouldn’t be clunky or unintuitive. Use the data in thissection to determine which vendors make administration easy, so that your IT personnel can resolve issues and perform configurations efficiently andeffectively.
CHERWELL SERVICEMANAGEMENTTOP PRODUCT
Delights 58%
HighlySatisfies 33%
AlmostSatisfies 8%
Disappoints --
88 %Ease of IT
Administration
2 Spiceworks IT Help Desk 82%
3 OmniTracker ITSM 80%
4 TeamDynamix ITSM 77%
5 ServiceNow Service Management 76%
6 Axios ITSM 70%
CATEGORY AVERAGE 79%
-- FootPrints 28%
-- HP IT Service Management 56%
-- IBM Cloud 75%
Ease of CustomizationOut-of-the-box functionality often isn’t enough, especially for niche or industry-specific software, and the reason you’re buying rather than building is tosave time and money in the first place. Don’t get bogged down in a difficult customization; use the data in this section to make sure you can easilyachieve the functionality you need for your particular situation.
CHERWELL SERVICEMANAGEMENTTOP PRODUCT
Delights 55%
HighlySatisfies 35%
AlmostSatisfies 8%
Disappoints 2%
85 %Ease of
Customization
2 OmniTracker ITSM 84%
3 Spiceworks IT Help Desk 76%
4 TeamDynamix ITSM 70%
5 Axios ITSM 69%
6 ServiceNow Service Management 69%
CATEGORY AVERAGE 76%
-- FootPrints 63%
-- HP IT Service Management 47%
-- IBM Cloud 67%
11

IT Service Management Category Report
Vendor CapabilitySatisfaction
This section provides detailed information on user satisfaction for each vendor capability regarding their product offering(s). Use these pages to dig deeper into areas ofparticular interest or concern.
Availability and Quality of TrainingEffective and readily available training enables users to get the most out of the software you’ve chosen. Use this section to make sure your vendor’straining programs and materials measure up.
SPICEWORKS IT HELPDESKTOP PRODUCT
Delights 33%
HighlySatisfies 60%
AlmostSatisfies 7%
Disappoints --
82 %Availability and
Quality of Training
2 OmniTracker ITSM 81%
3 Cherwell Service Management 80%
4 Axios ITSM 76%
5 TeamDynamix ITSM 73%
6 ServiceNow Service Management 73%
CATEGORY AVERAGE 77%
-- FootPrints 70%
-- HP IT Service Management 47%
-- IBM Cloud 79%
Ease of ImplementationChoosing the right software is only the first step. Successfully implementing the new solution is necessary in order to realize its full value and promoteend user adoption. Use the data in this section to determine which software is easy to implement, and which may jeopardize your goals by causingtrouble in this stage.
SPICEWORKS IT HELPDESKTOP PRODUCT
Delights 59%
HighlySatisfies 41%
AlmostSatisfies --
Disappoints --
90 %Ease of
Implementation
2 Cherwell Service Management 84%
3 OmniTracker ITSM 80%
4 TeamDynamix ITSM 74%
5 ServiceNow Service Management 71%
6 Axios ITSM 70%
CATEGORY AVERAGE 78%
-- FootPrints 65%
-- HP IT Service Management 61%
-- IBM Cloud 67%
12

IT Service Management Category Report
Product Feature Summary This page summarizes user satisfaction with a variety of product features. While strong and consistent performanceacross the board is desirable, you may be willing to tolerate low scores on features that don’t impact your primary usecase or core objectives. Use this high-level data to help plan and structure your product evaluation.
= Highest Score
= Lowest Score
VENDOROVERALLFEATURESATISFACTION
BUSINESSAPPLICATIONINTEGRATION
END-USER SELF-SERVE
END-USERSUPPORTSOLUTIONS
INTEGRATEDKNOWLEDGEMANAGEMENT
INTEGRATIONWITH IT TOOLS
MULTI-DEVICECAPABILITY
MULTI-SITEFUNCTIONALITY REPORTING SERVICE
CATALOG
SYSTEMSMANAGEMENTINTEGRATION
TECHNICIANADMINISTRATION
Spiceworks IT Help Desk 78% 75% 75% 75% 72% 78% 81% 86% 83% 75% 81% 81%
Cherwell Service Management 75% 77% 78% 72% 70% 81% 66% 78% 60% 78% 80% 84%
TeamDynamix ITSM 73% 72% 79% 78% 76% 61% 67% 79% 65% 76% 70% 79%
OmniTracker ITSM 73% 74% 70% 74% 67% 73% 70% 72% 64% 79% 78% 81%
Axios ITSM 72% 76% 79% 77% 69% 70% 76% 76% 45% 78% 76% 74%
ServiceNow Service Management 62% 64% 57% 70% 66% 59% 58% 68% 61% 59% 59% 57%
CATEGORY AVERAGE 66% 74% 74% 74% 70% 72% 69% 76% 62% 76% 76% 79%
VENDORS WITH INSUFFICIENT DATA
FootPrints 40% 42% 38% 54% 25% 40% 30% 31% 46% 35% 40% 55%
HP IT Service Management 57% 50% 53% 61% 68% 47% 59% 61% 44% 69% 56% 59%
IBM Cloud 32% 50% 0 50% 50% 0 0 0 50% 50% 50% 50%
BMC Remedy 9 49% 42% 50% 50% 58% 25% 50% 42% 58% 67% 50% 50%
13

IT Service Management Category Report
Product Feature Satisfaction This section provides detailed information on user satisfaction for each product feature.Use these pages to dig deeper into areas of particular interest or concern.
Product FeaturesThis table lists and describes all the features that are evaluated in the IT Service Management software category. For your convenience, thesedescriptions are repeated under the feature subheadings in the subsequent pages.
Business Application Integration APIs available for straightforward integration with multiple business systems such as ERPor CRM.
End-User Self-Serve Intuitive portal designed for end users to create incident tickets, request services, andaccess status and FAQs.
End-User Support Solutions Tools to benefit end users such as single sign-on to self-serve, password reset, screencapture in ticket, dynamic FAQ matching to ticket key words.
Integrated KnowledgeManagement
Database integrated with ticketing system for sharing information between technicians,may be single source or have the ability to federate multiple sources into a single search.
Integration with IT Tools Integration with tools to assist the user which enable connection from within the ticket,capturing information as it is created.
Multi-Device Capability Intuitive interface for any device for any role (end user, technician, approver) providingaccess via web or native mobile app for end users and technicians.
Multi-Site Functionality Central management of dispersed technicians, multiple time zones, operational hours,and automated shift reassignments.
Reporting Straightforward data storage with ability to create any reports easily. Dashboards for anyrole with ability to easily build and modify.
Service Catalog Ability to request products and services through an online catalog that integrates into theticketing system; may include an app store.
Systems ManagementIntegration
APIs available for straightforward integration with multiple systems management toolssuch as network monitoring to create tickets for action items. May include aggregatedalerts, views and dashboards
Technician Administration Easily designed forms, templates, task management, and workflows using codelesscustomization.
Business Application IntegrationAPIs available for straightforward integration with multiple business systems such as ERP or CRM.
CHERWELL SERVICEMANAGEMENTTOP PRODUCT
Delights 28%
HighlySatisfies 56%
AlmostSatisfies 13%
Disappoints 3%
77%Business
ApplicationIntegration
2 Axios ITSM 76%
3 Spiceworks IT Help Desk 75%
4 OmniTracker ITSM 74%
5 TeamDynamix ITSM 72%
6 ServiceNow Service Management 64%
CATEGORY AVERAGE 74%
-- FootPrints 42%
-- HP IT Service Management 50%
-- IBM Cloud 50%
-- BMC Remedy 9 42%
14

IT Service Management Category Report
Product Feature Satisfaction This section provides detailed information on user satisfaction for each product feature.Use these pages to dig deeper into areas of particular interest or concern.
End-User Self-ServeIntuitive portal designed for end users to create incident tickets, request services, and access status and FAQs.
TEAMDYNAMIX ITSMTOP PRODUCT
Delights 40%
HighlySatisfies 43%
AlmostSatisfies 14%
Disappoints 3%
79%End-User Self-
Serve
2 Axios ITSM 79%
3 Cherwell Service Management 78%
4 Spiceworks IT Help Desk 75%
5 OmniTracker ITSM 70%
6 ServiceNow Service Management 57%
CATEGORY AVERAGE 74%
-- FootPrints 38%
-- HP IT Service Management 53%
-- IBM Cloud 0
-- BMC Remedy 9 50%
End-User Support SolutionsTools to benefit end users such as single sign-on to self-serve, password reset, screen capture in ticket, dynamic FAQ matching to ticket key words.
TEAMDYNAMIX ITSMTOP PRODUCT
Delights 31%
HighlySatisfies 54%
AlmostSatisfies 11%
Disappoints 3%
78%End-User Support
Solutions
2 Axios ITSM 77%
3 Spiceworks IT Help Desk 75%
4 OmniTracker ITSM 74%
5 Cherwell Service Management 72%
6 ServiceNow Service Management 70%
CATEGORY AVERAGE 74%
-- FootPrints 54%
-- HP IT Service Management 61%
-- IBM Cloud 50%
-- BMC Remedy 9 50%
15

IT Service Management Category Report
Product Feature Satisfaction This section provides detailed information on user satisfaction for each product feature.Use these pages to dig deeper into areas of particular interest or concern.
Integrated Knowledge ManagementDatabase integrated with ticketing system for sharing information between technicians, may be single source or have the ability to federate multiplesources into a single search.
TEAMDYNAMIX ITSMTOP PRODUCT
Delights 33%
HighlySatisfies 42%
AlmostSatisfies 22%
Disappoints 3%
76%IntegratedKnowledge
Management
2 Spiceworks IT Help Desk 72%
3 Cherwell Service Management 70%
4 Axios ITSM 69%
5 OmniTracker ITSM 67%
6 ServiceNow Service Management 66%
CATEGORY AVERAGE 70%
-- FootPrints 25%
-- HP IT Service Management 68%
-- IBM Cloud 50%
-- BMC Remedy 9 58%
Integration with IT ToolsIntegration with tools to assist the user which enable connection from within the ticket, capturing information as it is created.
CHERWELL SERVICEMANAGEMENTTOP PRODUCT
Delights 38%
HighlySatisfies 47%
AlmostSatisfies 16%
Disappoints --
81%Integration with IT
Tools
2 Spiceworks IT Help Desk 78%
3 OmniTracker ITSM 73%
4 Axios ITSM 70%
5 TeamDynamix ITSM 61%
6 ServiceNow Service Management 59%
CATEGORY AVERAGE 72%
-- FootPrints 40%
-- HP IT Service Management 47%
-- IBM Cloud 0
-- BMC Remedy 9 25%
16

IT Service Management Category Report
Product Feature Satisfaction This section provides detailed information on user satisfaction for each product feature.Use these pages to dig deeper into areas of particular interest or concern.
Multi-Device CapabilityIntuitive interface for any device for any role (end user, technician, approver) providing access via web or native mobile app for end users andtechnicians.
SPICEWORKS IT HELPDESKTOP PRODUCT
Delights 44%
HighlySatisfies 33%
AlmostSatisfies 22%
Disappoints --
81%Multi-Device
Capability
2 Axios ITSM 76%
3 OmniTracker ITSM 70%
4 TeamDynamix ITSM 67%
5 Cherwell Service Management 66%
6 ServiceNow Service Management 58%
CATEGORY AVERAGE 69%
-- FootPrints 30%
-- HP IT Service Management 59%
-- IBM Cloud 0
-- BMC Remedy 9 50%
Multi-Site FunctionalityCentral management of dispersed technicians, multiple time zones, operational hours, and automated shift reassignments.
SPICEWORKS IT HELPDESKTOP PRODUCT
Delights 50%
HighlySatisfies 25%
AlmostSatisfies 13%
Disappoints --
86%Multi-Site
Functionality
2 TeamDynamix ITSM 79%
3 Cherwell Service Management 78%
4 Axios ITSM 76%
5 OmniTracker ITSM 72%
6 ServiceNow Service Management 68%
CATEGORY AVERAGE 76%
-- FootPrints 31%
-- HP IT Service Management 61%
-- IBM Cloud 0
-- BMC Remedy 9 42%
17

IT Service Management Category Report
Product Feature Satisfaction This section provides detailed information on user satisfaction for each product feature.Use these pages to dig deeper into areas of particular interest or concern.
ReportingStraightforward data storage with ability to create any reports easily. Dashboards for any role with ability to easily build and modify.
SPICEWORKS IT HELPDESKTOP PRODUCT
Delights 56%
HighlySatisfies 22%
AlmostSatisfies 22%
Disappoints --
83%Reporting
2 TeamDynamix ITSM 65%
3 OmniTracker ITSM 64%
4 ServiceNow Service Management 61%
5 Cherwell Service Management 60%
6 Axios ITSM 45%
CATEGORY AVERAGE 62%
-- FootPrints 46%
-- HP IT Service Management 44%
-- IBM Cloud 50%
-- BMC Remedy 9 58%
Service CatalogAbility to request products and services through an online catalog that integrates into the ticketing system; may include an app store.
OMNITRACKER ITSMTOP PRODUCT
Delights 33%
HighlySatisfies 48%
AlmostSatisfies 18%
Disappoints --
79%Service Catalog
2 Axios ITSM 78%
3 Cherwell Service Management 78%
4 TeamDynamix ITSM 76%
5 Spiceworks IT Help Desk 75%
6 ServiceNow Service Management 59%
CATEGORY AVERAGE 76%
-- FootPrints 35%
-- HP IT Service Management 69%
-- IBM Cloud 50%
-- BMC Remedy 9 67%
18

IT Service Management Category Report
Product Feature Satisfaction This section provides detailed information on user satisfaction for each product feature.Use these pages to dig deeper into areas of particular interest or concern.
Systems Management IntegrationAPIs available for straightforward integration with multiple systems management tools such as network monitoring to create tickets for action items.May include aggregated alerts, views and dashboards
SPICEWORKS IT HELPDESKTOP PRODUCT
Delights 44%
HighlySatisfies 33%
AlmostSatisfies 22%
Disappoints --
81%Systems
ManagementIntegration
2 Cherwell Service Management 80%
3 OmniTracker ITSM 78%
4 Axios ITSM 76%
5 TeamDynamix ITSM 70%
6 ServiceNow Service Management 59%
CATEGORY AVERAGE 76%
-- FootPrints 40%
-- HP IT Service Management 56%
-- IBM Cloud 50%
-- BMC Remedy 9 50%
Technician AdministrationEasily designed forms, templates, task management, and workflows using codeless customization.
CHERWELL SERVICEMANAGEMENTTOP PRODUCT
Delights 44%
HighlySatisfies 48%
AlmostSatisfies 4%
Disappoints 2%
84%Technician
Administration
2 OmniTracker ITSM 81%
3 Spiceworks IT Help Desk 81%
4 TeamDynamix ITSM 79%
5 Axios ITSM 74%
6 ServiceNow Service Management 57%
CATEGORY AVERAGE 79%
-- FootPrints 55%
-- HP IT Service Management 59%
-- IBM Cloud 50%
-- BMC Remedy 9 50%
19

IT Service Management Category Report
EmotionalFootprintSummary
The Net Emotional Footprint measures high-level user sentiment towards particular product offerings. It aggregates emotional response ratings for various dimensions of the vendor-client relationshipand product effectiveness, creating a powerful indicator of overall user feeling toward the vendor and product. While purchasing decisions shouldn’t be based on emotion, it’s valuable to know what kindof emotional response the vendor you’re considering elicits from their users.
-4 -3 -2 -1NEGATIVE
+1NEUTRAL
+2 +3 +4POSITIVE
EMOTIONAL SPECTRUM SCALE %POSITIVE
%NEGATIVE
EMOTIONALFOOTPRINT- =
-100 to 20 +21 to +40 +41 to +60 +61 to +81 +81 to +100
HELPSINNOVATE 100% RESPECTFUL 100% UNIQUE
FEATURES 100% SECURITYFRUSTRATES 8% OVER PROMISED 6% HARDBALL
TACTICS 3%
RELIABLE 96% RESPECTFUL 96% CONTINUALLYIMPROVING 94% WASTES TIME 10% FRUSTRATING 8% OVER PROMISED 7%
RESPECTFUL 97% EFFECTIVE 96% INTEGRITY 96% VENDOR'SINTEREST FIRST 4% PERFORMANCE
RESTRICTING 4% OVER PROMISED 3%
RESPECTFUL 94% EFFICIENT 94% RELIABLE 94% OVER PROMISED 31% PERFORMANCERESTRICTING 12% RESTRICTS
PRODUCTIVITY 12%
RESPECTFUL 95%CLIENTFRIENDLYPOLICIES
90% EFFICIENT 86% OVER PROMISED 33% FRUSTRATING 23% VENDOR'SINTEREST FIRST 17%
ENABLESPRODUCTIVITY 86% RESPECTFUL 85% INTEGRITY 85% OVER PROMISED 16% COMMODITY
FEATURES 14% GREEDY 11%
VENDOR NET EMOTIONALFOOTPRINT
NET EMOTIONALFOOTPRINT DISTRIBUTION
STRONGESTPOSITIVE EMOTIONS
STRONGESTNEGATIVE EMOTIONS
TeamDynamix ITSM +922% NEGATIVE 94% POSITIVE
Cherwell ITSM +854% NEGATIVE 89% POSITIVE
OmniTracker +852% NEGATIVE 87% POSITIVE
Spiceworks IT Help Desk +763% NEGATIVE 79% POSITIVE
Axios +717% NEGATIVE 78% POSITIVE
ServiceNow ITSM +627% NEGATIVE 69% POSITIVE
SAVES TIME 80% TRUSTWORTHY 75% RELIABLE 71% RESTRICTSPRODUCTIVITY 43% PERFORMANCE
RESTRICTING 43% NEGLECTFUL 40%
CONTINUALLYIMPROVING 86% UNIQUE
FEATURES 86% SECURITYPROTECTS 86% DESPISED 14%
CHARGES FORPRODUCTENHANCEMENTS
14%LEVERAGESINCUMBENTSTATUS
14%
APPRECIATESINCUMBENTSTATUS
100%CLIENTFRIENDLYPOLICIES
88%INCLUDESPRODUCTENHANCEMENTS
86% SECURITYFRUSTRATES 33% COMMODITY
FEATURES 33% FRUSTRATING 33%
VENDORS WITH INSUFFICIENT DATA
FootPrints +1422% NEGATIVE 36% POSITIVE
IBM Cloud +635% NEGATIVE 68% POSITIVE
HP IT Service Management +4622% NEGATIVE 68% POSITIVE
20

IT Service Management Category Report
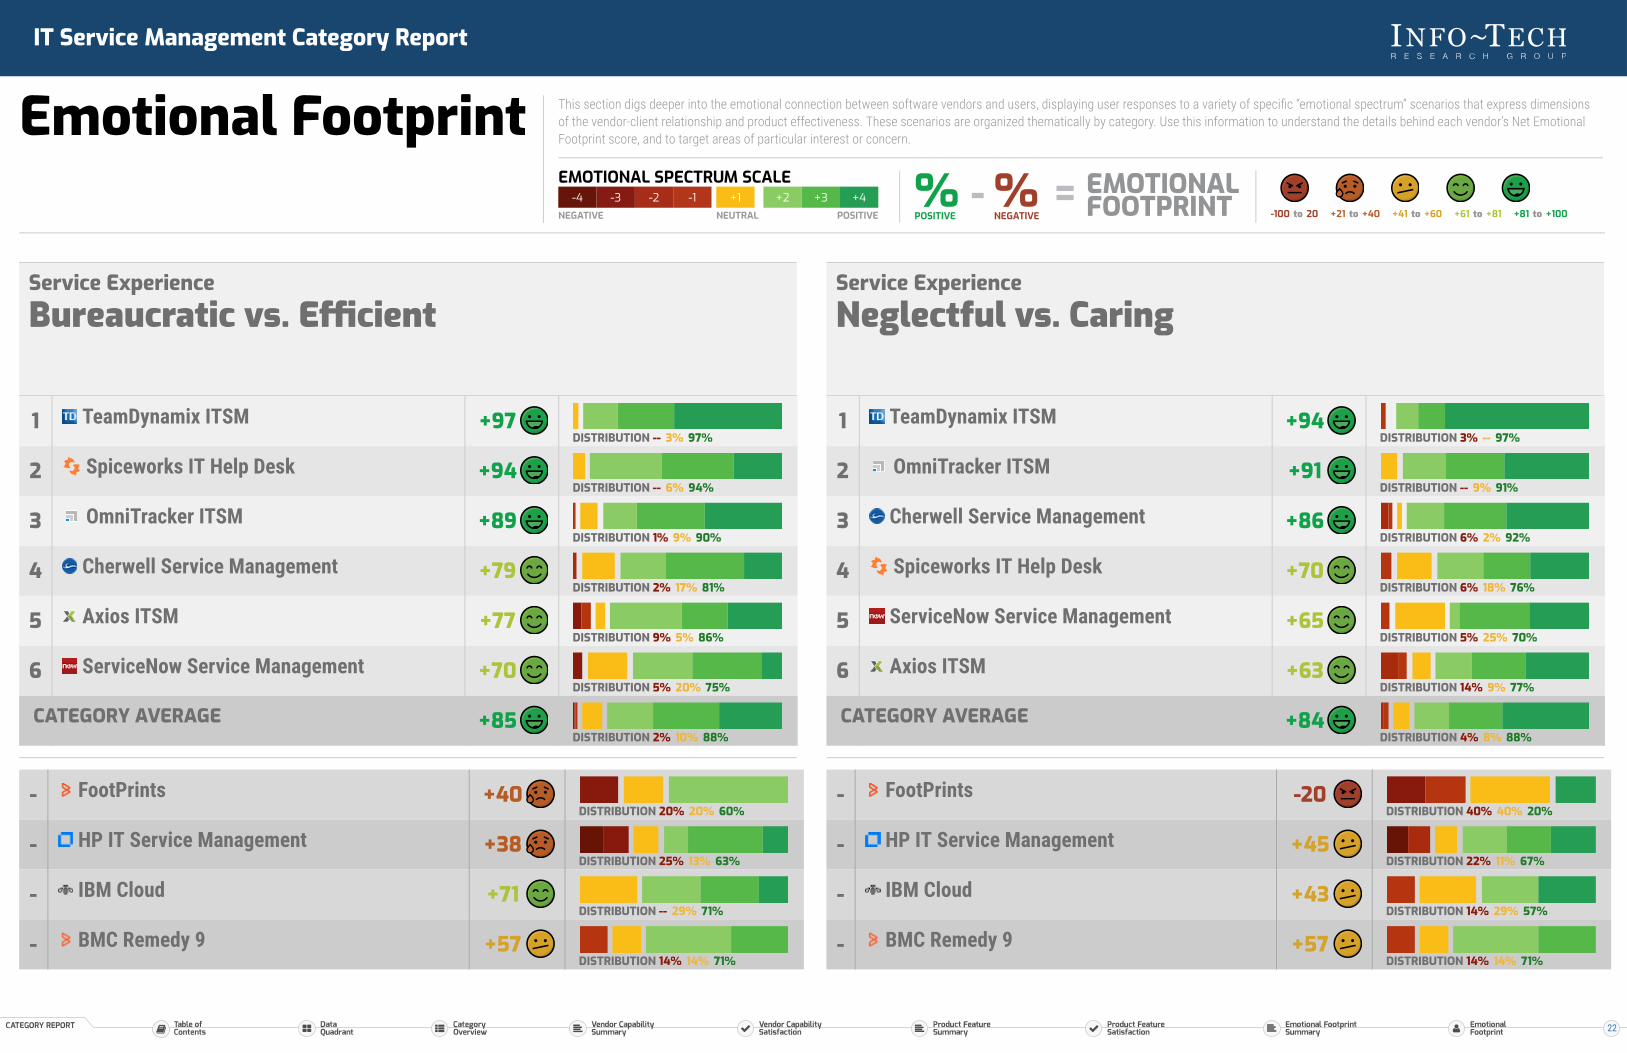
Emotional Footprint This section digs deeper into the emotional connection between software vendors and users, displaying user responses to a variety of specific “emotional spectrum” scenarios that express dimensionsof the vendor-client relationship and product effectiveness. These scenarios are organized thematically by category. Use this information to understand the details behind each vendor’s Net EmotionalFootprint score, and to target areas of particular interest or concern.
-4 -3 -2 -1NEGATIVE
+1NEUTRAL
+2 +3 +4POSITIVE
EMOTIONAL SPECTRUM SCALE %POSITIVE
%NEGATIVE
EMOTIONALFOOTPRINT- =
-100 to 20 +21 to +40 +41 to +60 +61 to +81 +81 to +100
CATEGORY
ServiceExperienceGood service matters. The last thing you need isto be disrespected by your software vendor, or toget bogged down by their ineptitude or neglect.This section displays data related to quality andeffectiveness of service, so you can knowwhether you’ll be treated well before and afteryou’ve made the purchase.
Service ExperienceDisrespectful vs. Respectful
DISTRIBUTION -- -- 100%
DISTRIBUTION -- 3% 97%
DISTRIBUTION 2% 2% 96%
DISTRIBUTION -- 6% 94%
DISTRIBUTION 5% -- 95%
DISTRIBUTION 5% 10% 85%
DISTRIBUTION 1% 3% 96%
1 TeamDynamix ITSM +100
2 OmniTracker ITSM +97
3 Cherwell Service Management +94
4 Spiceworks IT Help Desk +94
5 Axios ITSM +90
6 ServiceNow Service Management +80
CATEGORY AVERAGE +94
DISTRIBUTION -- 60% 40%
DISTRIBUTION 13% 13% 75%
DISTRIBUTION -- 29% 71%
DISTRIBUTION 14% 14% 71%
- FootPrints +40
- HP IT Service Management +62
- IBM Cloud +71
- BMC Remedy 9 +57
21
IT Service Management Category Report
Emotional Footprint This section digs deeper into the emotional connection between software vendors and users, displaying user responses to a variety of specific “emotional spectrum” scenarios that express dimensionsof the vendor-client relationship and product effectiveness. These scenarios are organized thematically by category. Use this information to understand the details behind each vendor’s Net EmotionalFootprint score, and to target areas of particular interest or concern.
-4 -3 -2 -1NEGATIVE
+1NEUTRAL
+2 +3 +4POSITIVE
EMOTIONAL SPECTRUM SCALE %POSITIVE
%NEGATIVE
EMOTIONALFOOTPRINT- =
-100 to 20 +21 to +40 +41 to +60 +61 to +81 +81 to +100
Service ExperienceBureaucratic vs. Efficient
DISTRIBUTION -- 3% 97%
DISTRIBUTION -- 6% 94%
DISTRIBUTION 1% 9% 90%
DISTRIBUTION 2% 17% 81%
DISTRIBUTION 9% 5% 86%
DISTRIBUTION 5% 20% 75%
DISTRIBUTION 2% 10% 88%
1 TeamDynamix ITSM +97
2 Spiceworks IT Help Desk +94
3 OmniTracker ITSM +89
4 Cherwell Service Management +79
5 Axios ITSM +77
6 ServiceNow Service Management +70
CATEGORY AVERAGE +85
DISTRIBUTION 20% 20% 60%
DISTRIBUTION 25% 13% 63%
DISTRIBUTION -- 29% 71%
DISTRIBUTION 14% 14% 71%
- FootPrints +40
- HP IT Service Management +38
- IBM Cloud +71
- BMC Remedy 9 +57
Service ExperienceNeglectful vs. Caring
DISTRIBUTION 3% -- 97%
DISTRIBUTION -- 9% 91%
DISTRIBUTION 6% 2% 92%
DISTRIBUTION 6% 18% 76%
DISTRIBUTION 5% 25% 70%
DISTRIBUTION 14% 9% 77%
DISTRIBUTION 4% 8% 88%
1 TeamDynamix ITSM +94
2 OmniTracker ITSM +91
3 Cherwell Service Management +86
4 Spiceworks IT Help Desk +70
5 ServiceNow Service Management +65
6 Axios ITSM +63
CATEGORY AVERAGE +84
DISTRIBUTION 40% 40% 20%
DISTRIBUTION 22% 11% 67%
DISTRIBUTION 14% 29% 57%
DISTRIBUTION 14% 14% 71%
- FootPrints -20
- HP IT Service Management +45
- IBM Cloud +43
- BMC Remedy 9 +57
22

IT Service Management Category Report
Emotional Footprint This section digs deeper into the emotional connection between software vendors and users, displaying user responses to a variety of specific “emotional spectrum” scenarios that express dimensionsof the vendor-client relationship and product effectiveness. These scenarios are organized thematically by category. Use this information to understand the details behind each vendor’s Net EmotionalFootprint score, and to target areas of particular interest or concern.
-4 -3 -2 -1NEGATIVE
+1NEUTRAL
+2 +3 +4POSITIVE
EMOTIONAL SPECTRUM SCALE %POSITIVE
%NEGATIVE
EMOTIONALFOOTPRINT- =
-100 to 20 +21 to +40 +41 to +60 +61 to +81 +81 to +100
Service ExperienceFrustrating vs. Effective
DISTRIBUTION -- 3% 97%
DISTRIBUTION -- 4% 96%
DISTRIBUTION -- 12% 88%
DISTRIBUTION 8% 13% 79%
DISTRIBUTION 5% 35% 60%
DISTRIBUTION 23% 18% 59%
DISTRIBUTION 5% 11% 85%
1 TeamDynamix ITSM +97
2 OmniTracker ITSM +96
3 Spiceworks IT Help Desk +88
4 Cherwell Service Management +71
5 ServiceNow Service Management +55
6 Axios ITSM +36
CATEGORY AVERAGE +80
DISTRIBUTION 40% 20% 40%
DISTRIBUTION 33% 22% 44%
DISTRIBUTION -- 29% 71%
DISTRIBUTION 43% -- 57%
- FootPrints +0
- HP IT Service Management +11
- IBM Cloud +71
- BMC Remedy 9 +14
Service ExperienceWastes Time vs. Saves Time
DISTRIBUTION 3% -- 97%
DISTRIBUTION -- 9% 91%
DISTRIBUTION -- 12% 88%
DISTRIBUTION 10% 6% 83%
DISTRIBUTION 10% 15% 75%
DISTRIBUTION 14% 18% 68%
DISTRIBUTION 5% 8% 86%
1 TeamDynamix ITSM +94
2 OmniTracker ITSM +91
3 Spiceworks IT Help Desk +88
4 Cherwell Service Management +73
5 ServiceNow Service Management +65
6 Axios ITSM +54
CATEGORY AVERAGE +81
DISTRIBUTION -- 20% 80%
DISTRIBUTION 33% -- 67%
DISTRIBUTION 14% 29% 57%
DISTRIBUTION 14% 29% 57%
- FootPrints +80
- HP IT Service Management +34
- IBM Cloud +43
- BMC Remedy 9 +43
23

IT Service Management Category Report
Emotional Footprint This section digs deeper into the emotional connection between software vendors and users, displaying user responses to a variety of specific “emotional spectrum” scenarios that express dimensionsof the vendor-client relationship and product effectiveness. These scenarios are organized thematically by category. Use this information to understand the details behind each vendor’s Net EmotionalFootprint score, and to target areas of particular interest or concern.
-4 -3 -2 -1NEGATIVE
+1NEUTRAL
+2 +3 +4POSITIVE
EMOTIONAL SPECTRUM SCALE %POSITIVE
%NEGATIVE
EMOTIONALFOOTPRINT- =
-100 to 20 +21 to +40 +41 to +60 +61 to +81 +81 to +100
CATEGORY
ConflictResolutionDisagreements are inevitable, but knowing yourvendor will handle them reasonably, fairly, andamiably can give you peace of mind. Use thedata in this section to understand which vendorswill behave professionally when conflict arises.
Conflict ResolutionLack Of Integrity vs. Integrity
DISTRIBUTION -- -- 100%
DISTRIBUTION -- 4% 96%
DISTRIBUTION 2% 6% 91%
DISTRIBUTION -- 14% 86%
DISTRIBUTION 5% 10% 85%
DISTRIBUTION 5% 14% 81%
DISTRIBUTION 1% 6% 92%
1 TeamDynamix ITSM +100
2 OmniTracker ITSM +96
3 Cherwell Service Management +89
4 Spiceworks IT Help Desk +86
5 ServiceNow Service Management +80
6 Axios ITSM +76
CATEGORY AVERAGE +91
DISTRIBUTION -- 50% 50%
DISTRIBUTION 25% 13% 63%
DISTRIBUTION -- 14% 86%
DISTRIBUTION 20% -- 80%
- FootPrints +50
- HP IT Service Management +38
- IBM Cloud +86
- BMC Remedy 9 +60
24

IT Service Management Category Report
Emotional Footprint This section digs deeper into the emotional connection between software vendors and users, displaying user responses to a variety of specific “emotional spectrum” scenarios that express dimensionsof the vendor-client relationship and product effectiveness. These scenarios are organized thematically by category. Use this information to understand the details behind each vendor’s Net EmotionalFootprint score, and to target areas of particular interest or concern.
-4 -3 -2 -1NEGATIVE
+1NEUTRAL
+2 +3 +4POSITIVE
EMOTIONAL SPECTRUM SCALE %POSITIVE
%NEGATIVE
EMOTIONALFOOTPRINT- =
-100 to 20 +21 to +40 +41 to +60 +61 to +81 +81 to +100
Conflict ResolutionVendor Friendly Policies vs. Client FriendlyPolicies
DISTRIBUTION -- 9% 91%
DISTRIBUTION 2% 9% 89%
DISTRIBUTION 5% 5% 90%
DISTRIBUTION 3% 15% 82%
DISTRIBUTION 7% 14% 79%
DISTRIBUTION 10% 15% 75%
DISTRIBUTION 3% 11% 85%
1 TeamDynamix ITSM +91
2 Cherwell Service Management +87
3 Axios ITSM +85
4 OmniTracker ITSM +79
5 Spiceworks IT Help Desk +72
6 ServiceNow Service Management +65
CATEGORY AVERAGE +82
DISTRIBUTION 25% 25% 50%
DISTRIBUTION 13% -- 88%
DISTRIBUTION -- 29% 71%
DISTRIBUTION 20% 20% 60%
- FootPrints +25
- HP IT Service Management +75
- IBM Cloud +71
- BMC Remedy 9 +40
Conflict ResolutionSelfish vs. Altruistic
DISTRIBUTION 3% 6% 91%
DISTRIBUTION -- 13% 87%
DISTRIBUTION 1% 15% 84%
DISTRIBUTION -- 19% 81%
DISTRIBUTION 10% 15% 75%
DISTRIBUTION 7% 29% 64%
DISTRIBUTION 2% 14% 83%
1 TeamDynamix ITSM +88
2 Cherwell Service Management +87
3 OmniTracker ITSM +83
4 Axios ITSM +81
5 ServiceNow Service Management +65
6 Spiceworks IT Help Desk +57
CATEGORY AVERAGE +81
DISTRIBUTION 25% 25% 50%
DISTRIBUTION -- 25% 75%
DISTRIBUTION -- 43% 57%
DISTRIBUTION 20% 20% 60%
- FootPrints +25
- HP IT Service Management +75
- IBM Cloud +57
- BMC Remedy 9 +40
25

IT Service Management Category Report
Emotional Footprint This section digs deeper into the emotional connection between software vendors and users, displaying user responses to a variety of specific “emotional spectrum” scenarios that express dimensionsof the vendor-client relationship and product effectiveness. These scenarios are organized thematically by category. Use this information to understand the details behind each vendor’s Net EmotionalFootprint score, and to target areas of particular interest or concern.
-4 -3 -2 -1NEGATIVE
+1NEUTRAL
+2 +3 +4POSITIVE
EMOTIONAL SPECTRUM SCALE %POSITIVE
%NEGATIVE
EMOTIONALFOOTPRINT- =
-100 to 20 +21 to +40 +41 to +60 +61 to +81 +81 to +100
Conflict ResolutionBig Fat Liars vs. Trustworthy
DISTRIBUTION -- 7% 93%
DISTRIBUTION 3% 3% 94%
DISTRIBUTION -- 14% 86%
DISTRIBUTION 4% 6% 89%
DISTRIBUTION 7% 21% 71%
DISTRIBUTION 10% 30% 60%
DISTRIBUTION 3% 10% 87%
1 OmniTracker ITSM +93
2 TeamDynamix ITSM +91
3 Axios ITSM +86
4 Cherwell Service Management +85
5 Spiceworks IT Help Desk +64
6 ServiceNow Service Management +50
CATEGORY AVERAGE +84
DISTRIBUTION -- 25% 75%
DISTRIBUTION 13% 25% 63%
DISTRIBUTION 14% -- 86%
DISTRIBUTION 20% -- 80%
- FootPrints +75
- HP IT Service Management +50
- IBM Cloud +72
- BMC Remedy 9 +60
Conflict ResolutionUnfair vs. Fair
DISTRIBUTION 3% -- 97%
DISTRIBUTION -- 6% 94%
DISTRIBUTION -- 9% 91%
DISTRIBUTION -- 14% 86%
DISTRIBUTION 7% 21% 71%
DISTRIBUTION 10% 35% 55%
DISTRIBUTION 2% 10% 88%
1 TeamDynamix ITSM +94
2 OmniTracker ITSM +94
3 Cherwell Service Management +91
4 Axios ITSM +86
5 Spiceworks IT Help Desk +64
6 ServiceNow Service Management +45
CATEGORY AVERAGE +86
DISTRIBUTION 25% 25% 50%
DISTRIBUTION 13% 25% 63%
DISTRIBUTION -- 14% 86%
DISTRIBUTION 20% -- 80%
- FootPrints +25
- HP IT Service Management +50
- IBM Cloud +86
- BMC Remedy 9 +60
26

IT Service Management Category Report
Emotional Footprint This section digs deeper into the emotional connection between software vendors and users, displaying user responses to a variety of specific “emotional spectrum” scenarios that express dimensionsof the vendor-client relationship and product effectiveness. These scenarios are organized thematically by category. Use this information to understand the details behind each vendor’s Net EmotionalFootprint score, and to target areas of particular interest or concern.
-4 -3 -2 -1NEGATIVE
+1NEUTRAL
+2 +3 +4POSITIVE
EMOTIONAL SPECTRUM SCALE %POSITIVE
%NEGATIVE
EMOTIONALFOOTPRINT- =
-100 to 20 +21 to +40 +41 to +60 +61 to +81 +81 to +100
CATEGORY
Negotiation andContractNegotiation doesn’t have to be adversarial. Bothparties are always looking to get the best deal,but finding a vendor who will work with yourather than against makes it more likely you’llboth be happy with the results. Use the data inthis section to determine which vendors willnegotiate pleasantly and in good faith.
Negotiation and ContractGreedy vs. Generous
DISTRIBUTION 3% 6% 90%
DISTRIBUTION -- 15% 85%
DISTRIBUTION -- 17% 83%
DISTRIBUTION 5% 11% 84%
DISTRIBUTION 3% 15% 82%
DISTRIBUTION 11% 32% 58%
DISTRIBUTION 4% 15% 82%
1 TeamDynamix ITSM +87
2 Spiceworks IT Help Desk +85
3 Axios ITSM +83
4 Cherwell Service Management +79
5 OmniTracker ITSM +79
6 ServiceNow Service Management +47
CATEGORY AVERAGE +78
DISTRIBUTION 20% 40% 40%
DISTRIBUTION -- 43% 57%
DISTRIBUTION 14% 14% 71%
DISTRIBUTION 20% 20% 60%
- FootPrints +20
- IBM Cloud +57
- HP IT Service Management +57
- BMC Remedy 9 +40
27

IT Service Management Category Report
Emotional Footprint This section digs deeper into the emotional connection between software vendors and users, displaying user responses to a variety of specific “emotional spectrum” scenarios that express dimensionsof the vendor-client relationship and product effectiveness. These scenarios are organized thematically by category. Use this information to understand the details behind each vendor’s Net EmotionalFootprint score, and to target areas of particular interest or concern.
-4 -3 -2 -1NEGATIVE
+1NEUTRAL
+2 +3 +4POSITIVE
EMOTIONAL SPECTRUM SCALE %POSITIVE
%NEGATIVE
EMOTIONALFOOTPRINT- =
-100 to 20 +21 to +40 +41 to +60 +61 to +81 +81 to +100
Negotiation and ContractDeceptive vs. Transparent
DISTRIBUTION 2% 5% 93%
DISTRIBUTION 3% 6% 90%
DISTRIBUTION 3% 12% 85%
DISTRIBUTION 8% 8% 85%
DISTRIBUTION -- 28% 72%
DISTRIBUTION 5% 37% 58%
DISTRIBUTION 3% 13% 84%
1 Cherwell Service Management +91
2 TeamDynamix ITSM +87
3 OmniTracker ITSM +82
4 Spiceworks IT Help Desk +77
5 Axios ITSM +72
6 ServiceNow Service Management +53
CATEGORY AVERAGE +81
DISTRIBUTION 20% 60% 20%
DISTRIBUTION 29% -- 71%
DISTRIBUTION -- 14% 86%
DISTRIBUTION 40% 20% 40%
- FootPrints +0
- HP IT Service Management +42
- IBM Cloud +86
- BMC Remedy 9 +0
Negotiation and ContractOver Promised vs. Under Promised
DISTRIBUTION 3% 25% 72%
DISTRIBUTION 6% 29% 65%
DISTRIBUTION 7% 30% 63%
DISTRIBUTION 33% 17% 50%
DISTRIBUTION 16% 53% 32%
DISTRIBUTION 31% 38% 31%
DISTRIBUTION 10% 30% 60%
1 OmniTracker ITSM +69
2 TeamDynamix ITSM +59
3 Cherwell Service Management +56
4 Axios ITSM +17
5 ServiceNow Service Management +16
6 Spiceworks IT Help Desk +0
CATEGORY AVERAGE +49
DISTRIBUTION 20% 40% 40%
DISTRIBUTION 14% 43% 43%
DISTRIBUTION 29% 14% 57%
DISTRIBUTION 60% 20% 20%
- FootPrints +20
- IBM Cloud +29
- HP IT Service Management +28
- BMC Remedy 9 -40
28
IT Service Management Category Report
Emotional Footprint This section digs deeper into the emotional connection between software vendors and users, displaying user responses to a variety of specific “emotional spectrum” scenarios that express dimensionsof the vendor-client relationship and product effectiveness. These scenarios are organized thematically by category. Use this information to understand the details behind each vendor’s Net EmotionalFootprint score, and to target areas of particular interest or concern.
-4 -3 -2 -1NEGATIVE
+1NEUTRAL
+2 +3 +4POSITIVE
EMOTIONAL SPECTRUM SCALE %POSITIVE
%NEGATIVE
EMOTIONALFOOTPRINT- =
-100 to 20 +21 to +40 +41 to +60 +61 to +81 +81 to +100
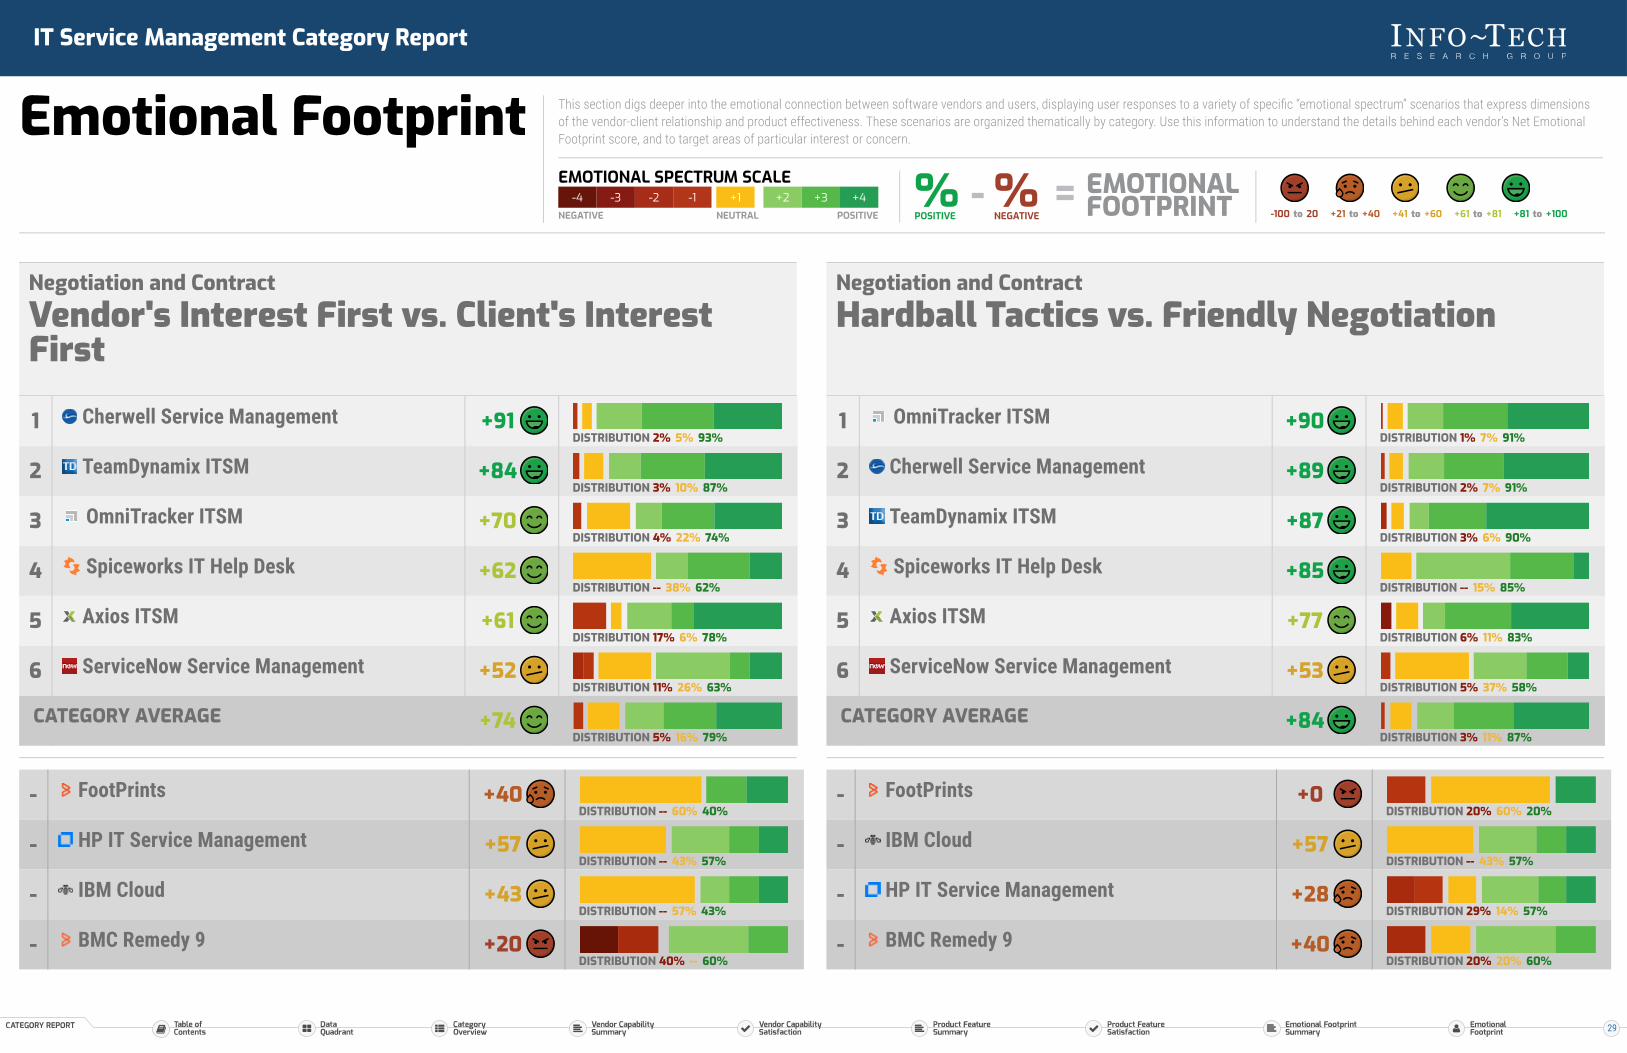
Negotiation and ContractVendor's Interest First vs. Client's InterestFirst
DISTRIBUTION 2% 5% 93%
DISTRIBUTION 3% 10% 87%
DISTRIBUTION 4% 22% 74%
DISTRIBUTION -- 38% 62%
DISTRIBUTION 17% 6% 78%
DISTRIBUTION 11% 26% 63%
DISTRIBUTION 5% 16% 79%
1 Cherwell Service Management +91
2 TeamDynamix ITSM +84
3 OmniTracker ITSM +70
4 Spiceworks IT Help Desk +62
5 Axios ITSM +61
6 ServiceNow Service Management +52
CATEGORY AVERAGE +74
DISTRIBUTION -- 60% 40%
DISTRIBUTION -- 43% 57%
DISTRIBUTION -- 57% 43%
DISTRIBUTION 40% -- 60%
- FootPrints +40
- HP IT Service Management +57
- IBM Cloud +43
- BMC Remedy 9 +20
Negotiation and ContractHardball Tactics vs. Friendly Negotiation
DISTRIBUTION 1% 7% 91%
DISTRIBUTION 2% 7% 91%
DISTRIBUTION 3% 6% 90%
DISTRIBUTION -- 15% 85%
DISTRIBUTION 6% 11% 83%
DISTRIBUTION 5% 37% 58%
DISTRIBUTION 3% 11% 87%
1 OmniTracker ITSM +90
2 Cherwell Service Management +89
3 TeamDynamix ITSM +87
4 Spiceworks IT Help Desk +85
5 Axios ITSM +77
6 ServiceNow Service Management +53
CATEGORY AVERAGE +84
DISTRIBUTION 20% 60% 20%
DISTRIBUTION -- 43% 57%
DISTRIBUTION 29% 14% 57%
DISTRIBUTION 20% 20% 60%
- FootPrints +0
- IBM Cloud +57
- HP IT Service Management +28
- BMC Remedy 9 +40
29

IT Service Management Category Report
Emotional Footprint This section digs deeper into the emotional connection between software vendors and users, displaying user responses to a variety of specific “emotional spectrum” scenarios that express dimensionsof the vendor-client relationship and product effectiveness. These scenarios are organized thematically by category. Use this information to understand the details behind each vendor’s Net EmotionalFootprint score, and to target areas of particular interest or concern.
-4 -3 -2 -1NEGATIVE
+1NEUTRAL
+2 +3 +4POSITIVE
EMOTIONAL SPECTRUM SCALE %POSITIVE
%NEGATIVE
EMOTIONALFOOTPRINT- =
-100 to 20 +21 to +40 +41 to +60 +61 to +81 +81 to +100
CATEGORY
Strategy andInnovationYour vendor’s attitude toward innovation isimportant; if they aren’t at least keeping pacewith market directions and trends, they certainlywon’t be enabling you to get ahead. Use the datain this section to gauge whether your vendorappreciates the need to innovate and the extentto which they’ll support you to do the same.
Strategy and InnovationRoadblock To Innovation vs. Helps Innovate
DISTRIBUTION -- -- 100%
DISTRIBUTION -- 6% 94%
DISTRIBUTION 2% 6% 92%
DISTRIBUTION -- 19% 81%
DISTRIBUTION 3% 14% 83%
DISTRIBUTION 4% 26% 70%
DISTRIBUTION 2% 11% 87%
1 TeamDynamix ITSM +100
2 Spiceworks IT Help Desk +94
3 Cherwell Service Management +90
4 ServiceNow Service Management +81
5 OmniTracker ITSM +80
6 Axios ITSM +66
CATEGORY AVERAGE +85
DISTRIBUTION 29% 43% 29%
DISTRIBUTION 25% -- 75%
DISTRIBUTION -- 43% 57%
DISTRIBUTION 43% -- 57%
- FootPrints +0
- HP IT Service Management +50
- IBM Cloud +57
- BMC Remedy 9 +14
30

IT Service Management Category Report
Emotional Footprint This section digs deeper into the emotional connection between software vendors and users, displaying user responses to a variety of specific “emotional spectrum” scenarios that express dimensionsof the vendor-client relationship and product effectiveness. These scenarios are organized thematically by category. Use this information to understand the details behind each vendor’s Net EmotionalFootprint score, and to target areas of particular interest or concern.
-4 -3 -2 -1NEGATIVE
+1NEUTRAL
+2 +3 +4POSITIVE
EMOTIONAL SPECTRUM SCALE %POSITIVE
%NEGATIVE
EMOTIONALFOOTPRINT- =
-100 to 20 +21 to +40 +41 to +60 +61 to +81 +81 to +100
Strategy and InnovationStagnant vs. Continually Improving
DISTRIBUTION 3% -- 97%
DISTRIBUTION 4% 2% 94%
DISTRIBUTION 3% 13% 85%
DISTRIBUTION -- 25% 75%
DISTRIBUTION 4% 17% 78%
DISTRIBUTION -- 33% 67%
DISTRIBUTION 3% 12% 86%
1 TeamDynamix ITSM +94
2 Cherwell Service Management +90
3 OmniTracker ITSM +82
4 Spiceworks IT Help Desk +75
5 Axios ITSM +74
6 ServiceNow Service Management +67
CATEGORY AVERAGE +83
DISTRIBUTION 14% 57% 29%
DISTRIBUTION -- 14% 86%
DISTRIBUTION 29% 14% 57%
DISTRIBUTION 43% 14% 43%
- FootPrints +15
- IBM Cloud +86
- HP IT Service Management +28
- BMC Remedy 9 +0
Strategy and InnovationCharges For Product Enhancements vs.Includes Product Enhancements
DISTRIBUTION 3% -- 97%
DISTRIBUTION 4% 4% 92%
DISTRIBUTION 1% 13% 86%
DISTRIBUTION -- 19% 81%
DISTRIBUTION 9% 9% 83%
DISTRIBUTION 10% 19% 71%
DISTRIBUTION 4% 9% 87%
1 TeamDynamix ITSM +94
2 Cherwell Service Management +88
3 OmniTracker ITSM +85
4 Spiceworks IT Help Desk +81
5 Axios ITSM +74
6 ServiceNow Service Management +61
CATEGORY AVERAGE +83
DISTRIBUTION 14% 71% 14%
DISTRIBUTION 14% 14% 71%
DISTRIBUTION -- 14% 86%
DISTRIBUTION 14% 57% 29%
- FootPrints +0
- IBM Cloud +57
- HP IT Service Management +86
- BMC Remedy 9 +15
31

IT Service Management Category Report
Emotional Footprint This section digs deeper into the emotional connection between software vendors and users, displaying user responses to a variety of specific “emotional spectrum” scenarios that express dimensionsof the vendor-client relationship and product effectiveness. These scenarios are organized thematically by category. Use this information to understand the details behind each vendor’s Net EmotionalFootprint score, and to target areas of particular interest or concern.
-4 -3 -2 -1NEGATIVE
+1NEUTRAL
+2 +3 +4POSITIVE
EMOTIONAL SPECTRUM SCALE %POSITIVE
%NEGATIVE
EMOTIONALFOOTPRINT- =
-100 to 20 +21 to +40 +41 to +60 +61 to +81 +81 to +100
Strategy and InnovationLeverages Incumbent Status vs. AppreciatesIncumbent Status
DISTRIBUTION -- 3% 97%
DISTRIBUTION 6% 6% 88%
DISTRIBUTION 3% 14% 83%
DISTRIBUTION -- 22% 78%
DISTRIBUTION -- 25% 75%
DISTRIBUTION 10% 29% 62%
DISTRIBUTION 3% 13% 83%
1 TeamDynamix ITSM +97
2 Cherwell Service Management +82
3 OmniTracker ITSM +80
4 Axios ITSM +78
5 Spiceworks IT Help Desk +75
6 ServiceNow Service Management +52
CATEGORY AVERAGE +80
DISTRIBUTION 29% 57% 14%
DISTRIBUTION -- -- 100%
DISTRIBUTION 14% 29% 57%
DISTRIBUTION -- 57% 43%
- FootPrints -15
- HP IT Service Management +100
- IBM Cloud +43
- BMC Remedy 9 +43
Strategy and InnovationDespised vs. Inspiring
DISTRIBUTION 3% -- 97%
DISTRIBUTION -- 14% 86%
DISTRIBUTION 4% 6% 90%
DISTRIBUTION -- 25% 75%
DISTRIBUTION 5% 19% 76%
DISTRIBUTION 9% 26% 65%
DISTRIBUTION 3% 12% 85%
1 TeamDynamix ITSM +94
2 OmniTracker ITSM +86
3 Cherwell Service Management +86
4 Spiceworks IT Help Desk +75
5 ServiceNow Service Management +71
6 Axios ITSM +56
CATEGORY AVERAGE +82
DISTRIBUTION 29% 43% 29%
DISTRIBUTION 14% 14% 71%
DISTRIBUTION 14% 14% 71%
DISTRIBUTION 43% 14% 43%
- FootPrints +0
- HP IT Service Management +57
- IBM Cloud +57
- BMC Remedy 9 +0
32

IT Service Management Category Report
Emotional Footprint This section digs deeper into the emotional connection between software vendors and users, displaying user responses to a variety of specific “emotional spectrum” scenarios that express dimensionsof the vendor-client relationship and product effectiveness. These scenarios are organized thematically by category. Use this information to understand the details behind each vendor’s Net EmotionalFootprint score, and to target areas of particular interest or concern.
-4 -3 -2 -1NEGATIVE
+1NEUTRAL
+2 +3 +4POSITIVE
EMOTIONAL SPECTRUM SCALE %POSITIVE
%NEGATIVE
EMOTIONALFOOTPRINT- =
-100 to 20 +21 to +40 +41 to +60 +61 to +81 +81 to +100
CATEGORY
Product ImpactSoftware needs to reliably enable yourperformance and productivity. Use the data inthis section to see which vendors will propel youforward and which will be deadweight you’ll needto carry.
Product ImpactUnreliable vs. Reliable
DISTRIBUTION -- -- 100%
DISTRIBUTION -- 6% 94%
DISTRIBUTION 4% -- 96%
DISTRIBUTION 1% 7% 92%
DISTRIBUTION 5% 9% 86%
DISTRIBUTION 5% 18% 77%
DISTRIBUTION 2% 6% 92%
1 TeamDynamix ITSM +100
2 Spiceworks IT Help Desk +94
3 Cherwell Service Management +92
4 OmniTracker ITSM +91
5 Axios ITSM +81
6 ServiceNow Service Management +72
CATEGORY AVERAGE +90
DISTRIBUTION -- 29% 71%
DISTRIBUTION 33% -- 67%
DISTRIBUTION -- 29% 71%
DISTRIBUTION 14% 29% 57%
- FootPrints +71
- HP IT Service Management +34
- IBM Cloud +71
- BMC Remedy 9 +43
33

IT Service Management Category Report
Emotional Footprint This section digs deeper into the emotional connection between software vendors and users, displaying user responses to a variety of specific “emotional spectrum” scenarios that express dimensionsof the vendor-client relationship and product effectiveness. These scenarios are organized thematically by category. Use this information to understand the details behind each vendor’s Net EmotionalFootprint score, and to target areas of particular interest or concern.
-4 -3 -2 -1NEGATIVE
+1NEUTRAL
+2 +3 +4POSITIVE
EMOTIONAL SPECTRUM SCALE %POSITIVE
%NEGATIVE
EMOTIONALFOOTPRINT- =
-100 to 20 +21 to +40 +41 to +60 +61 to +81 +81 to +100
Product ImpactRestricts Productivity vs. Enables Productivity
DISTRIBUTION 3% -- 97%
DISTRIBUTION 1% 6% 93%
DISTRIBUTION 4% 2% 94%
DISTRIBUTION -- 14% 86%
DISTRIBUTION -- 23% 77%
DISTRIBUTION 12% 6% 82%
DISTRIBUTION 3% 6% 91%
1 TeamDynamix ITSM +94
2 OmniTracker ITSM +92
3 Cherwell Service Management +90
4 ServiceNow Service Management +86
5 Axios ITSM +77
6 Spiceworks IT Help Desk +70
CATEGORY AVERAGE +88
DISTRIBUTION 43% 29% 29%
DISTRIBUTION 33% -- 67%
DISTRIBUTION -- 29% 71%
DISTRIBUTION 29% 14% 57%
- FootPrints -14
- HP IT Service Management +34
- IBM Cloud +71
- BMC Remedy 9 +28
Product ImpactPerformance Restricting vs. PerformanceEnhancing
DISTRIBUTION 3% -- 97%
DISTRIBUTION 4% 6% 90%
DISTRIBUTION 4% 8% 88%
DISTRIBUTION -- 18% 82%
DISTRIBUTION 5% 18% 77%
DISTRIBUTION 12% 18% 71%
DISTRIBUTION 4% 9% 87%
1 TeamDynamix ITSM +94
2 Cherwell Service Management +86
3 OmniTracker ITSM +84
4 ServiceNow Service Management +82
5 Axios ITSM +72
6 Spiceworks IT Help Desk +59
CATEGORY AVERAGE +83
DISTRIBUTION 43% 57% --
DISTRIBUTION 33% -- 67%
DISTRIBUTION -- 14% 86%
DISTRIBUTION 43% -- 57%
- FootPrints -43
- HP IT Service Management +34
- IBM Cloud +86
- BMC Remedy 9 +14
34

IT Service Management Category Report
Emotional Footprint This section digs deeper into the emotional connection between software vendors and users, displaying user responses to a variety of specific “emotional spectrum” scenarios that express dimensionsof the vendor-client relationship and product effectiveness. These scenarios are organized thematically by category. Use this information to understand the details behind each vendor’s Net EmotionalFootprint score, and to target areas of particular interest or concern.
-4 -3 -2 -1NEGATIVE
+1NEUTRAL
+2 +3 +4POSITIVE
EMOTIONAL SPECTRUM SCALE %POSITIVE
%NEGATIVE
EMOTIONALFOOTPRINT- =
-100 to 20 +21 to +40 +41 to +60 +61 to +81 +81 to +100
Product ImpactCommodity Features vs. Unique Features
DISTRIBUTION -- -- 100%
DISTRIBUTION 4% 6% 90%
DISTRIBUTION 3% 14% 83%
DISTRIBUTION -- 24% 76%
DISTRIBUTION 9% 14% 77%
DISTRIBUTION 14% 14% 73%
DISTRIBUTION 4% 11% 85%
1 TeamDynamix ITSM +100
2 Cherwell Service Management +86
3 OmniTracker ITSM +80
4 Spiceworks IT Help Desk +76
5 Axios ITSM +68
6 ServiceNow Service Management +59
CATEGORY AVERAGE +81
DISTRIBUTION 29% 43% 29%
DISTRIBUTION 33% -- 67%
DISTRIBUTION -- 14% 86%
DISTRIBUTION 43% 29% 29%
- FootPrints +0
- HP IT Service Management +34
- IBM Cloud +86
- BMC Remedy 9 -14
Product ImpactSecurity Frustrates vs. Security Protects
DISTRIBUTION 1% 14% 85%
DISTRIBUTION -- 24% 76%
DISTRIBUTION 6% 12% 82%
DISTRIBUTION 8% 14% 78%
DISTRIBUTION 9% 23% 68%
DISTRIBUTION 5% 36% 59%
DISTRIBUTION 5% 17% 78%
1 OmniTracker ITSM +84
2 Spiceworks IT Help Desk +76
3 Cherwell Service Management +76
4 TeamDynamix ITSM +70
5 Axios ITSM +59
6 ServiceNow Service Management +54
CATEGORY AVERAGE +73
DISTRIBUTION 29% 43% 29%
DISTRIBUTION 33% -- 67%
DISTRIBUTION -- 14% 86%
DISTRIBUTION 14% 29% 57%
- FootPrints +0
- HP IT Service Management +34
- IBM Cloud +86
- BMC Remedy 9 +43
35