catchment areas for emergency departments of the six … · catchment area, there is ... (analysis...
TRANSCRIPT

Catchment areas for emergency departments of the six majorDublin hospitals / Z. Johnson ... [et al.]
Item type 1998
Authors Johnson, Z.
Rights Eastern Health Board
Downloaded 7-Aug-2018 02:03:09
Link to item http://hdl.handle.net/10147/44538
Find this and similar works at - http://www.lenus.ie/hse
Catchment Areas for Emergency Departments of
the Six Major Dublin Hospitals
Johnson 2. Laffoy M, Hynes M, Boyle E, Dack P, Plunkett P, Russel A, McCreanor P
Eastern Health Board Health Information Unit Dept. of Public Health Dr. Steevens Hospital Dublm 8
i ! clcr' May 1998 ? 4~ . -, ..
, . .. _.

Introduction
'The objectives of this study were to:
1. Map patient incident and home address for each Emergency Department: 2. Compare current patterns of attendance at Emergency Departments with
ambulance catchment areas as currently defined; 3. Make recommendations for changes t o ambulance catchment areas t o take
account of the opening of the new Tallaght hospital.
The report is divided into two parts. Part 1 describes the analysis of the survey of Emergency Department attenders. Part 2 addresses the changes in the ambulance catchment areas required by the opening of Tallaght Hospital.
C \4LLWEC\aec3 doc 17 11 08105i98

Part 1 Methods
For a 2 week period (2919197-13-101971 each Emergency Department carried out a prospective study and attempted to collect a standard set of data on all new attenders during both day and night.
Hospitals involved include the following:
1. Beaumont 2. Mater 3. James Connolly 4. St. James 5. Meath 6. St. Vincent's
Items collected included the following:
1. Hospital name 2. Hospital patient identification number 3. Survey number for patient 4. Date of attendance 5. Date of birth 6. Patient home address 7. Location where illnesslinjury occurred 8. Incident address 9. Mode of transport t o Emergency Department 10.lf transferred t o Emergency Department from another hospital, name of hospital 11 .Outcome of Emergency Department visit
Data collection was carried out using a standard form filled out by specially employed researchers in James Connolly, The Meath and St. Vincent's Hosp~tal. This data was keyed on t o computer by a bureau service. Beaumont, Mater and St. James supplied data extracted from their Emergency Department computer systems on diskette, using different file layouts.
The data all from 6 hospitals was transferred on t o the EHB Alpha computer and converted to a standard layout. Both home and incident addresses were processed using Health Information Unit address matching software t o assign DED codes. Addresses for which a DED could not be found automatically were coded manually and were assigned a DED where possible, otherwise a postcode.
Data was analyzed by age group, method of transport and admission rate.
T w o main catchment area analyses were carried out for Part 1 of the report. Firstly, the distribution of attenders was examined in relation t o the currently defined ambulance catchment area of each hospital and secondly in relation t o that proposed in the Kennedy Report, which addressed the situation following the opening of Tallaght Hospital.
Data was analysed using SAS software and maps were produced using Laserscan Horizon software. Student's t test was used for comparing means between 2 groups, and the chi square test was used for comparing proportions. 9 5 %
Confidence Intervals were calculated on the attendance rate per 1,000 persons aged over 15 for each DED.
Results -.
Sample size
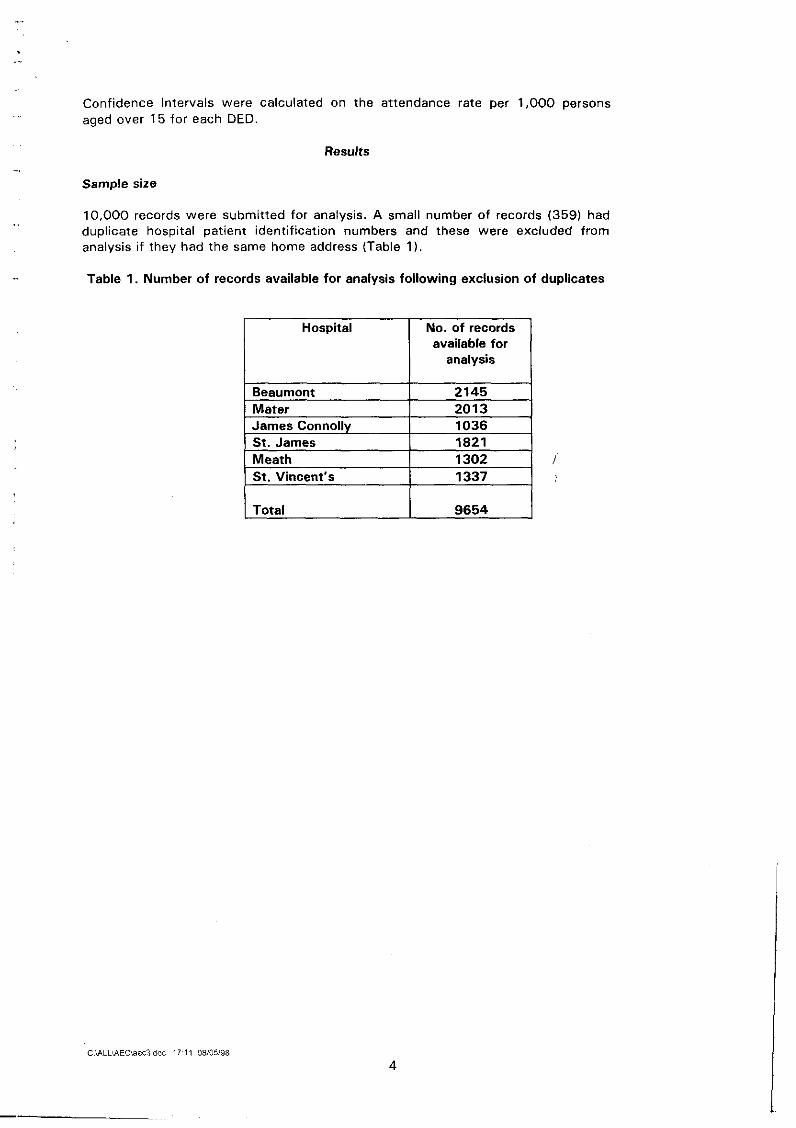
. . 10,000 records were submitted for analysis. A small number of records (359) had duplicate hospital patient identification numbers and these were excluded from analysis if they had the same home address (Table 1).
- Table 1. Number of records available for analysis following exclusion of duplicates
C \ALLUEC\aed dac 17 11 08105198
-
Hospital No. of records available for
Beaumont I 2145
I Total 9654
Mater
St. James Meath St. Vincent's
2013
1821 1302 1337
James Connolly
I
1036
Data quality
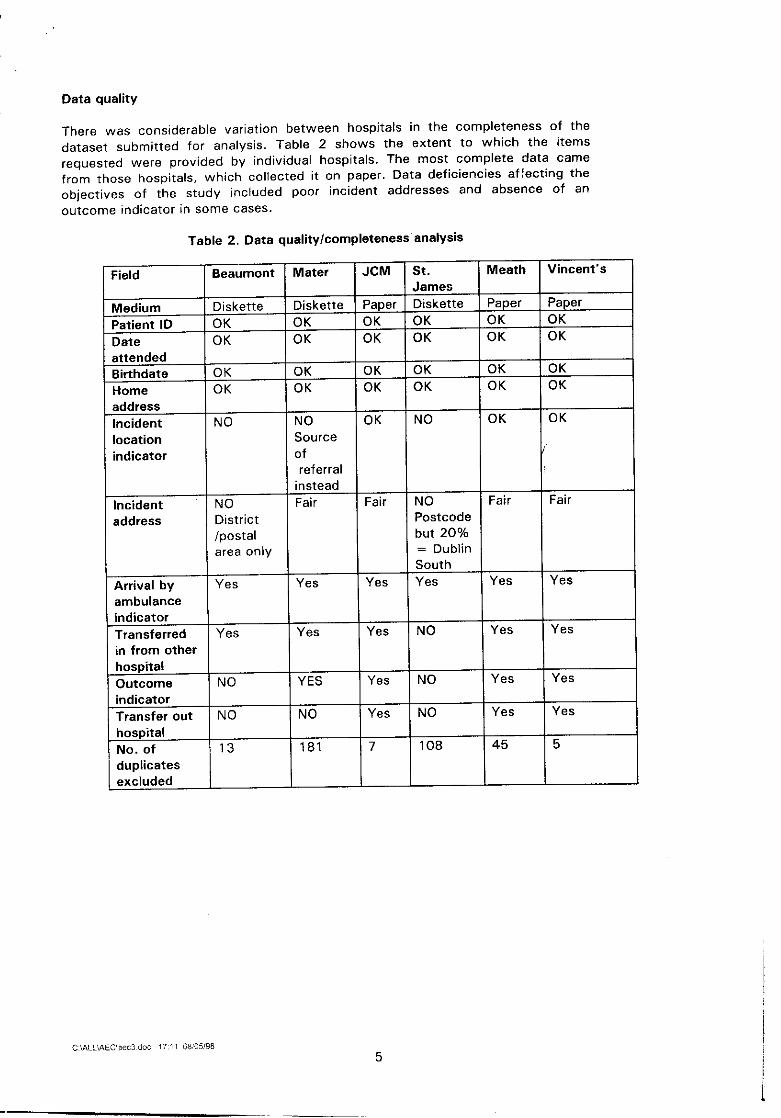
There was considerable variation between hospitals in the completeness of the dataset submitted for analysis. Table 2 shows the extent to which the items requested were provided by individual hospitals. The most complete data came from those hospitals, which collected it on paper. Data deficiencies af:ecting the objectives of the study included poor incident addresses and absence of an outcome indicator in some cases.
Table 2. Data quality/completeness analysis
:ield
Medium Patient ID Date attended Birthdate Home address lncident location indicator
lncident address
Arrival by ambulance indicator Transferred in from other hospital Outcome indicator Transfer out hospital No. of duplicates excluded
- Beaumont Mater JCM St. Meath Vincent's
James
Diskette Diskette Paper Diskette Paper Paper OK OK OK OK 0 K OK 0 K OK OK OK OK OK
Source of 1
referral instead
NO Fair Fair NO Fair Fair District Postcode /postal but 20% area only = Dublin
South Yes Yes Yes Yes Yes Yes
Yes Yes Yes NO Yes Yes
I I I I I NO YES Yes NO Yes Yes
NO NO Yes NO Yes Yes
13 181 7 108 45 5
Age pattern
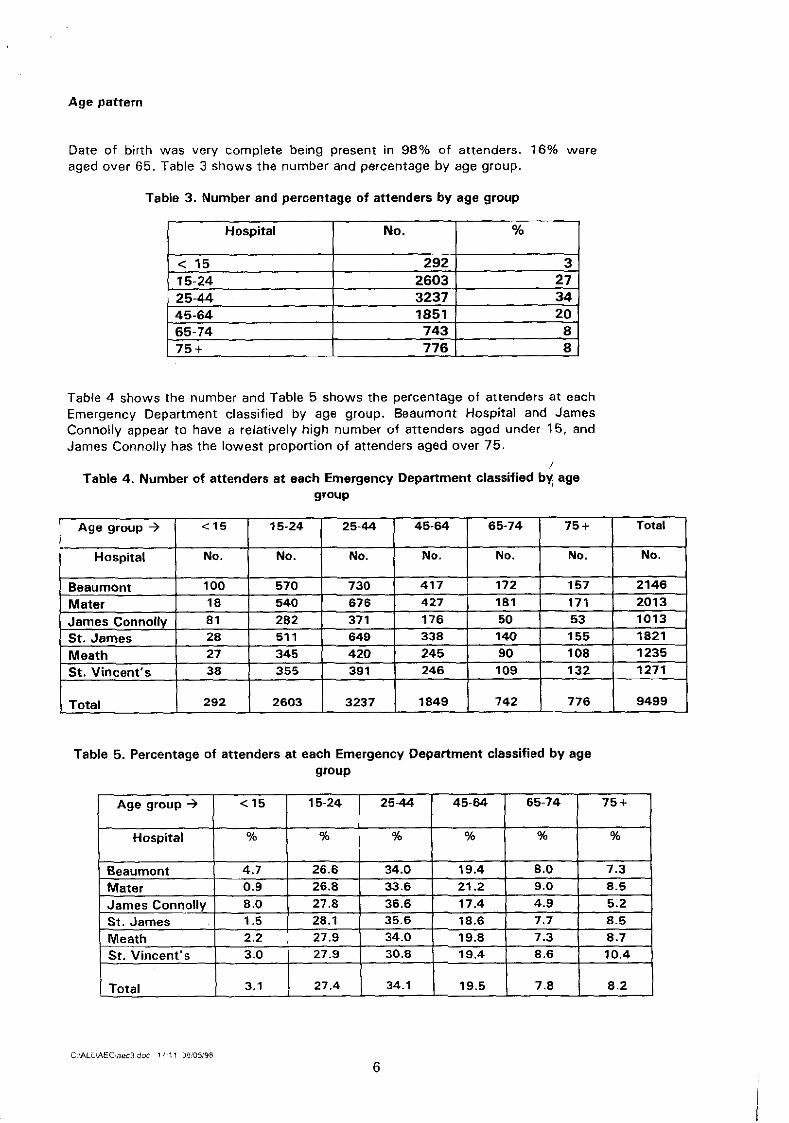
Date of birth was very complete being presenr in 98% of attenders. 16% were aged over 65. Table 3 shows the number and percentage by age group.
Table 3. Number and percentage of attenders by age group
Table 4 shows the number and Table 5 shows the percentage of attenders at each Emergency Department classified by age group. Beaumont Hospital and James Connolly appear to have a relatively high number of attenders aged under 15, and James Connolly has the lowest proportion of attenders aged over 75.
Hospital
/
Table 4. Number of attenders at each Emergency Department classified by, age group
Age group 3 1 <15 1 15-24 1 25-44 1 45-64 ( 65-74 ( 75+ 1 Total
No. %
1 I I I I I I
Table 5. Percentage of attenders at each Emergency Department classified by age group
Total
No. Hospital
292
No. No.
Age group 3 I I 1 I I I
No.
2603
45-64
Total
No. No.
< I 5
Hospital
No.
3237
65-74
%
3.1
75+ 15-24
1849
25-44
% % Oh
27.4
% %
742
34.1
776
19.5
9499
7.8 8.2
Address coding - home addresses
93% of attenders were EHB residents, 8 8 % being from Dublin, 3 % from Kildare and 2% from Wicklow. A further 2% came from Co. Meath and 1% were from outside the state.
9 6 % addresses of residents of Dublin were DED coded, the figure for Kildare being 8 1 % and 73% for Wicklow.
Incident location
lncident location (homelother location) was provided by 3 hospitals (Table 1 ) . A similar categorization was computed for the other 3 hospitals as follows:
In the case of Beaumont i f the incident address began with the word 'HOME', the attendance was classified as originating at home. This approach was quite crude.
In the case of the Mater a field called referral source was provided. If this was coded 'Home', 'Direct (self)', 'GP with letter' or 'GP without letter' or if the incident address began with the word 'HOME' the attendance was classified as originating at home. /
In the case of St. James, all that was provided was home address and inLident postcode. If the home postcode was the same as the incident postcode, the attendance was classified as originating a t home. This method was very crude and is unlikely t o be very accurate.
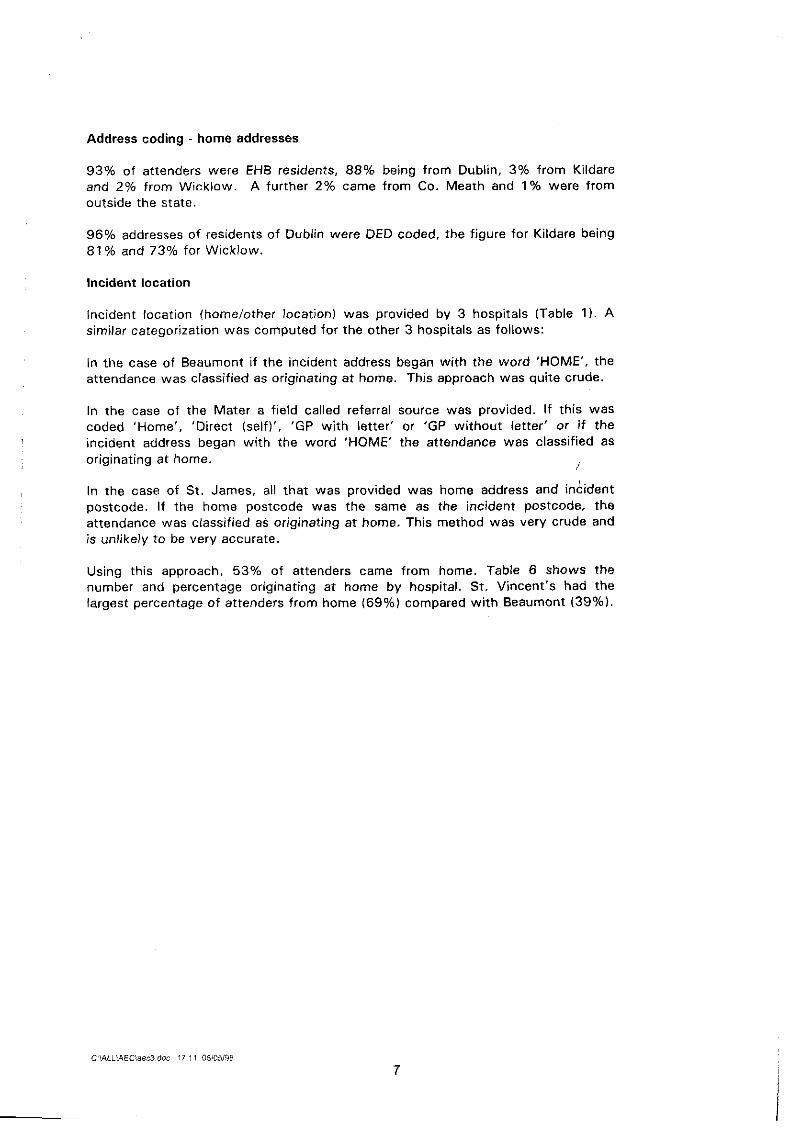
Using this approach, 53% of attenders came from home. Table 6 shows the number and percentage originating at home by hospital. St. Vincent's had the largest percentage o f attenders from home (69%) compared wi th Beaumont (39%).
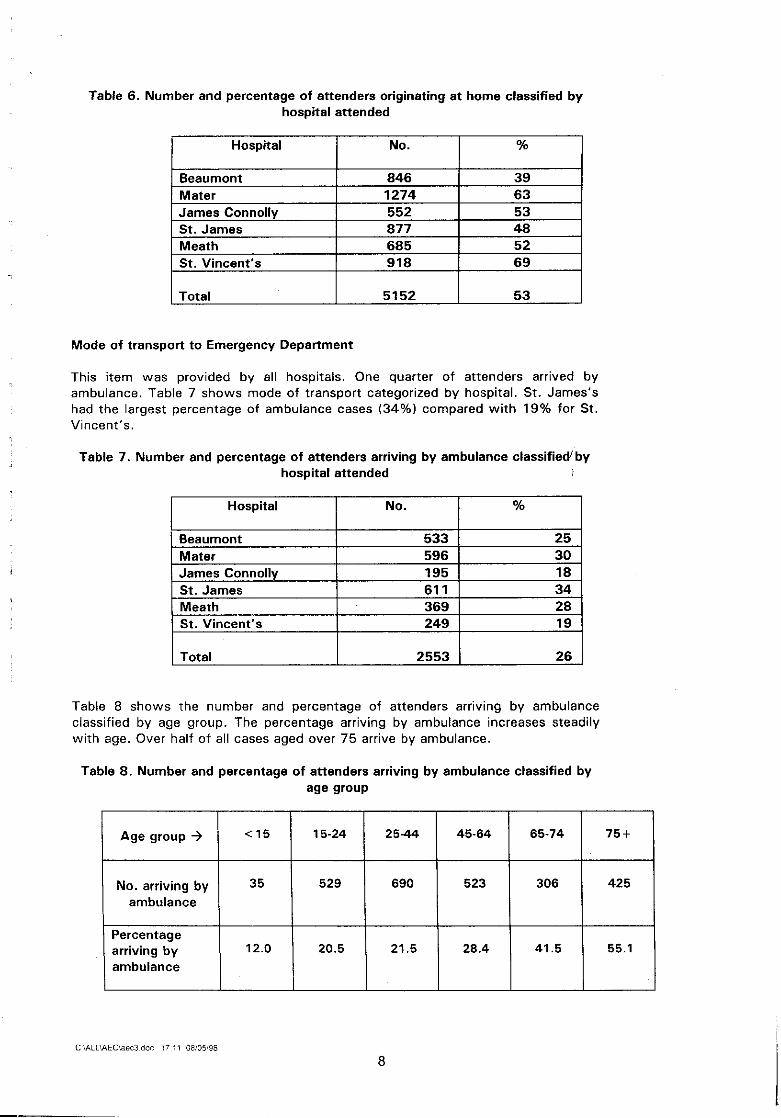
Table 6. Number and percentage of attenders originating at home classified by hospital attended
% Hospital
Beaumont Mater James Connolly St. James Meath St. Vincent's
Mode of transport to Emergency Department
No.
Total
This ~ t e m was prov~ded by all hosp~tals. One quarter of attenders arrwed by ambulance. Table 7 shows mode of transport categorized by hospital. St. James's had the largest percentage of ambulance cases (34%) compared with 19% for St. V~ncent's.
Table 7. Number and percentage of attenders arriving by ambulance classifiedlby hospital attended
846 1274 552 877 685 918
39
63 -
53 48 52 69
5152 53
Hospital
Total 2553 1 26 1
Beaumont Mater James Connolly St. James Meath St. Vincent's
Table 8 shows the number and percentage of attenders arriving by ambulance classified by age group. The percentage arriving by ambulance increases steadily with age. Over half of all cases aged over 75 arrive by ambulance.
No.
Table 8. Number and percentage of attenders arriving by ambulance classified by age group
%
533 596 195 61 1 369 249
25 30 18 34 28 19
Age group +
No. arriving by ambulance
Percentage arriving by ambulance
<15
35
12.0
15-24
529
20.5
25-44
690
21.5
45-64
523
28.4
65-74
306
41.5
75 +
425
55.1

The mean age of ambulance cases was 47.9 years compared t o 37.3 for non- ambulance cases (p =0.0001).
Admission rates
Information on whether the patient was admitted or not from 4 hospitals - Mater, James Connolly, Meath and St Vincent's. This showed that 17% of attenders at these hospitals were admitted: Mater 12.2%. James Connolly 20.1%. Meath 14.4%. St Vincent's 24.1 %.
Of ambulance cases 33.4% were admitted compared wi th 11.7% for non- ambulance cases (p=0.001). Table 9 shows that the percentage of patients admitted rises steeply with age.
Table 9. Number and percentage o f attenders admitted classified by age group (analysis excludes Beaumont and St James)
Age group 3
No. admitted
Percentage of attenders in age group admitted
C \ilLLMEC\aec3 doc 17 11 08105198

Analysis of attendance pattern by HOME address
The relationship between place of residence and hospital attended was explored in relation to the existing ambulance catchment areas. Table 10 shows the number of attenders at each hospital categorized by the defined ambulance catchment area in which they resided. James Connolly has the highest proportion attending from its defined area; the Meath has the lowest.
Table 10. Number of attenders at each Hospital Emergency Department classified by ambulance catchment area in which they resided in 1997
(Analysis based on HOME address)
C RLLlAECiaec3 doc 17 1 l 08105l98
- Fig 1 shows the same data graphically - i.e. the number of attenders at each Emergency Department classified by ambulance catchment area in which they resided. The best way t o understand the graph is to appreciate that where the bar belonging to a particular hospital is low relative t o other hospitals serving its catchment area, there is considerable spillover of cases t o neighboring hospitals. For example, the bar for the Meath is low relative t o the bars for the other hospitals serving i ts catchment area. Thus the Meath catchment is being served by several hospitals.
Fig 1. Number of attenders at each hospital Emergency Department classified by current ambulance catchment area in which they resided
(Analysis based on HOME address)
BMT MMH JCM SJH MEATH SVH
EXISTING AMBULANCE CATCHMENT AREA
C WLL\AEC\PBC~ dnc 17 11 08'051'38
. BMT
.MMH
dCM BSJH
.MEATH
mSVH
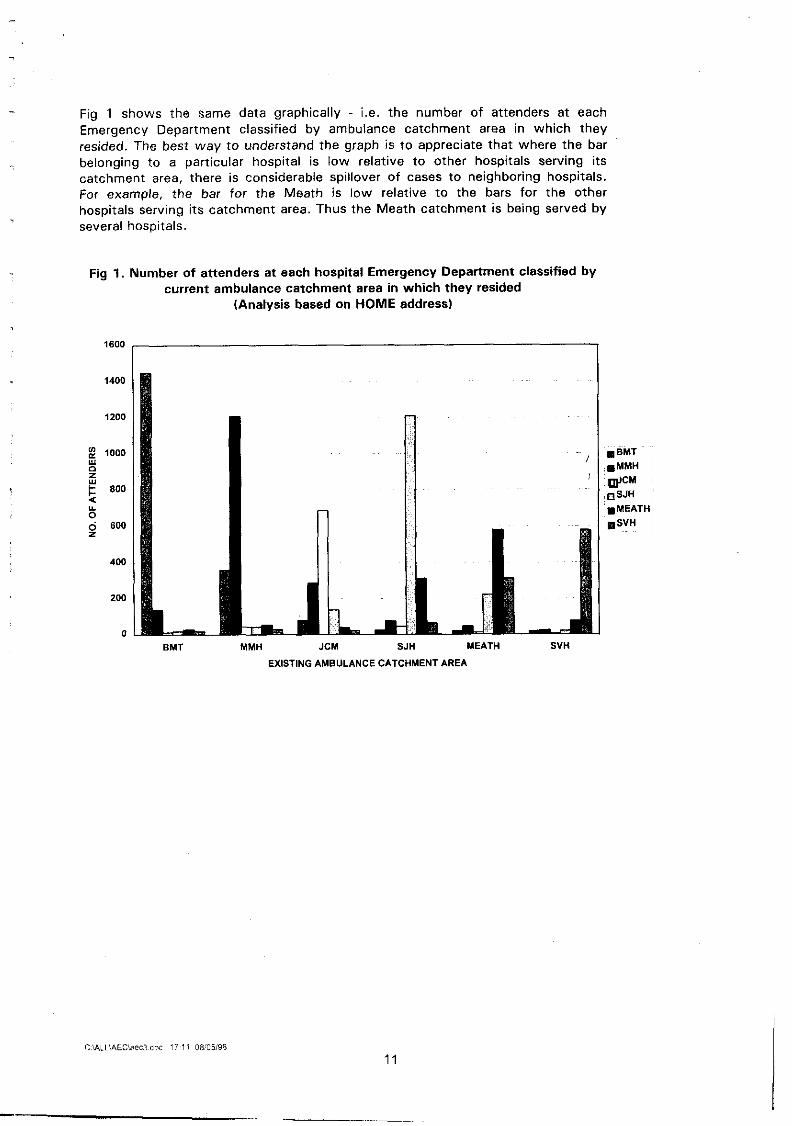
Table 11 shows the situation after Tallaght opens i.e. the number of attenders at the current Emergency Departments classified by the new catchment areas in which they will be residing when Tallaght opens. These catchment areas are those developed for the major Dublin hospitals in the Kennedy Report. It suggests that Tallaght wil l serve slightly fewer patients than currently go to the Meath and while James's will lose patients to Tallaght, it will gain from both the Meath and St. Vincent's.
Table 11. The number o f attenders a t the current Emergency Department classified by the new catchment areas in which they will be residing when Tallaght opens
(Analysis based on HOME address)
CATCHMENT AREA WHEN TALLAGHT OPENS Hospital attended
SVH TALLAGHT SJH BMT TOTAL M M H JCM

Fig 2 is similar to Table 7 and shows graphically which hospitals catchments Tallaght will derive its Emergency Department attenders from.
Fig 2. The number of attenders at the current Emergency Department classified b y the new catchment areas in which they will be residing when Tallaght opens
(Analysis based on HOME address)
POST TALLAGHT CATCHMENT AREA
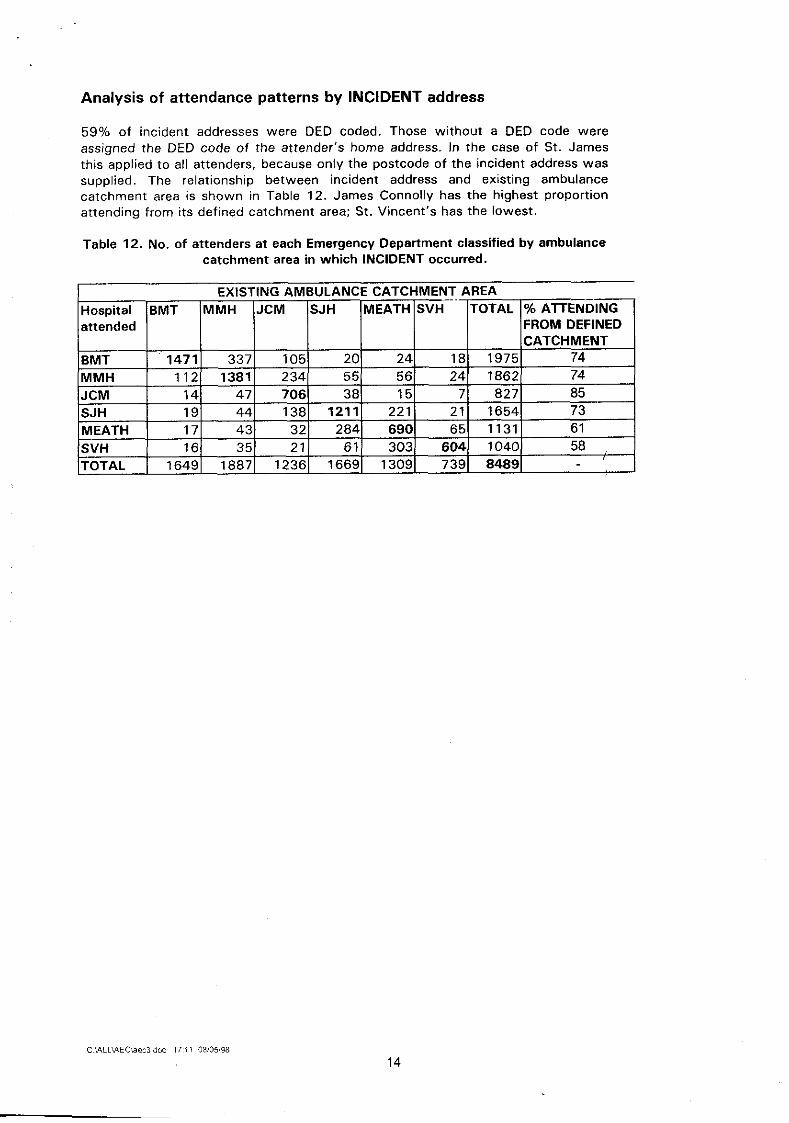
Analysis of attendance patterns by INCIDENT address
59% of incident addresses were DED coded. Those without a DED code were assigned the DED code of the attender's home address. In the case of St. James this applied to all attenders, because only the postcode of the incident address was supplied. The relationship between incident address and existing ambulance catchment area is shown in Table 12. James Connolly has the highest proportion attending from its defined catchment area; St. Vincent's has the lowest.
Table 12. No. of attenders at each Emergency Department classified by ambulance catchment area in which INCIDENT occurred.
C VILLUEC\aec3 doc 17 $ 7 08105198
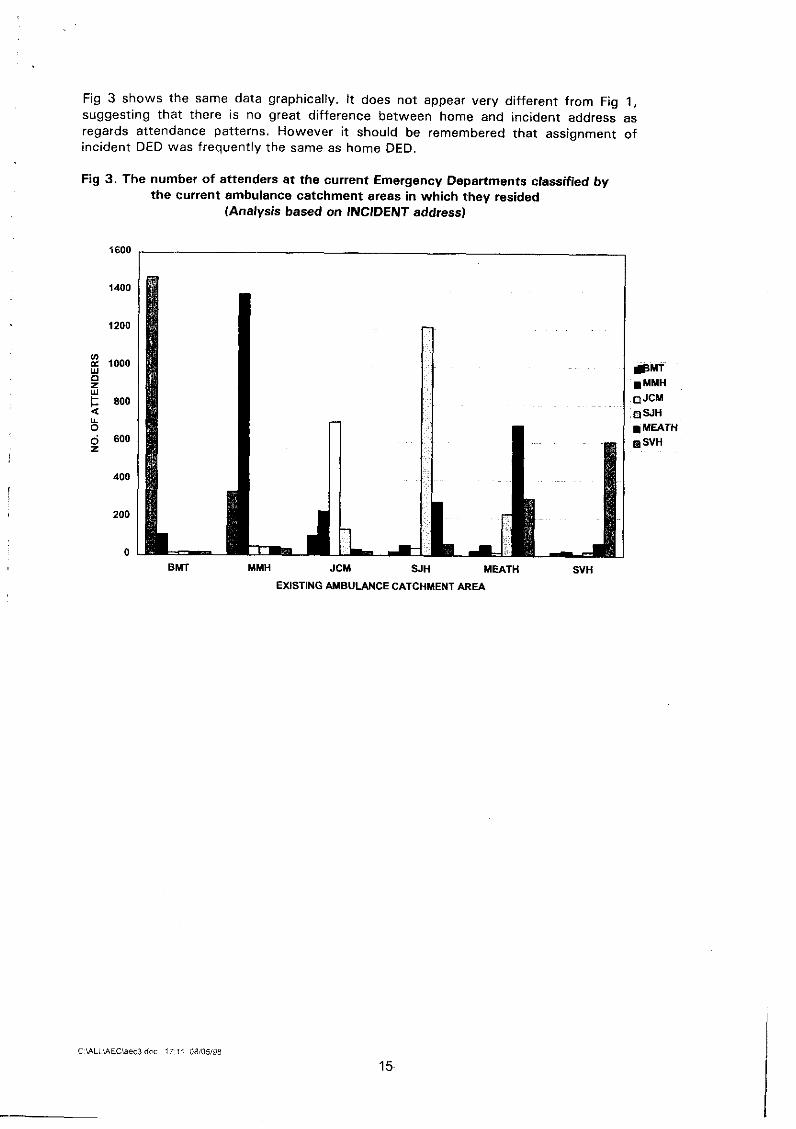
Fig 3 shows the same data graphically. It does not appear very different from Fig 1, suggesting that there is no great difference between home and incident address as regards attendance patterns. However it should be remembered that assignment of incident DED was frequently the same as home DED.
Fig 3. The number of attenders at the current Emergency Departments classified by the current ambulance catchment areas in which they resided
(Analysis based on INCIDENT address)
L BMT MMH 1 JCM
MEATH SVH
EXISTING AMBULANCE CATCHMENT AREA
C MLLMECleec3 doc 17 11 08105W8

Table 13 is similar to Table 11, again suggesting little difference in pattern whether one uses home or incident DED.
Table 13. The number of attenders at the current Emergency Departments classified by the new catchment areas in which they will be residing when Tallaght
opens (Analysis based on INCIDENT address)
C ULLUEC\aec3 doc 17.11 08105198

Fig 4. The number of attenders at the current Emergency Departments classified by the new catchment areas in which they will be residing when Tallaght opens
(Analysis based on INCIDENT address)
160C
1400
1200
U) iooa 0 z
800 < 0" 6 600 z
400
200
0
BMT MMH JCM SJH SVH TALLAGHT
POST TALLAGHT CATCHMENT Al7EA
Variations in attendance rates by DED
The rate of attendance at Emergency Departments per 1,000 population aged over 15 was calculated for each DED based on home address. This showed that the average rate of attendance in the whole EHB was 8.5 per 1,000 persons aged 15 1. This varied from a high of 27.9 in Blanchardstown-Tyrrelstown DED, to zero in many o f the DEDs in Wicklow and Kildare, which are served by other hospitals.
DEDs were divided into 3 groups based using 9 5 % confidence levels - above average, average and below. There were 8 9 (18% of total) DEDs in the above average group, 295 (59.6%) in the average group and 11 1 (22.4%) in the below average group. This data was mapped (Map 259) and i t may be seen that the areas wi th the highest attendance rates were generally in the inner city and northern and western suburbs. These are areas of socio-economic disadvantage wi th limited access to private transport.
. BMT n MMH
JCM n SJH 0MEATH q SVH
C \eLLlAEC\aec3 doc 77 11 08102198
Part 2 Methods
Following a review of the data shown in Tables 12 and 1 3 it was felt that the catchment areas as proposed in the Kennedy Report for the situation following the opening of Tallaght Hospital were less than optimal for the Ambulance Service, and were likely to provide an uneven distribution of caseload.
These catchment areas were amended by a working party comprising of Ambulance Service personnel, Emergency Department consultants and the EHB Health Information Unit. The objective was t o produce a reasonably balanced distribution of attendances taking account of Emergency Department resources and ambulance travelling time.
The task was approached by taking the Kennedy proposals and moving DEDs between catchment areas and then re-calculating the population of each area using the number of persons aged over 1 5 (1996 census). We also estimated the likely number of number of attenders resident in each catchment area based on the home addresses obtained from the 1997 survey.
I Results I
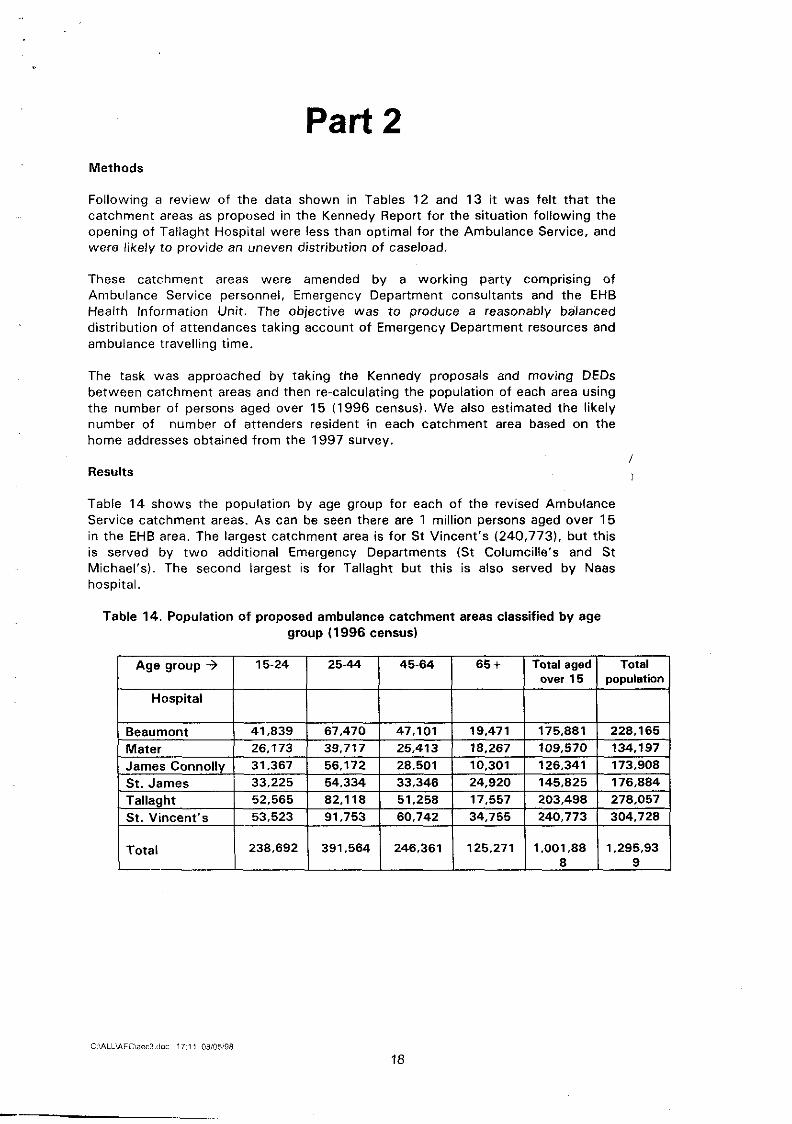
Table 1 4 shows the population by age group for each o f the revised Ambulance Service catchment areas. As can be seen there are 1 million persons aged over 1 5 in the EHB area. The largest catchment area is for St Vincent's (240.773). but this is served by t w o additional Emergency Departments (St Columcille's and St Michael's). The second largest is for Tallaght but this is also served by Naas hospital.
Table 14. Population of proposed ambulance catchment areas classified by age group (1996 census)
- Age group +
Hospital
C'ALLUIEC!aec3 doc 17 11 03105r98
Total L
15-24
238,692
25-44
391,564
Total aged over 15
Total population
45-64
246.361
65+
125.271 1.001.88 8
1.295.93 9

Table 15 shows the number of attenders resident in each of the proposed areas and also the attendance rate from each area as observed during the 1997 survey, based on home address. As can be seen, the workload in Table 15 is more evenly distributed than that based on the Kennedy catchments (Table 11).
Table 15. Number of attenders resident in proposed ambulance catchment areas and 2 week attendance rate per 1,000 persons aged over 15 as estimated from
1997 survey
I Hospital I 1 I
Attendance rate per 1.000 Age group 3 No. of attenders
m e a u i ~ ~ o n ~ I 1775 - -
10.1
James Connolly St. James Tallaght St Vinr~nt 's
Table 16 shows the number and percentage of persons aged over 65 in the proposed catchments. This is important because as was seen in Table 9, the rate o f admission increases with age. The inner city hospitals - St James and the Mater -have the highest proportion of elderly, whereas the more suburban ones have a substantially lower percentage.
Total
Table 16. Number and percentage of persons aged over 65 in proposed ambulance catchment areas (1996 census)
Mater 1258 1632 1194 986
1641 I 15.0 10.0 11.2
I 5.9 4.1
/
8486
I I
Hospital
8.5
Percentage of persons aged over 65
Age group + No. persons aged over 65
Beaumont Mater James Connolly St. James Tallaght St. Vincent's
Discussion and recommendations
Total
This exercise has used Emergency Department attendance data and census data t o propose revised ambulance catchment areas for the big Dublin hospitals. The work was impeded to some extent by the difficulty in getting good data on incident address. The proposed catchments may not necessarily be optimal in practice, and patterns will change over time with demographic changes, new house building etc. We feel that attendance patterns should be analyzed at regular intervals, and ambulance catchmenr areas amended as necessary t o ensure the best balance between Emergency Department caseload and ambulance travelling time.
19,471 18,267 10.301 24,920 17,557 34,755
8.5 13.6 5.9 14.1 6.3 11.4
125.271 9.7
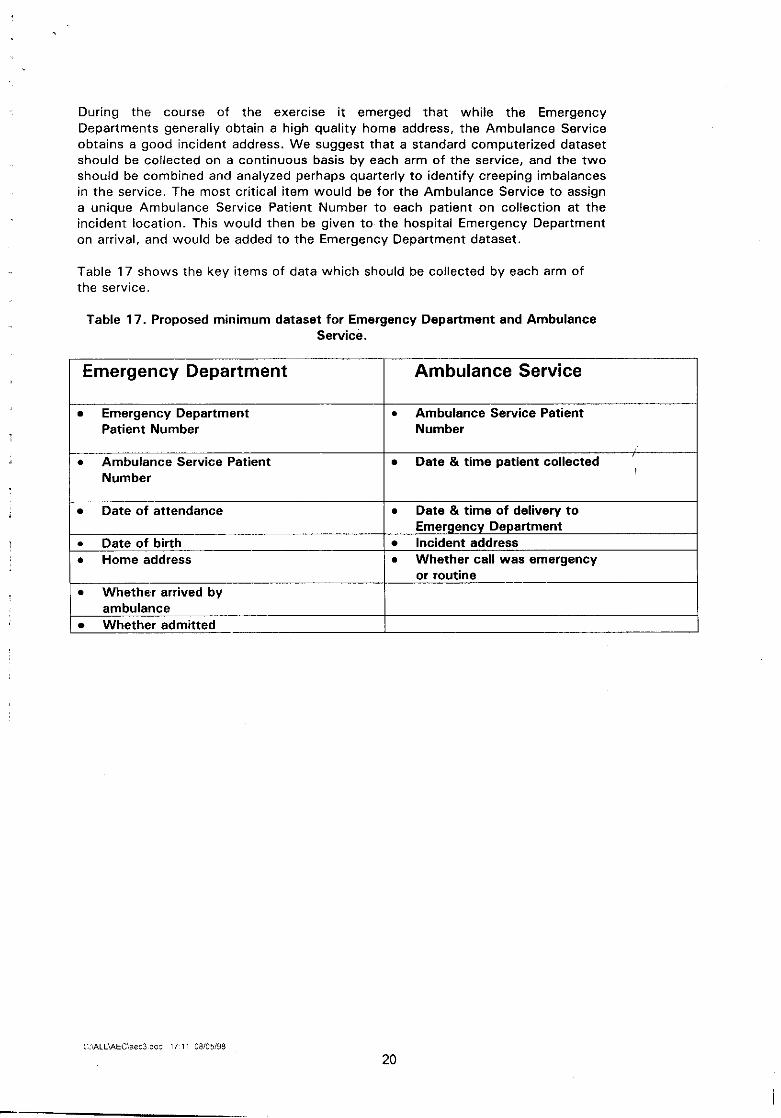
During the course of the exercise it emerged that while the Emergency Departments generally obtain a high quality home address, the Ambulance Service obtains a good incident address. We suggest that a standard computerized dataset should be collected on a continuous basis by each arm of the service, and the t w o should be combined and analyzed perhaps quarterly t o identify creeping imbalances in the service. The most critical item would be for the Ambulance Service t o assign a unique Ambulance Service Patient Number t o each patient on collection at the incident location. This would then be given t o the hospital Emergency Department on arrival, and would be added t o the Emergency Department dataset.
Table 17 shows the key items of data which should be collected by each arm of the service.
Table 17. Proposed minimum dataset for Emergency Department and Ambulance Service.
-. - - . . . -. - . . . - - . . . . . . - . . . . . - - . . . - . - . . .. . . -. -. . . . Emergency Department 1 Ambulance Service
b Emergency Department Patient Number
Ambulance Service Patient Number
0 Ambulance Service Patient Number
-
or routine Whether arrived by
b Date & t i m e patient collected I
Date o f attendance
. Date o f birth b Home address
ambulance Whether admitted
0 Date & time of delivery t o Emergency Department Incident address
0 Whether call was emergency

MAPS
Map 241 shows the proposed catchment areas within Dublin, of the 6 major Dublin hospitals, after Tallaght Hospital opens.
Map 242 was derived by finding for each DED the hospital at which the largest number of its residents attended during the 1997 survey - it is based on HOME address.
Map 243 was derived by finding for each DED the hospital at which the largest number o f its residents attended during the 1997 survey - it is based on INCIDENT address.
Map 2 4 4 shows the ex~sting ambulance catchment areas within Dublin, of the 6 major Dublin hospitals.
Map Z59 shows the pattern of attendance per DED, showing DEDs with above average, average and below average attendance rates.
Map 261, 262 and 263 shows the proposed ambulance catchment areas t o be used when Tallaght Hospital opens for Dublin, Wicklow and Kildare respectively.
Acknowledgements I
We wish t o acknowledge the contribution of all those who collected the data in the 6 Dublin hospitals. Also Angela Connolly and Tony Kenny in Beaumont, Miriam Murphy and Valerie Kestell in the Mater and Finian Lynam in St James. Also the Emergency Department Consultants who facilitated the study.
C WLiWEC!aeD doc 77 11 05105198