catch efficiency comparisons of four commercial gillnet ... › docs › vol1 › rir ›...
TRANSCRIPT

CATCH EFFICIENCY COMPARISONS OF FOUR COMMERCIAL
GILLNET MESH SIZES IN THE TAKING OF SOCKEYE AND CHUM
SALMON IN DISTRICTS 11 1 AND 115, SOUTHEAST ALASKA
BY
Joseph Muir
Ray Staska
and
Jim Blick
Regional information ~ e p o n ' No. 1194-13
Alaska Dcpanmcnt of Fish and Game Commercial Fishcrics Xlmagcmcnt and Dcvclopmcnt Division
Juneau, Alaska
April 1994
I The Regional Information Report Scrics was established in 1988 to provide an information access system for all unpublishcd divisional reports. Thcsc rcports frqucntly serve diverse ad hoc informational purposes or archive basic unin~cnuptcd data. To accommodate timely reporting of recently collected information, reports in this series undergo only limited intcrnai review and may contain preliminary data; this information may be subsequently fmalizcd and published in thc formal literature. Consequently. these reports should not be cited without prior approval of the author or the Division of Commercial Fisheries Management and Development. This report may be ciled w ~ h o u t prior approval.

TABLE OF CONTENTS
PaRe
LISTOFTABLES . . . . . . . . . . . . . . . . . . . . . . . . . . . . . . . . . . . . . . . . . . . . . . . . . . . . . . . . iii
LISTOFFIGURES . . . . . . . . . . . . . . . . . . . . . . . . . . . . . . . . . . . . . . . . . . . . . . . . . . . . . . . . iv
LISTOFFIGURES . . . . . . . . . . . . . . . . . . . . . . . . . . . . . . . . . . . . . . . . . . . . . . . . . . . . . . . . v
INTRODUCTION . . . . . . . . . . . . . . . . . . . . . . . . . . . . . . . . . . . . . . . . . . . . . . . . . . . . . . . . . 1
METHODS . . . . . . . . . . . . . . . . . . . . . . . . . . . . . . . . . . . . . . . . . . . . . . . . . . . . . . . . . . . . . . 1
. . . . . . . . . . . . . . . . . . . . . . . . . . . . . . . . . . . . . . . . . . . . . . . . . . . . . . . . . . . . . . RESULTS 3
. . . . . . . . . . . . . . . . . . . . . . . . . . . . . . . . . . . . . . . . . . . . Catch Efficicncics: (CPUE) 3
. . . . . . . . . . . . . . . . . . . . . . . . . . . . . . . . . . . . . . . . . . . . . . . . . . . . . SockcyeSahon 4
. . . . . . . . . . . . . . . . . . . . . . . . . . . . . . . . . . . . . . . . . . . . . . . . . . . . . . Chumsalmon 4
. . . . . . . . . . . . . . . . . . . . . . . . . . . . . . . . . . . . . . . . . . . . . . . . . . . . Incidental Species 4
. . . . . . . . . . . . . . . . . . . . . . . . . . . . . . . . . . . . . . . . . . . . . . . . . . . . CatchProponions 5
. . . . . . . . . . . . . . . . . . . . . . . . . . . . . . . . . . . . . . . . . . . . . . . . . . . . . . . . . . . . DISCUSSION 5

LIST OF TABLES
Pane
. . . . . . . . . . . . . . . . . . . . . . . . . . . . District 1 1 1 catch by species by week by mesh size 6
. . . . . . . . . . . . . . . . . . . . . . . . . . . Districts 115 catch by species by week by mesh size 7

LIST OF FIGURES
Fishing locations and year fishing occurred . . . . . . . . . . . . . . . . . . . . . . . . . . . . . . . . . . 8
. . . . . . . . . . . . . . . . . . . . . . . . . . District 11 1 CPUE by mesh size by species-all weeks 9
. . . . . . . . . . . . . . . . . . . . . . . . . District 11 1 CPUE by mesh size by species-Week 1 ..-. 10
District 1 1 1 CPUE by mesh size by species-Week 2 . . . . . . . . . . . . . . . . . . . . . . . . . . . 11
District 11 1 CPUE by mesh size by species-Week 3 . . . . . . . . . . . . . . . . . . . . . . . . . . . 12
. . . . . . . . . . . . . . . . . . . . . . . . . . . District 1 1 1 CPUE by mesh sizc by species-Week 4 13
. . . . . . . . . . . . . . . . . . . . . . . . . . . District 11 1 CPUE by mcsh sizc by spccies-Week 5 14
. . . . . . . . . . . . . . . . . . . . . . . . . District 115 CPUE by mcsh s i x by spccics-all weeks 15
District 115 CPUE by mcsh sizc by spccics-Week 1 . . . . . . . . . . . . . . . . . . . . . . . . . . . 16
. . . . . . . . . . . . . . . . . . . . . . . . . . . District 115 CPUE by mcsh sizc by spccics-Week 2 17
. . . . . . . . . . . . . . . . . . . . . . . . . . . District 115 CPUE by mcsh s i x by spccics-Week 3 18
. . . . . . . . . . . . . . . . . . . . . . . . . . . District 115 CPUE by mcsh sizc by spccics-Week 4 19
District 115 CPUE by mcsh s i x by spccics-Week 5 . . . . . . . . . . . . . . . . . . . . . . . . . . . 20
District 11 1 . Proportion of chums to tolal chum/sockcyc salmon catch by mcsh size-all wccks . . . . . . . . . . . . . . . . . . . . . . . . . . . . . . . . . . . . . . . . . . . . . . . . . . . . . . . . . . . 21
District 11 1 . Proportion of chums to lorat chum/sockcyc salmon catch by mcsh size- Wcck 1 . . . . . . . . . . . . . . . . . . . . . . . . . . . . . . . . . . . . . . . . . . . . . . . . . . . . . . . . . . 22
District 11 1 . Proportion of shums to total chums/sockcyc salmon catch by mcsh sizc- Wcck2 . . . . . . . . . . . . . . . . . . . . . . . . . . . . . . . . . . . . . . . . . . . . . . . . . . . . . . . . . . 23
District 11 1 . Proportion of chums to total chum/sockeye salmon catch by mcsh size- Wcck3 . . . . . . . . . . . . . . . . . . . . . . . . . . . . . . . . . . . . . . . . . . . . . . . . . . . . . . . . . . 24
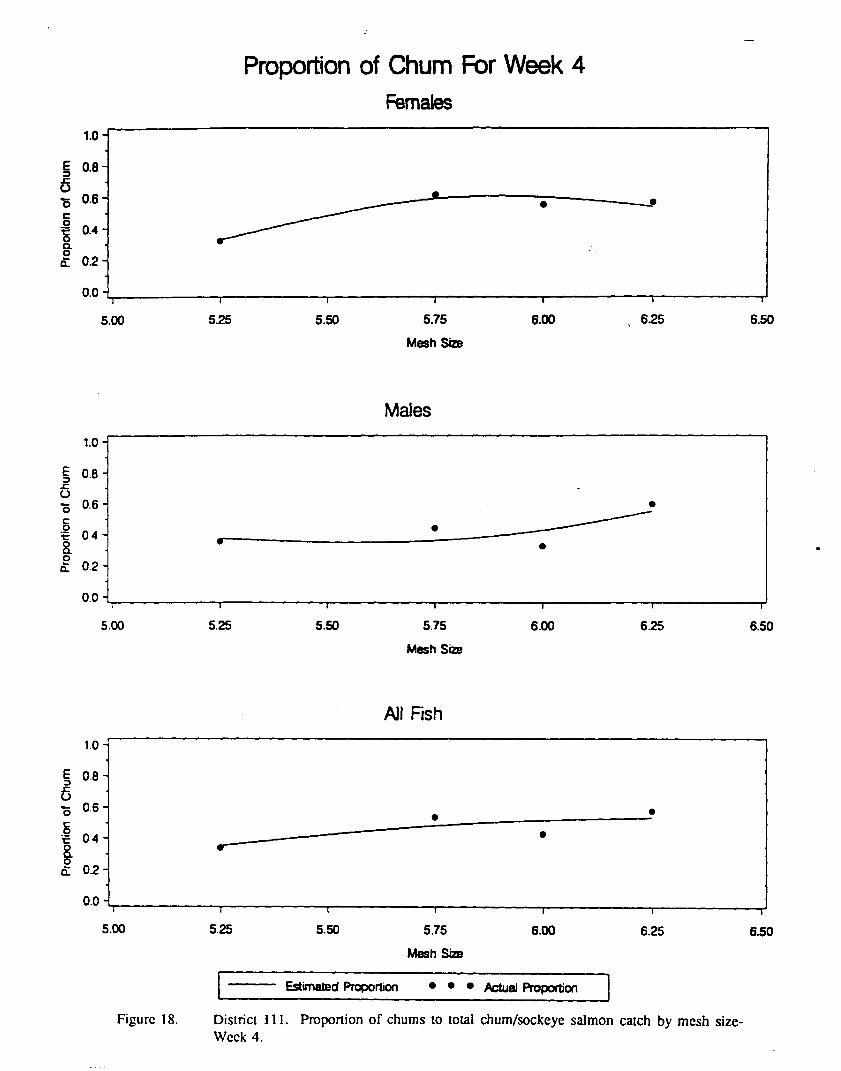
District 11 1 . Proponion of chums to total chumlsockeye salmon catch by mcsh size- Wcck4 . . . . . . . . . . . . . . . . . . . . . . . . . . . . . . . . . . . . . . . . . . . . . . . . . . . . . . . . . . 25
District 11 1 . Proportion of chums to total chum/sockeye salmon catch by mesh size- Wcck5 . . . . . . . . . . . . . . . . . . . . . . . . . . . . . . . . . . . . . . . . . . . . . . . . . . . . . . . . . . 26

LIST OF FIGURES (Cont)
20. District 115. Proponion of chums to total chumlsockeye salmon catch by mesh size-all weeks . . . . . . . . . . . . . . . . . . . . . . . . . . . . . . . . . . . . . . . . . . . . . . . . . . . . . . . . . . . 27
21. District 115. Proponion of chums to total chum/sockeye salmon catch by mesh size- . . . . . . . . . . . . . . . . . . . . . . . . . . . . . . . . . . . . . . . . . . . . Week1 : . . . . . . . . . . . . . . 28
22. District 115. Proponion of chums to total chum/sockeye salmon catch by mesh size- Week2 . . . . . . . . . . . . . . . . . . . . . . . . . . . . . . . . . . . . . . . . . . . . . . . . . . . . . . . . . . 29
23. District 115. Proportion of chums to total chumlsockeye salmon catch by mesh size- Week3 . . . . . . . . . . . . . . . . . . . . . . . . . . . . . . . . . . . . . . . . . . . . . . . . . . . . . . . . . . 30
24. District 115. Proponion of chums to total chumlsockeye salmon catch by mesh size- Week4 . . . . . . . . . . . . . . . . . . . . . . . . . . . . . . . . . . . . . . . . . . . . . . . . . . . . . . . . . . 31
25. District 115. Proponion of chums to total chumlsockeye catvch by mesh size-Week 5 . . 32
. . . . . . . . . . . . . . . . . . . . . . . . . 26. Chum salmon length dislribulion by Wcck and District 33

INTRODUCTION
This report describes the preliminary results of a gillnet mesh size study evaluating the fishing efficiency (CPUE) of four mesh sizes in the taking of sockeye and chum salmon during the summer season in two adjacent fishing districts in Southeast Alaska. Gillnets comprised of 5 114". 5 314". 6" and 6 114" mesh were fished in Districts 11 1 and 115 during five consecutive weeks in July and August. Due to a lack of gear availability, the study was conducted over a 2-year period; District 11 1, was conducted in 1991, while District 115 was complcted in 1992 (Figure 1).
Hatchery summer chum salmon enhancement has increased in recent years in Districts 111 and 115. Additional fishing time is often rcquircd to harvest these summer chum salmon returns, above that which would normally be allowed during the traditional sockeye salmon fishery. In order to increase chum salmon catches while reducing sockeye interceptions the department implemented a minimum mesh size which is larger than the optimal sockeye mcsh size. By fishing a larger mesh size, more fishing time could be allowcd to catch chum salmon. without further increasing the sockeye salmon catch.
Over time. two differcnt minimum mcsh sizes have been adopted into regulation for District 11 1 and 115. The department may implement a minimum mcsh of 6" in District 11 1, and 6 114" in District 115, during periods established by emergency order for the protection of sockeye salmon during the chum salmon season. During thc 1990 Board of Fisheries meeting several proposals were submitted to change the minimum mcsh sizc of each district to bc morc consistent with the other. Since evidence was not available to support either as the "right" mcsh sizc, the Board of Fisheries directed the department to conduct a gear study to compare scvcnl mcsh s ix s to determine which mesh size would be most efficient at catching chum salmon while letting most sockcyc to pass through.
Thc study was conductcd in two scpamtc gillnet fishing districts in southeast Alaska. Gillnct Districts 11 1 (TakuISncttisham) and 115 (Lynn Canal) wcrc selected because each district encompassed chum salmon hatcheries or chum salmon remotc rclcase sites. Both districts had increasing summcr chum salmon harvests during stable or declining sockcyc returns. The Douglas Island Pink and Chum (DIPAC) hatchery. the state hatchery in Pon Sncttisham, and the Northern Southeast Regional Aquaculture Association (NSERAA) were the primary summcr chum salmon stock enhancers, with rclcasc sites located in lower Lynn Canal, Stephen's Passagc. and Gastincau Channel.
The study in District 11 1 was conductcd in 1991. while the study in District 115 was completed in 1992. Fishing was conductcd in both ycars for a five consecutive weeks; fishing occurred in District 11 1 from

July 5 to August 2, and in District 115 from July 9 to August 7. In each district, one gillnet boat was chartered to fish a 24-hour period the same day each week for the 5-week period.
Each vessel fished a 200-fathom net comprised of four, 50-fathom panels of different mesh size gillnets. The net was hung at a ratio of 2.2 fathoms of gillnet web for every 1 fathom of cork line (fishing industry standard). Mesh color and thread size matched that which was currently used in each area as suggested by local Uroko net distributors.
The panels included the following gillnct mesh sizes:
1. Uroko multistrand. 5 114" 2. Uroko multistrand. 5 314" 3. Uroko multistrand, 6" 4. Uroko multistrand, 6 114"
Pancls wcrc scparatcd by 5-fathom sprlccs to avoid panels leading fish to adjacent pancls. Panels were ordcred randomly at the beginning of cach fishing period. The order was fished for the first 12 hours, after which thc two inside pancls wcrc switchcd with the two outside panels. When setting the net from the vessel, thc cnds of the net wcrc altcmatcly fished next to the beach. By alternating the position of the pancls within thc net, and altcmating thc cnds of the net in relationship to the beach. each panel was exposed to thc same geographical fishing conditions.
Spccics, scx, lcngth and ginh wcrc rccordcd for cach fish caught by panel (mcsh size) for each set. In addition, thc mcthod by which cach fish was caught in the web was recorded in ordcr to evaluate the drop- out ratc for cach mcsh type. Mcthod of cntanglcmcnt was classified as:
1. Dropouts 2. Thosc fish caught only by portions of thcir mouth or maxillary 3. Thosc fish which arc impalcd past thcir gills or gill platcs 4. Thosc fish which arc impalcd p a ~ t Lhc hcad
In ordcr to standardiirx: catchcs to catch pcr hour fishcd. thc timc whcn Lhc nct was sct was recorded, as wcll as thc timc cach panel stancd to comc into thc boat, and thc timc cach pmcl was completely on board. Fishing timc was dcfincd as that pr iod from whcn thc first float lcft thc vcsscl to whcn the last float was rcclcd back on to thc boat. and i t was calculated as:
T = (tin1 - tout) + O.S(tin2 - tinl)
whcrc,

T = fishing time in hours
tout = time first float of net leaves the boat;
tin1 = time panel starts coming in to boat; and
tin2 = time panel is totally on the boat
RESULTS
Sockeye and chum salmon were the prcdominant species caught in both District 11 1 and District 115 during the study. In District 11 1, a total of 1,844 chum, 905 sockeye, 162 pink, 86 coho and 9 king salmon wcrc caught (Table 1). District 1 15 had a total catch of 800 chum, 586 sockeye, 505 pink, 1 coho, and 1 king salmon (Table 2). Fishing occurrcd in District 111 on July 5-6, July 11-12, July 18-19, July 25-26 and August 1-2, 1991. District 1 15 fishing dates were July 9-10, July 16-17, July 24-25, July 30- 31 and August 5-7, 1992.
In gcncral, thc tom1 catch and proponion of cach species within the catch differed bctween weeks. In District 11 1 the sockeye salmon catch pcakcd on July 18-19 (3rd week) with a weckly catch of 288, while chum salmon pcakcd on July 11-12 (2nd wcck) with a total catch of 789. The peak sockeye catch in District 115 of 252 fish occumd on July 9-10, and the peak weekly chum catch of 322 fish occurred on July 16-17. Duc to the design of the study (i.c.. timc of year, mesh size selected. ctc.), pink, coho, and king salmon wcrc considcrcd as spccies incidcntal to the purpose of this study and catch cfficicncies were not dcvclopcd for thcm.
Catch Efficiencies: (CPUE)
The study showcd that although hcrc wcrc diffcrcnccs bctwccn fishing weeks and mcsh size cfficiency in catching sockeye and chum salmon (Figurcs 2-6 and 8-12), overall there werc general trends in gear cfficicncy of thc four mcsh sizes studied (Figurcs 1 and 7). CPUE was defined as the total catch divided by ~ h c total cffon for a given timc pcriod. As mesh size increascd. sockeye salmon catches decreased. Chum salmon catch cfficicncies by mcsh size wcrc lcss clcar, with the three larger mesh sizes exhibiting vcry similar CPUEs, though in District 115. thc 6 114" mesh exhibited the lowest catch rate for chum salmon.

Sockeye Salmon
In District 1 1 1, the 6" mesh caught the fewest sockeye over the study period (2.6 fishhour), but it was not significantly (a = .05) different than the 6 114" mesh (3.0 fish/hour). Although both the 6" and 6 114" mesh caught the same number of females, the 6 114" mesh caught more males, resulting in a higher overall CPUE,, although the results are not significantly different. The 5 114" mesh was significantly more effective in catching sockeye salmon than the 5 314". 6", and 6 114" mesh sizes, and the 5 314" was significantly more effective than the 6" or 6 114" mesh.
In District 115. the 6 114" mesh caught the fewest sockeye over the study period (2.2 fishlhour). but it was not significantly different than the 6 . 0 mcsh (2.3 fish/hour). The 6 114" mesh caught significantly fewer female sockeye than the 6 mesh (0.9 and 1.1 fishhour, respectively). The 6 114" mesh, as in District 11 1, was significantly less efficicnt in catching sockeye than the 5 114". 5 314" and 6" gillnet mesh sizes.
Churn Salmon
In District 11 1, thc 5 114" mesh caught significantly fewer chum salmon than the 5 314". 6". and 6 114". but thc CPUEs for thc larger mcsh sizcs wcrc not significantly different fmm each other. Chum salmon CPUEs for thc 5 314". 6" and 6 114" wcrc 7.9, 7.5, and 8.0 fish, respectively. The 5 314" mesh caught thc most fcmalc chums. while thc 6 114" mcsh caught more males, although the diffcrences were not significant.
In District 115. thc 6" mcsh caught thc most chum, with the CPUE for 6" mesh significanlly higher than for thc 6 114" mcsh (4.1 and 3.1 fish, rcspcc[ivcly). Thc 5 314" mcsh caught the most fcmalc chums, while thc 6" mcsh caught thc most malcs. but diffcrcnccs wcrc not significant. Chum salmon CPUEs for the 5 114" and 5 3/4" mcsh sizcs wcre 3.4 and 3.7 fish. respcctivcly.
CPUE for sockcyc and chum salmon for cach fishing wcck and total season are found in Figures 1-6 (District 1 1 1 ) and Figurcs 7-12 (District 1 15).
Incidental Species
Although CPUE valucs wcrc not calculated for incidental species, total catch by species by mesh size is available (Tablcs I & 2). In District I 1 1, Lhc 5 114" mesh caught the most pink salmon (93 fish); 6 114" caught thc most king salmon (4). and coho salmon were caught equally by all four mcsh sizes (19-23

fish). In District 115, the 5 114" mesh also caught the most pink salmon (244). 5 314" mesh caught the only king salmon, and coho salmon wcre caught equally by the 5 314" and 6" mesh (1 each).
Catch Proportions
Of particular importance to this study was the proportion of chum (with respect 30 the catch of chum and sockeye salmon), caught by a given mcsh size, since we need to know which mesh size maximizes the proportion of chum in a total catch of chum and sockeye salmon. Across all weeks, in Districts 11 1 and 115, there wcre only a few times whcn the proportion of chum was greatest for 6 114" mesh. It was usually greatest for thc 6" mesh in Disuict 11 1 (Figures 14-18), and the 5 314" or 6" mesh in District 115 (Figures 20-24) . Although the chum catch proportion for 6" mesh was never statistically significantly diffcrcnt from the proportion for 6 1/4", the overall evidence points to a mesh size less than 6 114" as being more efficicnt in both districu.
DISCUSSION
Thc objcctivc of this study was to dctcrminc a mcsh size which would be efficicnt at harvesting chums but at thc s m c timc, bc lcast cffcctivc at harvcsting sockeye salmon. In both District 11 1 and 115, the 6" mcsh produccd thc highcst proponion of chum to sockeye salmon in thc catch. although not silificanlly diffcrcnt than thc 5 3/4" and 6 114" mcsh (Figures 13 and 19). Thcrcforc. 6" mcsh would bc thc logical mcsh sizc to implcmcnt during a pcriod whcn thc dcpanmcnt dcsircd to targct summer chum salmon and havc minimal impacts on sockcyc salmon stocks. Howcvcr, duc to thc fact that the 6 114" mcsh catchcs morc malcs than fcmalcs (of both spccics). i t may bc a slighlly morc cffcctivc mcsh size to usc whcn trying to funhcr incrcasc cscapcmcnt of rcmalcs.
Rcsulu of this study wcrc spccific to thc sizc (Icngth andlor ginh) disrribution cncountcrcd in each district. Lynn Canal rcsults in 1992 pointcd to an cvcn smdlcr optimum mcsh sizc than in Taku study, possibly bccausc thcrc wcrc largcr chum in thc Taku rcrum arcas in 1991 (Fiprc 25). If thc sizc distribution changcs in thc futurc. wc can usc thc rcsults of this study to prcdict the optimal mcsh size for our objcctivc.
Analysis of IcngWginh rclationships to mcsh sizc and sclcctivity will bc discusscd in a futurc technical rcpon.

TABLE 1. DISTRICT 111 CATCH BY SPECIES BY UKEK BY KESE SIZE
CHUM SOCKEYE PlNK KING COHO
CHUM SOCKEYE PlNK KlNG COHO
CHUM SOCKEYE PlNK KlNG COHO
CHUM SOCKEYE PINK KING C o l t 0
CHL'hf SOCKEYE PlNK KlNG COHO
CHUM SOCKEYE PlNK KING COHO
TAKU MESH SIZE STUDY PRELIMINARY DATA
PINK ORANGE GREEN BLUE TOTAL CATCH (6- 114") (6") (5-314") (5- 114")
106 112 93 49 42 47 61 0 I 2 2 0 I 0 0 0 0 0 0
PINK ORANGE GREEN BLUE
PINK ORANGE GREEN BLUE (6-114") (6' ) (5-94') (5-114")
5 PINK ORANGE GREEN BLUE
(6- 114.) (6') (5.V4') (5- 114")
PINK ORANGE CREE\ HLL'E (6-114') (6') ~ < . t / ~ - t 1 5 . 1 ~ - I

CHUM SOCKEYE PlNK KlNG COHO
CHUM SOCKEYE PlNK KlNG COHO
CHUM SOCKEYE PlNK KlNG COHO
CHUM SOCKEYE PlNK KING COHO
CHUM SOCKEYE PlNK Klh'G COHO
TABLE 2. DISTRICT 115 CATCH BY SPECIES BY WEEK BY W E SIZE
LYNN CANAL MESH SIZE STUDY PRELIMINARY DATA
"."
PINK ORANGE GREEN BLUE TOTAL CATCH (6- 114") (6") (5-34") (5-114")
PINK ORANGE GREEN BLUE (6- 114") (6') (5-314') (5-114")
PINK ORANGE GREEN BLUE (&Il4-1 (6') (5-94.) (5-114")
0 PINK ORANGE GREEN BLUE
(& ll4*) (6') (5-94') (5-114.)
PINK ORANGE CREE.. BLUE (6- IN') (6') ((.VJ') (S-Il4*)
22 29 8 32 42 67 52 0 * 3 - 8 0 0 0 0 0 I 0 0
rn-
CHUM 171 233 21 I SOCKEYE 1 2 132 158 PINK 47 84 130 KING 0 0 1
:: 0
COHO 0 1 I 0
GRAND TOTAL 1894 f


CPUE F o r S e a s o n Fema I e s
FREQ. P C T .
1 1 9 6 5 3 . 1 2 1 7 3 4 6 . 8 8
0 1 2 3 4 5
CPUE ( p e r H o u r )
M a l e s MESH 5 . 2 5
5 . 7 5
6 0 0
I
F R E O . P C T . 1 5 0 5 1 . 7 2 1 4 0 4 8 . 2 8
0 1 2 3 4 5
CPUE ( p e r H o u r )
A l l F i s h MESH F R E O . P C 1 5 . 2 5 3 4 7 5 2 3 4
3 1 6 4 7 . 6 6
0 1 2 3 4 5 6 7 8
CPUE ( p e r H o u r )
CPUE 2 . 9 7 2 . 6 3
CPUE
2 . 2 8 2 . 1 2
CPUE
5 . 2 7 4 . 8 0
Figure 2. Dis~rict 11 1 CPUE by mesh size by species-all weeks.

CPUE F o r W e e k 1 Fema l e s
MESH 5 . 2 5
FREQ. P C T .
1 2 3 4 0 . 3 5 3 4 5 9 . 6 5
MESH 5 . 2 5
1 2 3
CPUE ( p e r H o u r )
M a l e s F R E Q . P C T .
2 3 4 6 . 0 0 2 7 5 4 . 0 0
CPUE ( p e r H o u r )
A l l F i s h MESH 5 . 2 5
F R E Q . PCT . 4 6 4 2 . 9 9 6 1 5 7 . 0 1
CPUE ( p e r H o u r )
CPUE
1 . 7 6 2 . 6 0
CPUE 1 . 7 6 2 . 0 7
CPUE 3 . 5 2 4 . 6 7
District 11 1 CPUE by mesh sirc by spccies-Week 1.

CPUE F o r W e e k 2 Fema l e s
MESH FREQ. P C T . 5 . 2 5 7 4 7 9 . 5 7
1 9 2 0 . 4 3
CPUE 5 . 6 0 1 . 4 4
CPUE ( p e r H o u r )
M a l e s MESH 5 . 2 5
FREQ. P C T . 7 2 8 4 . 7 1 1 3 1 5 . 2 9
CPUE 5 . 4 5 0 . 9 8
11 9 . 7 3 l T ~ ~ ~ I ~ ' ~ ' l ' ' ~ ' l ' ' ~ ~ r ' ~ ~ ~ l ~ - ~ - l ~ ~ r ' l ~ ' ~ '
0 1 2 3 4 5 6 7 8 9
CPUE ( p e r H o u r )
A l l F i s h MESH 5 . 2 5
FREQ. PCT . 1 4 6 8 1 11
3 4 1 8 . 8 9
CPUE 1 1 . 0 5
2 . 5 7
CPUE ( p e r H o u r )
Dislricl 11 1, CPUE by mesh size by species-Week 2. Figure 4.

CPUE F o r W e e k 3 F e m a l e s
MESH 5 . 2 5
'FREQ. P C T .
1 6 1 5 1 . 6 9 5 7 4 8 . 3 1
0 1 2 3 4 5
CPUE ( p e r H o u r )
M a l e s MFSH FREQ. P C T .
3 1 3 9 . 7 4 4 7 6 0 . 2 6
MESH
0 1 2 3 4 5
CPUE ( p e r H o u r )
A l l F i s h FREO PCT
CPUE 4 . 3 2 4 . 0 4
CPUE 2 . 2 0 3 . 3 3
CPUE 6 . 5 2 7 . 3 7
0 1 2 3 4 5 6 7 8 9
CPUE ( p e r H o u r )
Figure 5. District 1.1 1 CPUE by mcsh size by species-Week 3.
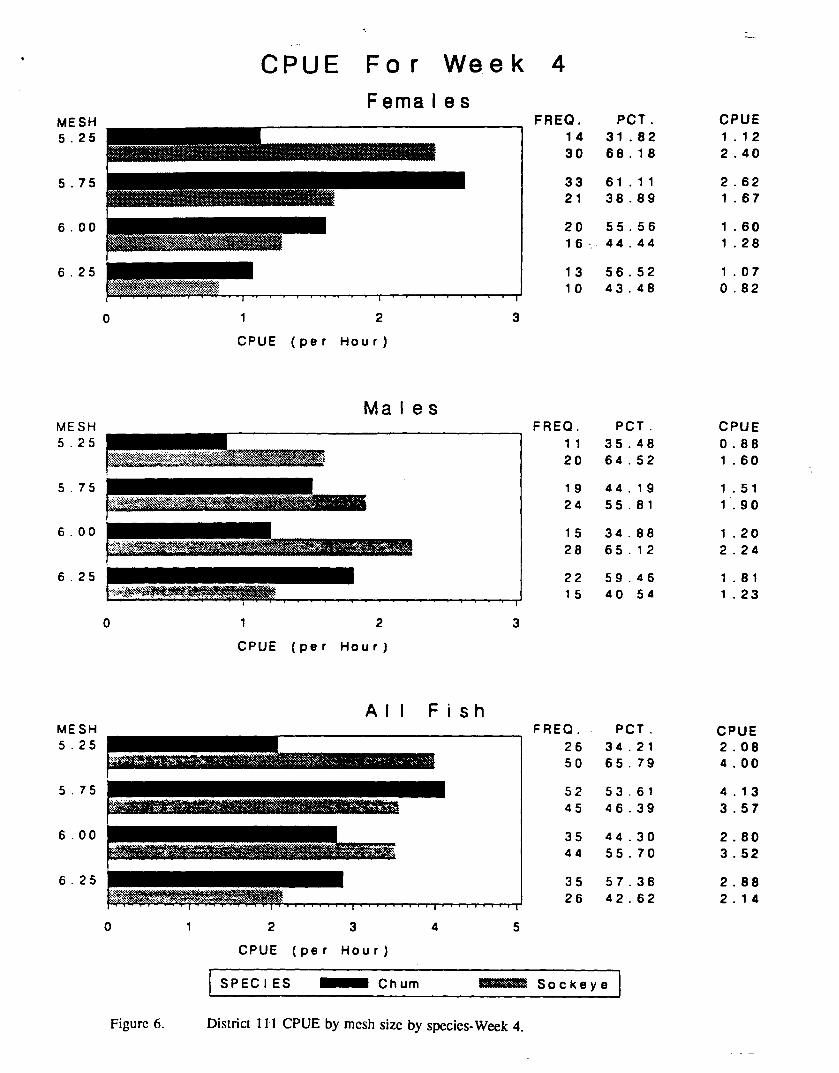
CPUE F o r W e e k 4 Fema l e s
FREQ. P C T . 1 4 3 1 . 8 2 3 0 6 8 . 1 8
CPUE 1 . 1 2 2 . 4 0
MESH 5 . 2 5
CPUE ( p e r H o u r )
M a l e s FREQ. PCT .
1 1 3 5 . 4 8 2 0 6 4 . 5 2
CPUE 0 . 8 8 1 . 6 0
MESH 5 . 2 5
CPUE ( p e r H o u r )
A t l F i s h MESH F R E O . PCT . 5 . 2 5 2 6 3 4 . 2 1
50 6 5 . 7 9
CPUE 2 . 0 8 4 . 0 0
CPUE ( p e r H o u r )
Figurc 6. Dislricl 1 1.1 CPUE by mcsh size by species- Week 4.
-

CPUE F o r W e e k 5 F e m a l e s
PCT . 4 2 . 1 1 5 7 . 8 9
CPUE 1 . 8 4 2 . 5 4
MESH 5 . 2 5
FREQ. 2 4 1
1 2
CPUE ( p e r H o u r )
M a l e s F R E Q .
1 3 3 3
CPUE 1 . 0 0 2 . 5 4
1 . 2 4 1 . 5 5
MESH 5 . 2 5
PCT . 2 8 . 2 6 7 1 . 7 4
CPUE ( p e r H o u r )
A l l F i s h MESH 5 . 2 5
F R E Q . 3 7
PCT 3 5 . 5 8 6 4 4 2
CPUE 2 . 8 4 5 . 1 5
CPUE ( p e r H o u r )
Figure 7. District 11 1 CPUE by mesh size by species-Week 5.
-

CPUE F o r S e a s o n F e m a l e s
M E S H FREQ. PCT. 5 . 2 5 8 3 4 6 . 6 3
9 5 5 3 . 3 7
C P U E 1 . 5 1 1 . 7 3
C P U E (per H o u r )
MESH F R E Q . P C T 5 2 5 1 0 1 5 6 . 4 2
7 8 4 3 . 5 8
CPUE 1 . 8 4 1 . 4 2
1 2
C P U E (per H o u r )
A l l F i s h CPUE 3 . 3 6 3 . 1 6
M E S H F R E Q . P C T 5 2 5 1 8 5 5 1 5 3
1 7 4 4 8 4 7
0 1 2 3 4 5
C P U E (per H o u r )
Figurc 8. District i15 CPUE by mcsh size by species-all weeks.

CPUE F o r W e e k 1 Fema l e s
MESH 5 . 2 5
FREO. P C T . 1 0 2 0 . 0 0 4 0 8 0 . 0 0
CPUE 0 . 9 9 3 . 9 4
0' 1 2 3 4
CPUE ( p e r H o u r )
M a l e s MESH 5 . 2 5
F R E Q . PCT .
1 2 1 3 6 . 8 4 3 6 6 3 . 1 6
CPUE 2 . 0 7 3 . 5 5
0 1 2 3
CPUE ( p e r H o u r )
A l l F i s h MESH 5 . 2 5
F R E Q . P C T .
1 3 2 2 9 . 3 6 7 7 7 0 . 6 4
CPUE 3 . 1 5 7 . 5 9
0 1 2 3 4 5 6 7 8
CPUE ( p e r H o u r )
Figurc 9. District 115 CPUE by mcsh sizc by species-Weck 1

CPUE F o r W e e k ' 2 F e m a l e s
FREQ. P C T . 3 4 8 5 . O O
6 1 5 . 0 0
MESH 5 . 2 5
CPUE 2 . 9 0 0 . 5 1
CPUE ( p e r H o u r )
M a l e s MESH
5 . 2 5 5 F R E Q . P C T .
4 4 9 5 . 6 5 2 4 . 3 5
CPUE 3 . 7 5 0 . 1 7
0 1 2 3 4 5 6
CPUE ( p e r H o u r )
A l l F i s h MESH F R E Q . PCT .
7 8 9 0 . 7 0 9 . 3 0
CPUE 6 . 6 4 0 . 6 8
0 2 4 6 8 1 0
CPUE ( p e r H o u r )
Figurc 10. District I15 CPUE by mesh size by species-Week 2.

CPUE F o r W e e k 3 F e m a l e s ,
FREQ. P C T . 3 1 6 . 6 7
1 5 8 3 . 3 3
CPUE 0 . 3 2 1 . 5 8
MESH 5 . 2 5
1
CPUE ( p e r H o u r )
M a l e s FREQ. PCT .
1 7 . 1 4 1 3 9 2 . 8 6
MESH 5 . 2 5
CPUE 0 . 1 1 1 . 3 7
1
CPUE ( p e r H o u r )
A l l F i s h MESH FREQ. PC7 . 5 . 2 5 4 1 2 . 5 0
2 8 8 7 . S O
CPUE 0 . 4 2 2 . 9 6
1 2
CPUE ( p e r H o u r )
Figurc 1 1 . District 1 15 CPUE by mesh size by species-Week 3.

CPUE F o r W e e k 4 Fema l e s
MESH FREQ. P C T . 5 . 2 5 3 2 8 8 . 8 9
4 1 1 . 1 1
CPUE ( p e r H o u r )
M a l e s
1 2 3 4
CPUE ( p e r H o u r )
A I I F i s h
FREQ. P C T . 3 1 8 6 . 1 1
5 1 3 . 8 9
MESH FREO. P C T . 5 . 2 5 6 3 8 7 . 5 0
9 1 2 . 5 0
5 . 7 5 5 2 8 6 . 6 7 8 1 3 . 3 3
6 . 0 0 6 3 84 . O O 1 2 1 6 . 0 0
6 . 2 5 4 2 8 9 . 3 6 5 1 0 . 6 4
CPUE 2 . 6 9 0 . 3 4
CPUE 2 . 6 1 0 . 4 2
CPUE 5 . 3 1 0 . 7 8
0 1 2 3 4 5 6
CPUE ( p e r H o u r )
SPEC1 ES Chum - S o c k e y e
Figurc 12. District 1 15 CPUE by mcsh size by species-Week 4.

CPUE F o r W e e k 5
MESH 5 . 2 5
Fema l e s FREQ. P C T .
4 1 1 . 7 6 3 0 8 8 . 2 4
I " "
0
I
1 2
CPUE ( p e r H o u r )
M a l e s MESH 5 . 2 5
MESH 5 . 2 5
1 2
CPUE ( p e r H o u r )
FREQ. P C T . 4 1 5 . 3 8
2 2 84 . 6 2
A l l F i s h FREQ. PC7 .
8 1 3 . 3 3 5 2 8 6 . 6 7
CPUE ( p e r H o u r )
CPUE 0 . 3 4 2 . 5 5
CPUE 0 . 3 4 1 . 8 7
CPUE 0 . 6 8 4 . 4 2
Figure 13. Disrricr 1'15 CPUE by mcsh sizc by species-Weck 5.

Proportion of Chum For Season Females
Mesh Si
All Fish
1.0
5 0.8 - c 0 --, 0.6 - C 0 E 0.4 - & 0 2 0.2 -
0.0
I I I I I
5.00 5.25 5.50 5.75 6.00
Mesh Si
-p-----------------------------------
&
-,
Estimated Proportion Actual Roportion
I I I I I 1
5.00 5.25 5.50 5.75 6.00 6.25 6.50
Mesh Size
Figurc 14. District 11 1. Proponion of chums to total chum/sockeye salmon catch by mesh size-all wccks.

Proportion of Chum For Week 1
Males
Females
5.25 5.50 5.75 6.00
Mesh Sue
1.0 - 5 0.8 - 6 -, 0.6 - C 0 g 0.4 - n 0 (r 0.2 -
0.0 -
All Fish
a I I I I I I
1.0 -'
5 0 8 -
5 -, 0 6 -
5 f 0 4 - 8 0 a' 0.2 -
0 0 -, I I I I I I
5.00 5.25 5.50 5.75 6.00 6.25 6.50
Mesh Size
5.00 5.25 5.50 5.75 6.00 625 6.50
Mesh Size
Estimated Proportion Actual Proportion I Figurc 15. District 1 I I . Proportion of chums to total chum/sockeye salmon catch by mesh sire-
Wcck 1 .

Proportion of Chum For Week 2 Females
Males
1.0 -r
f 0.8 - 5 -, 0.6 - C 0 g 0.4 - 8 h 0.2 -
0.0 1
5.25 5.50 5.75 6.00
Mesh Sme
c
I I I I I I
All Fish
5.00 5.25 5.50 5.75 6.00 625 6.50
Mesh S b
Mesh Size
I Estimated Ptoportion Actual Roporbon
Figurc 16. Dis~ricl 1 1 1 . Pmponion of shums to total chums/sockeye salmon calch by mesh size- Wcck 2.

Proportion of Chum For Week 3 Females
5.00 5.25 5.50 5.75 6.00 625 6.50
Mesh S i
Males
5.50 5.75 6.00
Mesh Sm
Mesh She
I ~stimsted Proportion ~ctua~ ~ o p o l l ~ n I Figurc 17. District i l I . Proponion of chums to total chum/sockeye salmon catch by mesh size-
Wcck 3.
Proportion of Chum For Week 4 Females
5.50 5.75 6.00 6.25
Mesh S i
1.0 -- E 0.8 - 3
6 -, 0.6 - C 0 g 0.4 - Q 0 s 0.2 -
0.0 -.
Males
District 3 1 1 . Proportion of chums lo total chum/sockeye salmon catch by mesh size- Wcck 4.
I I I I I li
1.0 -
5 0.8 - f -, 0.6 - S E 04- 8 0 & 02-
00-
5.00 5.25 5.50 5.75 6.00 , 625 6.50
Mesh S i
a

Proportion of Chum For Week 5 Females
I i I
5.50 5.75 6.00
Mesh SIZE
1.0 - g 0.8 - 5 -, 0.6 - C 0 g 0.4 - 8 L 0.2 -
0.0 -
Males
All Fish
- w
I I I I 1 f
1.0 --
5 0.8 - 6 --, 0.6 - 5 '- 0 4 - 'g % 0 2 -
Mesh Size
5.00 5.25 5.50 5.75 6.00 6.25 6.50
Mesh S i
I Estimated Proporbon Actual Roport~on
Figurc 19. District 11 1. Proponion of chums to total chumlsockeye salmon catch by mesh size- Wcck 5.

Proportion of Chum For Season
Males
Females 1.0 -r
5 0.8 - 5 --, 0.6 - C 0 E 0.4 - 0 n 0 & 0.2 -
0.0 7
5.00 5.25 5.50 5.75 6.00 6.25
Mesh Si2e
- - - v
1.0 -
5 0.8 - .c 0 -, 0.6 - c 0 F 0.4 - 8 0
ri: 0.2 - 0 0 -.
I Estimated Proportion Actual Proportion 1
I I 1 I I I - 5.00 5.25 5.50 5.75 6.00 6.25 6.50
Mesh Size
a
a a
I I 1 I I 1,
Figure 20. District 1.15. Proponion of chums to total chumlsockeye salmon catch by mesh size-all wccks.
5.00 5.25 5.50 5.75 6.00 6.25 6.50
Mesh S i

Proportion of Chum For Week 1
5.75 6.00
Mesh Si
Females
Estimated Proporban . Actual Roportron
1.0 - 5 0.8 - 5 5 0.6 - C g 0.4 - 8 & 0.2 -
0.0 --
Figurc 21. District 115. Proponion of chums to total chum/sockcye salmon catch by mesh size- Wcck 1.
I I I I I I
5.00 5.25 5.50 5.75 6.00 625 6.50
Mesh Si

Proportion of Chum For Week 2 Females
Mesh Sbe
Males
I Estimated Pmportion Actual Roporbon
All Fish
Figure 22.
1.0
5 0.8 - 6 -, 0.6 - S E 0 4 -
D & 0.2 -
0.0 -.
District 115. Proponion of chums to total chum/sockeye salmon catch by mesh size- Wcek 2.
+
I I I L I I
5.00 5.25 5.50 5.75 6.00 6.25 6.50
Mash Size

Proportion of Chum For Week 3 Females
Mesh Sue
1.0 - g 0.0 - 5 5 0.6 - C 0 $ 0 4 - Q 0 fi 0.2 -
0.0 -
Males
I I I 1 I I
1.0 - 5 0.8 - C 0 -, 0.6 - S 'E 0 4 - 8 0 h 0.2 -
I Estimated Proportion Acbd Proporbon 1
5.00 5.25 5.50 5.75 6.00 6.25 6.50
Mesh Si
All Fish
Figurc 23. District 115. Proponion of chums to total chum/sockeyc salmon catch by mesh size- Wcck 3.
1 0 -*
5 0.8 - 6 -, 0.6 - 5 C 0 4 - 8 0 h 0.2 -
0.0 - I I I I I
5.00 5.25 5.50 5.75 6.00 625 6.50
Mesh Sae

Proportion of Chum For Week 4 Females
Males
1.0 -'
5 0.0 - 5 5 0.6 - S g 0.4 - n. 0 a' 0.2 -
0.0 1
Mesh Sm
a a
I I I I I I
All Fsh
5.00 5.25 5.50 5.75 6.00 625 6.50
Mesh S b
I Eslimated Proporbon Actd Proportion
Figurc 24. District 1.15. Proponion of chums to total chum/sockeye salmon catch by mesh size- Wcck 4.

Proportion of Chum For Week 5 Females
5.00 5.25 5.50 5.75 6.00 62!5 6.50
Mesh She
Males
I mimated Proporbon Actual Proportion
All Fsh
Figurc 25. District 1'15. Proportion of chums to total chum/sockeye catvch by mcsh size-Week 5 .
1.0
5 0.8 - 5 -, 0.6 - 6 -e 0 4 - a 0 (j: 0.2 -
0.0 -
-p-----------------------------------
I I 1 I I 1-

