cash, receivables, and inventory management -...
TRANSCRIPT
Cash, Receivables, and Inventory Management
Learning Objectives
1 Understand the problems inherent in managing Managing the Firm’s Investment in Cash the firm’s cash balances. and Marketable Securities
2 Evaluate the costs and benefits associated with Managing the Firm’s Investment in managing a firm’s credit policies. Accounts Receivable
3 Understand the financial costs and benefits of Managing the Firm’s Investment in managing the firm’s investment in inventory. Inventory
W-1
At the end of 2011, the Walt Disney Company (DIS) held 5.1 percent of its total assets of approximately $73.9 billion in the form of cash and short-term marketable securities. During 2011, Disney generated sales revenues of $40,893 million. Based on a 365-day year, this means Disney “produced” $112,035,616 in sales revenues each day. If Disney could have freed up only 1 day’s worth of sales and invested it in 3-month U.S. Treasury bills yielding 1 percent, the firm’s before-tax profits would have jumped by $1,120,356. That is a signifi-cant sum, and it demonstrates why firms like to have efficient treasury management departments in place. Share-holders enjoy the added profits that should, in turn, increase the market value of their common stock holdings.
Now, if Disney’s managers felt it could bear just a tad more risk, then the freed-up cash might be invested in bank certificates of deposit (CDs) of a similar maturity yielding 1.2 percent to investors. That difference of a mere 20 basis points (1.20% - 1.00%) may not seem like much, but when you put it to work on an investment of over $112 million, it produces a tidy income. Thus, by investing the excess cash in CDs rather than in Treasury bills, Disney’s before-tax profits would be $224,071 greater ($1,344,427 - $1,120,356). This might be enough for the firm to hire a new business school graduate or two—just like you.
Managing the cash and the marketable-securities portfolio are important tasks for the financial executive. This chapter teaches you about sophisticated cash management systems and about prudent places to “park” the firm’s excess cash balances so they earn a positive rate of return and are liquid at the same time. We also explore sound management techniques that relate to the other asset components of the firm’s working capital— accounts receivable and inventory.
17

Chapter 15 provided an introduction and over-view of the concept of working-capital manage-ment. In this chapter, we explore the management of the asset components of the working-capital equation. Accordingly, we focus on the alterna-tives available to managers for increasing share-holder wealth with respect to the most important types of current assets: (1) cash and marketable se-curities, (2) accounts receivable, and (3) inventory. These are listed in order of declining liquidity.
Such alternatives include (1) techniques available to management for favorably influencing cash receipt and disbursement patterns, (2) investments that allow a firm to employ excess cash balances productively, (3) critical decision formulas for determining the ap-propriate amount of investment in accounts receiv-able, and (4) methods, such as those pertaining to order quantity and order point issues, for evaluating the most suitable levels of inventory.
These issues are important to the financial manager for several reasons. For example, judi-cious management of cash and near-cash assets allows the firm to hold the minimum amount of cash necessary to meet the firm’s obligations in a timely manner. As a result, the firm is able to take advantage of the opportunity to earn a return on its liquid assets and increase its profitability.
With this in mind, we begin the study of cur-rent asset management by exploring the various aspects of the management of cash and marketable securities. Afterward, we analyze the important issues related to the management of accounts receivable and inventory.
Managing the Firm’s Investment in Cash and Marketable SecuritiesBefore proceeding to our discussion of cash management, it will be helpful to distinguish among several terms. Cash is the currency and coin the firm has on hand in petty cash drawers, in cash registers, or in checking accounts (demand deposit accounts) at various commercial banks. Marketable securities, also called near cash or near-cash assets, are security investments that the firm can quickly convert into cash balances. Generally, firms hold marketable securities with very short maturity periods—less than 1 year. Together, cash and marketable securities constitute the most liquid assets of a firm.
Why a Company Holds CashA thorough understanding of why and how a firm holds cash requires an accurate look at how cash flows into and through the enterprise. Figure 17-1 depicts the process of cash generation and disposition in a typical manufacturing setting. The arrows designate the direction of the flow—that is, whether the cash balance increases or decreases.
The Cash-Flow Process The irregular increases in the firm’s cash holdings can come from several external sources. Funds can be obtained in the financial markets from the sale of securities such as bonds, preferred stock, and common stock, or the firm can enter into
W-2W-2
cash currency and coins plus demand deposit accounts.
marketable securities security investments (financial assets) the firm can quickly convert to cash balances. Also known as near cash or near-cash assets.
1 Understand the problems inherent in managing the firm’s cash balances.

W-3 Part 5 • Working-Capital Management and International Business Finance
nonmarketable-debt contracts with lenders such as commercial banks. These irregular cash inflows do not occur on a daily basis. The reason is that external financing contracts, or ar-rangements, usually involve huge sums of money stemming from a major need identified by the company’s management, and these needs do not occur every day. For example, a new product might be in the launching process, or a plant expansion might be required to provide added productive capacity.
In most organizations the financial officer responsible for cash management also con-trols the transactions that affect the firm’s investment in marketable securities. As excess cash becomes temporarily available, marketable securities are purchased. By contrast, when cash is in short supply, a portion of the marketable-securities portfolio is liquidated.
Whereas the irregular cash inflows are from external sources, the other main sources of cash arise from internal operations and occur on a more regular basis. Over long periods, the largest receipts come from accounts-receivable collections and, to a lesser extent, from direct cash sales of finished goods. Many manufacturing concerns also generate cash on a regular basis through the liquidation of scrap or obsolete inventory. At various times fixed assets may also be sold, thereby generating some cash inflow.
Apart from the investment of excess cash in near-cash assets, the cash balance ex-periences reductions for three key reasons. First, on an irregular basis, withdrawals are made to (1) pay cash dividends on preferred and common stock shares, (2) meet interest requirements on debt contracts, (3) repay the principal borrowed from creditors, (4) buy the firm’s own shares in the financial markets for use in executive compensation plans or as an alternative to paying a cash dividend, and (5) pay tax bills. Again, by an irregular basis, we mean items not occurring on a daily or frequent schedule. Second, the company’s capital expenditure program designates that fixed assets be acquired at various intervals. Third, inventories are purchased on a regular basis to ensure a steady flow of finished goods rolls off the production line. Note that the arrow linking the in-vestment in fixed assets with the inventory account is labeled depreciation. This indicates that a portion of the cost of fixed assets is charged against the products coming off the assembly line. This cost is subsequently recovered through the sale of the finished-goods inventory. This is because the product’s selling price will be set by managers to cover all of the costs of production, including depreciation.
Motives for Holding Cash The influences that affect the firm’s cash balance can be clas-sified in terms of the three motives put forth by economist John Maynard Keynes: (1) the transactions motive, (2) the precautionary motive, and (3) the speculative motive.1
1John Maynard Keynes, The General Theory of Employment, Interest, and Money (New York: Harcourt Brace Jovanovich, 1936).
FIgURE 17-1 The Cash generation and Disposition Process
Irregular cash outflows
Irregular cash inflows• Bond sales• Other debt contracts• Preferred stock sales• Common stock sales
OutIn
Purchase
Purchase
Depreciation Credit sales
Cash sales CollectionsSale
Labor and material
Sale
• Dividends• Interest• Principal on debt• Share repurchases• Taxes
Fixed assets Inventory Receivables
Marketablesecurities
Cashbalance

Chapter 17 • Cash, Receivables, and Inventory Management W-4
The Transactions Motive Balances held for transaction purposes allow the firm to meet its cash needs that arise in the ordinary course of doing business. In Figure 17-1, cash would be used to meet the irregular outflows as well as the planned acquisition of fixed assets and inventories. The relative amount of cash needed to satisfy transaction requirements is affected by a number of factors, including the industry in which the firm operates. It is well known that utilities can forecast cash receipts quite accurately because of stable demand for their services. Computer software firms, however, have a more difficult time predicting their cash flows. In this industry, new products are brought to market at a rapid pace, thereby making it difficult to project cash flows and balances precisely.
The Precautionary Motive Precautionary balances serve as a buffer. This motive for holding cash relates to the maintenance of balances used to satisfy possible, but as yet unknown, needs.
The cash-flow predictability of the firm has a material influence on this precaution-ary motive. The airline industry provides a typical illustration. Air passenger carriers are plagued with a high degree of cash-flow uncertainty. The weather, rising fuel costs, and continual strikes by operating personnel make cash forecasting difficult for any airline. The upshot of this problem is that because of all of the things that might happen, the minimum cash balances desired by air carriers tend to be large.
In actual business practice, the precautionary motive is met to a large extent by the holding of a portfolio of liquid assets, not just cash. Notice in Figure 17-1 the two-way flow of funds between the company’s holdings of cash and marketable securities. In large corpo-rate organizations, funds may flow either into or out of the marketable-securities portfolio on a daily basis.
The Speculative Motive Cash is held for speculative purposes in order to take ad-vantage of potential profit-making situations. Construction firms that build private dwellings will, at times, accumulate cash in anticipation of a significant drop in lumber costs. If the price of building supplies does drop, the companies that built up their cash balances stand to profit by purchasing materials in large quantities. This will reduce their cost of goods sold and increase their net profit margins. Generally, the specula-tive motive is the least important component of a firm’s preference for liquidity. The transactions and precautionary motives account for most of the reasons why a company holds cash balances.
Cash Management Objectives and DecisionsThe Risk–Return Trade-Off A company-wide cash management program must be con-cerned with minimizing the firm’s risk of insolvency. In the context of cash management, the term insolvency describes the situation in which the firm is unable to meet its maturing liabilities on time. In such a case the company is technically insolvent in that it lacks the neces-sary liquidity to make prompt payment on its current debt obligations. A firm could avoid this problem by carrying large cash balances to pay the bills that come due.
The financial manager must strike an acceptable balance between holding too much cash and too little cash. This is the focal point of the risk–return trade-off. A large cash in-vestment minimizes the chances of insolvency, but it penalizes the company’s profitability. A small cash investment frees up excess balances for investment in both marketable securi-ties and longer-lived assets; this enhances profitability and the value of the firm’s common shares, but it also increases the chances of the firm running out of cash.
Objectives The risk–return trade-off can be reduced to two prime objectives for the firm’s cash management system.
1. Enough cash must be on hand to meet the disbursal needs that arise in the course of doing business.
2. Investment in idle cash balances must be reduced to a minimum.
Evaluating these objectives and meeting them gives rise to the need for some typical cash management decisions.
insolvency the inability to meet interest payments or to repay debt at maturity.

W-5 Part 5 • Working-Capital Management and International Business Finance
float the length of time from when a check is written until the actual recipient can draw upon the funds.
Decisions Two conditions or ideals would allow the firm to operate for extended pe-riods with cash balances near or at zero: (1) a completely accurate forecast of its net cash flows over the planning horizon and (2) perfect synchronization of its cash receipts and disbursements.
Cash-flow forecasting is the initial step in any effective cash management program. Given that the firm will, as a matter of necessity, invest in some cash balances, certain types of decisions related to the size of those balances dominate the cash management process. These include decisions that answer the following questions:
1. What can be done to speed up cash collections and slow down or better control cash outflows?
2. What should be the composition of the firm’s marketable-securities portfolio?
Collection and Disbursement ProceduresThe efficiency of the firm’s cash management program can be improved by (1) accelerating cash receipts and (2) improving the methods used to disburse cash. In simple terms the firm improves its cash management system by speeding up collections and slowing down disbursements.
Managing the Cash Inflow—Speeding Up Collections Figure 17-2 illustrates the cash collection system for a firm that does not utilize any advanced methods to enhance the speed of its collections. Note that there are three key events that delay the time it takes the firm to actually get the customer’s money. These delays are referred to as float.
◆ First, the customer sends the payment to the firm through the mail. The time required to receive the check is called mail float.
◆ Second, the firm processes the check internally to record the account to which the pay-ment belongs and then sends the check on to the firm’s bank to begin the process of transferring funds from the customer to the company. The time required to process the check by the company is called processing float.
◆Finally, the company’s bank sends the check through the check-clearing system used by banks to actually transfer funds from the customer’s account to the firm’s account. The time required to accomplish this is referred to as transit float.
Speeding up the firm’s collection process simply involves reducing the float that enters into the collection process in each of these three ways. The “lockbox” arrangement described shortly is probably the most widely used tool for speeding up the collection process and thereby reducing the float.
FIgURE 17-2 Ordinary Cash Collection System
Customer U.S.mail
Clearingsystem
Customer’sbank
Firm’sheadquarters
Firm’sbank
Checks are placed inthe mail.
1
Mail isdelivered.
2
Funds are now availablein the firm’s bank account.
7
Checks are forwarded.
Checks arepaid.
6
(Mail float)
(Transit float)
(Processing float)3
45
Checks are processedand deposited in
local bank.

Chapter 17 • Cash, Receivables, and Inventory Management W-6
E x A M P L E 17.1 Estimating the value of a float reduction
Suppose that we want to estimate the value of a 1-day float reduction for Starbucks Cor-poration. Starbucks’ 2008 sales revenues were reported at $10.383 billion. Let’s assume that prudent investment in money-market securities will earn 4 percent annually. We ask, what is the estimated value of a 1-day float reduction to Starbucks?
STEP 1: FORMULATE A SOLUTION STRATEGY
a. Annual revenues/days in year = 1-day float reductionb. 1-day float reduction * assumed yield = annual (before-tax) value of the float
reduction
STEP 2: CRUNCH THE NUMBERSFor Starbuck’s in 2008:a. $10.383 billion/365 = $28,446,575b. $28,446,575 * 0.04 = $1,137,863
STEP 3: ANALYZE YOUR RESULTSThus, 1 day’s freed-up balances for Starbucks will be $28,446,575. Then we find the annual (before-tax) value of the float reduction is $1,137,863. Profits like these make it worthwhile for the firm and its treasury manager to closely evaluate the cash manage-ment services offered by commercial banks—even when the bank fees can also be quite costly. We learn how to make decisions of this nature later in the chapter.
The Lockbox Arrangement The lockbox system is the most widely used commercial bank-ing service for expediting cash gathering. Banks have offered this service since 1946. Such a system speeds up the conversion of receipts into usable funds by reducing both the mail and processing float of payments. In addition, it is possible to reduce transit float if lockboxes are located near Federal Reserve Banks and their branches. For large corporations that receive checks from all parts of the country, float reductions of 2 to 4 days are not unusual.
The lockbox arrangement in Figure 17-3 is based on a simple procedure. The firm’s customers are instructed to mail their remittance checks not to company headquarters or regional offices, but to a numbered post office box. The bank that is providing the lockbox service is authorized to open the box, collect the mail, process the checks, and deposit the checks directly into the company’s account.
FIgURE 17-3 Simple Lockbox System
Checks are placed inthe mail.
1 2
Funds are nowavailable in the firm’s
bank account.8
Local bank opens thelockbox and processes
checks for deposit.
Checks are forwarded by thefirm’s bank for paymentby the customer’s bank.
Checks are paid.7
6 5
4
3
Lockbox
Information report
U.S.mail
Customer
Firm’sheadquarters
Customer’sbank
Clearingsystem
Firm’sbank

W-7 Part 5 • Working-Capital Management and International Business Finance
In the introduction to this chapter we calculated the 2011 sales per day for Disney to be in excess of $112 million and assumed the firm could invest its excess cash in marketable securities to yield 1 percent annually. If Disney could speed up its cash collections by 4 days, it would be to the firm’s advantage. Specifically, the gross annual savings to Disney (apart from operating the lockbox system) would amount to $4.481 million as follows:
(Sales per day) * (days of float reduction) * (assumed yield) = gross annual savings(+112,035,616) * (4) * (0.01) = $4,481,424
As you might guess, the prospects for generating revenues of this magnitude are important not only to the firms involved but also to commercial banks that offer lockbox services.
Lockbox services are not free, however. Usually, the bank levies a charge for each check processed through the system. The benefits derived from the acceleration of receipts must exceed the incremental costs of the lockbox system or the firm would be better off without it. Later in this chapter, a straightforward method for assessing the desirability of a specific cash management service, such as the lockbox arrangement, is illustrated.
Managing the Cash Outflow—Slowing Down Disbursements The objective of man-aging cash outflows is to increase the company’s float by slowing down the disbursement process. This is exactly the opposite of our objective of managing cash collections. There are several tools at the disposal of the cash manager for accomplishing this end, and we describe two here. These are the use of (1) zero balance accounts and (2) payable-through drafts. (See Table 17-1.)
Zero Balance Accounts Large corporations that operate multiple branches, divisions, or subsidiaries often maintain numerous bank accounts (in different banks) for the purpose of making timely operating disbursements. It does make good business sense for payments for purchased parts that go into, say, an automobile transmission to be made by the Transmis-sion and Chassis Division of the auto manufacturer rather than its central office.
Zero balance accounts (ZBA) permit centralized control (at the headquarters level) over the firm’s cash outflows while maintaining divisional disbursing authority. Under this system the firm’s authorized employees, representing their various divisions, continue to write checks on their individual accounts. Note that the numerous individual disbursing accounts are now all located in the same “concentration” bank. Actually these separate accounts contain no funds at all, thus the label, “zero balance.”
The firm’s authorized agents write their payment checks as usual against their specific accounts. These checks clear through the banking system in the usual way. On a daily basis the checks are presented to the firm’s concentration bank (the drawee bank) for payment. As the checks are paid by the bank, negative (debit) balances build up in the proper disburs-ing accounts. At the end of each day the negative balances are restored to a zero level by means of credits to the ZBAs; a corresponding reduction of funds is then made against the firm’s concentration (master) demand deposit account.
Payable-Through Drafts Payable-through drafts (PTD) are legal instruments that have the physical appearance of ordinary checks but are not drawn on a bank. Instead, payable-through drafts are drawn on and payment is authorized by the issuing firm against its demand deposit account.
zero balance accounts (ZBA) a cash management tool that permits centralized control over cash outflow while maintaining divisional disbursing authority. Objectives are (1) to achieve better control over cash payments; (2) to reduce excess cash balances held in regional banks for disbursing purposes; and (3) to increase disbursing float.
payable-through draft (PTD) a legal instrument that has the physical appearance of an ordinary check but is not drawn on a bank. A payable-through draft is drawn on and paid by the issuing firm. The bank serves as a collection point and passes the draft on to the firm.
TABLE 17-1 Selected Cash Disbursal Techniques: A Summary
Technique Objectives How Accomplished
Zero balance accounts (1) Achieve better control over cash payments,(2) reduce excess cash balances held in regional
banks, and possibly(3) increase disbursing float.
Establish zero balance accounts for all of the firm’s disbursing units. These accounts are all in the same concentration bank.
Checks are drawn against these accounts, with the balance in each account never exceeding $0. Divisional disbursing authority is thereby maintained at the local level of management.
Payable-through drafts Achieve effective central-office control over field-authorized payments.
Field office issues drafts rather than checks to settle up payables.
Chapter 17 • Cash, Receivables, and Inventory Management W-8
Like checks, the drafts are cleared through the banking system and are presented to the issuing firm’s bank. The bank serves as a collection point and passes the drafts on to the firm. The corporate issuer usually has to return by the following business day all drafts it does not wish to cover (pay). Those documents not returned to the bank are automatically paid. The firm inspects the drafts for validity by checking signatures, amounts, and dates. Stop-payment orders can be initiated by the company on any drafts considered inappropriate.
The main purpose of using a payable-through draft system is to provide for effec-tive control over field payments. The firm’s central office can control payments begun by the regional units because the drafts are reviewed in advance of their final payment. Payable-through drafts, for example, are used extensively in the insurance industry. The claims agent does not typically have check-signing authority against a corporate disbursement account. This agent can issue a draft, however, for quick settlement of a claim.
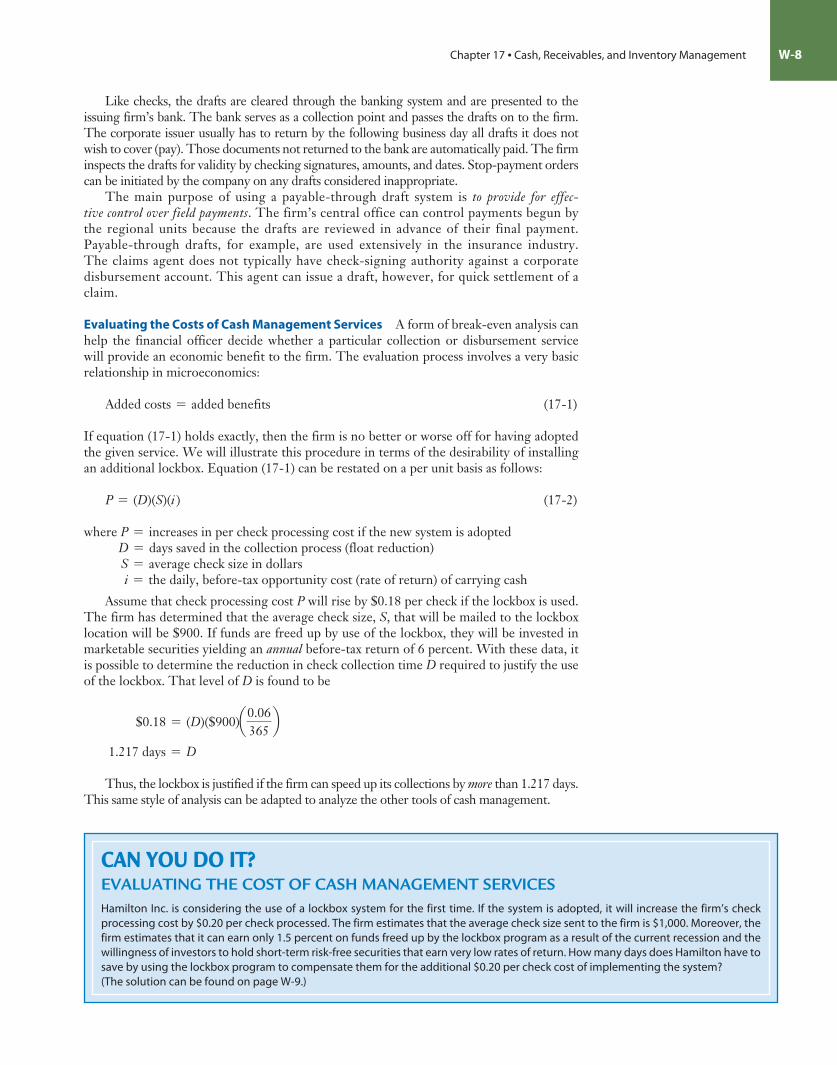
Evaluating the Costs of Cash Management Services A form of break-even analysis can help the financial officer decide whether a particular collection or disbursement service will provide an economic benefit to the firm. The evaluation process involves a very basic relationship in microeconomics:
Added costs = added benefits (17-1)
If equation (17-1) holds exactly, then the firm is no better or worse off for having adopted the given service. We will illustrate this procedure in terms of the desirability of installing an additional lockbox. Equation (17-1) can be restated on a per unit basis as follows:
P = (D)(S)(i ) (17-2)
where P = increases in per check processing cost if the new system is adoptedD = days saved in the collection process (float reduction)S = average check size in dollarsi = the daily, before-tax opportunity cost (rate of return) of carrying cash
Assume that check processing cost P will rise by $0.18 per check if the lockbox is used. The firm has determined that the average check size, S, that will be mailed to the lockbox location will be $900. If funds are freed up by use of the lockbox, they will be invested in marketable securities yielding an annual before-tax return of 6 percent. With these data, it is possible to determine the reduction in check collection time D required to justify the use of the lockbox. That level of D is found to be
$0.18 = (D)($900)a0.06365b
1.217 days = D
Thus, the lockbox is justified if the firm can speed up its collections by more than 1.217 days. This same style of analysis can be adapted to analyze the other tools of cash management.
Can You Do It?EvALUATING THE COST OF CASH MANAGEMENT SERvICESHamilton Inc. is considering the use of a lockbox system for the first time. If the system is adopted, it will increase the firm’s check processing cost by $0.20 per check processed. The firm estimates that the average check size sent to the firm is $1,000. Moreover, the firm estimates that it can earn only 1.5 percent on funds freed up by the lockbox program as a result of the current recession and the willingness of investors to hold short-term risk-free securities that earn very low rates of return. How many days does Hamilton have to save by using the lockbox program to compensate them for the additional $0.20 per check cost of implementing the system?(The solution can be found on page W-9.)

W-9 Part 5 • Working-Capital Management and International Business Finance
The Composition of a Marketable-Securities PortfolioEarlier we described two fundamental decision problems related to cash management. The first related to managing the firm’s cash collections and disbursements procedures. The second involved managing the firm’s portfolio of marketable securities, which serve as an important source of liquidity for the firm.
general Selection Criteria Certain criteria can provide a financial manager with a useful framework for selecting a proper marketable-securities mix. These considerations include evaluating the (1) financial risk, (2) interest rate risk, (3) liquidity, (4) taxability, and (5) yields among different financial assets. The following sections briefly delineate these crite-ria from the investor’s viewpoint.
Financial Risk Financial risk here refers to the uncertainty of expected returns from a security attributable to possible changes in the financial capacity of the security issuer to make future payments to the security owner. If the chance of default on the terms of the instrument is high (or low), then the financial risk is said to be high (or low).
Interest Rate Risk Interest rate risk, of course, refers to the uncertainty of expected returns from a financial instrument attributable to changes in interest rates. Of particular concern to the corporate treasurer is the price volatility associated with instruments that have long, as opposed to short, terms to maturity. An illustration can help clarify this point.
Suppose the financial officer is weighing the merits of investing temporarily available corporate cash in a new offering of U.S. Treasury obligations that will mature in either 3 years or 20 years from the date of issue. The purchase prices of the 3-year notes or 20-year bonds are at their par values of $1,000 per security. The maturity value of either class of security is equal to par, $1,000, and the coupon rate (stated interest rate) is set at 7 percent, compounded annually.
If after 1 year from the date of purchase prevailing interest rates rise to 9 percent, the market prices of these currently outstanding Treasury securities will fall to bring their yields to maturity in line with what investors could obtain by buying a new issue of a given instrument. The market prices of both the 3-year and 20-year obligations will therefore
DID You Get It?EvALUATING THE COST OF CASH MANAGEMENT SERvICESEquation 17-2 defines the per check cost of operating a lockbox system as follows:
P = D * S * i/365
where P = the increase in the per check processing cost under the lockbox systemD = the days saved in the collection process by the initiation of the lockbox system (that is, the reduction in float)S = the average check sizei = the before-tax opportunity cost of holding cash such that i/365 is the daily opportunity cost
We know that P is $0.20 per check, so we can solve for the days saved in the check collection process needed to justify the system as follows:
P = D * S *i
365+0.20 = D * +1,000 * 0.015/365
Solving for D we get
+0.20 = D * +1,000 * 0.015/365
D =+0.20
+1,000 * 0.015/365=
+0.20+1,000 * 0.015/365
= 4.86 days

Chapter 17 • Cash, Receivables, and Inventory Management W-10
decline. The price of the 20-year instrument will decline by a greater dollar amount, how-ever, than that of the 3-year instrument.
One year from the date of issue, the price obtainable in the marketplace for the original 20-year instrument, which now has 19 years to go to maturity, can be found by computing P as follows:
P = a19
t=1
$70(1 + 0.09)t +
$1,000(1 + 0.09)19 = $821.10
where t is the year in which the particular return, either interest or principal amount, is received; $70 is the annual interest payment; and $1,000 is the contractual maturity value of the bond. The rise in interest rates has forced the market price of the bond down to $821.01.
What will happen to the price of the note that has 2 years remaining to maturity? In a similar manner, we can compute its price, P:
P = a2
t=1
$70(1 + 0.09)t +
$1,000(1 + 0.09)2 = $964.82
The market price of the shorter-term note will decline to $964.84. Table 17-2 shows that the market value of the shorter-term security was penalized much less by the given rise in the general level of interest rates.
If we extended the illustration, we would see that, in terms of market price, a 1-year security would be affected less than a 2-year security, a 91-day security less than a 182-day security, and so on. Equity securities would exhibit the largest price changes because of their infinite maturity periods. To hedge against the price volatility caused by interest rate risk, the firm’s marketable-securities portfolio will tend to be composed of instruments that mature over short periods.
Liquidity In the present context of managing the marketable-securities portfolio, liquidity refers to the ability to transform a security into cash. Should an unforeseen event require that a significant amount of cash be immediately available, then a sizable portion of the portfolio might have to be sold. The financial manager will want the cash quickly and will not want to accept a large price concession in order to convert the securities. Thus, when choosing the securities for the firm’s portfolio, the manager must consider (1) the period needed to sell the security and (2) the likelihood that the security can be sold at or near its prevailing market price.
Taxability The tax treatment of the income a firm receives from its security investments does not affect the ultimate mix of the marketable-securities portfolio as much as the crite-ria mentioned earlier. This is because the interest income from most instruments suitable for inclusion in the portfolio is taxable at the federal level. Still, some corporate treasurers seriously evaluate the taxability of interest income and capital gains.
The interest income from only one class of securities escapes the federal income tax. That class of securities is generally referred to as municipal obligations, or more simply as municipals. Because of the tax-exempt feature of interest income from state and local gov-ernment securities, municipals sell at lower yields to maturity in the market than securities that pay taxable interest. The after-tax yield on a municipal obligation, however, could be
TABLE 17-2 Market Price Effect of Rise in Interest Rates
ItemThree-Year Instrument
Twenty-Year Instrument
Original price $1,000.00 $1,000.00Price after 1 year 964.82 821.10Decline in price $ 35.18 $ 178.90

W-11 Part 5 • Working-Capital Management and International Business Finance
higher than the yield from a non-tax-exempt security. This would depend mainly on the purchasing firm’s tax situation.
Consider Table 17-3. A firm is assumed to be analyzing whether to invest in a 1-year tax-free debt issue yielding 6 percent on a $1,000 outlay or a 1-year taxable issue that yields 8 percent on a $1,000 outlay. The firm pays federal taxes at the rate of 34 percent. The yields quoted in the financial press and in the prospectuses that describe debt issues are before-tax returns. The actual after-tax return enjoyed by the investor depends on his or her tax bracket. Notice that the actual after-tax yield received by the firm is only 5.28 percent on the taxable issue versus 6 percent on the tax-exempt obligation. The lower portion of Table 17-3 shows that the fully taxed bond must yield 9.091 percent to make it comparable with the tax-exempt issue.
Yields The final selection criterion that we mention is a significant one—the yields that are available on the different financial assets suitable for inclusion in the near-cash portfolio. By now it is probably obvious that the factors of (1) financial risk, (2) interest rate risk, (3) liquidity, and (4) taxability all influence the available yields on financial instruments. The yield criterion involves an evaluation of the risks and benefits inherent in all of these fac-tors. For example, if a given risk is assumed, such as lack of liquidity, a higher yield will be expected on the nonliquid instrument.
Figure 17-4 summarizes our framework for designing the firm’s marketable-securities portfolio. The four basic considerations are shown to influence the yields available on se-curities. The financial manager must focus on the risk–return trade-offs. Coming to grips with these trade-offs will enable the financial manager to determine the proper marketable-securities mix for the company. Let us look now at the marketable securities prominent in firms’ near-cash portfolios.
FIgURE 17-4 Designing the Marketable-Securities Portfolio
Considerations Influence Focus upon Determine
Financial riskInterest rate risk
LiquidityTaxability
Yields Risk vs. returnpreferences
Marketable-securities
mix
TABLE 17-3 Comparing After-Tax Yields
Tax-Exempt Debt Issue
(6% Coupon)
Taxable Debt Issue
(8% Coupon)
Interest income $ 60.00 $ 80.00Income tax (0.34) 0.00 27.20After-tax interest income $ 60.00 $ 52.80After-tax yield $60.00
$1,000.00= 6%
$52.80$1,000.00
= 5.28%
Derivation of the equivalent before-tax yield on a taxable debt issue:
r =r*
1 - T=
0.061 - 0.34
= 9.091%
where r = the equivalent before-tax yieldr* = the after-tax yield on the tax-exempt securityT = the firm’s marginal income tax rate
Proof: Interest income ($1,000 * 0.09091) $ 90.91
Income tax (0.34) $ 30.91
After-tax interest income $ 60.00

Chapter 17 • Cash, Receivables, and Inventory Management W-12
Marketable-Security Alternatives Money-market securities generally have short-term maturity and are highly marketable. Consequently, they can be quickly liquidated if the firm needs the cash. Table 17-4 summarizes the characteristics of the most widely used money-market securities in terms of five key attributes: (1) the denominations in which securities are available; (2) the maturities that are offered; (3) the basis used (for example, whether the security is sold at a discount or offers coupon interest payments); (4) the liquid-ity of the instrument, which relates principally to the availability of a secondary market for the security; and (5) taxability of the investment returns.
What type of return can the financial manager expect on a marketable-securities portfolio? This is a reasonable question. Some insight can be obtained by looking at the past, although we must realize that future returns are not guided by past experience. It is also useful to have some understanding of how the returns on one type of instrument stack up against another. The behavior of yields on short-term debt instruments over the 1980 to 2011 period is shown in Table 17-5. The most striking feature of this data is the very low rates of return earned on these short-term investments. In fact, the return on short-term (3-month) T-bills is only 0.05 percent, which is virtually zero. These rates reflect the easy money policies followed by the Federal Reserve since the 2007–2009 recession.
TABLE 17-4 Features of Selected Money-Market Instruments
Instruments Denominations Maturities Basis Liquidity Taxability
U.S. Treasury bills— direct obligations of
the U.S. government
$1,000 and increments of
$1,000
91 days, 182 days,
and 4 weeks
Discount Excellent secondary
market
Exempt from state and local income
taxes
Federal agency securities—obligations
of corporations and agencies created to effect the federal government’s lending programs
Wide variation; from $1,000
to $1 million
5 days (Farm Credit
consolidated discount notes) to more than 10 years
Discount or coupon;
usually on coupon
Good for issues of “big five”
agencies
Generally exempt at local level; FNMA
issues are not exempt
Bankers’ acceptance— drafts accepted for
future payment by commercial banks
No set size; typically range
from $25,000 to $1 million
Predominantly from 30 to
180 days
Discount Good for acceptances of
large “money- market” banks
Taxed at all levels of government
Negotiable certificates of deposit—marketable
receipts for funds deposited in a bank for a fixed time period
$25,000 to $10 million
1 to 18 months Accrued interest
Fair to good Taxed at all levels of government
Commercial paper— short-term unsecured
promissory notes
$5,000 to $5 million; $1,000
and $5,000 multiples above the initial offering size are sometimes available.
3 to 270 days Discount Poor; no active secondary
market in usual sense
Taxed at all levels of government
Repurchase agreements— legal contracts between
a borrower (security seller) and lender (security buyer). The borrower will repurchase at the contract price plus an interest charge.
Typical sizes are $500,000 or
more.
According to terms of
contract
Not applicable Fixed by the agreement;
that is, borrower will repurchase
Taxed at all levels of government
Money-market mutual funds—holders of
diversified portfolios of short-term, high-grade debt instruments
Some require an initial
investment as small as $1,000.
Shares can be sold at any
time.
Net asset value Good; provided by the fund
itself
Taxed at all levels of government

W-13 Part 5 • Working-Capital Management and International Business Finance
2 Evaluate the costs and benefits associated with managing a firm’s credit policies.
TABLE 17-5 Annual Yields (Percent) on Selected 3-Month Marketable Securities
Year T-Bills Commercial Paper CDs
1980 11.51% 12.66% 13.07%1985 7.48% 7.95% 8.05%1990 7.51% 8.06% 8.15%1995 5.51% 5.93% 5.92%1996 5.01% 5.42% 5.39%1997 5.06% 5.60% 5.62%1998 4.78% 5.37% 5.47%1999 4.64% 5.22% 5.33%2000 5.82% 6.33% 6.46%2001 3.40% 3.65% 3.71%2002 1.61% 1.69% 1.73%2003 1.01% 1.11% 1.15%2004 1.03% 1.41% 1.57%2005 3.15% 3.22% 3.51%2006 4.73% 4.98% 5.16%2007 4.36% 5.02% 5.25%2008 1.37% 2.01% 2.73%2009 0.15% 0.18% 0.3%2010 0.14% 0.18% 0.24%2011 0.05% 0.12% 0.20%
Source: Federal Reserve Statistical Release G.13 (415), various issues, and Statistical Supplement to the Federal Reserve Bulletin, November 2008.
FInanCIal DeCIsIon tools
Name of Tool Formula What It Tells You
Equivalent before-tax yield on taxable debt (r)
After@tax yield on a tax exempt bond (r*)
1 - Marginal tax rate (T )
The rate of return that must be earned on a taxable security (r) that must be earned to be equivalent to the untaxed yield on a non-taxed security (r*)
Concept Check 1. Describe the typical cash-flow cycle for a firm.
2. What are the three motives for holding cash?
3. Describe the relationship between the firm’s cash management program and the firm’s risk of insolvency.
4. What are the fundamental decisions that the financial manager must make with respect to cash management?
5. Define float and its origins in the cash management process (that is, mail processing and transit).
6. What is a lockbox arrangement and how does its use reduce a firm’s float?
7. Describe the use of the break-even concept with respect to the management of cash.
8. Define the terms financial risk and interest rate risk.
Managing the Firm’s Investment in Accounts ReceivableWe now turn from the most liquid of the firm’s current assets (cash and marketable securi-ties) to those that are less liquid—accounts receivable and inventories. All firms by their very nature are involved in selling either goods or services. Although some of these sales will be for cash, a large portion will involve credit. Whenever a sale is made on credit, it

Chapter 17 • Cash, Receivables, and Inventory Management W-14
increases the firm’s accounts receivable. Thus, the importance of how a firm manages its accounts receivable depends on the degree to which the firm sells on credit.
Accounts receivable typically comprise more than 25 percent of a firm’s assets. In effect, when we discuss the management of accounts receivable, we are discussing the management of one-quarter of the firm’s assets. Moreover, because the cash flows from a sale cannot be invested until the account is collected, the control of receivables takes on added importance in that it affects both the profitability and liquidity of the firm.
The size of the investment in accounts receivable is determined by several factors. First, the percentage of the firm’s credit sales to total sales affects the level of accounts receivable held. Although this factor certainly plays a major role in determining a firm’s investment in accounts receivable, it generally is not within the control of the financial manager. The na-ture of the business tends to determine the blend between credit sales and cash sales. A large grocery store tends to sell exclusively on a cash basis, whereas most construction-lumber supply firms make their sales primarily on credit.
The level of sales is also a factor in determining the size of the investment in accounts receivable. Very simply, the more sales, the greater the accounts receivable. It is not a deci-sion variable for the financial manager, however.
The final determinants of the level of investment in accounts receivable are the firm’s credit and collection policies—more specifically, the terms of sale, the quality of the cus-tomer, and the collection efforts. These policies are under the control of the financial man-ager. The terms of sale specify both the time period during which the customer must pay and the terms, such as penalties for late payments or discounts for early payments. The type of credit customer also affects the level of investment in accounts receivable. For example, the acceptance of poorer-credit-risk customers and their subsequent delinquent payments may lead to an increase in accounts receivable. The strength and timing of the collection efforts can affect the period for which past-due accounts remain delinquent, which in turn affects the level of accounts receivable. Collection and credit policy decisions can further affect the level of investment in accounts receivable by causing changes in the sales level and the ratio of credit sales to total sales. The factors that determine the level of investment in accounts receivable are displayed in Figure 17-5.
The Terms of Sale—A Decision VariableUsing the annual percentage rate (APR), in Chapter 15 we analyzed the approximate cost of short-term credit from the perspective of the firm that pays for the credit. Likewise we can utilize the APR to solve for the rate of return realized on the credit offered by the firm to its own customers.
The terms of sale identify the possible discount for early payment, the discount period, and the total credit period. They are generally stated in the form a/b, net c, indicating that the cus-tomer can deduct a percent if the account is paid within b days; otherwise, the account must
terms of sale the credit terms identifying the possible discount for early payment.
FIgURE 17-5 Determinants of Investment in Accounts Receivable
Percent ofcredit sales to
total sales
Credit andcollectionpolicies
Length oftime beforecredit sales
are collected
Investment inaccountsreceivable
Level ofcredit salesLevel of sales
Terms of saleType of customer
Collection efforts
Deci
sion
var
iabl
esN
onde
cisi
on v
aria
bles

W-15 Part 5 • Working-Capital Management and International Business Finance
be paid within c days. Thus, for example, trade credit terms of 2/10, net 30, indicate that a 2 percent discount can be taken if the account is paid within 10 days; otherwise it must be paid within 30 days. Failing to take the discount represents a cost to the customer. For instance, if the terms are 2/10, net 30, the annualized opportunity cost of passing up this 2 percent discount in order to withhold payment for an additional 20 days is 36.73 percent. This is determined as follows:
Annualized opportunity cost of forgoing the discount =a
1 - a*
360c - b
(17-3)
Substituting the values from the example, we get
36.73% =0.02
1 - 0.02*
36030 - 10
Typically the discount ranges anywhere from 12 to 10 percent, whereas the discount
period is generally 10 days and the total credit period varies from 30 to 90 days. Although the terms of credit vary radically from industry to industry, they tend to remain relatively uniform within any particular industry. Moreover, the terms tend to remain relatively con-stant over time, and they do not appear to be used frequently as a decision variable.
The Type of Customer—A Decision VariableA second decision variable involves determining the type of customer who qualifies for trade credit. Several costs are always associated with extending credit to less-creditworthy cus-tomers. First, it is important that the firm be able to identify which of its customers is a poor risk. However, when more time is spent investigating the less-creditworthy customer, the costs of credit investigation increase.
Default costs also vary directly with the quality of the customer. As the customer’s credit rating declines, the chance that the account will not be paid on time increases. In the extreme case, payment never occurs. Thus, taking on less-creditworthy customers results in increases in default costs.
Collection costs also increase as the quality of the customer declines. More delin-quent accounts force the firm to spend more time and money collecting them. Overall, the decline in customer quality results in increased costs of credit investigation, collec-tion, and default.
In determining whether to grant credit to an individual customer, we are primarily interested in the customer’s short-run financial well-being. Thus, its liquidity ratios, other obligations, and overall profitability are the focal point in this analysis. Credit-rating ser-vices, such as Dun & Bradstreet, provide information on the financial status, operations, and payment history for most firms. Other possible sources of information include credit bureaus, trade associations, chambers of commerce, competitors, bank references, public financial statements, and, of course, the firm’s past relationship with the customer.
One way in which both individuals and firms are often evaluated as credit risks is through the use of credit scoring. Credit scoring involves the numerical evaluation of each applicant. An applicant receives a score based on answers to a simple set of questions. This score is then evaluated according to a predetermined standard to determine whether credit should be extended. The major advantage of credit scoring is that it is inexpensive and easy to perform. For example, once the standards are set, a computer or clerical worker without any specialized training can easily evaluate any applicant.
The techniques used for constructing credit-scoring indexes range from simply adding up the default rates associated with the answers given to each question to sophis-ticated evaluations using multiple discriminant analysis (MDA). MDA is a statistical tech-nique for calculating the appropriate importance to assign each question used in evaluating the applicant.
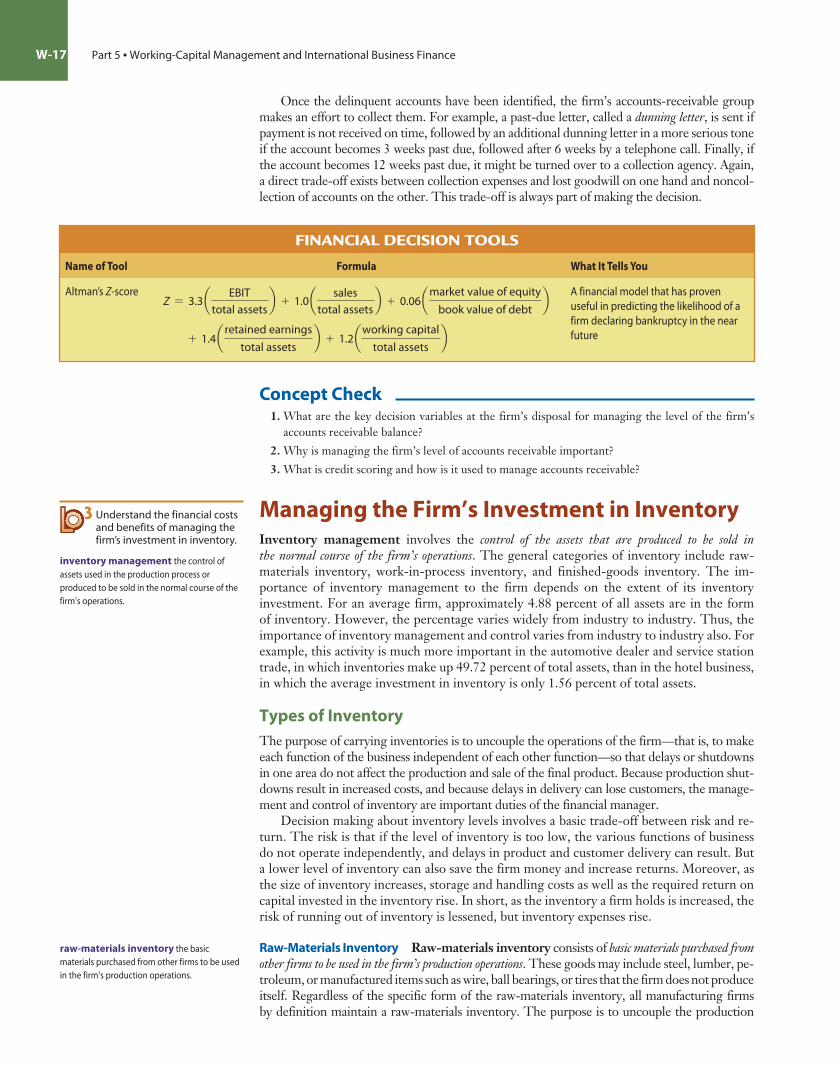
Finance professor Edward Altman used multiple discriminant analysis to identify busi-nesses that might go bankrupt. In his landmark study, Altman used financial ratios to de-velop the following index:
credit scoring the numerical evaluation of credit applicants where the score is evaluated relative to a predetermined standard.

Chapter 17 • Cash, Receivables, and Inventory Management W-16
Z = 3.3a EBITtotal assets
b + 1.0 a salestotal assets
b + 0.06 amarket value of equitybook value of debt
b (17-4)
+ 1.4 aretained earningstotal assets
b + 1.2 aworking capitaltotal assets
b
Thus, to use the Altman Z-score model to predict a firm’s likelihood of bankruptcy, we sub-stitute the firm’s values for each of the predictor variables on the right-hand side of equa-tion (17-4). Altman found that firms that went bankrupt within a year’s time tended to have a Z-score below 2.7, whereas firms that did not go bankrupt had Z-scores larger than 2.7.
E x A M P L E 17.2 Using the credit-scoring model
STEP 1: FORMULATE A SOLUTION STRATEGYTo see how the credit-scoring model is used, let’s consider the credit application of Jamison Electric Corporation. Column D contains the products of the credit-scoring model coef-ficients found in column B and Jamison’s financial attributes found in column C.
Product = coefficient * firm valueSum of the products = credit score
STEP 2: CRUNCH THE NUMBERS
0.33 + 0.85 + 0.24 + 0.28 + 0.30 = 2.00
STEP 3: ANALYZE YOUR RESULTSAdding up all the individual product terms produces a credit score of 2.00. Because this credit score is less than 2.7, we would anticipate that there is a high likelihood that Jamison will become bankrupt sometime during the coming year.2
2We should caution the user that the Z-score model is not a perfect predictor (although it was quite good). For example, of 100 firms that actually did go bankrupt over the period of 1 year, Altman found that the model correctly classified 94 firms. Similarly, of 100 firms that did not go bankrupt, the model correctly classified 97 as nonbankrupt.
The Collection Effort—A Decision VariableThe key to maintaining control over the collection of accounts receivable is the fact that the probability of default increases with the age of the account. Thus, eliminating past-due receivables is key. One common way of evaluating the situation is with ratio analysis. The financial manager can determine whether accounts receivable are under control by examin-ing the average collection period, the ratio of receivables to assets, the ratio of credit sales to receivables (called the accounts-receivable turnover ratio), and the amount of bad debts relative to sales over time. In addition, the manager can perform what is called an aging of accounts receivable to provide a breakdown in both dollars and percentages of the propor-tion of receivables that are past due. Comparing the current aging of receivables with past data offers even more control.
W-17 Part 5 • Working-Capital Management and International Business Finance
Once the delinquent accounts have been identified, the firm’s accounts-receivable group makes an effort to collect them. For example, a past-due letter, called a dunning letter, is sent if payment is not received on time, followed by an additional dunning letter in a more serious tone if the account becomes 3 weeks past due, followed after 6 weeks by a telephone call. Finally, if the account becomes 12 weeks past due, it might be turned over to a collection agency. Again, a direct trade-off exists between collection expenses and lost goodwill on one hand and noncol-lection of accounts on the other. This trade-off is always part of making the decision.
3 Understand the financial costs and benefits of managing the firm’s investment in inventory.
inventory management the control of assets used in the production process or produced to be sold in the normal course of the firm’s operations.
raw-materials inventory the basic materials purchased from other firms to be used in the firm’s production operations.
FInanCIal DeCIsIon tools
Name of Tool Formula What It Tells You
Altman’s Z-scoreZ = 3.3 a EBIT
total assetsb + 1.0 a sales
total assetsb + 0.06 amarket value of equity
book value of debtb
+ 1.4 a retained earnings
total assetsb + 1.2 aworking capital
total assetsb
A financial model that has proven useful in predicting the likelihood of a firm declaring bankruptcy in the near future
Concept Check 1. What are the key decision variables at the firm’s disposal for managing the level of the firm’s
accounts receivable balance?
2. Why is managing the firm’s level of accounts receivable important?
3. What is credit scoring and how is it used to manage accounts receivable?
Managing the Firm’s Investment in InventoryInventory management involves the control of the assets that are produced to be sold in the normal course of the firm’s operations. The general categories of inventory include raw-materials inventory, work-in-process inventory, and finished-goods inventory. The im-portance of inventory management to the firm depends on the extent of its inventory investment. For an average firm, approximately 4.88 percent of all assets are in the form of inventory. However, the percentage varies widely from industry to industry. Thus, the importance of inventory management and control varies from industry to industry also. For example, this activity is much more important in the automotive dealer and service station trade, in which inventories make up 49.72 percent of total assets, than in the hotel business, in which the average investment in inventory is only 1.56 percent of total assets.
Types of InventoryThe purpose of carrying inventories is to uncouple the operations of the firm—that is, to make each function of the business independent of each other function—so that delays or shutdowns in one area do not affect the production and sale of the final product. Because production shut-downs result in increased costs, and because delays in delivery can lose customers, the manage-ment and control of inventory are important duties of the financial manager.
Decision making about inventory levels involves a basic trade-off between risk and re-turn. The risk is that if the level of inventory is too low, the various functions of business do not operate independently, and delays in product and customer delivery can result. But a lower level of inventory can also save the firm money and increase returns. Moreover, as the size of inventory increases, storage and handling costs as well as the required return on capital invested in the inventory rise. In short, as the inventory a firm holds is increased, the risk of running out of inventory is lessened, but inventory expenses rise.
Raw-Materials Inventory Raw-materials inventory consists of basic materials purchased from other firms to be used in the firm’s production operations. These goods may include steel, lumber, pe-troleum, or manufactured items such as wire, ball bearings, or tires that the firm does not produce itself. Regardless of the specific form of the raw-materials inventory, all manufacturing firms by definition maintain a raw-materials inventory. The purpose is to uncouple the production

Chapter 17 • Cash, Receivables, and Inventory Management W-18
function from the purchasing function—that is, to make these two functions independent of each other—so delays in the shipment of raw materials do not cause production delays. In the event of a delay, the firm can satisfy its need for raw materials by liquidating its inventory.
Work-in-Process Inventory Work-in-process inventory consists of partially finished goods requiring additional work before they become finished goods. The more complex and lengthy the pro-duction process, the larger the investment in work-in-process inventory. The purpose of work-in-process inventory is to uncouple the various operations in the production process so that machine failures and work stoppages in one operation will not affect other operations. Assume, for example, there are 10 different production operations, each one involving the piece of work produced in the previous operation. If the machine performing the first production operation breaks down, a firm with no work-in-process inventory will have to shut down all 10 production operations. But if a firm has work-in-process inventory, all remaining 9 operations can continue by drawing the input for the second operation from inventory.
Finished-goods Inventory Finished-goods inventory consists of goods on which produc-tion has been completed but that are not yet sold. The purpose of a finished-goods inventory is to uncouple the production and sales functions so that it is not necessary to produce the goods before a sale can occur—sales can be made directly out of inventory. In the auto industry, for example, a person would not buy from a dealer who made them wait weeks or months when another dealer could fill the order immediately.
Stock of Cash Although we have already discussed cash management at some length, it is worthwhile to mention cash again in the light of inventory management. This is because the stock of cash carried by a firm is simply a special type of inventory. In terms of uncoupling the various operations of the firm, the purpose of holding a stock of cash is to make the payment of bills independent of the collection of accounts due. When cash is kept on hand, bills can be paid without prior collection of accounts.
Inventory Management TechniquesAs we explained, the importance of effective inventory management is directly related to the size of the investment in inventory. The effective management of these assets is essential to the goal of maximizing shareholder wealth. To control the investment in inventory, man-agers must solve two problems: the order quantity problem and the order point problem.
The Order Quantity Problem The order quantity problem involves determining the optimal order size for an inventory item given its expected usage, carrying costs, and ordering costs.
The economic order quantity (EOQ) model attempts to determine the order size that will minimize total inventory costs. It assumes that
Totalinventory costs
=total
carrying costs+
totalordering costs
(17-5)
Assuming the inventory is allowed to fall to zero and then is immediately replenished (this assumption will be lifted when we discuss the order point problem), the average inventory becomes Q/2, where Q is inventory order size in units. This can be seen graphically in Figure 17-6.
If the average inventory is Q/2 and the carrying cost per unit is C, then carrying costs become
Totalcarrying costs
= aorder size2
bacarrying costper unit
b
= aQ2b C (17-6)
where Q = the inventory order size in unitsC = the carrying cost per unit
order quantity problem determining the optimal order size for an inventory item given its usage, carrying costs, and ordering costs.
finished-goods inventory goods on which the production has been completed but that are not yet sold.
work-in-process inventory partially finished goods requiring additional work before they become finished goods.

W-19 Part 5 • Working-Capital Management and International Business Finance
The carrying costs on inventory include the required rate of return on investment in inventory, in addition to warehouse or storage costs, wages for those who operate the warehouse, and costs associated with having too little inventory on hand. Thus, carrying costs include both real cash flows and the opportunity costs associated with having funds tied up in inventory.
The ordering costs incurred are equal to the ordering costs per order times the number of orders. If we assume total demand over the planning period is S, and we order in lot sizes of Q, then S/Q represents the number of orders over the planning period. If the ordering cost per order is O, then
Totalordering costs
= a numberof orders
baordering costper order
b (17-7)
= a SQb O (17-7a)
where S = total demand in units over the planning periodO = ordering cost per order
Thus, total costs in equation (17-5) become
Total costs = aQ2b C + a S
Qb O (17-8)
Figure 17-7 illustrates this equation graphically.What we are looking for is the order size Q* that provides the minimum total costs. By
manipulating equation (17-8), we find that the optimal value of Q—that is, the economic order quantity (EOQ)—is
Q* = A2SOC
(17-9)
Can You Do It?CALCULATING THE ECONOMIC ORdER QUANTITYSuppose that a firm expects total demand (S) for its product next year to be 5,000 units. Moreover, to place an order the firm incurs an ordering cost (O) of $200, and the carrying cost per unit (C) is $2. What is the economic order quantity (Q*) for the company?(The solution can be found on page W-21.)
FIgURE 17-6 Inventory Level and the Replenishment Cycle
Time
Inve
ntor
y le
vel (
units
)
Order quantity (Q)
Inventory replenished
Averageinventory
order quantity2
Q2
=
=

Chapter 17 • Cash, Receivables, and Inventory Management W-20
Assumptions of the EOQ Model Despite the fact that the EOQ model tends to yield quite good results, there are weaknesses associated with several of its assumptions. How-ever, when its assumptions have been dramatically violated, the EOQ model can generally be modified to accommodate the situation. The model’s assumptions are as follows:
1. Constant, or uniform, demand. Although the EOQ model assumes constant demand, demand may vary from day to day. If demand is stochastic—that is, not known in advance—the model must be modified through the inclusion of a safety stock.
2. A constant unit price. The inclusion of variable prices resulting from quantity dis-counts can be handled quite easily through a modification of the original EOQ model and then redefining total costs and solving for the optimum order quantity.
3. Constant carrying costs. Unit carrying costs can vary substantially as the size of the inventory rises, perhaps decreasing because of economies of scale or storage efficien-cies or increasing as storage space runs out and new warehouses have to be rented. This situation can be handled through a modification in the original model similar to the one used for variable unit price.
4. Constant ordering costs. Although this assumption is generally valid, its violation can be accommodated by modifying the original EOQ model in a manner similar to the one used for variable unit prices.
5. Instantaneous delivery. If delivery is not instantaneous, which is generally the case, the original EOQ model must be modified through the inclusion of a safety stock, that is, the inventory held to accommodate any unusually large and unexpected usage dur-ing the delivery time.
6. Independent orders. If multiple orders result in cost savings by reducing paperwork and transportation cost, the original EOQ model must be further modified. Although this modification is somewhat complicated, special EOQ models have been developed to deal with it.
These assumptions illustrate the limitations of the basic EOQ model and the ways in which it can be modified to compensate for them. An understanding of the limitations and assumptions of the EOQ model provides the financial manager with more of a base for mak-ing inventory decisions.
The Order Point Problem The two most limiting assumptions—those of constant or uniform demand and instantaneous delivery—are dealt with through the inclusion of safety stock, which is the inventory held to accommodate any unusually large and unexpected usage
safety stock inventory held to accommodate any unusually large and unexpected usage during delivery time.
FIgURE 17-7 Total Costs and EOQ Determination
Order size (units)
Ordering costs = O( )SQ
Cost
(dol
lars
)
EOQ
Carrying costs = C( )Q2
Totalcosts = +C( )Q
2 O( )SQ

W-21 Part 5 • Working-Capital Management and International Business Finance
DID You Get It?CALCULATING THE ECONOMIC ORdER QUANTITYEquation (17-9) defines the economic order quantity (EOQ) relationship:
Q* = A2SOC
where Q* = the economic order quantity, or EOQ, which minimizes the costs of ordering and holding an inventoryS = the total number of units of inventory the firm will need over the coming year
O = the cost of placing an orderC = the carrying cost per unit of inventory
Substituting into the EOQ equation we estimate
Q* = A2 * 5,000 * $200$2
= 21,000,000 = 1,000 units
Thus, the costs of ordering and carrying an inventory is minimized when we order 1,000 units each time an offer is placed.
FIgURE 17-8 Order Point Determination
Stock to bedepleted duringdelivery time
Inventoryorderpoint
Safetystock
EOQ
Actual delivery time
Time
Inve
ntor
y le
vel (
units
)
Inventory replenished
delivery-time stock the inventory needed between the order date and the receipt of the inventory ordered.
order point problem determining how low inventory should be depleted before it is reordered.
during delivery time. The decision about how much safety stock to hold is generally referred to as the order point problem; that is, how low should inventory be depleted before it is reordered?
Two factors go into the determination of the appropriate order point: (1) the procurement or delivery-time stock and (2) the safety stock desired. Figure 17-8 graphs the process involved in order point determination. We observe that the order point problem can be decomposed into its two components, the delivery-time stock—that is, the inventory needed between the order date and the receipt of the inventory ordered—and the safety stock. Thus, the order point is reached when inventory falls to a level equal to the delivery-time stock plus the safety stock.
Inventory order point(order new inventory
when the level of inventoryfalls to the level)
=delivery@time
stock+
safetystock
(17-10)

Chapter 17 • Cash, Receivables, and Inventory Management W-22
anticipatory buying buying in anticipation of a price increase to secure goods at a lower cost.
just-in-time inventory control system a production and management system in which inventory is cut down to a minimum through adjustments to the time and physical distance between the various production operations. Under this system the firm keeps a minimum level of inventory on hand, relying upon suppliers to furnish parts “just in time” for them to be assembled.
As a result of constantly carrying safety stock, the average level of inventory increases. Whereas before the inclusion of safety stock the average level of inventory was equal to EOQ/2, now it will be
Average inventory =EOQ
2+ safety stock (17-11)
In general, several factors simultaneously determine how much delivery-time stock and safety stock should be held. First, the efficiency of the replenishment system affects how much delivery-time stock is needed. Because the delivery-time stock is the expected inven-tory usage between ordering and receiving inventory, the efficient replenishment of inven-tory would reduce the need for delivery-time stock.
The uncertainty surrounding both the delivery time and the demand for the product affects the level of safety stock needed. The more certain the patterns of these inflows and outflows from the inventory, the less safety stock required. In effect, if these inflows and outflows are highly predictable, then there is little chance of any stock-out occurring. However, if they are unpredictable, it becomes necessary to carry additional safety stock to prevent unexpected stock-outs.
The safety margin desired also affects the level of safety stock held. If it is a costly experience to run out of inventory, the safety stock held will be larger than it would be oth-erwise. If running out of inventory and the subsequent delay in supplying customers result in strong customer dissatisfaction and the possibility of lost future sales, then additional safety stock is necessary. A final determinant is the cost of carrying additional inventory, in terms of both the handling and storage costs and the opportunity cost associated with the investment in additional inventory. Very simply, the greater the costs, the smaller the safety stock.
Over the past decade or so, a different technique aimed at reducing the firm’s in-vestment in inventory has been adopted by numerous companies. It is known as the just-in-time inventory control system. The aim is to operate with the lowest average level of inventory possible. Within the EOQ model, the basics are to reduce (1) ordering costs and (2) safety stocks. This is achieved by attempting to receive an almost con-tinuous flow of deliveries of component parts. The result is to actually have about 2 to 4 hours’ worth of inventory on hand. In effect, trucks, railroads, and airplanes become the firm’s warehouses. This system has spawned a new emphasis on the dual relation-ship between the firm and its suppliers.
Inflation and EOQ Inflation affects the EOQ model in two major ways. First, although the EOQ model can be modified to assume constant price increases, often major price increases occur only once or twice a year and are announced ahead of time. If this is the case, the EOQ model may lose its predictability and may be replaced with anticipatory buying—that is, buying in anticipation of a price increase to secure the goods at a lower cost. Of course, as with most decisions, there are trade-offs. The costs are the added carry-ing costs associated with the inventory. The benefits, of course, come from buying at a lower price. The second way inflation affects the EOQ model is through increased carrying costs. As inflation pushes interest rates up, the cost of carrying inventory in-creases. In our EOQ model this means that C increases, which results in a decline in Q*, the optimal economic order quantity.
TQ* = A2SOCc
(17-12)
Concept Check 1. Describe the types of inventory that firms have.
2. What is the fundamental objective of the economic order quantity (EOQ) formula?
3. What assumptions underlie the EOQ formula?

Chapter Summaries
Understand the problems inherent in managing the firm’s cash balances. (pgs. W-2–W-13)
SUMMARY: The firm experiences both regular and irregular cash flows. Once cash is obtained, the firm has three motives for holding cash rather than investing it: to satisfy transactions, precau-tionary, and speculative liquidity needs. To a certain extent, such needs can be satisfied by holding readily marketable securities rather than cash. A significant challenge of cash management, then, is dealing with the trade-off between the firm’s need to have cash on hand to pay liabilities that arise in the course of doing business and the objective of maximizing wealth by minimizing idle cash balances that earn no return.
KEY TERMS
1
FInanCIal DeCIsIon tools
Name of Tool Formula What It Tells You
Total inventory costs total carrying costs + total ordering costs
The costs of maintaining an inventory consist of the cost of investing cash tied up in inventory (carrying costs) and the cost of ordering replenishments (order costs).
Total carrying costsaverage units in inventory * carrying cost per unit
=order size
2* carrying cost per unit
The dollar cost of having money invested in the firm’s average inventory balance
Total ordering costs
number of orders placed per year * cost of placing on order
= a Sales (S)order quantity (Q)
b * O
Total annual cost of placing orders based on the number of orders placed and the cost of placing each order
Economic order quantity (EOQ or Q*) A2 * sales (S) * order cost (O)
carrying cost (C)
The quantity to order each time an order is placed so as to mini-mize the total inventory costs
W-23 Part 5 • Working-Capital Management and International Business Finance
Cash, page W-2, currency and coins plus demand deposit accounts.Marketable securities, page W-2, security investments (financial assets) the firm can quickly convert to cash balances. Also known as near cash or near-cash assets.Insolvency, page W-4, the inability to meet interest payments or to repay debt at maturity.
Float, page W-5, the length of time from when a check is written until the actual recipient can draw upon the funds.Zero balance accounts (ZBA), page W-7, a cash management tool that permits centralized control over cash outflow while maintaining divisional disbursing authority. Objectives are (1) to achieve better control over cash payments; (2) to reduce excess cash balances

Chapter 17 • Cash, Receivables, and Inventory Management W-24
held in regional banks for disbursing purposes; and (3) to increase disbursing float.Payable-through draft (PTD), page W-7 a legal instrument that has the physical appearance
of an ordinary check but is not drawn on a bank. A payable-through draft is drawn on and paid by the issuing firm. The bank serves as a collection point and passes the draft on to the firm.
KEY EQUATIONS
P = D * S * i
whereP = increases in per check processing cost if the new system is adopted.D = days saved in the collection process (i.e., float reduction).i = the daily, before-tax opportunity cost of carrying cash.
Evaluate the costs and benefits associated with managing a firm’s credit policies. (pgs. W-13–W-17)
SUMMARY: When we consider that accounts receivable constitute approximately 25 percent of total assets for the typical firm, the importance of accounts-receivable management becomes even more apparent. The size of a firm’s investment in accounts receivable depends on three factors: the percentage of credit sales to total sales, the level of sales, and the credit and collection policies of the firm. The financial manager, however, generally has control only over the terms of the sale, the quality of the customer, and the collection efforts.
KEY TERMS
2
Terms of sale, page W-14 the credit terms identifying the possible discount for early payment.
Credit scoring, page W-15 the numerical evaluation of credit applicants where the score is evaluated relative to a predetermined standard.
KEY EQUATIONS
Annual opportunity cost of passing up a cash discount =a
1 - a*
360c - b
wherea is cash discount percent, b is the number of days until payment in order to receive the cash discount, and c is the total number of days until the full invoice must be paid.
Z = 3.3 a EBITtotal assets
b + 1.0 a salestotal assets
b + 0.06 amarket value of equitybook value of debt
b
+ 1.4 aretained earningstotal assets
b + 1.2 aworking capitaltotal assets
b
Understand the financial costs and benefits of managing the firm’s investment in inventory. (pgs. W-17–W-23)
SUMMARY: Although the level of investment in inventories by the typical firm is less than the invest-ment in accounts receivable, inventory management and control remains an important function of the financial manager because inventories play a significant role in the operations of the firm. The purpose of holding inventory is to make each function of the business independent of the other functions. The primary issues related to inventory management are: (1) How much inventory should be ordered? and (2) When should the order be placed? The EOQ model is used to answer the first of these questions. The order point model, which depends on the desired levels of delivery-time stock and safety stock, is applied to answer the second question. The relatively new just-in-time approach to inventory control is growing in popularity as an attempt to obtain additional cost savings by reducing the level of inventory a firm needs to have on hand. Instead of depending solely on its own inventories, the firm relies on its vendors to furnish supplies “just in time” to satisfy the firm’s production requirements.
3

W-25 Part 5 • Working-Capital Management and International Business Finance
KEY TERMS
Inventory management, page W-17, the control of assets used in the production process or produced to be sold in the normal course of the firm’s operations.Raw-materials inventory, page W-17, the basic materials purchased from other firms to be used in the firm’s production operations.Work-in-process inventory, page W-18, partially finished goods requiring additional work before they become finished goods.Finished-goods inventory, page W-18, goods on which the production has been completed but that are not yet sold.Order quantity problem, page W-18, determining the optimal order size for an inventory item given its usage, carrying costs, and ordering costs.Safety stock, page W-20, inventory held to accommodate any unusually large and unexpected usage during delivery time.
Order point problem, page W-21, deter-mining how low inventory should be depleted before it is reordered.Delivery-time stock, page W-21, the inventory needed between the order date and the receipt of the inventory ordered.Just-in-time inventory control system, page W-22, a production and management system in which inventory is cut down to a minimum through adjustments to the time and physical distance between the various production operations. Under this system the firm keeps a minimum level of inventory on hand, relying upon suppliers to furnish parts “just in time” for them to be assembled.Anticipatory buying, page W-22, buying in anticipation of a price increase to secure goods at alower cost.
KEY EQUATIONS
Totalinventory costs
=total
carrying costs+
totalordering costs
Totalcarrying costs
= aorder size2
bacarrying costper unit
b
= aQ2b C
Totalordering costs
= a numberof orders
baordering costper order
b
= a SQbO
Total costs = aQ2bC + a S
QbO
Q* = A2SOC
Inventory order point(order new inventory
when the level of inventoryfalls to the level)
=delivery@time
stock+
safetystock
Average inventory =EOQ
2+ safety stock
TQ* = A2SOCc
Review QuestionsAll Review Questions are available in MyFinanceLab.
17-1. The Walt Disney Corporation (DIS) held $3.766 billion in cash on December 31, 2011, and total assets of $73.877 billion. Although this may seem extreme, it pales in comparison with Apple

Chapter 17 • Cash, Receivables, and Inventory Management W-26
Computers (AAPL), which had $30 billion in cash and short-term investments and $138 billion in total assets. Why do you think Apple has so much cash (compared to Disney)?17-2. What is meant by the term cash-flow process?17-3. Identify the principal motives for holding cash and near-cash assets. Explain the purpose of each motive.17-4. What are the two major objectives of the firm’s cash management system?17-5. Within the context of cash management, what are the key elements of (total) float? Briefly define each element.17-6. Distinguish between the concepts of financial risk and interest rate risk as these terms are commonly used in discussions of cash management.17-7. What factors determine the size of the investment a firm has in its accounts receivable? Which of these factors are under the control of the financial manager?17-8. If a credit manager experienced no bad-debt losses over the past year, would this be an indication of proper credit management? Why or why not?17-9. What are the risk–return trade-offs associated with adopting a more liberal trade credit policy?17-10. What is the purpose of holding inventory? Name several types of inventory and describe their purpose.17-11. What are the assumptions made by the EOQ model?
Study ProblemsAll Study Problemss are available in MyFinanceLab.
17-1. (Cost of services) As CFO of Portobello Scuba Diving Inc. you are asked to look into the pos-sibility of adopting a lockbox system to expedite cash receipts from clients. Portobello receives check remittances totaling $24 million in a year. The firm records and processes 10,000 checks in the same period. The National Bank of Brazil has informed you that it could provide the service of expediting checks and associated documents through the lockbox system for a unit cost of $0.25 per check. After conducting an analysis, you project that the cash freed up by the adoption of the system can be invested in a portfolio of near-cash assets that will yield an annual before-tax return of 8 percent. The company usually uses a 365-day year in its procedures.
a. What reduction in check collection time is necessary for Portobello to be neither better nor worse off for having adopted the lockbox system?
b. How would your solution to part (a) be affected if Portobello could invest the freed-up bal-ances at an expected annual return of only 4 percent?
c. What is the logical explanation for the differences in your answers to part (a) and part (b)?
17-2. (Lockbox system) Penn Steelworks is a distributor of cold-rolled steel products to the automo-bile industry. All of its sales are on a credit basis, net 30 days. Sales are evenly distributed over its 10 sales regions throughout the United States. Delinquent accounts are no problem. The company has recently undertaken an analysis aimed at improving its cash management procedures. Penn determined that it takes an average of 3.2 days for customers’ payments to reach the head office in Pittsburgh from the time they are mailed. It takes another full day in processing time prior to depositing the checks with a local bank. Annual sales average $4.8 million for each regional office. Reasonable investment opportunities can be found that yield 7 percent per year. To alleviate the float problem confronting the firm, the use of a lockbox system in each of the 10 regions is being considered. This would reduce mail float by 1.2 days. One day in processing float would also be eliminated, plus a full day in transit float. The lockbox arrangement would cost each region $250 per month.
a. What is the opportunity cost to Penn Steelworks of the funds tied up in mailing and pro-cessing? Use a 365-day year.
b. What would the net cost or savings be from use of the proposed cash acceleration tech-nique? Should Penn adopt the system?
17-3. (Cash receipts acceleration system) Peggy Pierce Designs Inc. is a vertically integrated, national manufacturer and retailer of women’s clothing. Currently, the firm has no coordinated cash man-agement system. A proposal, however, from the First Pennsylvania Bank aimed at speeding up cash collections is being examined by several of Pierce’s corporate executives.
1

W-27 Part 5 • Working-Capital Management and International Business Finance
The firm currently uses a centralized billing procedure, which requires that all checks be mailed to the Philadelphia head office for processing and eventual deposit. Under this arrangement all the customers’ remittance checks take an average of 5 business days to reach the head office. Once in Philadelphia, another 2 days are required to process the checks for ultimate deposit at the First Pennsylvania Bank.The firm’s daily remittances average $1 million. The average check size is $2,000. Pierce Designs currently earns 6 percent annually on its marketable-securities portfolio.The cash acceleration plan proposed by officers of First Pennsylvania involves both a lockbox sys-tem and concentration banking. First Pennsylvania would be the firm’s only concentration bank. Lockboxes would be established in (1) San Francisco, (2) Dallas, (3) Chicago, and (4) Philadelphia. This would reduce funds tied up by mail float to 3 days, and processing float will be eliminated. Funds would then be transferred twice each business day by means of automated depository trans-fer checks from local banks in San Francisco, Dallas, and Chicago to the First Pennsylvania Bank. Each DTC costs $15. These transfers will occur all 270 business days of the year. Each check pro-cessed through the lockbox system will cost $0.18.
a. What amount of cash balances will be freed up if Peggy Pierce Designs Inc. adopts the system suggested by First Pennsylvania?
b. What is the opportunity cost of maintaining the current banking setup?c. What is the projected annual cost of operating the proposed system?d. Should Pierce adopt the new system? Compute the net annual gain or loss associated with
adopting the system.
17-4. (Marketable-securities portfolio) The Alex Daniel Shoe Manufacturing Company currently pays its employees on a weekly basis. The weekly wage bill is $500,000. This means that on average the firm has accrued wages payable of ($500,000 + $0)/2 = $250,000.
Alex Daniel Jr. works as the firm’s senior financial analyst and reports directly to his father, who owns all of the firm’s common stock. Alex Daniel Jr. wants to move to a monthly wage-payment system. Employees would be paid at the end of every fourth week. The younger Daniel is fully aware that the labor union representing the company’s workers will not permit the monthly pay-ments system to take effect unless the workers are given some type of fringe benefit compensation. A plan has been worked out whereby the firm will make a contribution to the cost of life insurance coverage for each employee. This will cost the firm $35,000 annually. Alex Daniel Jr. expects the firm to earn 7 percent annually on its marketable-securities portfolio.
a. Based on the projected information, should Daniel Shoe Manufacturing move to the monthly wage-payment system?
b. What annual rate of return on the marketable-securities portfolio would enable the firm to just break even on this proposal?
17-5. (Accounts-payable policy and cash management) Bradford Construction Supply Company is suf-fering from a prolonged decline in new construction in its sales area. In an attempt to improve its cash position, the firm is considering changes in its accounts-payable policy. After careful study, it has determined that the only alternative available is to slow disbursements. Purchases for the coming year are expected to be $37.5 million. Sales will be $65 million, which represents about a 20 percent drop from the current year. Currently, Bradford discounts approximately 25 percent of its payments at 3 percent, 10 days, net 30, and the balance of accounts is paid in 30 days. If Brad-ford adopts a policy of payment in 45 days or 60 days, how much can the firm gain if the annual opportunity cost of investment is 12 percent? What will be the result if this action causes Bradford Construction suppliers to increase their prices to the company by 12 percent to compensate for the 60-day extended term of payment? In your calculations, use a 365-day year and ignore any com-pounding effects related to the expected returns.
17-6. (Interest rate risk) Two years ago your corporate treasurer purchased for the firm a 20-year bond at its par value of $1,000. The coupon rate on this security is 8 percent. Interest payments are made to bondholders once a year. Currently, bonds of this particular risk class are yielding investors 9 percent. A cash shortage has forced you to instruct your treasurer to liquidate the bond.
a. At what price will your bond be sold? Assume annual compounding.b. What will be the amount of your gain or loss over the original purchase price?c. What would be the amount of your gain or loss had the treasurer originally purchased a
bond with a 4-year rather than a 20-year maturity? (Assume all characteristics of the bonds are identical except their maturity periods.)
d. What do we call this type of risk assumed by your corporate treasurer?
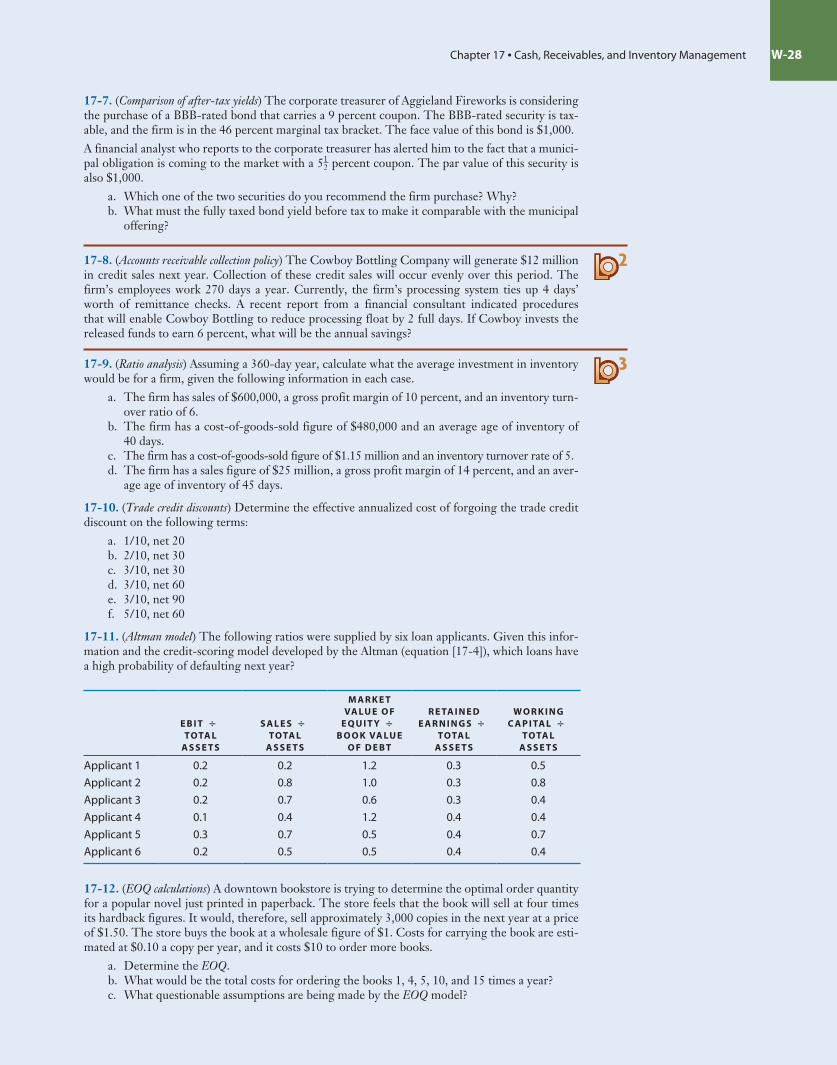
Chapter 17 • Cash, Receivables, and Inventory Management W-28
17-7. (Comparison of after-tax yields) The corporate treasurer of Aggieland Fireworks is considering the purchase of a BBB-rated bond that carries a 9 percent coupon. The BBB-rated security is tax-able, and the firm is in the 46 percent marginal tax bracket. The face value of this bond is $1,000.A financial analyst who reports to the corporate treasurer has alerted him to the fact that a munici-pal obligation is coming to the market with a 51
2 percent coupon. The par value of this security is also $1,000.
a. Which one of the two securities do you recommend the firm purchase? Why?b. What must the fully taxed bond yield before tax to make it comparable with the municipal
offering?
17-8. (Accounts receivable collection policy) The Cowboy Bottling Company will generate $12 million in credit sales next year. Collection of these credit sales will occur evenly over this period. The firm’s employees work 270 days a year. Currently, the firm’s processing system ties up 4 days’ worth of remittance checks. A recent report from a financial consultant indicated procedures that will enable Cowboy Bottling to reduce processing float by 2 full days. If Cowboy invests the released funds to earn 6 percent, what will be the annual savings?
17-9. (Ratio analysis) Assuming a 360-day year, calculate what the average investment in inventory would be for a firm, given the following information in each case.
a. The firm has sales of $600,000, a gross profit margin of 10 percent, and an inventory turn-over ratio of 6.
b. The firm has a cost-of-goods-sold figure of $480,000 and an average age of inventory of 40 days.
c. The firm has a cost-of-goods-sold figure of $1.15 million and an inventory turnover rate of 5.d. The firm has a sales figure of $25 million, a gross profit margin of 14 percent, and an aver-
age age of inventory of 45 days.
17-10. (Trade credit discounts) Determine the effective annualized cost of forgoing the trade credit discount on the following terms:
a. 1/10, net 20b. 2/10, net 30c. 3/10, net 30d. 3/10, net 60e. 3/10, net 90f. 5/10, net 60
17-11. (Altman model) The following ratios were supplied by six loan applicants. Given this infor-mation and the credit-scoring model developed by the Altman (equation [17-4]), which loans have a high probability of defaulting next year?
2
3
E b i t ÷ tota l
a s s E t s
s a l E s ÷ tota l
a s s E t s
M a r k E t Va lu E o f
E q u i t y ÷b o o k Va lu E
o f D E b t
r E ta i n E D E a r n i n g s ÷
tota l a s s E t s
W o r k i n g C a p i ta l ÷
tota l a s s E t s
Applicant 1 0.2 0.2 1.2 0.3 0.5
Applicant 2 0.2 0.8 1.0 0.3 0.8
Applicant 3 0.2 0.7 0.6 0.3 0.4
Applicant 4 0.1 0.4 1.2 0.4 0.4
Applicant 5 0.3 0.7 0.5 0.4 0.7
Applicant 6 0.2 0.5 0.5 0.4 0.4
17-12. (EOQ calculations) A downtown bookstore is trying to determine the optimal order quantity for a popular novel just printed in paperback. The store feels that the book will sell at four times its hardback figures. It would, therefore, sell approximately 3,000 copies in the next year at a price of $1.50. The store buys the book at a wholesale figure of $1. Costs for carrying the book are esti-mated at $0.10 a copy per year, and it costs $10 to order more books.
a. Determine the EOQ.b. What would be the total costs for ordering the books 1, 4, 5, 10, and 15 times a year?c. What questionable assumptions are being made by the EOQ model?

W-29 Part 5 • Working-Capital Management and International Business Finance
17-13. (Comprehensive EOQ calculations) Knutson Products Inc. is involved in the production of airplane parts and has the following inventory, carrying, and storage costs:
1. Orders must be placed in round lots of 100 units.2. Annual unit usage is 250,000. (Assume a 50-week year in your calculations.)3. The carrying cost is 10 percent of the purchase price.4. The purchase price is $10 per unit.5. The ordering cost is $100 per order.6. The desired safety stock is 5,000 units. (This does not include delivery-time stock.)7. The delivery time is 1 week.
Given the forgoing information:a. Determine the optimal EOQ level.b. How many orders will be placed annually?c. What is the inventory order point? (That is, at what level of inventory should a new order
be placed?)d. What is the average inventory level?e. What would happen to the EOQ if annual unit sales doubled (all other unit costs and
safety stocks remaining constant)? What is the elasticity of EOQ with respect to sales? (That is, what is the percentage change in EOQ divided by the percentage change in sales?)
f. If carrying costs double, what will happen to the EOQ level? (Assume the original sales level of 250,000 units.) What is the elasticity of EOQ with respect to carrying costs?
g. If the ordering costs double, what will happen to the level of EOQ? (Again assume original levels of sales and carrying costs.) What is the elasticity of EOQ with respect to ordering costs?
h. If the selling price doubles, what will happen to EOQ? What is the elasticity of EOQ with respect to selling price?
Mini CaseThis Mini Case is available in MyFinanceLab.
New Wave Surfing Stuff Inc. is a manufacturer of surfboards and related gear that sells to exclusive surf shops located in several Atlantic and Pacific mainland coastal towns as well as several Hawai-ian locations. The company’s headquarters are located in Carlsbad, California, a small southern California coastal town. True to form, the company’s officers, all veteran surfers, have been some-what laid back about various critical areas of financial management. With an economic downturn in California adversely affecting their business, however, the officers of the company have decided to focus intently on ways to improve New Wave’s cash flows. The CFO, Willy Bonik, has been requested to forgo any more daytime surfing jaunts until he has wrapped up a plan to accelerate New Wave’s cash flows.In an effort to ensure his quick return to the surf, Willy has decided to focus on what he believes is one of the easiest methods of improving New Wave’s cash collections, namely, the adoption of a cash receipts acceleration system that includes a lockbox system and concentration banking. Willy is well aware that New Wave’s current system leaves much room for improvement. The company’s accounts-receivable system currently requires that remittances from customers be mailed to the headquarters office for processing and then deposited in the local branch of the Bank of the U.S. Such an arrangement takes a considerable amount of time. The checks take an average of 5 days to reach the Carlsbad headquarters. Then, depending on the surf conditions, processing within the company takes anywhere from 2 to 4 days, with the average from the day of receipt by the company to the day of deposit at the bank being 3 days.Willy feels pretty certain that such delays are costly. After all, New Wave’s average daily collec-tions are $150,000. The average remittance size is $750. If Willy could get these funds into his marketable-securities account more quickly, he could earn an annual rate of 5 percent on them. In addition, if he could arrange for someone else to do the processing, Willy could save $55,000 per year in costs related to clerical staffing.New Wave’s banker was pleased to provide Willy with a proposal for a combination of a lockbox system and a concentration-banking system. Bank of the U.S. would be New Wave’s concentration bank. Lockboxes would be established in Honolulu, Newport Beach, and Daytona Beach. Each

Chapter 17 • Cash, Receivables, and Inventory Management W-30
check processed through the lockbox system would cost New Wave $0.30. This arrangement, however, would reduce mail float by an average 2.5 days. The funds so collected would be trans-ferred twice each day, 270 days a year, from each of the local lockbox banks to Bank of the U.S. Each transfer would cost $0.35. The combination of lockbox system and concentration banking would eliminate the time it takes the company to process cash collections, thereby making the funds available for short-term investment.
a. What would be the average amount of cash made available if New Wave were to adopt the system proposed by Bank of the U.S.?
b. What is the annual opportunity cost of maintaining the current cash collection and deposit system?
c. What is the expected annual cost of the complete system proposed by Bank of the U.S.?d. What is the net gain or loss that is expected to result from the proposed new system?
Should New Wave adopt the new system?