case study maximise spectrum resources enter - atdi · solutions in radiocommunications case study...
TRANSCRIPT

Solutions in Radiocommunications
Case Study
Enter
Helping Norway maximise spectrum resources
Author:Cyprien de CossonBEng MIET
September 2011

Executive SummaryAn auction always needs lots – in this case, lots of care and lots of accuracy.
As part of its preparations for an auction of slots in the 790-862 MHz range, Norwegian spectrum regulator NPT asked ATDI to identify any potential interference problems involving this band and those adjacent.
It was essential that NPT was extremely clear about what spectrum was to be sold and what the frequency slots in it would do. Like all regulators, NPT operates under a number of strictures: its political mandate, the demands of the potential buyers of the spectrum, the responsibility that comes with dealing with purchase prices in the many millions, and the need to avoid post-auction complaints from operators that their services are suffering from interference. NPT turned to ATDI to carry out the exacting task of planning and modelling with sufficient accuracy to meet all these demands.
Specifically, ATDI assessed the potential impact of an LTE mobile network on public service television broadcasts. The company analysed how an LTE system in the 800 MHz band would affect the existing UHF networks using the Digital Video Broadcast Terrestrial system (DVB-T).
Though the spectrum auction was technology neutral, the most likely users of the newly-available frequencies were due to be operators of LTE networks and it was this scenario which was investigated in detail.
The challenge for ATDI was that the lowest block of spectrum due to be auctioned was immediately adjacent to the allocation for digital broadcasting. There was a small guard band between the two services, but there was also the potential for interference between the digital broadcast network and any LTE wireless broadband service. This problem was particularly acute when considering LTE downlink interference in the lowest block into the topmost broadcast channels.
To reduce the interference, several mitigation techniques were investigated in a sample area around Oslo. One of the most efficient mitigation techniques was found to be to limit the interfering LTE base stations to only vertical polarisation; this is based on the fact that, with a few minor exceptions, the Norwegian DVB-T network is horizontally polarised; using vertical polarisation for the LTE services adds cross-polar discrimination to the protections of DVB-T receivers.
ATDI proposed that while network designs were being completed, LTE operators should consider the interference potential to the DVB-T networks and suggested mitigation techniques they could deploy to overcome the effects. The company also advocated that a feasibility study was completed to assess the re-assignment of spectrum of affected areas away from channels 58 to 60; the study would additionally look at the effect of not using these channels in highly populated areas.
This case study looks back on the issues, though much of it was written before the auction had taken place.
To print document press ESC on keyboard and send to print normally
HoHomeHoContactExexcutive
Summary P1
P17
P9
P25
P5
P21
P13P3
P19
P11P7
P23P15
P2
P18
P10
P26
P6
P22
P14P4
P20
P12P8
P24P16

1
OverviewFor the out of band interference analysis, the existing DVB-T network coverage on channels 58 to 60 was used as a basis, while the LTE network design was based on an existing GSM900 network taking the two lowest 5 MHz channels (FDD1 and FDD2) into account. In cases of high interference, FDD3 was additionally taken into account.For the blocking interference analysis, the same LTE network was used again, where the whole UHF DVB-T spectrum (channel 21 – 60) was taken into account. With the assumption made, the results showed that on the out of band interference the population predicted to be affected ranged from 0% (Mux 4 Ch58) to 6.3% (Mux1 Ch60) of the Norwegian population. The table below gives an overview of the number of people interfered per MUX. Moving further away from the DVB-T system in frequency (FDD2 or FDD3) would reduce the number of affected people dramatically.
FDD1 FDD2 FDD3
MUX1 14,949 4,182 1,800
MUX2 1,576 739 596
MUX3 3,208 1,180 741
MUX4 0 0 2
MUX5 2,025 692 348
Table 1: overview of people affected by out of band interference
The results for interference through blocking show that the area where interference may occur is relatively small. This is due to the fact that the potentially affected area for blocking is less than 1km around an interfering LTE base station. Therefore, the number of affected people is very low and is dependent on population density.
Further interference analysis options for mitigating the interference were individually assessed in a smaller sample area. The results showed that using filters (at the receiver or transmitter end) would help to reduce the interference by 50% or more. Restricting frequencies or providing extra fill-in stations was found to be only a local or temporary solution as the effort (financial or administrative) required to implement it might be too high compared with the reduction effect. Using vertical polarisation for the LTE network instead of dual slant would reduce the interference dramatically. Due to the fact that in Norway the DVB-T signal is mostly horizontally polarised the interference could be reduced by up to 96%.
Figure 1: Map of Norway showing all counties
BackgroundThe Norwegian DVB-T network is managed by the national broadcast company, NTV, which has a licence for up to six nationwide networks. The broadcasting network typically consists of high power transmitter stations mounted at high terrain points or at high masts, such that significant coverage of the population is achieved over the entire nation. Additionally, with some networks, smaller fill-in stations are used to provide service in areas where a Direct Broadcast Satellite (DBS) television reception is blocked (e.g. due to terrain). Each network comprises multiple television content streams which are combined with others to form a Multiplex (MUX) and transmitted over a physical digital broadcast channel. A national plan agreed by regulatory authorities and national broadcast companies defines which channel will be provided by each MUX in a certain area.
There are up to 48 DVB-T channels (21-69) that can be accommodated in the ITU Region 1 allocation. One of the main advantages of migrating to digital TV from analogue is the reduced number of frequency channels required. After the transition from analogue to digital television, channels 61 to 69 (790 - 862 MHz) will no longer be required for broadcasting. This provides an opportunity to introduce mobile services in the band 790-862 MHz
The typical DVB-T receiver antenna can be assumed as a fixed directional antenna mounted on a rooftop at a notional 10m height above the ground. This is equivalent to GE06 [3] Reference Planning Configuration 1 (RPC1) for DVB-T. There are other DVB-T variations for portable or mobile services, but these are not considered in this study.
There are mainly two types of tuners that can be found in DVB-T receivers. These are “Can” type and “Silicon” type tuners. They can be either integrated in the Digital Television (iDTV) or in a Set Top Box (STB). “Can” tuners are classical super heterodyne tuners housed in a metal enclosure containing discrete components. “Silicon” tuners are IC-based tuners integrating all tuner circuitry in silicon that can be fitted onto main circuit boards of the receiver. Either type of tuner can be found in either receiver.
1
To print document press ESC on keyboard and send to print normally
HoHome
HoContactExexcutive
Summary P1
P17
P9
P25
P5
P21
P13P3
P19
P11P7
P23P15
P2
P18
P10
P26
P6
P22
P14P4
P20
P12P8
P24P16

2 2
The diagram below shows the main design of a DVB-T system. In Norway, most of the DVB-T network is horizontally polarised. In other European countries like Germany, for example, DVB-T is also deployed in a vertical polarisation.
For this analysis MUX6 was excluded from the calculations because it had yet to be coordinated.
Assumptions• OnlytheinterferencefromLTEnetworkintoDVB-Tnetworkwas
analysed• OnlychannelsFDD1andFDD2wereconsideredassourcesof
interference and studied for every interference case. If the interference result showed that more than 100 people may be affected then FDD3 would be considered as a third source of interference.
• OnlythethreehighestDVB-Tchannelswerestudiedforadjacentchannel interference (lower channels may suffer from interference on image channels)
• AllDVB-Treceiverchannelswereconsideredtosufferinterferencefrom receiver blocking
• TheDVB-Tserviceforfixedrooftopantennaswasmodelledat10mabove ground level using directional antennas for 95% location probability as per RPC1 in GE06 [3]
• Thisanalysisassumedthatallofthereceivingantennasweredirectedtowards the best server rather than a potential alternative server
• DVB-Tcoveragewasassessedonlyoverlandandcoverageoverseawas not considered
• AsinglenetworkwasmodelledfortheLTEsystemandconsideredrepresentative of all other networks
• LTEbasestationsweremodelledonlyatexistingGSM900sitesusingbase station equipment, allowing multiple technologies at the same site and existing sectorisation with a single common radiation pattern for each sector
• ThepolarisationofemissionforLTEstationswasassumedtobemixeddue to use of dual slant polarisation. Therefore the discrimination afforded to the broadcast antenna was assumed to be 3 dB
• AllLTEbasestationswereconsideredtoberadiatingatmaximumpower; in reality power control and other factors will reduce this
• MFN(MultiFrequencyNetwork)interference(inter/intranetwork/MUX) for the DVB-T network was not considered as it was assumed the network had been designed to avoid this
• Whereprotectionratiosforgivenchannelseparationwerenotavailable, protection ratios were computed by linear interpolation
• Whereoutofbandanalysiswasperformed,theinterferingpowerwasconsidered as the power sum of all signals from any LTE base station
• BlockingpowerwasconsideredastheworstcasefromasingleLTEsector only
• Noreflectionsfromterrainwerebeingtakenintoaccountforcoverageand interference calculations
• TheanalysisforinterferencebyblockingwasundertakenonMUX1and MUX2 only. MUX1 includes the extra fill-in stations used to give improved coverage in the shadow of satellite television. All other multiplexes (2-5) used the same number of transmitters at the same locations. Therefore, there was the assumption that the results for MUX2-5 would be very similar and hence MUX2 was used as a representative for all the other MUXs
• WhereregionalnetworkswereimplementedasSFNs,thenetworkgain that a receiver could achieve by exploiting macro-path diversity
Figure 2: DVB-T system
Scope and ObjectivesThe main purpose of ATDI’s work was to inform stakeholders of any technical constraints prior to auction of the dividend spectrum in Norway. The lowest block of spectrum in the auction was immediately adjacent to the allocation for digital broadcasting as proposed in harmonised plan provided on page 2 in CEPT report 31 [1] (see Figure 3). While there is a small guard band between the two services, there is the potential for interference between the digital broadcast network and LTE wireless broadband network. This problem is particularly acute when considering LTE downlink interference in the lowest block into the topmost broadcast channels.ATDI considered only the LTE downlink interference (base station emissions); uplink interference from user equipment was not examined because the uplink band is deliberately separated as far away as possible to reduce the interference potential. Additionally, only the two lowest 5 MHz LTE blocks (FDD1 and FDD2) were considered as potential interferers across the whole country, although the FDD3 was assessed where there is high interference in FDD1 and 2. Figure 3 below shows the spectrum plan, with the naming conventions used for this case study. Figure 3 shows 5 MHz LTE blocks, but in principal these could be aggregated to 10 MHz blocks. However, the interference potential for 10 MHz blocks is no worse than for 5MHz, since the block edge mask is the same (ECC report 148 [2], annex F).
Figure 3: Harmonised frequency plan about DVB-T and LTE from CEPT report 31
To print document press ESC on keyboard and send to print normally
HoHome
HoContactExexcutive
Summary P1
P17
P9
P25
P5
P21
P13P3
P19
P11P7
P23P15
P2
P18
P10
P26
P6
P22
P14P4
P20
P12P8
P24P16

3
was not considered. ATDI undertook a test calculation in a test area comparing omnidirectional and directional receiver antennas. The test procedure can be found in the appendix. The result showed that the impact of network gain for direction antennas (ITU-R 419-3 [4]) was negligibly small
• Theeffectofmastheadordistributionamplifierswasnotconsidered.
MethodThis section will explain the method used in this study. The analysis considered two interference mechanisms:• Unwantedsignalinterferencefromadjacentchannel(outofband)LTE
base station network. This considered LTE signal interference into only the upper three DVB-T channels (58, 59 and 60).
• InterferencebyblockingtheDVB-TreceiverwithanLTEsignal.Inthiscase, all UHF DVB-T channels were considered.
The next section provides information about map data and population information provided by NPT. The following section gives a detailed description of how the out of band interference was calculated, followed by the detailed description of the blocking analysis.
The method was based on the following digital map data
• 50mresolutionDigitalTerrainModel(DTM)derivedfromthe25mnational model
• 100mresolutioncluttermodelderivedfromtheN250nationalvectordata set.
For the calculations, the three following clutter classes were used: open, suburban and urban (calculations over water were not considered). The configuration of the clutter model will be explained later in the modelling section• ThepopulationdatawassourcedfromtheStatistiskSentralbyråfor
2010 [15] and is aggregated in 50m bins spanning the country
Figure 4: Clutter model for sample area around Oslo; light green – water, grey – open, blue – suburban, light blue – urban,
Figure 5: Population distribution for area around Oslo, dark blue – medium population, light blue – high population
Figure 6: Protection ratio between wanted signal (green solid line) and unwanted signal (red dashed line)
3
Out of band interferenceOut of band interference occurs when the unwanted LTE signals from an adjacent channel to the DVB-T channels are received by the DVB-T receiver and interfere with the receiver preventing it from decoding the DVB-T signal correctly. The minimum ratio between the wanted (DVB-T) and the unwanted (LTE) signal to ensure error free reception is called the protection ratio (PR).
To print document press ESC on keyboard and send to print normally
HoHome
HoContactExexcutive
Summary P1
P17
P9
P25
P5
P21
P13P3
P19
P11P7
P23P15
P2
P18
P10
P26
P6
P22
P14P4
P20
P12P8
P24P16

4 4
DVB-T planningThe DVB-T transmitter assignment data was assumed to represent the national Norwegian plan, as was scheduled to be implemented during 2011. MUX6 has been excluded, because it has yet to be coordinated. The modelling considered all transmitter stations for MUX1-5 plus extra satellite shadow fill-in stations for MUX1. The table below shows the number of stations per MUX.
MUX Number Stations
MUX1 434
MUX1 fill-in 512
MUX 2-5 433
Table 3: Number of transmitter stations per MUX
The following sample area identifies all MUX1 transmitting stations in a sample area around Oslo. The yellow squares indicate the DVB-T transmitter locations.
The following parameters and criteria were applied to this modelling:• Receiverantennaof10mAGL• Locationsavailabilityexceeding95%• Percentageoftimeexceeding50%• Notionalurbanclutterheightof20m• Notionalsuburbanclutterheightof10m• Terrainclearanceangleapplied
The GE06 document (Chapter 1 to Annex2, 1.3.9) defines the minimum median field strength as a value for 50% of locations and for 50% of the time at 10m above ground level. A Location Correction Factor, which is explained in Annex 2 §3.4.5.1of the GE06, had to be considered for the required 95% of locations. The correction factor can be explained as following:
Within a small area of, say, 100m by 100m, the signal received will be subject to variation due to changes in the local terrain and clutter. The minimum median equivalent field strength is for 50% of locations prior to any correction. To obtain the minimum median equivalent field strength needed to provide reception at a higher percentage of locations, a location correction factor Cl has to be added. In calculating the location correction factor Cl, a log-normal distribution of the received signal with location is assumed for fixed rooftop reception.
The location correction factor, Cl, (dB) can be calculated by the formula:
Cl = µ * σ
where:
µ is the log-normal distribution factor, which is 1.64 for 95% of locations
σ is the aggregate standard deviation of fading which is 5.5 for fixed rooftop reception.
Therefore for 95% of locations, the location correction factor is 9 dB.The minimum median field strength at a reference frequency of 500 MHzis52dBµV/m(tableA.3.2-2ofGE06[3]).Thisfigureincludesa correction to increase the locations availability to 95%. Based on this figure the minimum median field strength for all other channel frequencies was calculated using the following formula:
Emed = Eref +20*log10 (f/fref) dBµV/m
where,
Eref-referencefieldstrength(dBµV/m)f – frequency for each individual DVB-T channel (MHz)fref – reference frequency (MHz)
Figure 7: Sample area around Oslo indicating MUX1 DVB-T transmitter locations
Planning figures The coverage calculation was performed using the terrain and morphological data set described previously. The Norwegian broadcast licences are based on providing coverage using GE06 RPC1 [3] as a reference, although while the actual modulation is 64-QAM as per this configuration,thecoderateis2/3rather¾forRPC1.Forreferenceplanning purposes, the ITU-R P. 1546-4 [5] propagation model was used, which is practically identical to that specified in Chapter 5 of GE06 [3].
To print document press ESC on keyboard and send to print normally
HoHome
HoContactExexcutive
Summary P1
P17
P9
P25
P5
P21
P13P3
P19
P11P7
P23P15
P2
P18
P10
P26
P6
P22
P14P4
P20
P12P8
P24P16

5
The table below provides the minimum median equivalent field strength levels for 95% of locations for all DVB-T channels being modelled.
Channel number(#)
Frequency range (MHz)
Emed
(dBµV/m)
21 – 24 470 - 502 52
25 – 31 502 - 558 53
32 – 40 558 - 630 54
41 – 50 630 - 710 55
51 – 60 710 - 790 56
Table 4: calculated Emed for all UHF DVB-T channels
Service area calculation The service area of a DVB-T transmitter can be defined as an area where the signal equals the minimum median field strength (Emed). Typically, service areas from different broadcast transmitters will overlap to ensure a constant signal provision.
A fixed receiver antenna will generally be installed such that it is pointing in the direction of the strongest signal from any available transmitter. In order to determine antenna pointing, a best server analysis is computed to determine the service area.
Figure 8: Best server (yellow arrow) calculation model
The best server analysis assesses each coverage point in turn and determines the station that provides the highest margin in excess of the median field strength. The antenna pattern for a receiver antenna, the ITU-R BT 419-3 shown in figure 9 below, has been applied.
Figure 9: ITU BT 419 horizontal antenna pattern
In addition, the orientation of the antenna is derived to compute the discrimination afforded to interference in other directions.The antenna discrimination describes the signal degradation (in dB) of an unwanted signal due to the direction of the interfering signal or signal polarisation. A directional antenna provides a high gain in one direction and at the same time attenuates signals received from other directions. Obviously, the antenna discrimination depends on antenna characteristics like beam width and side lobes.
Figure 10: Antenna discrimination - Using directional antennas to reduce unwanted signal strength from other directions
LTE network modelling To model interference from a future LTE mobile network into the broadcasting frequency band, it was important to make the assumption based on an existing mobile network structure and characteristics.
To achieve a high population and area coverage, an actual network of a typical Norwegian GSM900 network was used as the network skeleton. The pre-existing GSM900 network contained base station transmitters distributed across the whole country. Therefore it was likely that the future LTE network would be located at the existing GSM900 network sites.
To print document press ESC on keyboard and send to print normally
HoHome
HoContactExexcutive
Summary P1
P17
P9
P25
P5
P21
P13P3
P19
P11P7
P23P15
P2
P18
P10
P26
P6
P22
P14P4
P20
P12P8
P24P16

6
LTE network characteristicsThe assumed mobile network had the following characteristics:• Site positions were based upon an existing GSM900 network• Antenna heights were the same as an existing GSM900 network• Number of sectors on each site were the same as an existing
GSM900 network • Sector orientations were the same as an existing GSM900 network
Each site in the mobile network had the following characteristics:• Antenna data: • Kathrein 800 10293 • Gain: 16.5 dBi • Half power (-3dB) beam width (H-pol): 65 deg • Half power (-3dB) beam width (V-pol): 10 deg • Electrical down tilt: 3 deg • Nominal power: 20 W• Channel bandwidth: 5 MHz• Polarisation:dualslantpolarization(+45º/-45ºpolarization)
The different LTE equipment providers offered a variation of maximum nominal power. The ECC report 40 [6] provided a maximum nominal power for LTE base stations of 43 dBm (20 W), which was considered for this calculation.
The provided LTE sector list included feeder losses, of which some account had to be taken. The individual feeder losses varied between 0 dB and 12 dB. In theory, the cellular operator could decrease these losses yet maintain emissions within the maximum limits. The approach taken was to take the loss not exceeded by the lower decile, giving a lossof2dB.Choosingtheupper/lowerdecilemirroredtheapproachtaken for choosing other equipment parameters.
Coverage calculationFor the calculation of the unwanted field strength from the mobile LTE network, the propagation model JTG5-6 was used. This model is a hybrid of ITU P.1546-4 [5] and an extended Hata model [7].
The Hata model was developed for land-mobile services and was derived from measurements taken in urban areas in Tokyo, Japan by Okumura. These measurements curves were later formulated by Hata. The model is valid for path length between 10 m to 40 km, low receiver antenna heights in clutter (1-10 m above ground) and base station antennas installed above rooftop level (10–200 m).
The ITU P.1546-4 model was derived from measurements performed forUHF/VHFbroadcastingdistancesbeyond1kmusinghighpowertransmitter stations and fixed receiver antennas. It was later extrapolated for smaller distances down to 1 km and also low receiver antenna heights. The model is valid for path length between 1 km and 1000 km, low receiver antenna heights (1-10 m above ground) and base station antennas installed hundreds of meters above ground level.
JTG5-6 is specifically designed for base station interference into fixed or mobile DVB-T systems and combines both approaches to cover continuously the range from 10 m to 100 km. The model combines the following loss calculations:
• 40-100m:freespaceloss,• 100-1000mpathlossforurbanarea,interpolatedbetweenthevalues
determinedfor100mbasedonOkumura/Hataand1000mbasedonITU- P.1546
• greaterthan1km:ITU-RP.1546-4model(landcurves)
The figure below shows the different distances and corresponding propagation models. As the interpolation method between 100 m and 1km is not very well specified, two different approaches are shown (green and red curve). The green line applies the extended Hata model with the restriction to free space results at 100m distance and provides path losses which are definitely greater than or equal to free space attenuation for all distances. The red line applies to the original Hata formula results at 100 m distance. If the path loss computed with Hata is less than for free space, some of the interpolated values will be less than free space attenuation. It was then recommended to restrict the path loss at 100 m to free space or values greater than the free space attenuation (green curve).
Figure 11: ITU JTG5-6 integrated propagation methods according to path length
The model is described in more detailed in the ECC CPG11 PT-D [8] and theITUdocument5-6/107-E[9].
The following parameters and criteria applied to the modelling:• Receiverantennaof10mabovegroundlevel• Locationsavailability50%• Percentageoftimenotexceeding1%• Notionalurbanclutterheightof20m• Notionalsuburbanclutterheightof10m• Terrainclearanceangleapplied As discussed in the section above, the DVB-T receiving antenna was assumed as a directional antenna based on the ITU-R BT 419-3 [2].
To print document press ESC on keyboard and send to print normally
HoHome
HoContactExexcutive
Summary P1
P17
P9
P25
P5
P21
P13P3
P19
P11P7
P23P15
P2
P18
P10
P26
P6
P22
P14P4
P20
P12P8
P24P16

7
Interference CalculationsThis assessment concentrated on interference of each of the broadcast channels (58, 59 and 60) caused by the LTE channels (FDD1 to FDD2). The maximum frequency offset of the frequencies is between DVB-T channel 58 and LTE FDD2, which is 22 MHz (see figure below).
It was considered that the frequency separation was measured between the channel edges of wanted and unwanted signals rather than the frequency offsets between the centre frequencies fc. The same assumption was made in the ECC report 148 which was used as a reference for the following calculations. Therefore the 22 MHz distance was measured from the lower channel edge of channel 58 to the lower edge of FDD2.
Figure 12: Channel distance calculated for centre frequency (blue) or channel edge (red), blue bar - maximum frequency separation based on involed channels
To calculate the interference between DVB-T and LTE, the protection ratio was calculated. ECC report 148 [2] expresses protection ratio versus frequency separation between the channel edges of the wanted and interfering signals.
The following table illustrates the calculated frequency offsets from the channel edge and the centre frequencies. The highlighted figures are corresponding to the analysis in ECC report 148 which is considering channel edge separation from FDD1 into DVB-T channels.
DVB-T channel 60 60 59 59 58 58
LTE 5 MHz FDD1 FDD2 FDD1 FDD2 FDD1 FDD2
Delta edge (MHz) 1 6 9 14 17 22
Delta centre (MHz)
7.5 12.5 15.5 20.5 23.5 28.5
Table 5: frequency spacing between DVB-T and LTE channels
Table 5a in ECC report 148 provides PR values for different types of tuners (Can or Silicon in a set-top). In this assessment the worst case PR values between the Can and a Silicon tuner for a set-top box were considered.
The report considered only channel separation between FDD1 and adjacent DVB-T channels. To get the PR values for the frequency offsets in between these, a linear interpolation had been done. The following table shows the PR values which have been used. The black coloured are the original values from ECC report 148 where the red values are the interpolated ones.
Channel edge separation(MHz)
PR(dB)
1 -33
6 -37
9 -40
14 -39
17 -39
22 -45
Table 6: Linear interpolated PR values (red) based on ECC report 148
These provided protection ratios are median values which mean they are valid for 50% of the locations inside an area. In this assessment, location probability of 95% was assumed. A location correction margin (implied in GE06 ANNEX 2 §3.4.5.3) was added to the system protection ratio (for 50% of locations) to give the amount (in dB) by which the wanted signal must exceed the interfering signal in order to provide protection at greater than 50% of locations. The location correction margin is related to the location correction factor and in deriving it from the location correction factor it is assumed that the wanted and interfering signals are both normally distributed, are un-correlated and have identical aggregate standard deviations.
To print document press ESC on keyboard and send to print normally
HoHome
HoContactExexcutive
Summary P1
P17
P9
P25
P5
P21
P13P3
P19
P11P7
P23P15
P2
P18
P10
P26
P6
P22
P14P4
P20
P12P8
P24P16

8
The resultant standard deviation is calculated as follows
For fixed rooftop reception, the aggregate standard deviation of fading, σ is 5.5 dB which makes the resultant standard deviation,σres = √2 *5.5 = 7.8 dB. Therefore, for 95 % of locations, the location correction margin is: 7.8 dB * 1.64 = 12.8 dB, (where 1.64 is the log-normal distribution factor)
The PR values provided in the ECC report 148 have been normalised to a 64-QAM2/3systemforacabledtestconfiguration.Table4inthesamereportgives a correction factor for fixed rooftop reception of 1.1 dB.
The LTE system was modelled with dual slant polarisation antennas, which means the signal would be radiated in horizontal and vertical plane rotated by 45 degrees. The DVB-T receiver antenna is mostly horizontally polarised. Due to this 45 degree polarisation difference, a discrimination of 3 dB shall be considered.
Figure 13: Dual polar 0° slant antenna, dual polar 45° slant antenna
The following table shows the margin considered and factors which have to be added to the PR values.
Corrections Values (dB)
Location margin 12.8
Correction factor 1.1
Polarisation discrimination 3
Table 7: summary of added corrections
DVB-T Channel FDD Δf (MHz) PR (dB)
58 1 17 -33
59 1 9 -29
60 1 1 -22
58 2 22 -36
59 2 14 -32
60 2 6 -27
Table 8: overview of analysed interference pairs, frequency separation and used PR
σres=√σwanted2+σwanted2 i.e.,σres=√2*(σwanted) sinceσwanted=σinterferer
These PR values were considered in the following interference cases:
• DVB-Tchannel58beinginterferedbyLTEchannelFDD1andFDD2• DVB-Tchannel59beinginterferedbyLTEchannelFDD1andFDD2• DVB-Tchannel60andbeinginterferedbyLTEchannelFDD1andFDD2
BlockingReceiver blocking is where a strong unwanted signal prevents the receiver from detecting a wanted signal. This interference can occur even when the wanted signal is high and the effect is not as frequency selective as adjacent channel interference. Blocking by its very nature requires a large signal and so is likely to occur only in close proximity to the LTE base stations.
Figure 14: DVB-T transmitter blocking by LTE signal, green - wanted DVB-T signal, red - unwanted LTE signal
The blocking interference analysis considered interference from FDD1 and FDD2 into the whole DVB-T band.
The receiver blocking threshold, also called overload threshold, is defined as the maximum interfering signal level (in dBm) that can be tolerated by a receiver before it loses the ability to discriminate against unwanted signals at adjacent frequencies.
The blocking power levels are converted into unwanted field strengths assuming a DVB-T fixed receiver with a directional 12 dBd (14 dBi) antenna with 5 dB feeder loss (GE06 table 3-2, 800 MHz). An additional 3 dB mixed antenna discrimination was added to account for the discrimination due to the different polarisations used in the DVB-T and the LTE system.
This gives the following blocking level expressed as unwanted field strength levels required for blocking for FDD1 if the receiver antenna is pointing directly at the LTE base station.
To print document press ESC on keyboard and send to print normally
HoHome
HoContactExexcutive
Summary P1
P17
P9
P25
P5
P21
P13P3
P19
P11P7
P23P15
P2
P18
P10
P26
P6
P22
P14P4
P20
P12P8
P24P16

9
Channel edge separation
(MHz)
DVB-T Frequency
(MHz)
Blocking level (dBm)
Blocking field strength(dBµV/m)
1 786 -19 116
9 778 -14 121
17 770 -25 110
25 762 -19 116
33 754 -14 121
41 746 -12 123
49 738 -11 124
57 730 -11 124
65 722 -12 123
Table 9: Blocking levels for FDD1 (793.5 MHz) based on ECC report 148
The ECC report 148 considered only channel separation between FDD1 and DVB-T. Modelling the FDD2 case meant the channel separations had to be adapted. Based on the blocking levels giving in the table above, the new blocking levels were calculated based on a linear interpolation giving the following:
Channel edge separation
(MHz)
DVB-T Frequency
(MHz)
Blocking level (dBm)
Blocking field strength(dBµV/m)
6 786 -16 119
14 778 -21 114
22 770 -21 114
30 762 -16 119
38 754 -13 122
46 746 -12 124
54 738 -11 124
62 730 -12 123
Table 10: Blocking levels for FDD2 (798.5 MHz) based on ECC report 148
The modelling considered ITU-R BT.419-3 as the antenna discrimination at the DVB-T receiver. This antenna would be pointing at the DVB-T receiver’s best server.
The modelling also considered FDD1 and FDD2 as interferer at the same time provided by the same LTE base station.
ResultsThe analysis was undertaken over the whole of Norway and the results are presented for each of the 19 counties. The study does not include areas not covered by DVB-T
Figure 15: Map of Norway showing counties
To print document press ESC on keyboard and send to print normally
HoHome
HoContactExexcutive
Summary P1
P17
P9
P25
P5
P21
P13P3
P19
P11P7
P23P15
P2
P18
P10
P26
P6
P22
P14P4
P20
P12P8
P24P16
1010
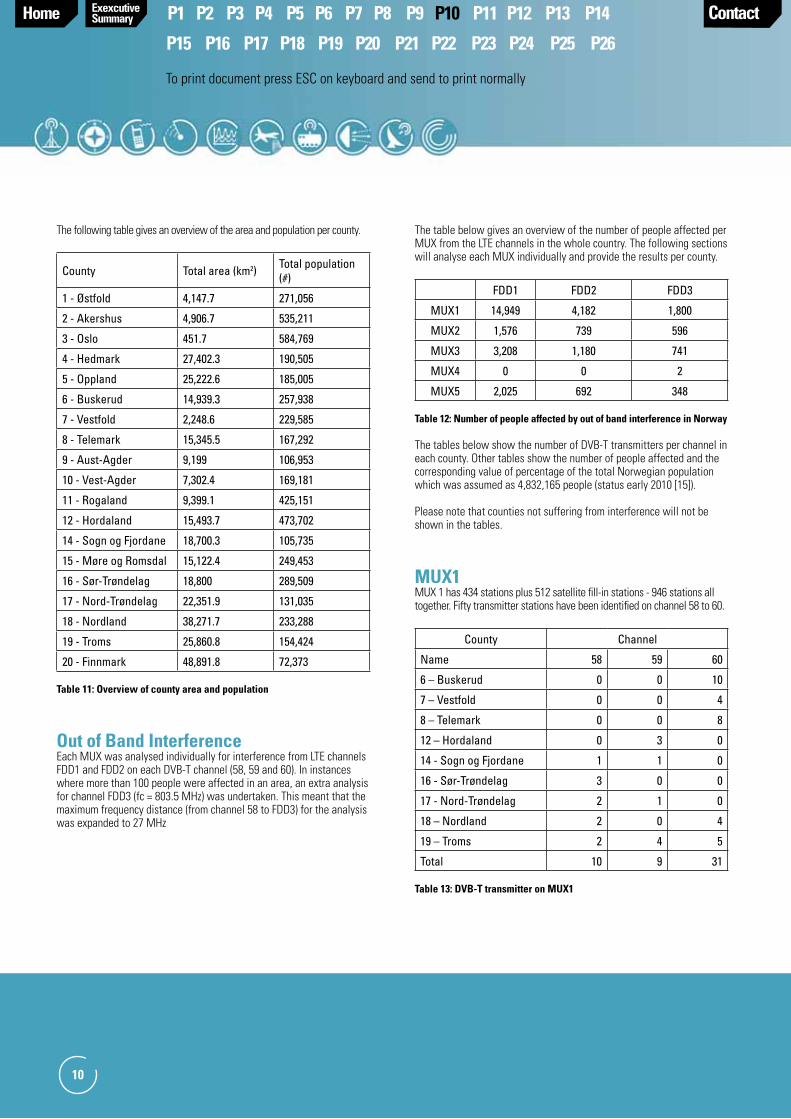
The following table gives an overview of the area and population per county.
County Total area (km2) Total population (#)
1 - Østfold 4,147.7 271,056
2 - Akershus 4,906.7 535,211
3 - Oslo 451.7 584,769
4 - Hedmark 27,402.3 190,505
5 - Oppland 25,222.6 185,005
6 - Buskerud 14,939.3 257,938
7 - Vestfold 2,248.6 229,585
8 - Telemark 15,345.5 167,292
9 - Aust-Agder 9,199 106,953
10 - Vest-Agder 7,302.4 169,181
11 - Rogaland 9,399.1 425,151
12 - Hordaland 15,493.7 473,702
14 - Sogn og Fjordane 18,700.3 105,735
15 - Møre og Romsdal 15,122.4 249,453
16 - Sør-Trøndelag 18,800 289,509
17 - Nord-Trøndelag 22,351.9 131,035
18 - Nordland 38,271.7 233,288
19 - Troms 25,860.8 154,424
20 - Finnmark 48,891.8 72,373
Table 11: Overview of county area and population
Out of Band InterferenceEach MUX was analysed individually for interference from LTE channels FDD1 and FDD2 on each DVB-T channel (58, 59 and 60). In instances where more than 100 people were affected in an area, an extra analysis for channel FDD3 (fc = 803.5 MHz) was undertaken. This meant that the maximum frequency distance (from channel 58 to FDD3) for the analysis was expanded to 27 MHz
The table below gives an overview of the number of people affected per MUX from the LTE channels in the whole country. The following sections will analyse each MUX individually and provide the results per county.
FDD1 FDD2 FDD3
MUX1 14,949 4,182 1,800
MUX2 1,576 739 596
MUX3 3,208 1,180 741
MUX4 0 0 2
MUX5 2,025 692 348
Table 12: Number of people affected by out of band interference in Norway
The tables below show the number of DVB-T transmitters per channel in each county. Other tables show the number of people affected and the corresponding value of percentage of the total Norwegian population which was assumed as 4,832,165 people (status early 2010 [15]).
Please note that counties not suffering from interference will not be shown in the tables.
MUX1MUX 1 has 434 stations plus 512 satellite fill-in stations - 946 stations all together. Fifty transmitter stations have been identified on channel 58 to 60.
County Channel
Name 58 59 60
6 – Buskerud 0 0 10
7 – Vestfold 0 0 4
8 – Telemark 0 0 8
12 – Hordaland 0 3 0
14 - Sogn og Fjordane 1 1 0
16 - Sør-Trøndelag 3 0 0
17 - Nord-Trøndelag 2 1 0
18 – Nordland 2 0 4
19 – Troms 2 4 5
Total 10 9 31
Table 13: DVB-T transmitter on MUX1
To print document press ESC on keyboard and send to print normally
HoHome
HoContactExexcutive
Summary P1
P17
P9
P25
P5
P21
P13P3
P19
P11P7
P23P15
P2
P18
P10
P26
P6
P22
P14P4
P20
P12P8
P24P16

Figure 16: Map of Norway showing MUX 1 DVB-T transmitter locations (yellow dots)
Channel 60
FDD1 FDD2 FDD3
Pop # Pop % Pop # Pop % Pop # Pop %
1 – Østfold 3,447 1.27 972 0.36 483 0.18
2 – Akershus 160 0.03 51 0.01 5 0
6 – Buskerud 3,977 1.54 1,070 0.41 254 0.1
7 – Vestfold 5,900 2.57 1,481 0.65 843 0.37
8 – Telemark 1,327 0.79 551 0.33 211 0.13
9 – Aust-Agder 105 0.1 39 0.04 4 0
18 – Nordland 28 0.01 18 0.01 0 0
19 – Troms 5 0 0 0 0 0
Table 14: interference results for MUX 1 by LTE FDD1, FDD2 and FDD3 on DVB-T channel 60
11
The analysis shows that there is no interference on channel 58 and 59 but a significant interference on channel 60 on FDD1, FDD2 and FDD3. The area of Buskerud, Vestfold and Telemark in the south of the country is subject to significant interference. Even at FDD3, over 800 people would be affected in some areas. The counties Aust-Agder, Østfold and Akershus are adjacent counties and suffer due to overlapping service coverage. Mitigation options had to be considered here to reduce the interference significantly. Some possible mitigation techniques will be discussed later.
The interference occurring further north (Nordland and Troms) is very low and affects less than 30 people.
MUX2MUX 2 has 433 transmitter stations where only 15 have been identified in CH 58-60. As there is no transmitter station identified on channel 60, it was ignored in the following analysis.
County Channel
Name 58 59 60
2 - Akershus 5 0 0
3 - Oslo 2 0 0
12 - Hordaland 5 0 0
14 - Sogn og Fjordane 0 1 0
20 - Finnmark 2 0 0
Total 14 1 0
Table 15: DVB-T transmitter on MUX2
To print document press ESC on keyboard and send to print normally
HoHome
HoContactExexcutive
Summary P1
P17
P9
P25
P5
P21
P13P3
P19
P11P7
P23P15
P2
P18
P10
P26
P6
P22
P14P4
P20
P12P8
P24P16

1212
Figure 17: Map of Norway showing MUX 2 DVB-T transmitter locations (yellow dots)
Channel 58 Channel 59
FDD1 FDD2 FDD3 FDD1 FDD2
Pop # Pop % Pop # Pop % Pop # Pop % Pop # Pop % Pop # Pop %
1 - Østfold 562 0.21 278 0.1 231 0.09 0 0 0 0
2 - Akershus 376 0.07 164 0.03 124 0.02 0 0 0 0
3 - Oslo 134 0.02 78 0.01 78 0.01 0 0 0 0
4 - Hedmark 3 0 0 0 0 0 0 0 0 0
5 - Oppland 19 0.01 15 0.01 15 0.01 0 0 0 0
6 - Buskerud 329 0.13 143 0.06 96 0.04 0 0 0 0
15 - Møre og Romsdal 0 0 0 0 0 0 23 0.01 0 0
20 - Finnmark 130 0.18 61 0.08 52 0.07 0 0 0 0
On channel 58, the south east area of the country (Østfold, Akershus and Oslo) suffers significantly from interference. Østfold is a neighbour county to Akershus, but suffers most from interference. Even on FDD3 over 200 people will still be affected. In this area, mitigation options were recommended to be considered to reduce the interference.
Additionally, in Finnmark over 100 people were found to be affected. On channel 59 only a few people at the west coast area (Møre og Romsdal) would suffer from interference.
Table 16: interference results for MUX 2 by LTE FDD1, FDD2 and FDD3 on DVB-T channel 58 and 59
To print document press ESC on keyboard and send to print normally
HoHome
HoContactExexcutive
Summary P1
P17
P9
P25
P5
P21
P13P3
P19
P11P7
P23P15
P2
P18
P10
P26
P6
P22
P14P4
P20
P12P8
P24P16

13
Figure 18: Map of Norway showing MUX 3 DVB-T transmitter locations (yellow circles)
MUX3• MUX3has433transmitterstations–55identifiedinCH58-60
County Channel
Name 58 59 60
5 - Oppland 10 0 0
7 - Vestfold 0 4 0
8 - Telemark 0 1 0
12 - Hordaland 0 1 5
14 - Sogn og Fjordane 0 5 0
15 - Møre og Romsdal 0 1 0
16 - Sør-Trøndelag 0 3 0
17 - Nord-Trøndelag 0 0 0
18 - Nordland 7 2 9
19 - Troms 0 0 1
20 - Finnmark 0 2 4
Total 17 19 19
Table 17: DVB-T transmitter on MUX3
Channel 58 Channel 59 Channel 60
FDD1 FDD2 FDD1 FDD2 FDD3 FDD1 FDD2 FDD3
Pop # Pop % Pop # Pop % Pop # Pop % Pop # Pop % Pop # Pop % Pop # Pop % Pop # Pop % Pop # Pop %
1 - Øestfold 0 0 0 0 578 0.21 290 0.11 128 0.05 0 0 0 0 0 0
2 - Akershus 0 0 0 0 5 0 0 0 0 0 0 0 0 0 0 0
5 - Oppland 13 0.01 4 0 0 0 0 0 0 0 0 0 0 0 0 0
7 - Vestfold 0 0 0 0 862 0.38 536 0.23 396 0.17 0 0 0 0 0 0
11 - Rogaland 0 0 0 0 0 0 0 0 0 0 396 0.09 64 0,02 25 0.01
12 - Hordaland 0 0 0 0 0 0 0 0 0 0 329 0.07 33 0.01 29 0.01
18 - Nordland 5 0 1 0 3 0 0 0 0 0 659 0.28 194 0.08 133 0.06
19 - Troms 0 0 0 0 2 0 2 0 1 0 0 0 0 0 0 0
20 - Finnmark 0 0 0 0 75 0.1 38 0.05 29 0.04 273 0.38 18 0.02 0 0
Table 18: interference results for MUX 3 by LTE FDD1, FDD2 and FDD3 on DVB-T channel 58, 59 and 60
13
To print document press ESC on keyboard and send to print normally
HoHome
HoContactExexcutive
Summary P1
P17
P9
P25
P5
P21
P13P3
P19
P11P7
P23P15
P2
P18
P10
P26
P6
P22
P14P4
P20
P12P8
P24P16

14
Channel 58 suffers marginally in the two areas where transmitter stations were deployed. In Oppland and Nordland, a maximum of 13 people were affected on FDD1 and even less on FDD2.
Channel 59 suffers significantly in the south coast area (Østfold and Vestfold). Although all stations are located in Vestfold, as an adjacent county Østfold suffers from overlapping signal coverage. The number of impacted people was found to be high and mitigation options were recommended to be considered to reduce the interference. Further to the north in Finnmark, less than 100 people would suffer from interference. On the south west coast (Rogaland and Hordaland), channel 60 suffers from significant interference from FDD1. The interference drops dramatically on FDD2 and FDD3. Nordland county suffers from interference as well. Again, there was a dramatic decrease of people being subject to interference caused by FDD2 and FDD3. This effect was even more noticeable in Finnmark where the number goes from 273 to 18. The reason for that significant change between the interfering channels is the uneven distribution of population especially in the rural areas. Reducing the interference area by a few kilometres was found to hold the potential to have a dramatic impact on the population affected.
MUX4MUX4 contains 433 stations but only 2 have been identified for channel 58 and 59. There was no transmitter station using channel 60 found.
County Channel
Name 58 59 60
16 - Sør-Trøndelag 0 1 0
19 - Troms 1 0 0
Total 1 1 0
Table 19: DVB-T transmitter on MUX4
Figure 19: Map of Norway showing MUX 4 DVB-T transmitter locations (yellow dots)
Channel 58 Channel 59
FDD1 FDD2 FDD1 FDD2
Pop # Pop % Pop # Pop % Pop # Pop % Pop # Pop %
16 - Sør-Trøndelag 0 0 0 0 2 0 0 0
Table 20: interference results for MUX 4 by LTE FDD1 and FDD2 on DVB-T channel 58 and 59
The interference on both channels was almost zero.
To print document press ESC on keyboard and send to print normally
HoHome
HoContactExexcutive
Summary P1
P17
P9
P25
P5
P21
P13P3
P19
P11P7
P23P15
P2
P18
P10
P26
P6
P22
P14P4
P20
P12P8
P24P16
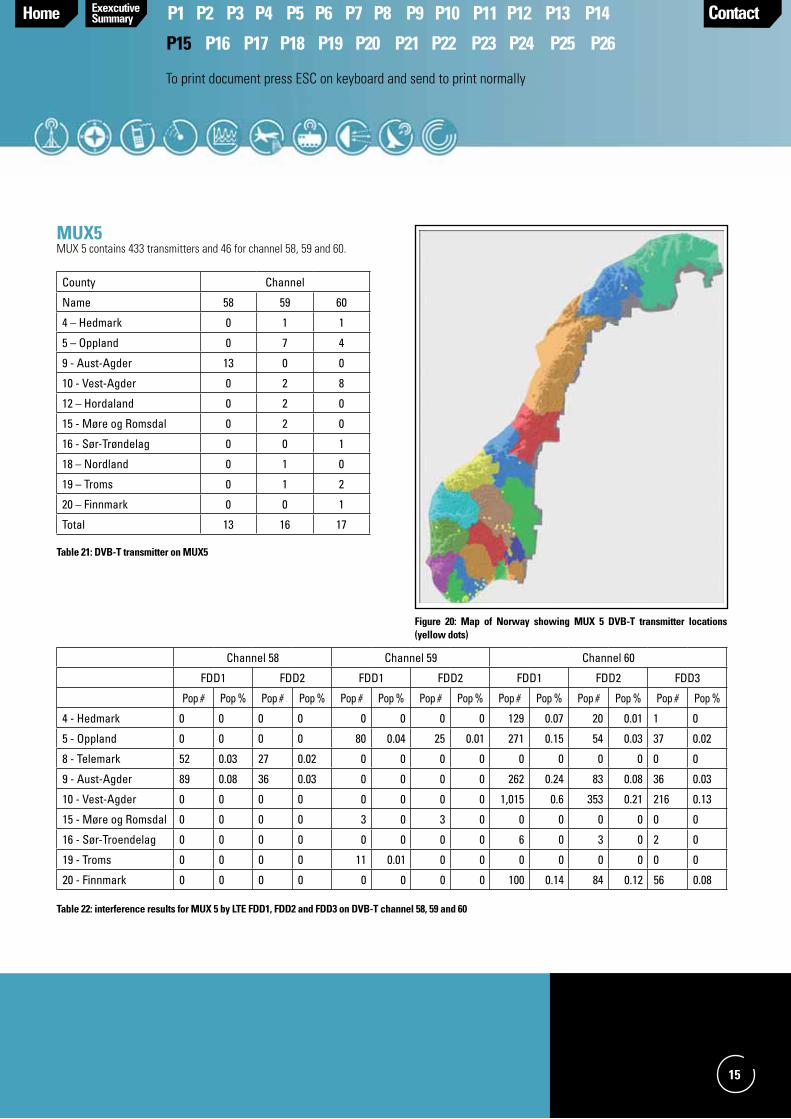
MUX5MUX 5 contains 433 transmitters and 46 for channel 58, 59 and 60.
County Channel
Name 58 59 60
4 – Hedmark 0 1 1
5 – Oppland 0 7 4
9 - Aust-Agder 13 0 0
10 - Vest-Agder 0 2 8
12 – Hordaland 0 2 0
15 - Møre og Romsdal 0 2 0
16 - Sør-Trøndelag 0 0 1
18 – Nordland 0 1 0
19 – Troms 0 1 2
20 – Finnmark 0 0 1
Total 13 16 17
Table 21: DVB-T transmitter on MUX5
Figure 20: Map of Norway showing MUX 5 DVB-T transmitter locations (yellow dots)
Channel 58 Channel 59 Channel 60
FDD1 FDD2 FDD1 FDD2 FDD1 FDD2 FDD3
Pop # Pop % Pop # Pop % Pop # Pop % Pop # Pop % Pop # Pop % Pop # Pop % Pop # Pop %
4 - Hedmark 0 0 0 0 0 0 0 0 129 0.07 20 0.01 1 0
5 - Oppland 0 0 0 0 80 0.04 25 0.01 271 0.15 54 0.03 37 0.02
8 - Telemark 52 0.03 27 0.02 0 0 0 0 0 0 0 0 0 0
9 - Aust-Agder 89 0.08 36 0.03 0 0 0 0 262 0.24 83 0.08 36 0.03
10 - Vest-Agder 0 0 0 0 0 0 0 0 1,015 0.6 353 0.21 216 0.13
15 - Møre og Romsdal 0 0 0 0 3 0 3 0 0 0 0 0 0 0
16 - Sør-Troendelag 0 0 0 0 0 0 0 0 6 0 3 0 2 0
19 - Troms 0 0 0 0 11 0.01 0 0 0 0 0 0 0 0
20 - Finnmark 0 0 0 0 0 0 0 0 100 0.14 84 0.12 56 0.08
Table 22: interference results for MUX 5 by LTE FDD1, FDD2 and FDD3 on DVB-T channel 58, 59 and 60
15
To print document press ESC on keyboard and send to print normally
HoHome
HoContactExexcutive
Summary P1
P17
P9
P25
P5
P21
P13P3
P19
P11P7
P23P15
P2
P18
P10
P26
P6
P22
P14P4
P20
P12P8
P24P16
16
Channel 58 suffers from interference in the centre area Telemark and Aust-Agder. All stations are deployed in Aust-Agderbut but, as a neighbouring county, Telemark suffers also from interference. The affected number of people is relatively small and decreases when FDD2 is analysed.
Channel 59 has relatively low interference in the Oppland county area. Interference from FDD2 drops down to less than 25 people. Additionally, there are only 11 people affected further north in Troms. The undertaken analysis provided conservative results; for example, it did not take transmission power control into account. Therefore, changing the system by only 1dB (e.g. new equipment, different transmit power, etc.) was found to be capable of changing the result by approximately 18% (based on mitigation option 2, 3dB change will affect 55% of population). This means that these 11 people might disappear (or double) based on the system tolerance. Channel 60 suffers from significant interference at the south coast area (Aust-Agder, Vest-Agder). There is a population of more than 1,000 people affected. Vest-Agder, where the DVB-T transmitter is based, is subject to high interference but also Aust-Agder as a neighbour is still suffering from interference. Interference from FDD2 and FDD3 are dramatically less than FDD1. In this area, mitigation options were strongly advised.
Additionally, in the Oppland and Hedmark area interference occurred. The interfered population decreased by up to 200 people in the analysis of FDD2.
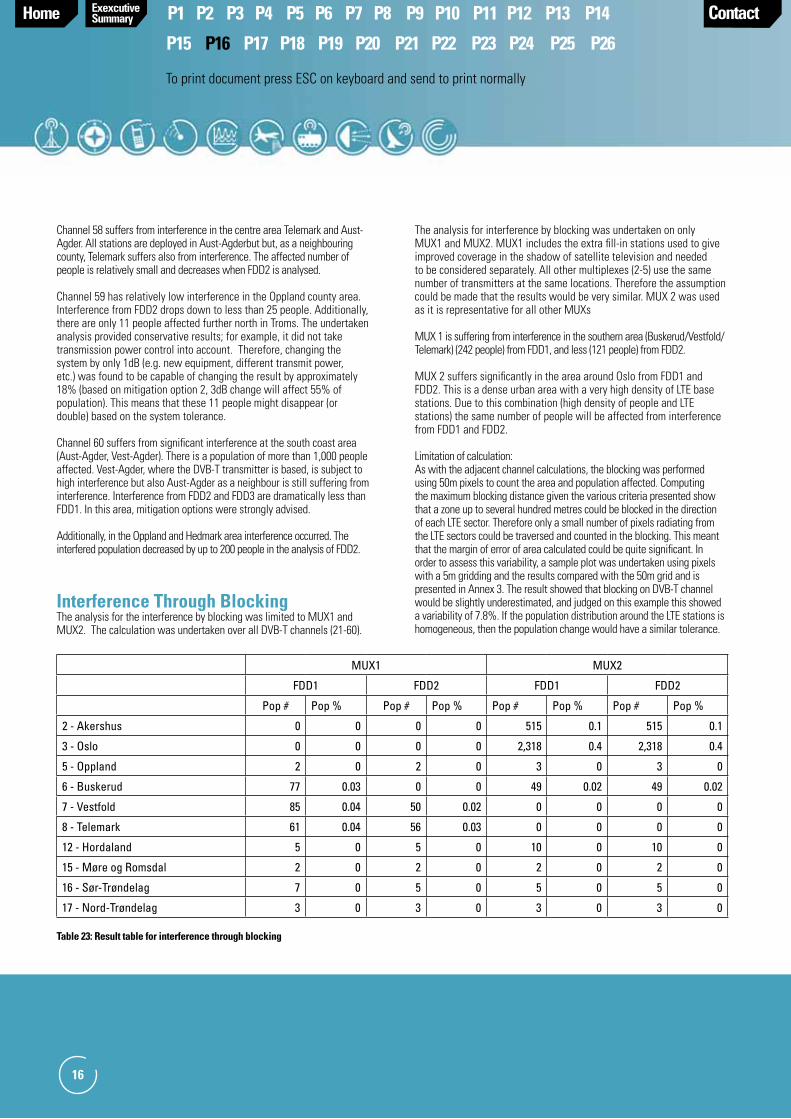
Interference Through BlockingThe analysis for the interference by blocking was limited to MUX1 and MUX2. The calculation was undertaken over all DVB-T channels (21-60).
The analysis for interference by blocking was undertaken on only MUX1 and MUX2. MUX1 includes the extra fill-in stations used to give improved coverage in the shadow of satellite television and needed to be considered separately. All other multiplexes (2-5) use the same number of transmitters at the same locations. Therefore the assumption could be made that the results would be very similar. MUX 2 was used as it is representative for all other MUXs
MUX1issufferingfrominterferenceinthesouthernarea(Buskerud/Vestfold/Telemark) (242 people) from FDD1, and less (121 people) from FDD2.
MUX 2 suffers significantly in the area around Oslo from FDD1 and FDD2. This is a dense urban area with a very high density of LTE base stations. Due to this combination (high density of people and LTE stations) the same number of people will be affected from interference from FDD1 and FDD2.
Limitation of calculation:As with the adjacent channel calculations, the blocking was performed using 50m pixels to count the area and population affected. Computing the maximum blocking distance given the various criteria presented show that a zone up to several hundred metres could be blocked in the direction of each LTE sector. Therefore only a small number of pixels radiating from the LTE sectors could be traversed and counted in the blocking. This meant that the margin of error of area calculated could be quite significant. In order to assess this variability, a sample plot was undertaken using pixels with a 5m gridding and the results compared with the 50m grid and is presented in Annex 3. The result showed that blocking on DVB-T channel would be slightly underestimated, and judged on this example this showed a variability of 7.8%. If the population distribution around the LTE stations is homogeneous, then the population change would have a similar tolerance.
MUX1 MUX2
FDD1 FDD2 FDD1 FDD2
Pop # Pop % Pop # Pop % Pop # Pop % Pop # Pop %
2 - Akershus 0 0 0 0 515 0.1 515 0.1
3 - Oslo 0 0 0 0 2,318 0.4 2,318 0.4
5 - Oppland 2 0 2 0 3 0 3 0
6 - Buskerud 77 0.03 0 0 49 0.02 49 0.02
7 - Vestfold 85 0.04 50 0.02 0 0 0 0
8 - Telemark 61 0.04 56 0.03 0 0 0 0
12 - Hordaland 5 0 5 0 10 0 10 0
15 - Møre og Romsdal 2 0 2 0 2 0 2 0
16 - Sør-Trøndelag 7 0 5 0 5 0 5 0
17 - Nord-Trøndelag 3 0 3 0 3 0 3 0
Table 23: Result table for interference through blocking
To print document press ESC on keyboard and send to print normally
HoHome
HoContactExexcutive
Summary P1
P17
P9
P25
P5
P21
P13P3
P19
P11P7
P23P15
P2
P18
P10
P26
P6
P22
P14P4
P20
P12P8
P24P16

MitigationThis section looks at six different mitigation options to reduce the out of band interference or the interference by blocking. Each option was assessed individually. The figures for interfered population are always referenced to the population of the individual county. Therefore the analysis is done between the before and after figures. Afterwards a short comparison of advantages and disadvantages of the mitigation options will be discussed.
The analysis was undertaken in a sample area in the south west of Oslo. All calculations were done on MUX1 between DVB-T channel 60 and LTE FDD1. The figure below shows the sample area including the DVB-T transmitter stations.
Figure 21: Mitigation test area near Oslo, yellow squares – DVB-T transmitter position
Ad-hoc Filters at Domestic DVB-T Receivers to Eliminate Blocking Interference From LTE.One of the easiest and quickest mitigation options for a mobile network provider would be using an in-line filter at the DVB-T receiver. Typically these are low-pass filter types. Low pass filters have an impact upon the DVB-T coverage area, because they have some insertion loss,
therefore increasing the receiving system noise figure. CEPT Report 30 [11] contains a specification for a typical filter with the purpose of reducing DVB-T receiver blocking. Based upon Report 30 the following filter response characteristic was used for the modelling.
Filter response 790 797 802 807 812 Frequency
Attenuation (dB) 1 2 4 10 20 loss dB
Table 24: DVB-T Low cost Filter CEPT Report 30 page 82 Figure A3.8
The results of the interference calculations are presented in the table below. The table shows the population interfered before (without filter) and after (with filter) mitigation.
Channel 60
Before after
Pop # Pop % Pop # Pop %
1 - Østfold 3,447 1.27 1,786 0.66
2 - Akershus 160 0.03 84 0.02
6 - Buskerud 3,977 1.54 2,259 0.88
7 - Vestfold 5,900 2.57 3,272 1.43
8 - Telemark 1,327 0.79 934 0.56
9 - Aust-Agder 105 0.1 39 0.04
Sum: 14,916 8,374
Table 25: Mitigation results for using a filter at DVB-T receiver
The table above shows that using filters at the receiver end would reduce the interference by 6,500 people or 56%.
Filtering of the LTE Base Station Power Spectra to Avoid Out of Band Interference.Filters at the LTE transmitter site were found to be capable of improvinge the out of band interference situation. The filters would reduce the LTE coverage due to the insertion loss of the filter. A filter at the LTE base station should reduce the transmit power at a specific frequency range. The CEPT Report 30 also discusses base station transmitters.
Following a more generic report (not to favour a specific supplier) the impact of 3 different filter attenuations was analysed. Considering filters could be used providing a signal reduction of 3, 6 and 9 dB, the following results were calculated.
17
To print document press ESC on keyboard and send to print normally
HoHome
HoContactExexcutive
Summary P1
P17
P9
P25
P5
P21
P13P3
P19
P11P7
P23P15
P2
P18
P10
P26
P6
P22
P14P4
P20
P12P8
P24P16

The table above shows that using the smallest filter of 3 dB provides a significant improvement in the out-of-band interference. About 8,200 people or 55 % of the affected population would suffer less from interference effects. Using a 6 dB filter would reduce the interference by 80% or 11,900 people. The usage of a 9 dB filter would improve the interference situation by over 90% or 13,498 people in the test area.
The analysis also indicated that the improvement from a 3 dB filter to a 6 dB filter is about 3,700 people or 25%. And the difference between the 6 dB filter and a 9 dB filter is even less with 1,600 people or 10% of the affected population. Therefore it can be noted that using a filter at the LTE transmitter side has a huge impact on the interference situation; the type of filter has a smaller impact.
The British company IsoTek did further investigations on filters at the transmitter site for the 800 MHz band. The report [12], published by the UK regulator, Ofcom, is recommended for further information.
Different Polarisation Arrangements.DVB-T emissions in Norway are mostly horizontally polarised because this polarisation has been shown to fade less than vertical, particularly where the path transits forested areas. Using a vertically polarised LTE signal would increase the antenna discrimination to horizontally polarised broadcast antennas which would make the receiver less vulnerable to the interfering signal. The GE06 considers maximum antenna discrimination for orthogonal polarisation of 16 dB. The original calculation considered 3 dB polarisation discrimination for dual slant antennas. The following table shows the results before and after the mitigation.
Channel 60
Before after
Pop # Pop % Pop # Pop %
1 - Østfold 3,447 1.27 113 0.04
2 - Akershus 160 0.03 0 0
6 - Buskerud 3,977 1.54 72 0.03
7 - Vestfold 5,900 2.57 379 0.17
8 - Telemark 1,327 0.79 22 0.01
9 - Aust-Agder 105 0.1 0 0
Sum: 14,916 586
Table 27: mitigation results for using cross polar systems
The results table above shows a significant improvement after using orthogonal polarisation. The affected population is reduced by 14,500 people in the test area or by 96%. This is the biggest impact of all tested mitigation options. Table 26 will discuss the practicalities of achieving this and the other options.
Channel 60 - FDD1
Before 3dB 6dB 9dB
Pop # Pop % Pop # Pop % Pop # Pop % Pop # Pop %
1 - Østfold 3,447 1.27 1,519 0.56 877 0.32 315 0.12
2 - Akershus 160 0.03 64 0.01 18 0 0 0
6 - Buskerud 3,977 1.54 1,727 0.67 520 0.2 215 0.08
7 - Vestfold 5,900 2.57 2,523 1.1 1,099 0.48 732 0.32
8 - Telemark 1,327 0.79 823 0.49 471 0.28 156 0.09
9 - Aust-Agder 105 0.1 36 0.03 11 0.01 0 0
Sum: 14,916 6,692 2,996 1,418
Table 26: Mitigation results for using different filter attenuations at LTE transmitter
18
To print document press ESC on keyboard and send to print normally
HoHome
HoContactExexcutive
Summary P1
P17
P9
P25
P5
P21
P13P3
P19
P11P7
P23P15
P2
P18
P10
P26
P6
P22
P14P4
P20
P12P8
P24P16

19
Improved Antenna at the Domestic Receiver.The antenna used in this study is based on the ITU-R BT 419-3 antenna model, which can be considered as a mask representing the minimum performance. Real antenna patterns may have a better directional gain or better side lobe suppression. Report ITU-R BT.2138 [13] contains the results of various measured patterns for different types of antennas and compares them with the BT. 419 specification.
The report describes a number of different types, predominately comprising conventionalYagiantennasandphasedarraysongridreflectors.Yagiantennas have the property of high gain, and are often used towards the edge of coverage areas, but these antennas often exhibit poor side lobe performance. Phased array antennas have a lower gain than Yagi antennas but their advantage is a better side lobe performance so that interfering radiation coming off beam is often well attenuated. Antenna model 3 is a phased array antenna with 4 elements. The following figure shows the used antenna pattern derived from the ITU BT 2138.
Figure 22: horizontal pattern of alternative phased array antenna
The following table shows the mitigation effect using the antenna above.
Channel 60
before After
Pop # Pop % Pop # Pop %
1 – Østfold 3,447 1.27 1,236 0.46
2 – Akershus 160 0.03 26 0
6 – Buskerud 3,977 1.54 1,396 0.54
7 – Vestfold 5,900 2.57 1,787 0.78
8 – Telemark 1,327 0.79 658 0.39
9 - Aust-Agder 105 0.1 32 0.03
Sum: 14,916 5,135
Using an antenna with better side lobe attenuation was found to be capable of reducing the affected population by 65% or about 9,800 people in the reference area. This comes at the expense of poorer antenna gain, so these antennas were recommended to be used only in an area with stronger signals from the broadcast system such as urban areas. The assumption was that the performance of these antennas is achievable inarealinstallationandthat,evenwiththeeffectsofreflectionsfromclutter; the improved side lobe suppression is achievable.
LTE Frequency Blocks Used in Restricted WaysTo alleviate the interference to DVB-T, particularly to channel 60, the use of FDD1 could be restricted, such that they not used in key areas. Taking the mitigation area, not using FDD1 but FDD2 instead, results in a population recovery of 72% or 10,752 people (see table below). This is tantamount to a guard band and is therefore not spectrally efficient, so it was suitable only as a temporary measure to mitigate interference while other measures were implemented. This method could have been used while SFN fillers were implemented - or DVB-T channels changed - while new broadcast assignment frequencies were coordinated (e.g. as in MUX3, where channel 61 and 62 are in operation, and MUX 6 which was awaiting international coordination at the time of writing this case study). The technique would involve delineating an area, outside of which LTE stations would not generate any undue loss of DVB-T population coverage, and within which the use of FDD1 would be excluded.
Channel 60
before (FDD1) after (FDD2)
Pop # Pop % Pop # Pop %
1 - Øestfold 3,447 1.27 972 0.36
2 - Akershus 160 0.03 51 0.01
6 - Buskerud 3,977 1.54 1,070 0.41
7 - Vestfold 5,900 2.57 1,481 0.65
8 - Telemark 1,327 0.79 551 0.33
9 - Aust-Agder 105 0.1 39 0.04
Sum: 14,916 4,164
Figure 23: Mitigation results from forbidding FDD1 in test area
To print document press ESC on keyboard and send to print normally
HoHome
HoContactExexcutive
Summary P1
P17
P9
P25
P5
P21
P13P3
P19
P11P7
P23P15
P2
P18
P10
P26
P6
P22
P14P4
P20
P12P8
P24P16

SFN Fill-in DVB-T Stations to Increase Signal Level in Areas.ATDI found that deploying extra SFN (single frequency network) fill-in stations would help to improve the DVB-T signal strength in the service area.TheextraboostofthewantedDVB-TsignalwouldincreasetheC/I(carriertointerference)ratio.ImprovingtheC/Iratioandliftingitabovethe minimum PR would reduce the interference. This mitigation would lower adjacent channel interference and blocking. This technique is often used in areas with low wanted signal strength like at the edge of the coverage area or in shadow areas (valleys, behind hill tops). The technical configuration for fill-in stations depends on the general DVB-T network plan. So called “on channel repeaters” can be used to rebroadcast the DVB-Tsignal.Thesimplestformisanactivedeflectorwhichsimplyreceives a DVB-T signal, boosts it with a high gain amplifier and transmits it in another direction.
In the absence of specific technical configurations, general parameters based on existing Fill-in stations from MUX1 were used (see table below).
Frequency According to the interfered transmitter
Power (W) 10 (90 percentile of MUX1 fill-in stations)
Antenna gain (dBi) 0
Antenna height (m) 20 (90 percentile of fill-in station
Table 28: Fill-in station parameters derived from MUX1 satellite fill-in stations
For this assessment, 5 extra fill-in sites were placed in areas with predicted interference. The stations were configured as described in the table above with omnidirectional antennas. The five locations are shown in the picture below where the yellow squares indicate the original MUX1 transmitter stations and the blue ones the new fill-in stations.
Figure 24: fill-in stations in mitigation area, yellow - MUX1 DVB-T transmitter, blue - fill-in stations
For further information on signal rebroadcasting and applicable hardware please read the Aegis report [14].
20
To print document press ESC on keyboard and send to print normally
HoHome
HoContactExexcutive
Summary P1
P17
P9
P25
P5
P21
P13P3
P19
P11P7
P23P15
P2
P18
P10
P26
P6
P22
P14P4
P20
P12P8
P24P16

21
The interference improvement using extra fill-in stations is shown in the table below.
Channel 60
before After
Pop # Pop % Pop # Pop %
1 - Øestfold 3,447 1.27 3,232 1.19
2 - Akershus 160 0.03 130 0.02
6 - Buskerud 3,977 1.54 522 0.2
7 - Vestfold 5,900 2.57 5,317 2.32
8 - Telemark 1,327 0.79 1,231 0.74
9 - Aust-Agder 105 0.1 42 0.04
Sum: 14,916 10,474
Table 29: mitigation results from using extra Fill-in stations
Using five fill-in stations reduced the interference by about 30% or over 4,400 people.
To print document press ESC on keyboard and send to print normally
HoHome
HoContactExexcutive
Summary P1
P17
P9
P25
P5
P21
P13P3
P19
P11P7
P23P15
P2
P18
P10
P26
P6
P22
P14P4
P20
P12P8
P24P16

22
The following table will summarise all the mitigation options that have been explored and discuss the necessary effort and costs for implementing.
Mitigation option Interference reduction Effort and Costs
1. Ad-Hoc receiver filters
Medium reduction
Only interference through blocking can be reduced by 56%.
This filter will improve only interference through blocking and may need to be combined with other options
In small (rural) areas with a relatively low population, the inclusion of low pass filters at the DVB-T receiver can be a quick and effective solution. The costs for a filter are relatively small; the number of DVB-T receivers is relatively low.
In urban areas with high population, the costs for providing a filter will increase dramatically.
2. Transmitter filters
Medium to high reduction
Only Out-of-Band interference can be reduced by
3 dB filter – 55 %6 dB filter – 80 %10 dB filter – 90 %
This filter type will improve only out of band interference and may need to be combined with other options.
The costs are relatively low with 200€ - 250€ per filter (based on ISOTEK report [12]).
3. Polarisation arrangement
High reduction
Reduction of Out-of-band interference and blocking by 96 %
Changing the LTE system polarisation from 45° slant to vertical polarisation might include reconsidering base station antennas in badly affected areas as only a local option. The effect on the interference situation is the best of all mitigation options.
Changing LTE service polarisation will also have a significant impact on the mobile reception. Dual polarisation is preferred by cellular operators, because it has been shown that polarisation diversity results in a gain at the receiving user terminal
4. Alternative antennas
Medium reduction
Reduction of out of band interference by 65 %
Often used Yagi antennas provide a high receiving antenna gain but have bad side lobe attenuation. Using alternative antennas with better side lobe suppression provides a better reduction of the out of band interference. This means, on the other hand, that the antenna gain may be reduced and the signal strength might drop.
Please note: This calculation was applied only to out of band interference. However, the interference through blocking would also improve.
5. Restrict frequency blocks
Medium/high reduction
Reduction of interference (blocking and out of band) by 72%
Restricting interfering frequency blocks in certain areas should be only a local and temporary solution. For a mobile service provider, avoiding one or more channels in a certain area means not being able to provide the desired service to the customer. Therefore it is possible only if alternative frequencies are available and owned by the provider.
Restricting a wider block (including 2 or more LTE channels) will increase the interference reduction up to 100%.
6. SFN Fill-in stations
Low reduction
Reduction of interference by 30%
Fill-in stations are already deployed nationwide as satellite shadow fill-ins for MUX1. This mitigation technique can be a local option in small areas of weak DVB-T coverage.
The cost for on-channel repeaters are between 6,000€ and 9,000€ (source AEGIS report [14] 3.3.8).
Fill-in stations are where the signal level drops due to blocking or attenuation due to terrain or obstacles.
Table 30: comparing mitigation results and costs
To print document press ESC on keyboard and send to print normally
HoHome
HoContactExexcutive
Summary P1
P17
P9
P25
P5
P21
P13P3
P19
P11P7
P23P15
P2
P18
P10
P26
P6
P22
P14P4
P20
P12P8
P24P16

23
Additionally to the six mitigation options discussed above there were other possibilities to reduce interference effects.
When the interfering LTE station and best serving DVB-T station are located in the same direction, interference through blocking would potentially be very high as the receiver antenna would boost the wanted and the unwanted signal. Pointing the receiver antenna in the direction of another DVB-T transmitter would help reduce degradation of the LTE signal (due to antenna discrimination) and reduce the interference.
Conclusions and RecommendationsATDI looked at the potential interference from a future LTE mobile network into a national DVB-T network in Norway. There were two types of interference investigated. Firstly, interference from adjacent channels (out of band). This assessment concentrated on interference of each of the broadcast channels (58, 59 and 60) caused by the LTE channels (FDD1 to FDD2). And, secondly, the interference through blocking. The blocking interference analysis considered interference from FDD1 and FDD 2 into the whole DVB-T band.
The results showed that the out of band interference had a bigger impact than the blocking.
The out of band interference had the bigger impact on population and area. The results showed that the population predicted to be affected for the out of band interference ranged from 2 people (Mux 4 Ch58) to 14,949 people (Mux1 Ch60). The analysis showed that MUX1 and MUX5 may have been impacted most. The worst affected area and channel appeared to be around Oslo where Channel 60 on MUX1 configured as an SFN is deployed to the north and east of capital
The results for the interference through blocking showed that it occurred only several hundred metres around an LTE base station in the direction of each LTE sector.
The analysis also showed that the impact of the LTE signal was related to the population in the area. There were areas (especially in the north) with a very low population where an LTE network may have had a very small impact. On the other hand there are highly populated areas in the south where many people may have suffered from interference.
To reduce the interference, several mitigation techniques were investigated in a sample area around Oslo. None of the mitigation techniques investigated was the cure-all on its own. Each technique had benefits in terms of cost versus effectiveness. Using receiver ad-hoc filters, for example, showed an improvement of 56% and could be used as an effective tool against interference through blocking. The deployment of additional in-fill DVB-T was also projected to prove a good solution in small local areas, improving the wanted signal and reducinge the interference by 30%..
The single most efficient mitigation technique was found to be to limit interfering LTE base stations to only vertical polarisation. This was based on the fact that (with a few minor exceptions) the Norwegian DVB-T network is horizontally polarised. This would provide extra antenna discrimination up to 16dB and was projected to improve the interference by 96%.
The assessment took a conservative approach. Modern transmitter base stations use transmit power control (TPC) to adjust the transmitted power in respect of the receiver distance. Therefore, the interference (out of band and blocking) would be significantly lower as less energy would be radiated by the LTE stations. Additionally, the interference was calculated on the basis that the entire population use DVB-T as the only means of digital television broadcast reception. But, it is possible to receive TV through alternative sources such as satellite systems, cable providers or even via a broadband connection. Therefore the real number of affected people was projected to be significantly smaller than shown in the results.
It should be also mentioned that all mitigation options were analysed separately. The combination of, for example, receiver filters and transmitter filters was considered to hold potential for a much better effect than shown in the results. On the other hand, mitigation techniques like fill-in stations or polarisation arrangements are only temporarily applicable or for a local or regional area.
RecommendationsTo minimise the population affected by deployment of LTE technology in Norway a number of actions were considered.
While network designs were being completed, LTE operators were urged to consider the interference potential to the DVB-T networks and were asked to suggest mitigation techniques.
A feasibility study was proposed involving re-assignment of spectrum of affected areas away from channels 58 to 60; ATDI also suggested analysing the effects of not using these channels in highly populated areas to determine how effective this would be in combating the interference effects.
A test to determine the actual levels of interference that could be tolerated. ATDI proposed investigating the effectiveness of TPC. The results of that could then be used to modify the figures obtained from ATDI’s analysis.
As the polarisation arrangement provided the best results, the company also suggested an experiment to see if an antenna discrimination of 16dB was achievable and desirable.
To print document press ESC on keyboard and send to print normally
HoHome
HoContactExexcutive
Summary P1
P17
P9
P25
P5
P21
P13P3
P19
P11P7
P23P15
P2
P18
P10
P26
P6
P22
P14P4
P20
P12P8
P24P16

24
References[1] CEPT Report 31 - “Technical considerations regarding
harmonisation options f or the digital dividend in the European Union”
[2] ECC report 148 – Measurements on the performance of DVB-T receivers in the presence interference from the mobile service (especially from LTE), Marseille, June 2010
[3] GE06 – “Final Acts of the Regional Radio communication Conference for planning of the digital terrestrial broadcasting service in parts of Regions 1 and 3, in the frequency bands 174- 230 MHz and 470-862 MHz (RRC-06) Geneva” Geneva, ITU, 2006.
[4] ITU-R BT.419-3, “Directivity and polarization discrimination of antennas in the reception of television broadcasting”, ITU 1992
[5] ITU-R P.1546-4 – “Method for point-to-area predictions for terrestrial services in the frequency range 30 MHz to 3 000 MHz”, ITU 2009
[6] CEPT report 40, “Compatibility study for LTE and WiMAX operatingwithinthebands880-915MHz/925-960MHzand1710-1785MHz/1805-1880MHz(900/1800MHzbands)” , Final Report on 12 November 2010
[7] Okumura-Hata Model, Okumura, Y. a kol.: “Field Strength and its Variability in VHF and UHF Land-Mobile Radio Service”. Rev. Elec. Comm. Lab. No.9-10pp. 825 - 873, 1968 - Hata, M.: “Empirical Formula for Propagation Loss in Land Mobile Radio Services”, IEEE Trans. Vehicular Technology, VT-29, pp. 317 - 325, 1980.
[8] ECC report CPG11-1 PT-D , “comments on JTG5-6 propagation model, Maisons-Alfort, 14-15 April 2009
[9] ITUJTG5-6,Document5-6/107-E–“UpdatedJointTaskGroup 5-6 propagation model” , November 2009
[10] ECC report 101 “Compability studies in the band 5855– 5925 MHz between intelligent transport systems (ITS) and other systems”, Bern, February 2007
[11] CEPT report 30, “The identification of common and minimal (least restrictive) technical conditions for 790 - 862 MHz for the digital dividend in the European Union” , Final Report on 30 October 2009
[12] ISOTEK – “High Q Filter Feasibility Study For Base-Station and Radar Receiver Applications” , Isotek Electronics Ltd, 10-2009
[13] ITU-R BT.1368-8, “Planning criteria for digital terrestrial televisionservicesintheVHF/UHFbands”,ITU2008
[14] AEGIS report, “The feasibility of DVB-T on-channel repeaters for coverage repair on Channel 60”, Aegis Spectrum engineering, 08-2009
[15] SSB –Statistik SentralByra (Norwegian central statistics office), providing statistics about Norwegian population,
www.ssb.no/befolkning_en
Appendicies
Appendix 1 – System Parameters
The following parameters were used for the DVB-T system and the LTE system for the calculation
DVB-T System:
DVB-T Transmitter:• ChannelBandwidth:8MHz• Modulation:64-QAM• Coderate:2/3• FFTsize:8k DVB-T Receiver:• 10mantennaheight• Directionalantenna(ITU-RBT149)
LTE system parameter:
Each site in the mobile network has the following characteristics:• Channelbandwidth:5MHz/10MHz• Nominalpower:20W(basedonECCReport40,table1)• BasestationAntenna: • Kathrein80010293 • Gain:16.5dBi • Halfpower(-3dB)beamwidth(H):65deg • Halfpower(-3dB)beamwidth(V):10deg • Electricaldowntilt:3deg• Polarisation:dualslantpolarisation(+45º/-45ºpolarisation)
Kathrein 800 10293 antenna pattern, red – horizontal, blue - vertical
To print document press ESC on keyboard and send to print normally
HoHome
HoContactExexcutive
Summary P1
P17
P9
P25
P5
P21
P13P3
P19
P11P7
P23P15
P2
P18
P10
P26
P6
P22
P14P4
P20
P12P8
P24P16

25
Appendix 2 – Argument Against Using SFN GainThe following assessment is the argument why SFN gain has not been considered in the analysis:
The blue areas in the left hand side figure below are where SFN gain will occur if an Omni-directional antenna is being used. This is around 382 km2 where multiple SFN signals would improve the coverage. The same calculation was repeated except an ITU-R 419 antenna (right hand side figure below) was pointed at the best server. This means that in most cases the signals from other DVB-T transmitters would probably be attenuated by the antenna pattern.
Figure 25: SFN gain for Omni and directional antennas
The areas where SFN gain would help reception has decreased to around 68 km2
The above calculation was undertaken for DVB-T channel 60 in the Region 1 area which is around 18 788 km2. This means that this network has SFN gain on 1dB or more over 2% of region 1 for an Omni receive antenna. This drops to 0.4% when directional antennas are used.
As can be seen the SFN gain is more important in the Omni antenna case. Where directional antennas are mounted at roof top height this gain is limited.
Hence for fixed directional antenna systems SFN gain will be ignored for the general calculations since this will give the worst case.
Appendix 3 – Blocking Calculation On A 5 M Resolution DTMUsing the minimum coupling loss the worst case blocking distance is in the order of 300 m when the DVB-T receiver antenna is pointed directly at not only the wanted DVB-T transmitter but also the un-wanted LTE transmitter.
On undertaking the blocking calculations on the 50 m DTM supplied by NPT the areas where blocking occurs were limited and the calculation didnotreallyreflecttheminimumcouplinglosscalculations.
To determine the effect the DTM step size was having on the calculation the Oslo area was selected with its associated DVB-T Transmitters and LTE base stations.
The blue dots show the DVB-T transmitters and the green dots the LTE base stations. The blocking calculations were undertaken twice.
• Onceonthe50mDTMand100mcluttersupplied.• OnceonaresampledDTMwitha5mgridstepand100m
clutter supplied.
To print document press ESC on keyboard and send to print normally
HoHome
HoContactExexcutive
Summary P1
P17
P9
P25
P5
P21
P13P3
P19
P11P7
P23P15
P2
P18
P10
P26
P6
P22
P14P4
P20
P12P8
P24P16
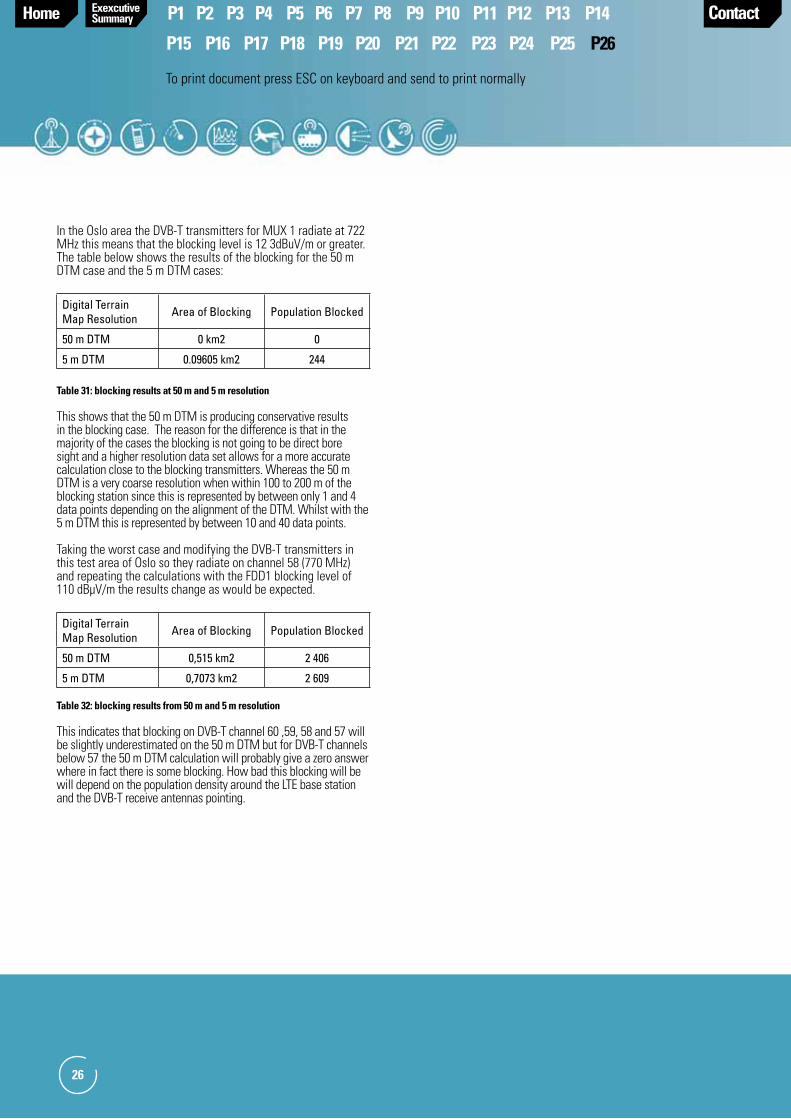
26
In the Oslo area the DVB-T transmitters for MUX 1 radiate at 722 MHzthismeansthattheblockinglevelis123dBuV/morgreater.The table below shows the results of the blocking for the 50 m DTM case and the 5 m DTM cases:
Digital Terrain Map Resolution Area of Blocking Population Blocked
50 m DTM 0 km2 0
5 m DTM 0.09605 km2 244
Table 31: blocking results at 50 m and 5 m resolution
This shows that the 50 m DTM is producing conservative results in the blocking case. The reason for the difference is that in the majority of the cases the blocking is not going to be direct bore sight and a higher resolution data set allows for a more accurate calculation close to the blocking transmitters. Whereas the 50 m DTM is a very coarse resolution when within 100 to 200 m of the blocking station since this is represented by between only 1 and 4 data points depending on the alignment of the DTM. Whilst with the 5 m DTM this is represented by between 10 and 40 data points.
Taking the worst case and modifying the DVB-T transmitters in this test area of Oslo so they radiate on channel 58 (770 MHz) and repeating the calculations with the FDD1 blocking level of 110dBµV/mtheresultschangeaswouldbeexpected.
Digital Terrain Map Resolution Area of Blocking Population Blocked
50 m DTM 0,515 km2 2 406
5 m DTM 0,7073 km2 2 609
Table 32: blocking results from 50 m and 5 m resolution
This indicates that blocking on DVB-T channel 60 ,59, 58 and 57 will be slightly underestimated on the 50 m DTM but for DVB-T channels below 57 the 50 m DTM calculation will probably give a zero answer where in fact there is some blocking. How bad this blocking will be will depend on the population density around the LTE base station and the DVB-T receive antennas pointing.
To print document press ESC on keyboard and send to print normally
HoHome
HoContactExexcutive
Summary P1
P17
P9
P25
P5
P21
P13P3
P19
P11P7
P23P15
P2
P18
P10
P26
P6
P22
P14P4
P20
P12P8
P24P16

ATDI LtdThe Beehive, City PlaceGatwick Airport, West Sussex, RH6 0PA. United Kingdom Tel. +44 (0)1293 522052 Fax. +44 (0)1293 522521www.atdi.co.uk E-mail: [email protected]
Advanced Topographic Development and Images LimitedCompany Registration Number 3198786
© Copyright 2011 ATDI Ltd.
All rights reserved. Specifications, terms and conditions are subject tochange without prior notice.
Solutions in Radiocommunications
To print document press ESC on keyboard and send to print normally
HoHome ContactExexcutive
Summary P1
P17
P9
P25
P5
P21
P13P3
P19
P11P7
P23P15
P2
P18
P10
P26
P6
P22
P14P4
P20
P12P8
P24P16