carrying capacity and thresholds - macleod … · carrying capacity and thresholds as they relate...
TRANSCRIPT

CARRYING CAPACITY AND THRESHOLDS:
THEORY AND PRACTICE IN
ENVIRONMENTAL MANAGEMENT
Submitted to:
Canadian Arctic Resources Committee Canadian Arctic Resources CommitteeSuite 200, 7 Hinton Avenue N. #3 - 4807 49th StreetOttawa, ON Yellowknife, NT K1Y 4P1 X1A 3T5Attention: Karen Wristen, Attention: Kevin O’Reilly, Executive Director Director of Research
Submitted by:
ES1040, 2500 University Drive NWCalgary, AB T2N 1N4
Tel: (403)220-5271, Fax: (403)282-1287Email: [email protected]
April 2002

Carrying Capacity and Thresholds: Page Theory and Practice in Environmental Management
i
TABLE OF CONTENTS Page
Executive Summary ii
List of Acronyms ixList of Tables xiList of Figures xi
1.0 INTRODUCTION 1
2.0 PREFACE 12.1 Concepts and Definitions 22.2 The Multi-dimensional Framework of Nature 42.3 A Matrix of Multi-dimensional Nature 62.4 Cumulative Effects 72.5 The Management Context 82.6 Summary and Report Structure 9
3.0 SETTING MANAGEMENT GOALS 113.1. Dimensions to be Included (the Matrix) 113.2 Carrying Capacity and Limits of Acceptable Change (LAC) 153.3 A Suitable Approach for the NWT 19
4.0 DEFINING MANAGEMENT OBJECTIVES 214.1 Thresholds and Indicators 224.2 Current Situation in the NWT 26
5.0 IMPLEMENTING A MANAGEMENT SYSTEM 315.1 Tiered Management Interventions 315.2 NWT’s Integrated Management System 345.3 Examples of Implementation Elsewhere 38
5.3.1 Summary of Case Studies 46
6.0 MONITORING RESULTS 476.1 Choosing What to Measure 476.2 Tools for Measuring 506.3 NWT Monitoring and Information Management Programs 52
7.0 REVIEWING PROGRESS 547.1 Feedback Mechanisms in the LAC Approach 547.2 Gaps in the Research 55
8.0 STEPS TO APPLY THE LAC MODEL IN THE NWT 57
9.0 CONCLUSION 62
APPENDIX
A. Project ObjectivesB. Bibliography

Carrying Capacity and Thresholds: Page Theory and Practice in Environmental Management
ii
EXECUTIVE SUMMARY
BackgroundThe NWT is undergoing an unprecedented boom in non-renewable resourcedevelopment. One new diamond mine is in production, another is underconstruction and another two (one just across the border in Nunavut) are in theregulatory process. Over $1 billion worth of oil and gas exploration activities areanticipated over the next few years in the NWT, including an application for aMackenzie Valley natural gas pipeline.
Non-renewable resources in the NWT are still largely under the jurisdiction of thefederal government. Aboriginal governments have some surface and sub-surfaceland holdings. Co-management bodies have been established under land claimsagreements covering various regions of the NWT, generally to carry out land useplanning, environmental assessment, and land and water management, and maytake on cumulative impact monitoring. An independent, comprehensiveenvironmental audit is to be undertaken in the Mackenzie Valley at least every fiveyears.
The federal government committed to establishing a framework within which thecombined effects of all this resource development would be appropriately assessedand managed. This undertaking is known as the Cumulative Effects Assessmentand Management Strategy and Framework (CEAMF).
The ProjectIn order to further the goal of establishing such a Framework, a project wasdesigned to develop an understanding of the concepts of carrying capacity andecological thresholds and the role that these concepts have in the development andimplementation of a cumulative effects assessment and management framework.The Macleod Institute for Environmental Analysis at the University of Calgary (theInstitute) was retained to conduct the project, and was asked
a) to develop an approach to integrating the principles of carryingcapacity and thresholds into cumulative effects assessment andmanagement in Canada’s North, and
b) to review and discuss the potential use of [this] approach in theintegrated resource management system set up under theMackenzie Valley Resource Management Act and Inuvialuit FinalAgreement.
The first step in the project involved a review of leading literature sources oncarrying capacity and thresholds as they relate to resource management,particularly at the landscape or regional level. Secondly, the Institute searched forexamples in Canada and elsewhere in which the concepts of ecological carryingcapacity and thresholds have been used at the landscape or regional level. Thirdly,a number of experts (as identified by the project’s steering committee) wereinterviewed with respect to their experience and insights regarding the use ofcarrying capacity and ecological thresholds in management frameworks.

Carrying Capacity and Thresholds: Page Theory and Practice in Environmental Management
iii
The Management ChallengeIndustrial and commercial activities are valued for the economic benefits they offer,but they also cause environmental and social impacts. Managing resourcedevelopment in a way that leaves no lasting ecological damage and improvesoverall social outcomes is a complicated business. Years ago, proposeddevelopments were dealt with one at a time, more or less as a stand-aloneundertaking. Attention was concentrated on immediate impacts caused byemissions, effluents and waste materials from each separate project, and little timewas spent on the question of what happened when these were added to the effectsof other developments in the same area. As the pace of development increased,however, it was recognized that cumulative effects (incremental effects resultingfrom the combined influences of various projects) were also important. In 1992,laws were passed to ensure that these cumulative impacts were included in thebusiness of managing industrial developments.
Looking at the cumulative effects of several projects at once tends to force attentionaway from one project’s neighbourhood and broaden it to include whole regions.Instead of focusing on just one river where a project is located, for example, aconsideration of cumulative effects will often take an entire watershed into accountbecause of the combined influences of a number of human activities in the area. Atthe same time, scientists were gaining an increasingly sophisticated understandingof intricate natural systems and encouraged others to take an ecosystem approachto environmental management. There was also a growing awareness that thesesystems are so complex that it is hard to predict with total certainty what will happenon a large scale when human activities give rise to continuous interventions.
The management challenge is to know, ahead of time if possible, but also as timegoes on, how many and what kind of activities will net the best results in the long runfrom an economic, environmental and social point of view. The concepts of carryingcapacity and ecological thresholds and the role they might play in meeting thischallenge, are the subject of this report.
Carrying CapacityThe concept of carrying capacity has been around for a couple of hundred years.The World Conservation Union (IUCN) defines it as “the capacity of an ecosystemto support healthy organisms while maintaining its productivity, adaptability, andcapability for renewal” (Caring for the Earth, 1991). Carrying capacity has also beendefined in a development context (“human carrying capacity”) as “the maximum rateof resource consumption and waste discharge that can be sustained indefinitelywithout progressively impairing the functional integrity and productivity of relevantecosystems” (University of Michigan, 1998).
Theoretically, if you could calculate this maximum rate, or carrying capacity, thenmanagement could at any time add up the amount each human activity contributesto the total sum of resource consumption and waste discharge, and decide howmany and what kind of activities would be allowed to proceed or continue.Unfortunately, this approach appears to have worked well only on a small scalewhen a limited number of variables are involved (how many cattle a paddock willsupport, and for how long, for example). The larger the area, and the greater thenumber of variables, the more imprecise are the estimates of carrying capacity, andthe less reliable the management decisions (cod fisheries on Canada’s east coastprovide an illustration of failed resource management plans based on carryingcapacity concepts).

Carrying Capacity and Thresholds: Page Theory and Practice in Environmental Management
iv
The fact is, we still don’t know enough to be able to calculate a precise, reliablecarrying capacity for large, complex systems. Still, it stands to reason (andexperience has shown) that there is a limit to what the natural environment cantolerate in the way of human interventions. An approach was therefore developedthat built on the theoretical and practical development of past carrying capacitymodels, but shifted emphasis away from outputs and mathematical calculations toend results and value judgements. This approach is known as the Limits ofAcceptable Change.
Limits of Acceptable Change (LAC)The concept underlying Limits of Acceptable Change is carrying capacity. However,as one scientist has said, LAC makes three important advances (Gimblett, 2001):
• it focuses more on outcomes (i.e., resource conditions to be maintained),than on the number of activities (i.e., the amount and type of resource uses);
• it recognizes that any use causes impacts, and that deciding on how muchchange is too much change is largely a value judgement; and
• it provides a framework for defensible value judgements.
The LAC process decides how much change will be allowed to take place, where,and the actions needed to control it. It involves deciding what kinds of conditionsare acceptable, then prescribing actions to protect or achieve those conditions. If anarea does not meet those conditions, then management actions must be taken tocorrect the situation (US National Forest Service, 2001).
Decisions as to what kinds of conditions are acceptable are made by a multi-stakeholder group that first describes (in narrative form) the resulting resource,social and managerial conditions they consider to be appropriate in connection withparticular resource uses. Key components of the narrative description are thenidentified as specific variables that, singly or in combination, are taken to beindicative of the acceptable conditions. These become the measurable resourceand social indicators around which standards are set and management programsare designed and implemented.
The LAC approach offers considerable potential for use in Canada’s North. It is
• consensus-based — it relies on balancing multi-stakeholder views to choosedesired outcomes and to apply them in areas of primary stakeholder interestor concern;
• pragmatic — it acknowledges that human activity will continue;
• principled — it establishes limits to activity that are based on social andecological factors;
• transparent — it selects measurable indicators and sets attainablestandards; and
• action-oriented — it explicitly drives toward a management program thatincludes an implementation schedule and monitoring agenda.
The fourth point (measurable indicators and attainable standards) leads to adiscussion about thresholds.

Carrying Capacity and Thresholds: Page Theory and Practice in Environmental Management
v
ThresholdsAt its most basic, a threshold is a boundary, limit or line dividing one state fromanother. In everyday language, we talk of the threshold of a house (the line thatmarks the difference between being inside and outside a home). Transported intoenvironmental terms, a threshold is commonly said to be the boundary that marksthe difference between an acceptable and an unacceptable state or condition of theresource under consideration. Acceptability can be determined from either anecological or social point of view (or both), and can be expressed either numericallyor qualitatively.
Most numerical environmental thresholds have been stated in the form of standardscreated for specific substances. For example, the Canadian Environmental QualityGuidelines set a limit for mercury releases in community water supplies of 1microgram per tenth of a litre. Different limits apply to a mercury deposit in soils,according to their uses (agricultural, residential, commercial or industrial).Standards such as these are based on chemical and risk analysis, and haveprovided important thresholds for a wide range of potential contaminants of concernto human or animal health. However, they tend to describe acceptable conditionsin terms of particular pollutants (i.e., not too much mercury) rather than in terms ofhealthy ecosystems.
To date, very few ecological thresholds have been prescribed for whole ecosystemsor regions. The Institute could find only two cases in which they are being appliedat a regional scale (Lake Tahoe and Chesapeake Bay). The reason for this lies inthe sheer complexity and large number of variables involved in natural systemstaken as a whole. Continuing research has, however, demonstrated that allecological systems exhibit four characteristics (structure, function, interrelationshipsand change over time) and that these characteristics are revealed in different waysdepending on what scale they are being observed. A fair amount of work is beingdone to establish the scientific basis (similar to the way standards are created forsubstance releases) for setting non-chemical standards that describe acceptableconditions for these characteristics, but the results of such efforts will not likely beavailable for general application for several years yet. In the meantime, more andmore attention is being given to indicators and their use as representative measuresof environmental performance.
IndicatorsIndicators are select subsets of data which, taken singly or in combination, arethought to give a good picture of what is happening in an overall system. TheConsumer Price Index (CPI) is an example of a combination of indicators used torepresent what is happening in the overall economic system from a consumer’spoint of view. The CPI tracks prices of a fixed basket of commodities (over 600basic goods and services) purchased by Canadians every year. These prices arethen treated as indicators of the rate at which prices change for all goods andservices bought by Canadian consumers.
A simple example of indicators used in an environmental management programtracks the density and condition of campsites in a recreational zone. In thisinstance, the acceptable condition for one particular zone of the RattlesnakeNational Recreation Area is described as ‘pristine’, meaning that emphasis is placedon sustaining natural ecological processes. The number of existing campsites andthe persistence of visual evidence of camping from year to year are taken asindicators of whether the acceptable condition is achieved.

Carrying Capacity and Thresholds: Page Theory and Practice in Environmental Management
vi
1 A VEC is any part of the environment that stakeholders consider to be of particular importance. Similarly, a VSC is any part of the cultural or economic domain that stakeholders consider to be of particular importance.
The advantage of indicators is that they introduce a degree of clarity toenvironmental objectives that was often missing in previous decades. Typically, a‘bundle’ of indicators will be chosen so that the appropriate array of environmentaldimensions will be addressed. However, indicators must be chosen carefully, sothat they are directly representative of the results which management goals areaiming to achieve. 1 Valued Ecosystem Components (VECs) and Valued Socio-economic Components(VSCs) often fail this test. They tend to focus attention on charismatic species,rather than on impacts measured as an indicator of what is happening in theecosystem. In the Rattlesnake National Recreation Area, bears may very well beVECs, for example, but the management goal is to minimize impacts caused byhuman activities in the pristine zone. Therefore campsite density and conditionprovide a more appropriate indicator than bears.
Many environmental management programs now use indicators to set quantifiablestandards. Again, the Rattlesnake Management Plan (created by stakeholdersfollowing the LAC process) is a good illustration of this approach. The standard setfor campsite density is “no increase in the existing number of campsites”; and forcampsite condition it is “evidence of camping not to persist from year to year”. In theevent that either of these standards is exceeded, management intervenes to correctthe situation.
In effect, acceptable conditions, and indicator values chosen to represent them, areused as thresholds when making managerial decisions and assessing thesignificance of proposed activities. The indicators/standards are as specific as thecurrent level of (scientific and other) knowledge permits, reflect a balancing of publicinterests and accommodate certain practicalities such as the feasibility of collectingrequired data.
Putting It All TogetherThe Limits of Acceptable Change (LAC) model offers a practical approach tointegrating the concepts of carrying capacity and thresholds into the NWT’sintegrated management system. It factors environmental, social and economicconsiderations into the framework for managing human activities in a way thatmaintains respect for ecological well-being. Goals and objectives emphasize thepositive, by describing environmental and social conditions that reflect desiredoutcomes as seen from a multi-stakeholder perspective. LAC is also action-oriented. It explicitly drives toward a management program that includes animplementation schedule and monitoring agenda, yet it avoids mechanistic orformula-driven management interventions.
The LAC approach builds on and is congruent with existing initiatives in the NWT.Land-use goals articulated by the Sahtu and Gwich’in communities, for example, fitwell within the model. Both have expressed a desire to balance development andpreservation, and both lean towards describing their desired outcomes in terms ofthe conditions that would prevail if the outcomes were achieved.
Nine steps to apply the LAC model in the NWT are briefly outlined, as follows:

Carrying Capacity and Thresholds: Page Theory and Practice in Environmental Management
vii
Step Purpose Comments
Ø Identify issues andprinciples
a. Stakeholders should include all land-use, impactassessment and other regulatory boards; permitissuers and environmental managers; theresearch community and similar experts;ENGOs; community members; industry andindustry oversight agencies
b. Principles will likely include a commitment tointegrated resource management, theprecaut ionary pr inciple, sustainabledevelopment and ecological integrity
c. The LAC process is a consensus-buildingmodel. However, the intent is to balancestakeholder interests. Consensus in this contextdoes not require that decisions be unanimous.
Ù Define elements anddescribe acceptableconditions
a. A series of elements (what the LAC processcalls ‘opportunity classes’) are defined.Examples could include Industrial Development,Conservation, Recreation etc.
b. For each element, hypothetical narrativedescriptions are prepared, outlining the range ofconditions that stakeholders consideracceptable and attainable
Ú Select indicators ofresource and socialconditions
a. Indicators are chosen for the purpose ofrepresenting the acceptable conditionsdescribed for each element
b. The number of indicators for each element arekept to a manageable level
c. Indicators will be quantifiable wherever possible
Û Inventory existingresource and socialconditions
Ü Specify measurablestandards for theresource and socialindicators selected instep 3
a. The standards in effect become thresholdsaround which a management and action planare structured
b. Existing standards and guidelines areincorporated as appropriate. An example wouldbe the Canadian Drinking Water Guidelines
Ý Identify alternativeallocations for eachelement
a. An allocation assigns the elements to specificareas of the region
b. Stakeholders identify and rank each proposedalternative allocation
c. This is a prescriptive step and final decisions willbe made by persons with the appropriateauthority, based on the input from stakeholders(see step 8)
Þ Identify managementactions for eachalternative
a. Differences, if any, between current conditions(inventoried in step 4) and standards (specifiedin step 5) are identified
b. Management actions that would best bringconditions up to standard are specified
c. In addition, potential management actions andpolicies are identified for the purpose of dealingwith future situations
d. A tiered management approach is outlined,incorporating the Precautionary Principle etc.
e. Roles and responsibilities are clearly identified,according to existing authorities

Carrying Capacity and Thresholds: Page Theory and Practice in Environmental Management
viii
Step Purpose Comments
ß Evaluate and select apreferred alternativeallocation
a. The final allocation decisions are made bypersons with the appropriate authority (based oninput from stakeholders from step 6)
à Implement and monitorfor feedback
a. Each of the authorities tasked withresponsibilities (see step 7) implements the plan
b. Monitoring and data collection activities could becoordinated and overseen by a Part 6 (MVRMAct) authority, but would also include activitiesundertaken by industry, existing initiatives suchas the West Kitikmeot Slave Study, community-based initiatives etc.
c. Periodic, systematic feedback regarding theperformance of the management program willlead to improvements and adjustments overtime. The management plan is not intended tobe cast in stone. Rather it is a living documentsubject to refinement as circumstance andknowledge dictate
An Integrated Resource Management SystemThe LAC model is specifically designed to result in a full management program,rather than a data collection activity plan. It incorporates the concepts of carryingcapacity and ecological thresholds in every phase of the management cycle, fromplanning through implementation, to monitoring and feedback. And, as with anymanagement program, effective implementation will only be achieved if seniorauthorities strongly commit their organizations to the full program.
When applied at a regional scale, the LAC model demands cooperation andcollaboration between a large number of regulatory and administrative agencies.This feature of the LAC approach could well be one of its strengths in the NWTcontext where a strong movement to co-management has been gaining momentumfor years. The basic components of an integrated resource management systemalready exist in the NWT, having been set up under the Mackenzie Valley ResourceManagement Act and Inuvialuit Final Agreement.

Carrying Capacity and Thresholds: Page Theory and Practice in Environmental Management
ix
LIST OF ACRONYMS
ALCES A Landscape Cumulative Effects Simulator
BHP Broken Hill Properties (EKATITM Diamond Mine)
CANTTEX Canadian Taiga and Tundra Experiment
CARC Canadian Arctic Resources Committee
CC Carrying Capacity
CEA Cumulative Effects Assessment
CEAMF Cumulative Effects Assessment and Management Strategy and Framework
CEMA Cumulative Effects Management Association
CIMP Cumulative Impact Monitoring Program
CIRL Canadian Institute of Resources Law
CRS Coppermine River Study
DFO Department of Fisheries and Oceans
DIAND Department of Indian Affairs and Northern Development (Federal)
EERD Ecological Exposure Research Division
EIP Environmental Improvement Program
EMAN Ecological Monitoring and Assessment Network
EMAP Environmental Monitoring and Assessment Program
EMS Environmental Management System
EPA Environmental Protection Agency (US Government)
ETCC Environmental Threshold Carrying Capacity
GIS Geographical Information System
GRI Global Reporting Initiative
HSI Habitat Suitability Index
IEMA Independent Environmental Monitoring Agency
IFA Inuvialuit Final Agreement
ISR Inuvialuit Settlement Region

Carrying Capacity and Thresholds: Page Theory and Practice in Environmental Management
x
LIST OF ACRONYMS (continued)
IUCN International Union for Conservation of Nature
K Constant number
LAC Limits of Acceptable Change
MRBB Mackenzie River Basin Board
MVCIMP Mackenzie Valley Cumulative Impact Monitoring Program
MVEIRB Mackenzie Valley Environmental Impact Review Board
MVRMA Mackenzie Valley Resource Management Act
NEB National Energy Board
NLCA Nunavut Land Claims Agreement
NWT Northwest Territories
OECD Organization for Economic Co-operation and Development
Q-LINKS Quebec-Labrador Integrated Knowledge System
RMP River Management Plan
ROS Resource Opportunity Spectrum
RSDS Regional Sustainable Development Strategy (Alberta)
RWED Resources, Wildlife and Economic Development (NWT Government)
SAG Science Advisory Group
TEK Traditional Ecological Knowledge
TRPA Tahoe Region Planning Association
VEC Valued Ecosystem Component
VSC Valued Socio-economic Component
WKSS West Kitikmeot Slave Study
WWF World Wildlife Fund

Carrying Capacity and Thresholds: Page Theory and Practice in Environmental Management
xi
LIST OF TABLESPage
Table 1: Five Conceptual Multi-dimensional Frameworks of Natural Systems 11
Table 2: Typical Characteristics of a Multi-dimensional Natural System 13
Table 3: Sample Desired Outcomes for a Multi-dimensional Natural System 14
Table 4: Recent Definitions of Carrying Capacity 16
Table 5: Sample Indicators and Standards Applied in Opportunity Class 1 - Pristine 25
Table 6: Biological Factors Identified by Northerners as Potential Thresholds 28
Table 7: Indicators Measuring Stressors Originating in the NWT 29
Table 8: Social Indicators 30
Table 9: Tiered Management Intervention in a Fisheries Context 32
Table 10: Sample Thresholds and Management Policies related to Fisheries 39
Table 11: A Digest of Criteria for Reliable Ecological Indicators 48
Table 12: Sample Indicators for a Multi-dimensional Natural System 49
Table 13: Available Tools for Measuring Indicators 51
Table 14: Selected Monitoring Programs in the Northwest Territories 52
Table 15: Number of Data Collection Activities in Each Category 56
LIST OF FIGURES
Figure 1: Spatial Scales 5
Figure 2: A Matrix of Multi-dimensional Nature 6
Figure 3: Environmental Management over Time 8
Figure 4: US EPA Ecological Risk Assessment Framework 22
Figure 5: Process Diagram for Developing and Implementing Indicators 26
Figure 6: Tiered Management Decision Diagram 33
Figure 7: RSDS Management Model 45
Figure 8: RSDS Timeline 45

Carrying Capacity and Thresholds: Page Theory and Practice in Environmental Management
1
1.0 INTRODUCTION
The Macleod Institute for Environmental Analysis at the University of Calgary (theInstitute) was retained by the Canadian Arctic Resources Committee (CARC) toconduct independent and impartial research into the concepts of ecologicalthresholds and carrying capacity and the role that these concepts have in thedevelopment and implementation of a cumulative effects assessment andmanagement framework. The Department of Indian Affairs and NorthernDevelopment co-funded the project.
The project was undertaken in the context of the Cumulative Effects Assessmentand Management Framework (CEAMF) initiative currently underway in theNorthwest Territories (NWT). In particular, the Institute was asked
a) to develop an approach to integrating the principles of carryingcapacity and thresholds into cumulative effects assessment andmanagement in Canada’s North, and
b) to review and discuss the potential use of [this] approach in theintegrated resource management system set up under theMackenzie Valley Resource Management Act and Inuvialuit FinalAgreement, building on the work done by the Canadian Institute forResource Law.
A copy of the Project Objectives is attached as Appendix A.
2.0 PREFACE
The task of integrating thresholds and carrying capacity concepts into cumulativeeffects assessment and environmental management practices would appear on thesurface to be fairly straightforward. Thresholds are a familiar subject in the contextof cumulative effects assessments, where they are routinely invoked to helpdetermine the significance of predicted impacts on components like water and airquality for which defined standards exist. The debate has centred on how to definestandards, regulatory objectives and regulations for components like wildlife, aquaticresources (other than commercial fish), or vegetation. Similarly, carrying capacityor some variation of the concept that the environment is limited in its capacity toaccommodate human activities is inherent in all environmental managementsystems. The customary i terat ive management cyc le ofplan–implement–monitor–review presupposes a normative state of nature beyondwhich it is imprudent if not disastrous to proceed. Once again the debate hastended to centre on definitions — how do you clearly draw the line betweenacceptable and unacceptable activities?
It is at this stage of the debate that confusion rapidly sets in. An enormous body ofliterature testifies to the diligence of scholars and practitioners addressing thedeceptively simple question of how and where to draw the line. They approach theproblem from any number of different perspectives: sustainable development,systems or process thinking, ecological science, ecological integrity, ecological andsocial indicators, ecosystem health — the list goes on. Like pieces in a jigsawpuzzle, the various articles are each well defined but the overall picture remainsobscured until all of the pieces are painstakingly fit together to form a whole.Furthermore, the jigsaw puzzle is not a simple two-dimensional affair.

Carrying Capacity and Thresholds: Page Theory and Practice in Environmental Management
2
2.1 Concepts and Definitions
A brief preview of a number of concepts discussed later in this Report is presentedbelow.
Carrying Capacity Several definitions can be found. The World Conservation Union(IUCN,1991) defines carrying capacity as “the capacity of anecosystem to support healthy organisms while maintaining itsproductivity, adaptability, and capability for renewal”. TheUniversity of Michigan has defined “human carrying capacity” as“the maximum rate of resource consumption and waste dischargethat can be sustained indefinitely without progressively impairingthe functional integrity and productivity of relevant ecosystems.”
Limits ofAcceptableChange (LAC)
LAC is a process which adopts the concept of carrying capacity.It is designed to result in a full management program structuredaround indicators and standards identified by a multi-stakeholdergroup that includes regulators, experts, resource users andcommunity members. The purpose of LAC is to set limits toenvironmental and socio-economic changes that are acceptableto stakeholders.
Threshold A threshold is commonly said to be the boundary that marks thedifference between an acceptable and an unacceptable state orcondition of the resource under consideration. An environmentalstandard is a type of threshold. For example, more than 1microgram of mercury in every tenth of a litre of community watersupplies is considered to be unacceptable (CanadianEnvironmental Quality Guidelines). Carrying capacity can also beconsidered as a threshold (i.e., the upper limit of what a naturalsystem can tolerate before the functional integrity and productivityof relevant ecosystems is impaired).
Indicators Indicators are select subsets of data which, taken singly or incombination, are thought to give a good picture of what ishappening in an overall system. The Consumer Price Index (CPI)is an example of a combination of indicators used to representwhat is happening in the overall economic system from aconsumer’s point of view. The CPI tracks prices of a fixed basketof commodities (over 600 basic goods and services) purchasedby Canadians every year. These prices are then treated asindicators of the rate at which prices change for all goods andservices bought by Canadian consumers.
A simple example of indicators used in an environmentalmanagement program tracks the density and condition ofcampsites in a recreational zone. In this instance, the acceptablecondition for one particular zone of the Rattlesnake NationalRecreation Area is described as ‘pristine’, meaning that emphasisis placed on sustaining natural ecological processes. Thenumber of existing campsites and the persistence of visualevidence of camping from year to year are taken as indicators ofwhether the acceptable condition is achieved.
Carrying Capacity and Thresholds: Page Theory and Practice in Environmental Management
3
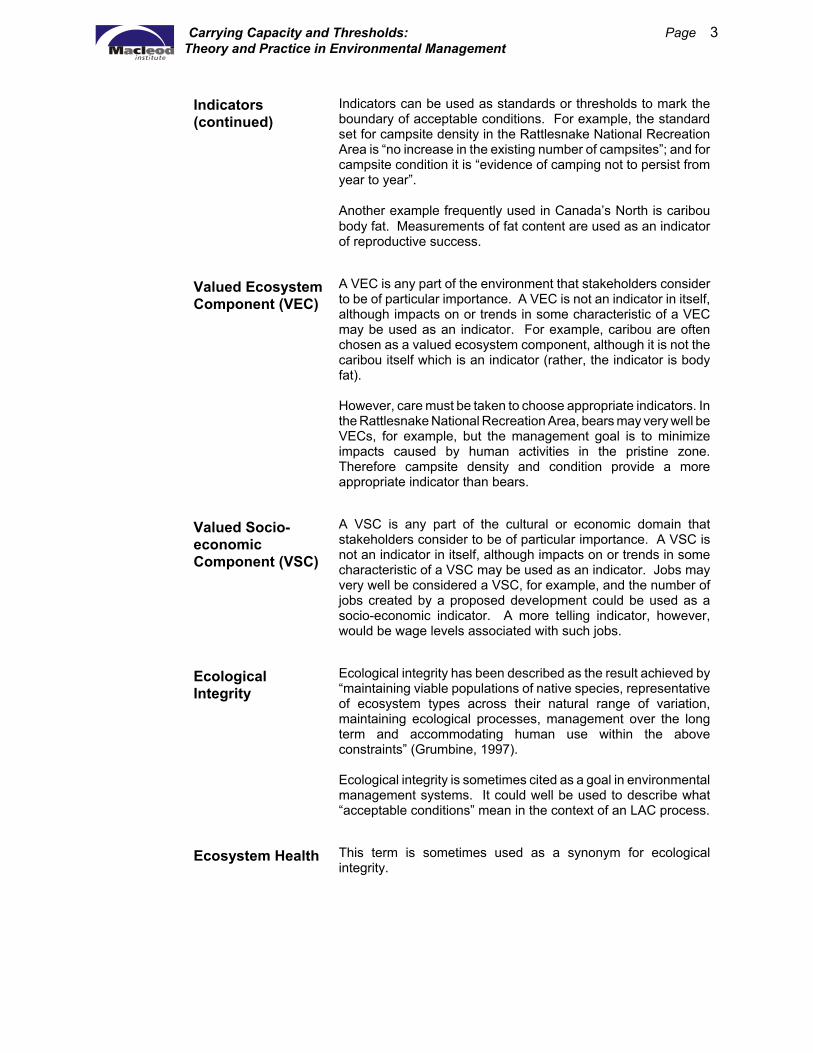
Indicators (continued)
Indicators can be used as standards or thresholds to mark theboundary of acceptable conditions. For example, the standardset for campsite density in the Rattlesnake National RecreationArea is “no increase in the existing number of campsites”; and forcampsite condition it is “evidence of camping not to persist fromyear to year”.
Another example frequently used in Canada’s North is cariboubody fat. Measurements of fat content are used as an indicatorof reproductive success.
Valued EcosystemComponent (VEC)
A VEC is any part of the environment that stakeholders considerto be of particular importance. A VEC is not an indicator in itself,although impacts on or trends in some characteristic of a VECmay be used as an indicator. For example, caribou are oftenchosen as a valued ecosystem component, although it is not thecaribou itself which is an indicator (rather, the indicator is bodyfat).
However, care must be taken to choose appropriate indicators. Inthe Rattlesnake National Recreation Area, bears may very well beVECs, for example, but the management goal is to minimizeimpacts caused by human activities in the pristine zone.Therefore campsite density and condition provide a moreappropriate indicator than bears.
Valued Socio-economicComponent (VSC)
A VSC is any part of the cultural or economic domain thatstakeholders consider to be of particular importance. A VSC isnot an indicator in itself, although impacts on or trends in somecharacteristic of a VSC may be used as an indicator. Jobs mayvery well be considered a VSC, for example, and the number ofjobs created by a proposed development could be used as asocio-economic indicator. A more telling indicator, however,would be wage levels associated with such jobs.
EcologicalIntegrity
Ecological integrity has been described as the result achieved by“maintaining viable populations of native species, representativeof ecosystem types across their natural range of variation,maintaining ecological processes, management over the longterm and accommodating human use within the aboveconstraints” (Grumbine, 1997).
Ecological integrity is sometimes cited as a goal in environmentalmanagement systems. It could well be used to describe what“acceptable conditions” mean in the context of an LAC process.
Ecosystem Health This term is sometimes used as a synonym for ecologicalintegrity.

Carrying Capacity and Thresholds: Page Theory and Practice in Environmental Management
4
2.2 The Multi-dimensional Framework of Nature
The concept of carrying capacity is neither new nor is it a particularly difficult idea toaccept. As Thomas Robert Malthus said over 200 years ago:
It is an obvious truth, which has been taken notice of by manywriters, that population must always be kept down to the level ofthe means of subsistence; but no writer that the Author recollectshas inquired particularly into the means by which this level iseffected: and it is a view of these means which forms, to his mind,the strongest obstacle in the way to any very great futureimprovement of society. (An Essay on the Principle of Population,as it Affects the Future Improvement of Society, 1798)
Defining subsistence levels has preoccupied countless experts in the physical andsocial sciences in the past two centuries. Nowhere has the search for definition beenmore difficult than in the science of ecology and its predecessor or related fields ofstudy. In large measure, it is the inherent complexity of environmental systems whichhas hampered successful adoption of carrying capacity concepts into themanagement of human activities. Modern scholars are only just beginning to cometo terms with the intellectual constructs required to conceptualize nature.
All design of the human environment is based on some fundamentalmodel of the essential character of nature deeply embedded in theculture – the nature of nature. Much of our difficulty in dealing withresource and environmental issues is brought on by the fact that thehuman landscape, including the cities in which we live, was shapedaccording to a concept of nature that grew out of the Renaissancenotion that humans are the measure of all things. (Lyle, 1994)
In addition to this anthropocentric bias, classical thinking presupposed that nature isa closed system that strives to exist in one mature condition. Components of thesystem were studied individually and permanence was considered the key tounderstanding nature. Early biologists (or naturalists as they were often called), forexample, developed large discrete bodies of knowledge that emphasized a particularspecies’ physical characteristics, behavioural patterns and breeding habits. Manybelieved, as Charles Darwin said in his preface to the 3rd edition of The Origin ofSpecies (1859), that these species had always existed:
Until recently the great majority of naturalists believed that specieswere immutable productions, and had been separately created.This view has been ably maintained by many authors. Some fewnaturalists, on the other hand, have believed that species undergomodification, and that the existing forms of life are thedescendants by true generation of pre-existing forms.
Later experiments revealed that nature also displays a successional cycle from earlygrass and shrub to mature forests. And, although microbiologists continued the driveto understand components at ever smaller scales (culminating in the Human GenomeProject), other scholars strove to understand hierarchical dependencies (as in thefood chain) and interdependencies (as between flowering plants and bees). Theygradually came to recognize dynamic interactions between multiple components.Nature is now viewed as more than the sum of its individual parts and is frequentlystudied from a process perspective, the dynamics of which operate at and betweendifferent spatial scales (Bergandi and Blandin, 1998).

Carrying Capacity and Thresholds: Page Theory and Practice in Environmental Management
5
Regional Ecosystem
Species Genetic
Figure 1: Spatial Scales
Phenomena occurring at all spatial scales mustbe taken into account in order to understand thewhole ecological system.
Contemporary wisdom accepts that the totality of the ecological puzzle cannot beunderstood unless phenomena at the global, regional/landscape, ecosystem,species/population and genetic scales (Figure 1) are all taken into account.Furthermore, the temporal dimension must also be worked into the dynamics of thepuzzle to take phenomena such as the successional cycle into account.
The twin issues of scale and time are particularly important when integrating theprinciples of carrying capacity and thresholds into cumulative effects assessmentsand environmental management. The complexion and practicality of the veryconcept of carrying capacity changes depending at which scale it is being applied,and thresholds themselves must be capable of giving timely warnings of systemchange over time. The carrying capacity of a single pasture, for example, can becalculated with comparative ease for a single or even a limited number of species,provided sufficient information is known about prevailing weather patterns, growthfactors, feeding habits and so on. Calculations applied in more complex systemssuch as the east coast cod fisheries have, however, frequently contributed toresource failures.
As if spatial and temporal dimensions were not complication enough, the modernconceptualization of nature and how it works has added further layers of intricacyto effective integration of carrying capacity and thresholds. Systems thinking todaydemands that physical descriptions be supplemented by process characterizations.
Although they are manifested in different ways, all ecological systems(regardless of type) have energy flows and nutrient cycling (function), allecosystems have vertical and horizontal stratification (structure), all exhibitcommunity change over time (behaviour), and all have trophic webs andhabitats (inter-relationships). (Tyler and Perks, 1998)
Pulling all these variables together into one framework presents a dauntingundertaking. Nevertheless scholars are currently working out the details and findingways to apply this enriched, multi-dimensional representation of nature in theservice of environmental management. Dunning et al. (1992), for example, believethat assessment of large-scale phenomena requires an ordered framework of naturethat
• adequately reflects the importance of process (and, by relation,structure);
• represents a holistic approach that examines interrelationshipsbetween all elements; and
• reflects the importance of scale, both temporal and spatial.

Carrying Capacity and Thresholds: Page Theory and Practice in Environmental Management
6
2.3 A Matrix of Multi-dimensional Nature
The first step toward developing an approach to integration, therefore, requiresconstruction of an aide-memoire to put all these various dimensions into an orderedframework (the multi-dimensional jigsaw puzzle). The Institute has done this bybuilding a matrix (Figure 2). The matrix plots three spatial scales(regional/landscape, ecosystem/community and population/species) against threephysical or process characterizations (structure, function and inter-relationships)plus a fourth dimension, time. Two spatial scales have been omitted (global andgenetic) in order to focus attention on the scales at which thresholds are most likelyto be applied in Canada’s North.
Characteristics Scale
Figure 2: Regional/LandscapeLarge scale spatial contextdefined by many types ofhabitat - the full extent isdefined by the researcherand is usually $1,000 km2
Ecosystem/CommunityMedium scale spatial context defined by an
ecosystem) within which agroup of species (a
community) interacts
Population/SpeciesFine scale context defined
by a group of similarindividuals (a population)
or the total # of suchindividuals in the study
area (a species)
StructureThe physical shape,composition &distribution of bioticand abiotic elements
FunctionInteraction of systemcomponents whichgive rise to materialand energy cycles
Interrelationships Significant inter-connections betweenstructural andfunctional elements
Time (trends)Changes in structure,function &interrelationships overtime
This matrix is important for a number of reasons. First, it serves to remindenvironmental managers that reliance on a single type of threshold or a uni-dimensional description of the environment will fail to provide sufficient informationwith which to anticipate and assess significant changes. Secondly, the matrix helpsto position different authors in context. Some practitioners, for example, haveproposed that disturbance coefficients related to mortality rates be used asindicators of environmental effects on wildlife (AXYS, 2000). In assessing the utilityof such an approach, it is useful to recognize that it addresses functions at thepopulation/species scale. Habitat availability thresholds, on the other hand, addressstructure at the ecosystem/community spatial scale. Thirdly, the matrix can beemployed to organize information for use at different stages of the managementcycle (planning, implementation, monitoring and review).

Carrying Capacity and Thresholds: Page Theory and Practice in Environmental Management
7
2.4 Cumulative Effects
The past decade has witnessed increased emphasis on cumulative effects. In part,this movement reflects a growing recognition that the environment is multi-dimensional in nature, that spatial and temporal dimensions must be taken intoaccount when assessing anticipated environmental effects and that the existingstate of the environment is the result of many interacting impacts and factors.
Cumulative effects assessments (CEAs) are typically used from time to time toassist in deciding what projects and actions are acceptable and how an activity,development or resource must be managed over the coming years to meet publicgoals (Macleod Institute, 1998). In conducting a project-specific CEA, all existingand reasonably foreseeable activities which have the potential to affect the sameresource as the proposed project should be included, and impacts are predicted
... based on baseline information, knowledge of the ecosystem andrelationships between components ... the assessment of thesignificance of impacts is based on comparison to thresholds ormanagement goals and represents a particular challenge wheresuch goals have not yet been identified. The identification of valid,agreed upon thresholds and management objectives has beencarried out primarily in the context of specific projects or keyindicator species rather than a description of general goals forecosystem health, etc. (Griffiths, 2000)
Discussions about cumulative effects sometimes lead to confusion about the roleof CEAs and their relationship to management. It should be noted that the termmanagement refers to a broad range of functions designed to control things orpersons or to conduct operations (Oxford English Dictionary). One function ofmanagement is to set goals and objectives, and to stipulate how such goals andobjectives will be met. Another function is to monitor ongoing activities to determinewhether the goals are being met, while a third function is to review current orproposed activities to decide whether they meet or fall short of the goals. It is in thislatter context that CEAs fit. CEAs, simply described, are a set of tools used to helpmanagers predict the likely and potential consequences of proposed actions with aview to deciding whether they will meet or fall short of management’s goals andobjectives (Macleod Institute, 1998).
It is easy to see why the confusion arises. Both management and CEAs require abaseline of information from which to operate. They both frequently chooseindicators to gauge performance. The subject of thresholds is common to both(management uses thresholds to define an objective; CEAs use thresholds as ameans of judging significance). And monitoring is an activity often identified withboth management and CEAs. In the latter case, monitoring programs are frequentlyrecommended to regulators as a means of measuring the accuracy of predictionsfor the purpose of controlling future operations (a management function). Monitoringprograms are also a primary means of enhancing baseline information, althoughthey ought never to be used as a replacement for assessment or management.
Management is clearly a much broader term than cumulative effects assessments.Accordingly, the Institute has focused its attention on developing an approach tointegrating the concepts of thresholds and carrying capacity into environmentalmanagement in Canada’s North, and will confine its references to CEAs to instancesin which the discussion merits specific comment or clarification.

Carrying Capacity and Thresholds: Page Theory and Practice in Environmental Management
8
IMPLEMENTMONITOR
REVIEW PLAN
IMPLEMENT
MONITORREVIEW
IMPLEMENT
PLAN
2.5 The Management Context
Getting a grasp on concepts related to thresholds and carrying capacity is onechallenge; choosing between options and deciding how to apply them in amanagement context is quite another. At the planning stage, for instance, it isnecessary to set overall goals and objectives. Even describing the goals in multi-dimensional terms does not provide the final shape of the jigsaw puzzle. Questionsof emphasis and orientation must still be answered. Should managers attempt tocalculate carrying capacity formulae for the whole system? Or should they draw theline between acceptable and unacceptable behaviour in some other, albeit related,manner? At the implementation stage, choices between predictive andprecautionary approaches arise and decisions must be made about the level ofeffort to be applied, and who will exercise authority and undertake operationalaspects of the management system. The monitoring stage focuses on collectingdata. Once again it is necessary to exercise discretion to ensure that relevantinformation is collected in a cost-effective, timely manner. The fourth stage, review,involves analyzing programs and policies in the light of experience and adjustingthem if desired outcomes are not realized. In the latter event, options must bereassessed and new choices determined. At all these stages, the matrix (Figure 2)can be used to organize the information required for decision-making.
Of course, environmental management is a process that takes place over a periodof time. Figure 3 illustrates the fact that, while managing environmental effectsassociated with human activities is continuous, planning and decision-makingprocesses intercede from time to time.
The subjects of thresholds andcarrying capacity are particularly pertinent in the planning, reviewing and monitoringstages of the management cycle. It is at these stages that overall goals are set(possibly using carrying capacity as a means of defining them); thresholds orstandards are defined to establish significance of observed or predicted impacts;and indicators or data sets are isolated to collect information used in support ofdecisions related to the goals and standards.
Figure 3: Environmental Management over Time
During the management cycle, the planningprocess may be triggered by periodic reviews orby an evaluation of data collected frommonitoring emissions etc. The monitoringprogram could be private (as would happen inthe case of a facility owner applying a formalEMS), and/or public. The review function couldalso be triggered if monitoring data demonstratenon-compliance with licencing conditions. Apublic planning process is also triggeredwhenever a new project is proposed, and maybe initiated when responsible authorities areprompted to respond to innovations intechnology, information or policy. The starssignify where cumulative effects assessmentsare typically employed during the course of themanagement cycle.

Carrying Capacity and Thresholds: Page Theory and Practice in Environmental Management
9
2.6 Summary and Report Structure
Section 2.0 (Preface) has addressed two main issues — the multi-dimensionalnature of the environment (and the need for a matrix to organize information for useat different stages of the management cycle); and the nature of management (whichidentified the stages at which carrying capacity and thresholds are pertinentsubjects, and the role of CEAs in relation to management functions). It has alsogiven a brief preview of some concepts and definitions discussed in more detail laterin the Report. The preface thus lays the groundwork for a detailed discussion of themultiple factors, opinions and options to be considered in developing an approachto integrating the principles of carrying capacity and thresholds into the NWT’sintegrated resource management system.
The remainder of the Report is largely structured to follow the environmentalmanagement cycle (plan–implement–monitor–review) in order to emphasize thepoint that the concepts of carrying capacity and thresholds must be fully integratedinto all phases of a management system. It is not sufficient to address theseconcepts only in the context of the monitoring phase.
Sections 3.0 through 8.0 are summarized below.
Setting Management Goals (section 3.0):
Setting overall goals is the first stage of the iterative managementcycle, plan–implement–monitor–review. Section 3.1 addresses theconceptual framework in which goals regarding natural systems areset, and provides a thumbnail sketch of a natural system’scharacteristics. Carrying capacity, limits of acceptable change(LAC) and other approaches are canvassed in section 3.2. Asuitable approach for Canada’s North is discussed in section 3.3.
Defining Management Objectives (section 4.0):
Thresholds and indicators are addressed in section 4.1. The currentsituation in the NWT is explored in section 4.2, and tables outlinecurrent data collection activities as they relate to nonchemicalstressors originating in the NWT.
Implementing a Management System (section 5.0):
Tying management goals to action steps in a reasoned manner,having due regard for varying levels of situational uncertainty, is thesubject of section 5.1. Section 5.2 discusses the potential for usingan LAC approach in the integrated management system framed bythe Mackenzie Valley Resources Management Act and the InuvialuitFinal Agreement. Two case studies of the LAC approach as it isapplied in the Lake Tahoe and Chesapeake Bay regions arereviewed in section 5.3. The Regional Sustainable DevelopmentStrategy (RSDS), an initiative underway in Alberta’s Athabasca OilSand region is also reviewed. The RSDS is not an example of theLAC approach, but it provides some interesting insights into the waya regional management plan can be organized.

Carrying Capacity and Thresholds: Page Theory and Practice in Environmental Management
10
Monitoring Results (section 6.0):
Criteria for reliable indicators are provided in section 6.1, and the roleof valued ecosystem and socio-economic components (VECs andVSCs) and indicator species is touched upon. Sample indicators fora multi-dimensional natural system are outlined in Table 12. Toolsfor measuring indicators are addressed in section 6.2, and NWTmonitoring, information management and community-basedprograms are briefly canvassed in section 6.3.
Reviewing Progress (section 7.0):
Section 7.1 looks at the use and importance of feedbackmechanisms in the LAC approach. Gaps in research are identifiedin section 7.2.
Steps to Apply the LAC Model in the NWT (section 8.0):
The LAC model is applied following a nine step process. Each of thesteps is briefly discussed in section 8.0

Carrying Capacity and Thresholds: Page Theory and Practice in Environmental Management
11
Table 1: Five Conceptual Multi-dimensional Frameworks of Natural Systems
3.0 SETTING MANAGEMENT GOALS
Setting environmental management goals begins by constructing an approximationof the natural systems for which the goals will be articulated. Several scholars havesuggested conceptual frameworks that begin to reflect the complexity and dynamicsof these systems. Section 3.1 briefly compares and contrasts five such frameworks,and discusses how the matrix (Figure 2 above) was derived from them. Adescription of characteristics for each dimension or component of a natural system,and a thumbnail sketch of what an ‘ideal’ natural system would look like, are thenpresented using the matrix to organize the information.
Section 3.2 addresses carrying capacity, limits of acceptable change (LAC),sustainable development and other ways to describe management goals. Section3.3 recommends that the NWT adopt an LAC approach.
3.1 Dimensions to be Included (the Matrix)
The literature reveals a trend toward representing multi-dimensional natural systemsby supplementing physical descriptions with information about process andinterrelationships, and also taking both spatial and temporal scales into account.Table 1 lists five frameworks which have been put forward by authors within the lastten years:
Authors Context Dimensions Included
1990 Noss Biodiversity Perspective StructureFunctionComposition
1992 LandscapePerspective
StructureFunctionResponse of Organisms
1994 Lyle Ecosystem Design StructureFunction Location
19941995
Hersperger; Forman
Landscape Ecology StructureFunctionChange
1998 Tyler andPerks
Ecological Design StructureFunctionBehaviour (Change over Time)Interrelationships

Carrying Capacity and Thresholds: Page Theory and Practice in Environmental Management
12
A common feature of all five frameworks is their inclusion of both structural andfunctional dimensions to describe a natural system. Structure is generally taken torefer to vertical and horizontal stratification (Tyler and Perks, 1998), “the amount orarrangement of substance within a particular space,” or “the physical organizationor pattern of a system, from habitat complexity as a measure within communities tothe pattern of patches and other elements at a landscape scale” (Martinez, 1996).Forman (1995), however, uses the term “spatial structure” to describe “the morephysical, or measurable aspect of structure ... [it] is the physical arrangement ofupper, middle and lower canopy vegetation in relation to each other, as well as theabiotic physical and geological landscape. This arrangement can be verticallystratified by standing in one place and looking up towards the sky and back downto the ground, or horizontally stratified by walking across a site and noting thechanges in upper, middle and lower canopy.”
Ecological function is the interaction of a system’s components which give rise tomaterials and energy movements through food chains and cycles (“the processingand dynamics of resources (nutrients, organic matter, biomass and energy) througha system”, Collins and Benning, 1996). Forman (1995) uses the term “trophicstructure” to describe this process. Ecological functioning represents one of themore important dimensions of a natural system. It includes primary productionprocesses such as photosynthesis (only plants can transform light, water and CO2into simple sugars — the foundation for food chains), fundamental regulatoryprocesses such as transpiration (vegetative uptake of water which extends thehydrological cycle), and nutrient processes (such as nitrogen-fixing bacteria whichare a necessary pre-condition for plant growth).
Beyond structure and function, the five frameworks demonstrate a steadyprogression towards an increasingly multi-dimensional representation of naturalsystems. Noss (1990) introduced a matrix for indicator variables that explicitlydifferentiated between four spatial scales (regional landscape, community-ecosystem, population-species and genetic); used structure and function as hisbasic categories; and then added the concept of ‘composition’ which captured someof the dynamics of biotic interrelationships. Two years later, Dunning et al.advanced the topic of interrelationships by drawing attention to the fact thatorganisms respond differently to structural and functional elements. Nevertheless,their framework did not extend to temporal and spatial scales. Lyle (1994) returnedto the subject of spatial scales by categorizing ‘location’, but continued to ignoretemporal concepts in his framework. Hersperger (1994) and Forman (1995) tookthe opposite tack in substantially similar frameworks that emphasized a temporaldimension by explicitly acknowledging the role which ‘change’ plays over time innatural systems.
Tyler and Perks (1998) wove all dimensions together in what they called the ‘FourFactors Model’. In addition to structure and function, they asserted that allecological systems exhibit community change over time (‘behaviour’) and that allhave trophic webs and habitats (‘interrelationships’). The concept ofinterrelationships not only refers to the importance of spatial location but it alsoimplies trophic interactions, making this classification a more powerful descriptivetool. The interrelationship category both acknowledges the importance of locationalrelationships among system components and emphasizes the less visiblerelationships of the trophic web (energy flow and material cycling within a system’sstructure).

Carrying Capacity and Thresholds: Page Theory and Practice in Environmental Management
13
Combining the work of these authors, it is feasible to build a matrix that provides amulti-dimensional representation of natural systems, which can serve as afoundation for setting management goals. The matrix presented earlier in Figure2 (page 6) uses three of the four spatial scales suggested by Noss (1990), omittingonly the genetic scale and placing more emphasis on the regional, ecosystem andpopulation/species scales. This matrix also includes the four factors which Tylerand Perks (1998) proposed be used as a normative approach. The combinationthereby corresponds to the parameters set out by Dunning et al. (1992):
• it adequately reflects the importance of process (and, by relation,structure);
• it represents a holistic approach that examines interrelationshipsbetween all elements; and
• it reflects the importance of scale, both temporal and spatial.
Table 2 presents a summary description of some typical characteristics for eachdimension or component of a natural system. This summary description is by nomeans exhaustive. However, it provides an illustration of the sort of information thatcan be collected and categorized in each dimension of the matrix. It should benoted that a similar matrix (as it relates to scale dimensions) could also beconstructed for socio-economic characteristics.
Table 2: Typical Characteristics of a Multi-dimensional Natural System
Regional/Landscape
Large scale spatial contextdefined by many types ofhabitat - the full extent is
defined by the researcher &is usually $1,000 km2
Ecosystem/Community
Medium scale spatial contextdefined by an ecosystem
within which a group of species(a community) interacts
Population/Species
Fine scale context defined bya group of similar individuals(a population) or the total # ofsuch individuals in the study
area (a species)
Structure
The physical shape,composition &distribution of bioticand abiotic elements
Location and shape ofdifferent types of habitats;geological features; otherphysical features and humandevelopments
Shape and identity of physicalelements in the habitat,including identity and distribu-tion of biotic species
Demographics of the popula-t ion , i t s geograph ica lboundaries, its habitat usageand its physical characteristics
Function
Interaction of systemcomponents whichgive rise to materialand energy cycles
Disturbance processes,erosion and geomorphicprocesses
Photosynthesis, food chains,hydrological cycle, nitrogen andphosphorous cycles
Reproductive processes,a d a p t a t i o n s t o t h eenvironment, life history
Interrelation-ships
Significant inter-connections betweenstructural andfunctional elements
Variety and interconnectionof habitats which promotemovement of wildlife andnutrients between habitats
Keystone and umbrellaspecies, symbiotic relationships
Population dynamics, foodwebs
Time (trends)
Changes in structure, function &interrelationships over time
Patch persistence andturnover rates, human land-use trends
Changes over time in thedegree of observed biodiversity
Changes over time in a singlespecies’ physical form orfunction
Carrying Capacity and Thresholds: Page Theory and Practice in Environmental Management
14
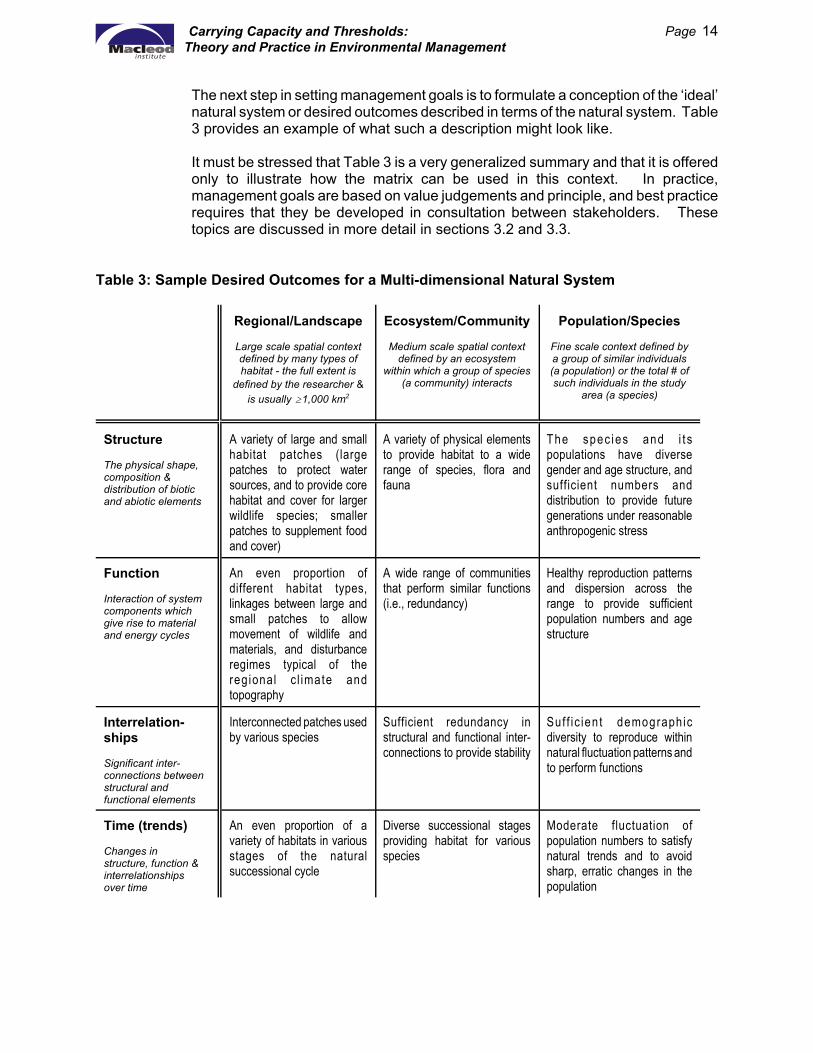
The next step in setting management goals is to formulate a conception of the ‘ideal’natural system or desired outcomes described in terms of the natural system. Table3 provides an example of what such a description might look like.
It must be stressed that Table 3 is a very generalized summary and that it is offeredonly to illustrate how the matrix can be used in this context. In practice,management goals are based on value judgements and principle, and best practicerequires that they be developed in consultation between stakeholders. Thesetopics are discussed in more detail in sections 3.2 and 3.3.
Table 3: Sample Desired Outcomes for a Multi-dimensional Natural System
Regional/Landscape
Large scale spatial contextdefined by many types ofhabitat - the full extent is
defined by the researcher &is usually $1,000 km2
Ecosystem/Community
Medium scale spatial contextdefined by an ecosystem
within which a group of species(a community) interacts
Population/Species
Fine scale context defined bya group of similar individuals(a population) or the total # ofsuch individuals in the study
area (a species)
Structure
The physical shape,composition &distribution of bioticand abiotic elements
A variety of large and smallhabitat patches (largepatches to protect watersources, and to provide corehabitat and cover for largerwildlife species; smallerpatches to supplement foodand cover)
A variety of physical elementsto provide habitat to a widerange of species, flora andfauna
The spec ies and i t spopulations have diversegender and age structure, andsufficient numbers anddistribution to provide futuregenerations under reasonableanthropogenic stress
Function
Interaction of systemcomponents whichgive rise to materialand energy cycles
An even proportion ofdifferent habitat types,linkages between large andsmall patches to allowmovement of wildlife andmaterials, and disturbanceregimes typical of thereg ional c l imate andtopography
A wide range of communitiesthat perform similar functions(i.e., redundancy)
Healthy reproduction patternsand dispersion across therange to provide sufficientpopulation numbers and agestructure
Interrelation-ships
Significant inter-connections betweenstructural andfunctional elements
Interconnected patches usedby various species
Sufficient redundancy instructural and functional inter-connections to provide stability
Suf f ic ien t demographicdiversity to reproduce withinnatural fluctuation patterns andto perform functions
Time (trends)
Changes in structure, function &interrelationships over time
An even proportion of avariety of habitats in variousstages of the naturalsuccessional cycle
Diverse successional stagesproviding habitat for variousspecies
Moderate fluctuation ofpopulation numbers to satisfynatural trends and to avoidsharp, erratic changes in thepopulation

Carrying Capacity and Thresholds: Page Theory and Practice in Environmental Management
15
3.2 Carrying Capacity and Limits of Acceptable Change (LAC)
Most environmental management goals begin with a fairly simple proposition suchas Malthus’ subsistence levels (quoted earlier at page 4). Fundamentally, theyrecognize the impossibility of substituting photosynthesis and other essentialservices provided by natural systems with currently foreseeable technologicalinnovation (Barkmann and Windhorst, 2000; Daily and Ehrlich, 1992). There arevariations in emphasis, however, between different formulations of this precept.
Sustainable development focuses on the type of activity necessary to sustainhuman, flora and fauna populations into the future. Broadly speaking, it is a“regulative principle” advocating the use of ecological knowledge in managerialdecision-making (Enquete-Kommission, 1998). Sustainable development explicitlystipulates that both economic and social sustainability rely upon the ecologicalsustainability of natural systems, and further acknowledges that qualitativeimprovements in economic and social systems can also help achieve the goal ofecological sustainability. An enhanced understanding of how land is administered,for instance, can facilitate the integration of ecological principles into urban and ruraldevelopments (MacDonald, 2001). Using traditional ecological knowledge (TEK) tohelp choose valued ecosystem components is another example of a qualitativeimprovement in social systems which can augment ecological sustainability.
Ecological integrity and ecosystem health, on the other hand, focus on desiredenvironmental conditions. Grumbine (1997) describes ecological integrity as theresult achieved by “maintaining viable populations of native species, representativeof ecosystem types across their natural range of variation, maintaining ecologicalprocesses, management over the long term and accommodating human use withinthe above constraints”. The term ‘ecosystem health’ is sometimes used as asynonym for ecological integrity but is falling out of favour as a concept, in partbecause it is based on a human analogy and in part because it carries with it theconnotation of illness (i.e., any deviation from the healthy state must, by definition,be unhealthy). As Dahms and Geils (1997) have pointed out,
The difficulties of defining an optimal condition for ecosystem health,coupled with the lack of universally accepted indicators to measureecosystem health, have led scientists to conclude that the concept ofecosystem health is ecologically inappropriate.
Carrying Capacity
The phrase “carrying capacity” was first proposed in 1838 by Pierre Verhulst, aBelgian statistician interested in population growth, and is now applied to a “widerange of disciplines, including biology, ecology, anthropology, geography andbusiness management”. (Budd, 1992)
Not surprisingly, given its 60 year history, definitions of carrying capacity abound.However, they all refer to population numbers and the areal extent required toproduce sufficient resources to support them. A sample of recent definitions ispresented in Table 4.

Carrying Capacity and Thresholds: Page Theory and Practice in Environmental Management
16
Table 4: Recent Definitions of Carrying Capacity (CC)
Author Quotation
2001 Abernathy, V. an ecological concept that expresses the relationship betweena population and the natural environment on which it depends forongoing sustenance…the number of (individuals) who can besupported without degrading the natural, cultural and socialenvironment
1992 Budd the maximum population that can be sustained in a habitatwithout the degradation of the life-support system
2001 Catton the maximum load an environment can permanently support(i.e., without reduction of its ability to support future generations),with load referring not just to the number of users of anenvironment but to the total demands they make on it
1992 Daily and Ehrlich the measure of the amount of renewable resources in theenvironment that can support a given number of organisms
Environment Canadawww.ec.gc.ca
the number of organisms that an ecosystem can supportindefinitely
1991 IUCN Caring for the Earth
the capacity of an ecosystem to support healthy organismswhile maintaining its productivity, adaptability, and capability forrenewal
1999 Papergeorgiou andBrotherton
the capability of the resource base to continue to provide forrecreation use is generally viewed through the concept of CC
1998 University of Michigan the population of a given species that can be supportedindefinitely in a defined habitat without permanently damagingthe ecosystem upon which it is dependent. However, becauseof our culturally variable technology, different consumptionpatterns, and trade, a simple territorially-bound head-countcannot apply to human beings. Human CC must be interpretedas the maximum rate of resource consumption and wastedischarge that can be sustained indefinitely without progressivelyimpairing the functional integrity and productivity of relevantecosystems
Carrying capacity (CC) has been successfully used in livestock and rangemanagement programs for decades. The University of California, for example,supports a web page that gives farmers a simple procedure for estimating CC. Itbegins with the instruction “Pace off an area you think has enough forage to feed ananimal for one day.” Stock Days per Acre are then calculated and multiplied by thenumber of acres per paddock to arrive at an estimate of the field’s carrying capacityexpressed as Stock Days (the CC). Farmers use this number, divided by thenumber of animals in their care, to determine how long the paddock will sustain theherd. It is a nice, simple approach that generates practical benefits for livestock andrange managers.

Carrying Capacity and Thresholds: Page Theory and Practice in Environmental Management
17
Nevertheless, this simple illustration of CC also illuminates some of the difficultiesassociated with carrying capacity. For example, the University is careful to caveatits instructions by saying that the procedure is “best applied near the end of thegrowing season when little additional growth is expected.” The procedure is alsofirmly entrenched in managerial expertise — in this case, a pragmatic knowledge ofthe amount of forage one animal requires for daily sustenance (which is rarelyavailable in a larger context such as regional landscape environmentalmanagement). Even so, the University goes on to say that “your estimates are likelyto be off a bit when you try this for the first time. The accuracy of your estimate canbe tested simply by putting stock in a small paddock to graze” and observingdiscrepancies between the farmer’s prediction and actual results (a rudimentary, buteffective, monitoring program).
Daily and Ehrlich (1992) have said what countless other experts have repeated overthe years: “Though the concept is clear, carrying capacity is difficult to estimate.”The larger the territorial extent of a study area, and the greater the number ofvariables involved, the more imprecise are the estimates of CC. It is also worthnoting that variables do not necessarily have linear relationships, which adds to theimprecision of CC estimates.
Moreover, notwithstanding the allure of formulae and the promise of a constantnumber (K) to express carrying capacity, there is no magical absolute. A populationof 101 deer will not cataclysmically disappear once it has surpassed its CC of 100(although the population will gradually show signs of poor reproduction rates,decreased antler growth and increased mortality rates, at least until the populationstabilizes again). Nor is CC a fixed number. It can alter given climatic conditions orwith technological adaptations. A harsh winter will decrease carrying capacity,whereas technological improvements such as fertilizing crops will increase it. CCwill also fluctuate according to von Lieberg’s law of the minimum, closely mimickingthe ebb and flow of the least abundant variable in the system (e.g., nitrogen).Carrying capacity is an ever-changing target.
Budd (1992) has pointed out that, because the ability of an ecosystem to supportanimal life is the concept at its foundation, CC focuses on food availability. Certainrules consequently emerge: it is possible for a region to exceed its carrying capacitytemporarily; and a renewable resource base cannot indefinitely sustain a populationbeyond its carrying capacity. However, human populations violate both these rules,rendering them inoperative because of cultural, technological and economic factors.For example,
• human populations differ widely in the amount of goods theyconsume (the cultural factor), which vastly complicates CCcalculations.
• humans have also exhibited enormous capacity to increase CCthrough artificial means such as resource substitution and/orimproved efficiency (the technological factor), and through tradearrangements which import scarce resources (the economic factor).
When applied to human systems, therefore, CC becomes far more complicated.Budd concludes by observing that technology and trade are the sources of the “veryproblems we are seeking to resolve”, and suggests that CC
... [must be addressed] from a human ecological perspective ... extendingthe traditional ecological concept of carrying capacity into the human realmand integrating cultural traditions, social linkages, political trade-offs andeconomic considerations into one interrelated system.

Carrying Capacity and Thresholds: Page Theory and Practice in Environmental Management
18
Limits of Acceptable Change (LAC)
The Limits of Acceptable Change (LAC) model was developed in response toshortcomings inherent in carrying capacity models. Quite often, CC models simplydid not work — they were “technical, mechanistic and formula-driven” (Stankey,1997).
In countering these defects, Stankey and others deliberately sought to incorporatesocial dimensions and multi-stakeholder collaboration in ecological planningprocesses. The resulting LAC approach explicitly acknowledges that human-induced change will occur and then sets boundaries on the extent of change that willbe permitted. An entire nine-step stakeholder process has evolved whichsystematically leads to formulation of a management program (used extensively bythe US Forest and National Parks Services). Goals and objectives are established,indicators are chosen and roles and responsibilities are assigned.
Gimblett (2001) notes that LAC
... incorporates much of the theoretical and empirical development of the pastcarrying capacity models, but it makes three important advances:• it focuses more on conditions of the experience or the resource to be
maintained, rather than the amount and type of use on area resources;• it recognizes that any use of an area causes some change or impact to the
experience of the resource, and deciding on how much change is too muchchange is largely a value judgement;
• it provides a framework for defensible value judgement.
LAC management goals are expressions of socially acceptable conditions, asopposed to definitions of prohibited uses or proscribed levels of pollution. Theyreflect the maximum impact that will be tolerated in a balance struck betweenhuman use and ecological integrity. The goals are given context by creatingOpportunity Classes which “provide a qualitative description of the kinds of resourceand social conditions [considered] acceptable for that class” by stakeholders (USNational Forest Service, 2001). Opportunity Classes set the framework for morespecific objectives and management action.
The LAC model was originally designed in the context of recreational user conflictsin wilderness areas. Indeed, it has been described explicitly as “a compromisebetween opposing objectives” (Cole & Stankey, 1997), and can therefore beemployed in a broader range of situations. Cole and McCool (1997) ask fourquestions to determine whether the LAC approach is appropriate:
1. Am I attempting to resolve conflict between several goals?2. Am I willing to compromise all goals to some extent?3. Am I willing to establish a hierarchy of goals and decide that some
goals will constrain other goals?4. Is it possible to write measurable and attainable standards that can
be useful for assessing acceptability in the future?
If the answer to each question is affirmative, then the LAC model can be applied withconfidence.

Carrying Capacity and Thresholds: Page Theory and Practice in Environmental Management
19
3.3 A Suitable Approach for the NWT
The LAC approach offers considerable potential for adaptation in the context ofdescribing environmental management goals in Canada’s North. One of theadvantages of LAC is that it neither depends on complicated esoteric calculationssuch as carrying capacity, nor does it rely on relatively abstract notions such assustainable development. LAC is at once pragmatic (acknowledging humanactivities), and principled (establishing socio-economic and science-based ecologicalboundaries to activity). It is also action-oriented — it explicitly drives toward amanagement program that includes an implementation schedule and monitoringagenda.
The four questions posed by Cole and McCool (1997) can largely be answered inthe affirmative. As to conflict between several goals, there is no question thatpeople in the North are faced with difficult choices between economic developmentand ecological conservation. Northerners have also demonstrated confirmation ofthe second and third questions, a willingness to compromise all goals to some extentand an ability to move toward a hierarchy of goals. As just one example, MappingOur Future, (2001), a report prepared for the Sahtu Land Use Planning Board,concluded from a community survey that
clearly the overwhelming majority of respondents do endorse developmentto varying degrees, but in a controlled manner. Also, a vote in the thirdcategory, which specifies that development should exclude significant sites,is an implicit endorsement of the path we are taking in identifying such sitesand recommending measures for their protection.
The final precondition for adopting the LAC approach — measurable and attainablestandards — is the most challenging, yet here too there is reason to be positive.There is a growing accountability culture in the NWT that is fostering the use ofindicators and measurable management objectives amongst governmentdepartments and community agencies. Towards Excellence ‘99: A Report onEducation in the Northwest Territories is an example of this trend; it includesseveral input and output measures such as student enrolment and graduation rates.And, as is discussed more fully in section 4.2, some quantifiable outcomes such aswildlife range densities are beginning to emerge from the monitoring programsundertaken over the past five years. Adapting and adopting the LAC approach willreinforce the trend toward articulating measurable objectives. Using the matrix(Figure 2) as a guide for developing measurable and attainable standards will alsohelp.
Perhaps the most important advantage of LAC is its intuitive appeal. The conceptis easy to grasp, and indeed captures the way a great many people talk about theirdesires for the future. For instance, the community survey conducted by the SahtuLand Use Planning Board addressed the industrial development issue by asking thefollowing two questions (Mapping Our Future, 2001):
• Do you think that there should be restrictions to the amount of landthat is opened up for development in the Sahtu region?
• What reasons do you have for thinking there should be more or lessdevelopment?

Carrying Capacity and Thresholds: Page Theory and Practice in Environmental Management
20
The multiple-choice answer format used in the survey tended to confuse matters, butthe report included a selection of comments from respondents that illustrated theirfeedback (Appendix 10). One person said that
We definitely need jobs — we can have a balance. We musthave some protection for the lakes and rivers, making sure thereare not spills. In other words, monitor carefully. This is veryimportant — one monitor for the Dene and one for the oilcompanies.
As can be seen from this example, respondents’ comments in many cases reflecteda vernacular description of what “acceptable limits to change” looked like for them. Some caution must be exercised, of course. Defining limits of acceptable changerelies heavily on collaboration between stakeholders. LAC is designed to elicitconsensus views with respect to desired outcomes and to delineate areas thatreflect primary stakeholder interest or concern. Given the multiplicity of decision-makers across the northern regions of Canada, this feature of the LAC approachcould prove to be a strength, but it may also reveal a weakness if an insufficientnumber of groups choose to participate.
Another caveat is the need for monitoring. Once socially-defined thresholds areestablished, they need to be obeyed and it is preferable if all managers anddecision-makers are consistent. Again the importance of cooperation amongvarious communities of interest is called upon for effective implementation.
Finally, competing interests heighten conflict when “legitimate demands for bothnonrenewable commodities and preservation amenities” exist (Brunson, 1997).Equity issues can predominate when all concerned are seeking their ‘share’, andthere is a danger for economic interests to take precedence over ecologicalrequirements in such situations. The LAC approach effectively guards against thisdanger as long as a sufficient number of interests (including ecological expertise) isincluded amongst the stakeholders. In addition, the matrix (Figure 2) or somesimilar device can help by providing a multi-dimensional framework for data anddecisions, as can adopting the precautionary principle and the principle of protectingecological integrity.
On balance, the Institute is of the opinion that the LAC approach should be adaptedand adopted for integrating principles of carrying capacity into environmentalmanagement (including cumulative effects assessment) in Canada’s North.
If the LAC approach is adopted for application across NWT regions, the first stepentails articulating overall management goals — qualitative statements describingdesired outcome(s) — for the whole region. Opportunity Classes (broad categoriessuch as land-use, conservation, and recreation) are then stipulated, and goals foreach category are enunciated. For example, the Lake Tahoe Region (Lake Tahoe,2001) adopted the following overall regional goal:
a. Maintain the significant scenic, recreational, educational, scientific,natural, and public health values provided by the Region; and
b. Insure an equilibrium between the Region’s natural endowment andits manmade environment.
Together these will encourage the wise use of the waters of Lake Tahoe andthe resources of the area, preserve public and private investments in theRegion, and preserve the social and economic health of the Region.

Carrying Capacity and Thresholds: Page Theory and Practice in Environmental Management
21
The Lake Tahoe Region refined its overall goal by creating five Opportunity Classes(referred to as “elements of the Regional Plan”), and developing goals and policiesrelated to each. The Land Use Element “sets forth the fundamental land use of theRegional Plan, including the direction of development to the most suitable locations[and] maintenance of the environmental, social, physical and economic well-beingof the Region”. As the Tahoe Region Planning Association stated, emphasis hasshifted “from regulating the quantity of permitted development” to improved qualityof “development and the natural environment.” Eleven goals were stipulated forvarious land-use sub-elements, the first of which reads as follows:
Restore, maintain, and improve the quality of the Lake Tahoe Region for thevisitors and residents of the Region.
It is interesting to note that the Gwich’in Land Use Planning Board (1999) hasarticulated a very similar statement of its goals (as is section 35 of the MVRMA):
The Planning Board envisions a Gwich’in Land Use Plan where land, water,wildlife and other resources are conserved, developed and used to protectand promote the existing and future well-being of the residents andcommunities of the settlement area, while having regard to the interests ofall Canadians.
The Lake Tahoe Region also stipulated 14 goals for the Conservation Element of itsRegional Plan. The five goals dealing specifically with vegetation, for instance, aimto
1. Provide for a wide mix and increased diversity of plant communitiesin the Lake Tahoe Basin.
2. Provide for the maintenance and restoration of such uniqueecosystems as wetlands, meadows and other riparian vegetation.
3. Conserve threatened and endangered and sensitive plant speciesand uncommon plant communities of the Lake Tahoe Basin.
4. Provide for and increase the amount of late seral/old growth standswithin the Lake Tahoe Basin.
5. The appropriate stocking level and distribution of snags and coarsewoody debris shall be retained in the region’s forests to providehabitat for organisms that depend on such features and toperpetuate natural ecological processes.
4.0 DEFINING MANAGEMENT OBJECTIVES
Once overall management goals are set, they must be “objectified” or expressed inlanguage that is as concrete as possible. Failure to do so leaves managers with nofirm foundation on which to base their activities, and usually sows the seeds offrustration and confusion (not to say inactivity). Objectives are often expressed interms of acceptable results. It is in this context that the subject of thresholds andindicators is addressed in section 4.1. The current situation in the NWT is brieflypresented in section 4.2.
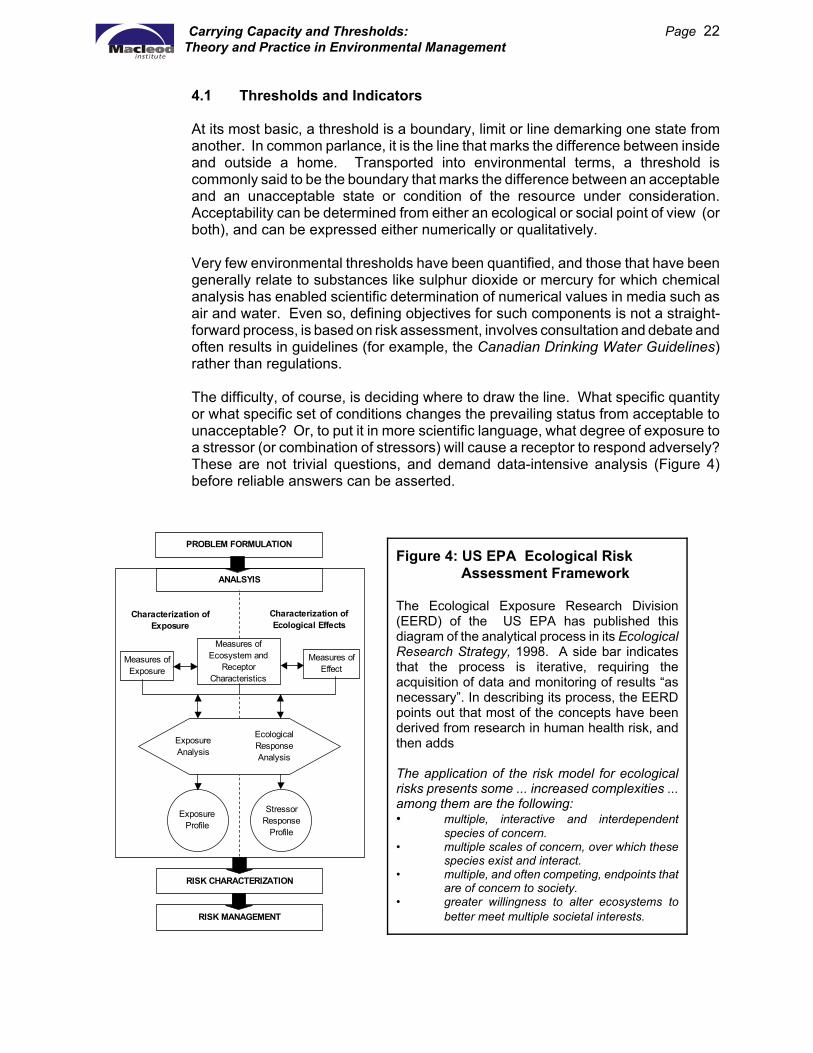
Carrying Capacity and Thresholds: Page Theory and Practice in Environmental Management
22
Measures of Exposure
Measures of Effect
Measures of Ecosystem and
Receptor Characteristics
Exposure Analysis
Ecological Response Analysis
Exposure Profile
Stressor Response
Profile
Characterization of Exposure
Characterization of Ecological Effects
PROBLEM FORMULATION
ANALSYIS
RISK CHARACTERIZATION
RISK MANAGEMENT
Figure 4: US EPA Ecological Risk Assessment Framework
The Ecological Exposure Research Division(EERD) of the US EPA has published thisdiagram of the analytical process in its EcologicalResearch Strategy, 1998. A side bar indicatesthat the process is iterative, requiring theacquisition of data and monitoring of results “asnecessary”. In describing its process, the EERDpoints out that most of the concepts have beenderived from research in human health risk, andthen adds
The application of the risk model for ecologicalrisks presents some ... increased complexities ...among them are the following:• multiple, interactive and interdependent
species of concern.• multiple scales of concern, over which these
species exist and interact.• multiple, and often competing, endpoints that
are of concern to society.• greater willingness to alter ecosystems to
better meet multiple societal interests.
4.1 Thresholds and Indicators
At its most basic, a threshold is a boundary, limit or line demarking one state fromanother. In common parlance, it is the line that marks the difference between insideand outside a home. Transported into environmental terms, a threshold iscommonly said to be the boundary that marks the difference between an acceptableand an unacceptable state or condition of the resource under consideration.Acceptability can be determined from either an ecological or social point of view (orboth), and can be expressed either numerically or qualitatively.
Very few environmental thresholds have been quantified, and those that have beengenerally relate to substances like sulphur dioxide or mercury for which chemicalanalysis has enabled scientific determination of numerical values in media such asair and water. Even so, defining objectives for such components is not a straight-forward process, is based on risk assessment, involves consultation and debate andoften results in guidelines (for example, the Canadian Drinking Water Guidelines)rather than regulations.
The difficulty, of course, is deciding where to draw the line. What specific quantityor what specific set of conditions changes the prevailing status from acceptable tounacceptable? Or, to put it in more scientific language, what degree of exposure toa stressor (or combination of stressors) will cause a receptor to respond adversely?These are not trivial questions, and demand data-intensive analysis (Figure 4)before reliable answers can be asserted.

Carrying Capacity and Thresholds: Page Theory and Practice in Environmental Management
23
The EPA’s Ecological Exposure Research Division has ably summarized thechallenges being addressed, as follows:
Stated most simplistically, the challenge in the ecological research area isto provide the information and methods to develop risk assessments andmanagement strategies for
• single stressors (chemical and nonchemical, natural andanthropogenic) acting on simple receptors (ecosystems, ecosystemcomponents, communities, populations, and valued societal goodsand services — endpoints);
• single stressors acting on multiple receptors;• multiple stressors acting on individual receptors; and• multiple stressors acting on multiple receptors.
The uncertainty in risk characterization increases as the more complicatedcombinations are considered ... Added to the complexity is the additionalneed to conduct risk characterization at multiple scales, and the fact thatnonchemical stressors may be more important than chemical stressors (forwhich most of the concepts in risk assessment have evolved) inecosystems.
This brief description of the challenges faced by ecological researchers raises amultitude of fascinating issues for debate, but two essential points can beemphasized immediately. First, no line can be drawn in isolation from thecontinuum that represents a progression from acceptable ecological conditions tounacceptable ecological conditions. And second, scientists (and by extension,regulators, managers and other stakeholders) have yet to acquire sufficientinformation to allow them to describe with confidence the full continuum ofecological conditions.
Resource managers are thus faced with a major dilemma — how to proceed in theface of all this uncertainty. One response has been adoption of the precautionaryprinciple (“when an activity raises threats of harm to human health or theenvironment, precautionary measures should be taken even if some cause andeffect relationships are not fully established scientifically”). Another has beenacceptance of (or at least some attempt at) an adaptive management approach. Athird response has focused activity on developing and adopting indicators ofenvironmental performance.
Indicators
The OECD defines an indicator as “a parameter, or a value derived fromparameters, which points to, provides information about or describes the state of aphenomenon, environment or area with a significance extending beyond that directlyassociated with a parameter value”. Robson and Whitaker (2001) have made thepoint that
Indicators are select sets of data intended to show changes and trends inlarger systems over time. Often the systems represented, whether local orregional, social, ecological, economic or political, are too large and complexto measure directly. Indicators are used as important tools for derivingsystematic feedback about these large and complex systems.
Carrying Capacity and Thresholds: Page Theory and Practice in Environmental Management
24
The promise of indicators to provide systematic, rational and practical informationhas elicited a prolific response from scholars and managers alike. A review of theliterature on monitoring and ecological indicators undertaken three years ago byGriffith (1998), for instance, included 196 references. Many countries havelaunched extensive efforts to develop indicators and collect the associated data.The US EPA’s Environmental Monitoring and Assessment Program (EMAP) is oneexample; Canada’s Ecological Monitoring and Assessment Network (EMAN) andEnvironment Canada’s Indicators and Assessment Office are others.
The advantage of indicators is that they introduce a degree of clarity toenvironmental management objectives that was often missing in previous decades.As Noss (1990) said (writing in the context of biodiversity),
One way to escape the vagueness associated with the biodiversity issue isto identify measurable attributes or indicators of biodiversity for use inenvironmental inventory, monitoring and assessment programs.
Rather than waiting for precise thresholds to be defined, many environmentalmanagement programs now express their objectives in terms of indicators that, asoften as possible, are quantifiable at least to some degree. The LAC process is agood illustration of this approach — selecting indicators and setting standardsconstitute the 3rd and 5th steps of its nine step program.
In effect, objectives, and indicator values chosen as an expression of them, areused as thresholds when making managerial decisions and assessing thesignificance of proposed activities (as in a CEA, for instance), until such time asprecise scientific formulations of thresholds are available. Typically, a ‘bundle’ ofindicators will be chosen so that the appropriate array of environmental dimensionswill be addressed. The objectives and indicators are as specific as the current levelof (scientific and other) knowledge permits, reflect a balancing of public interestsand accommodate certain practicalities such as the feasibility of collecting requireddata.
How Indicators are Used in the LAC approach
The Rattlesnake National Recreation Area and Wilderness management plan(Rattlesnake, 1992) illustrates how indicators are used in a recreational context.Having first described the resource and social settings in each of five OpportunityClasses, the Forest Service then prescribed its specific management objectives foreach class. The management objectives for Opportunity Class 1 - Pristine arestipulated (in part) as follows:
Management emphasizes sustaining natural ecological processes. ... Visitoruse of this area will not be prohibited, neither will it be encouraged. Minimumimpact camping practices will be strongly emphasized ... If user-initiatedtrails or other such resource damage become apparent resource protectionmeasures will be considered....
A Task Force next identified a number of indicators, defining them as
... variables or elements of the resource or social setting that serve tomeasure the condition of that setting. Indicators are defined as Resource,Social, or Managerial conditions...

Carrying Capacity and Thresholds: Page Theory and Practice in Environmental Management
25
A suite of indicators was then assigned as appropriate to each Opportunity Class.They were selected based on
• their relevancy to identified issues, • the presence of a valid and reliable method of measurement, • their sensitivity to changes in conditions, and • the extent to which they were indicative of actual conditions.
Finally, values were chosen for each indicator as standards, and managementactivities were specified for implementation in the event that the standards areexceeded. Table 5 lists sample indicators and standards chosen for application inOpportunity Class 1 - Pristine. Standards range from the specific to the general,and some standards have yet to be specified pending further data collection oranalysis.
Table 5: Sample Indicators and Standards Applied in Opportunity Class 1 - Pristine (Rattlesnake Management Plan)
Indicator Standard
Number of formaleducation trips in thearea
No limit on number of trips as long as encounter andsolitude standards are not exceeded; group sizelimited to 10 people
Amount of bare soil inriparian zone
Not yet determined
Trails: clearing width,tread width, maximumsustained grade,maximum sustainedtread depth
No trails or roads in Opportunity Class 1; no new trailsor trail heads
Campsite density No increase in existing number of campsites
Campsite condition Evidence of camping not to persist from year to year
Insect threat No control
Vegetative diversity Compare vegetative community composition every 10years against previous decades (aerial photosavailable back to 1937) to detect adverse trends
The Process of Selecting Indicators
Selecting indicators (i.e., deciding what and how to measure) is a subject in and ofitself, and is addressed later in section 6.1. The process used to select indicatorsalso deserves attention, however, and that topic is briefly discussed below.
Figure 5 (adapted from Robson and Whitaker, 2001) is a typical process diagramillustrating the steps involved in developing and implementing indicators.

Carrying Capacity and Thresholds: Page Theory and Practice in Environmental Management
26
Scope Issues
Collate Existing
Information
Articulate Goals and Objectives
Select and Develop
Indicators
Implement Indicators
Targeted Research and
Monitoring
MonitoringInformation on Environmental
Conditions
Community and Scientific Involvement
Figure 5: Process Diagram for Developing and Implementing Indicators
As Figure 5 shows, the typical process for selecting indicators is remarkably similarto the normal management cycle of plan–implement–monitor–review (which isapplied to both single projects and to operations generally). It can be integrated intoenvironmental management activities relatively easily since it corresponds soclosely to what many recognize as a familiar pattern.
In the event that the LAC approach is adopted and adapted for use in Canada’sNorth, this process can be integrated as a matter of course. It is designed to includeconsultation with both community stakeholders and the scientific community, andit reinforces LAC’s aim of establishing acceptable limits of change. It alsounderlines the fact that objectives, and indicator values chosen as an expression ofthem, are revisited and adapted on the basis of observed experience and results.
Defining management objectives, and expressing them in terms of indicator values,has the advantage of focusing attention on the particular rather than the general.Actual locations must be specified since the objectives and indicator values will besite specific to some degree. The locations themselves may be fairly large ingeographical extent, but there will be some common denominator (other thanadministrative or strictly jurisdictional) that leads managers and stakeholders todelineate their boundaries. In an area as broad as the North, it will likely benecessary to prioritize locations so that a sufficient concentration of effort can bebrought to bear on the exercise of choosing limits of acceptable change, definingobjectives and choosing indicators and data sets for each location.
4.2 Current Situation in the NWT
Defining thresholds and developing environmental indicators has been a difficulttask for researchers and managers in the NWT. Two reasons for this difficulty aresimilar to those experienced virtually everywhere else: a lack of baselineinformation, and an imperfect understanding of complex natural systems. Theamount of natural variability that occurs in northern climates, however, presentseven greater challenges than those found in many other regions (WKSS, 1999;Cluff, pers. comm. 2001).

Carrying Capacity and Thresholds: Page Theory and Practice in Environmental Management
27
Nevertheless, several northern activities have been undertaken in recent years anddata are beginning to accumulate. A review of the NWT literature and ongoingmonitoring projects has identified some areas that provide a starting point forselecting indicator values to express management objectives in terms of limits ofacceptable change.
The Institute has focused its attention on data sets with a potential for providingindicators applicable to nonchemical stressors originating in the NWT that affectwildlife and vegetation. Three reasons dictated this approach:
1. animals, birds and plants are more likely to be intuitively chosen bystakeholders to describe their limits of acceptable change;
2. a lack of definitive goals for biological resource groups continues tobe one of the key challenges facing regulators and practitioners inassessing the significance of cumulative effects (Macleod Institute,1998); and
3. standards and guidelines for chemical stressors are, relativelyspeaking, well established.
The information in Tables 6 through 8 was gathered in conversation with fourbiologists working in the NWT, and from a review of reports from a number ofagencies and initiatives such as the Canadian Tiaga and Tundra Experiment(CANTTEX), the West Kitikmeot Slave Study (WKSS), the IndependentEnvironmental Monitoring Agency (IEMA) and the Lutsel K’e Community-BasedMonitoring Project. A common thread through all such projects (for stressorsoriginating in the NWT) is the direct linkage between northerners’ lifestyles and theecosystem components being measured.
The three tables provide a summary of common indicators being monitored in theNWT. It is a comprehensive list but is in no way exhaustive. Tables 6 and 7 shouldbe read together; Table 6 was presented separately because the biological factorswere identified by northerners as potential thresholds. Table 7 lists indicators thedata for which, if collected for a continuous period of years to establish trends(behaviour over time), could also be used as thresholds.
Table 8 lists five social indicators identified in the West Kitikmeot Slave Study.Social thresholds for maintaining ecological sustainability include dimensions thatare difficult, if not impossible, to quantify. Cultural attachments to the landscape arebeing lost, for example, as more Dene communities become reliant on wageemployment. “Cultural traditions of both the Dene and Inuit were formed in an inter-dependence with the annual, plant, spiritual and human worlds” (WKSS, 1999).Finding a means to measure cultural attachment to the natural world is difficult butan important link in maintaining ecological components. As will be discussed later(section 6.3), traditional ecological knowledge (TEK) is currently being gathered anddigitized, and is expected to contribute to defining thresholds. Tools such asGeographical Information Systems (GIS) are allowing environmental managers tovisualize where important ecological components occur on the landscape in orderto avoid impacts.

Carrying Capacity and Thresholds: Page Theory and Practice in Environmental Management
28
Table 6: Biological Factors Identified by Northerners as Potential Thresholds
Species Indicator Biological Factor Source Correlationto Matrix
Arctic Plants PhenologyGrowth rate
[still unknown; research underway] CANTTEX2001; Eamer,pers. com
Function,Population
Caribou Range density < 2 caribou per km2 WKSS 1999 Structure,Population
Grizzly Range density 1 grizzly per 200 - 400 km2 WKSS 1999 Structure,Population
Body Fat Correlation with numbers of caribou(a preferred food source)
Function &Interrelation,Ecosystem
Linear disturbance (1) Habitat effectiveness reduced to- 50% at road density of 0.8 km/km2
- 75% at road density of 1.6 km/km2
Sawyer &Mayhood1998
Structure,Ecosystem
Wolverine Range density 1 wolverine per 130 - 500 km2 WKSS 1999 Structure,Population
Wolf Caribou as prey 1 wolf kills 15 caribou per year WKSS 1999 Function &Interrelation,Ecosystem
No. of active den sites(2)
Probability of using the den site Cluff, pers.com Interrelation,Population
Peregrine Falcon
[species at risk]
Range density 1 nest per 50 km2 WKSS 1999 Structure,Population
Nesting sites Minimum number of nesting sites Henry & Miico1997
Interrelation,Population
Arctic Grayling Growth rate Normal growth rate (1.5 - 4.0 grams per year)
IEMA 2001 Function,Population
Notes to Table 6:
1. Based on data collected in the Canadian Central Rockies of Alberta. Indicatorvalues would need to be verified for application in the NWT
2. Using a probability factor for threshold purposes is being explored by wildlifebiologists due to uncertainty as to whether changes in use can be attributed toindustrial development or to the wide range in environmental variability that existsin the Canadian north.
3. It should be noted that the factors enumerated above are also affected by stressorsoriginating beyond the NWT’s borders (for example, long-range transportation oforganic pollutants such as DDT, PCBs, and other oganochlorides that have noregional sources yet are found at measurable concentrations within the NWT. Theyreduce the nutritional value of “country food” and cultural connections to landscapeexperienced in the hunt (WKSS, 1999).)

Carrying Capacity and Thresholds: Page Theory and Practice in Environmental Management
29
Table 7: Indicators Measuring Stressors Originating in the NWT
Species orSubstance Indicator Comments Source Correlation
to Matrix
Low-arctic lakes Hydrology Water flow through an ecosystem CANTTEX2000
Function,Regional
Plants Biomass productivity Mass or weight of primary producers(e.g., forage eaten by caribou)
CANTTEX2001, Eamer,pers.com
Function,Ecosystem
Phenology In response to UV-B radiation CANTTEX2001
Function,Population
Growth rate In response to UV-B radiation,snowfall and permafrost changes
CANTTEX2001
Function,Population
Caribou Energetics Herbivory
Energy expended / food uptake; andamount of food eaten by herbivores
Russell &Eamer 2000
Function,Regional &Ecosystem
Caribou, wolf,wolverine, raptor
Range WKSS 1999 Structure,Population
Caribou, grizzly,wolf, human
Biomass of forbs How loss of forbs affects change inuse of caribou calving grounds, &caribou / predator relationships
Eamer, pers.comm
Function &Interrelation,Ecosystem
Wolf Heterogeneity Wolf heterogeneity refers to potentialfor distinct population segments ofwolves in the NWT
Musiani, pers.com
Structure,Regional
Arctic hare Demographics CANTTEX2000
Structure,Population
Black bellied plover Habitat diversity Re la t ive f requency cor re la tedbetween plover and habitat diversity
Henry & Mico,1997
Interrelation,Population
Human Caribou as prey 20 caribou per capita required forannual sustenance (historical data)
WKSS 1999 Function,Regional
Linear disturbanceSocio-economic factors
Access roads and relative affluenceprovided by mining industry increasehunting pressure on cariboupopulations & increase tourismdevelopment resulting in disturbancesaffecting caribou, wolf and raptorpopulations
RWEDWKSS 1999Cluff, pers.com
Interrelation,Regional
Notes to Table 7:
1. Trends (behaviour over time) serve as important indicators. Scientists believe thatthe indicators listed in Table 7 must be monitored on an on-going basis to revealsignificant long-term behaviours such as:
• changes in caribou range densities due to altered plant diversity (fewerforbs and more grass species) and changes in plant phenology (both as aresult of climatic change);

Carrying Capacity and Thresholds: Page Theory and Practice in Environmental Management
30
• a change in barren-ground & porcupine caribou calving grounds asvegetation patterns change;
• changes in barren-ground grizzly populations and distribution due tochanges in caribou populations and distribution (a preferred food source ofbarren-ground grizzly bears);
• changes in populations and distribution of other top predators (golden eagleand arctic wolf) as caribou populations and distribution change (Eamer pers.comm. 2001);
• an increase in disturbances of caribou, barren-ground grizzly and otherfauna with increased access (e.g., hunting, all-terrain vehicles) due to allweather road construction (Cluff pers. comm. 2001).
2. Stressors that originate outside the NWT are being monitored, but are notincluded in this table.
Table 8: Social Indicators
Indicator Quantification Source Correlationto Matrix
Birth rate Overall birth rate 22.8 per 1000, twice the national average WKSS 1999 Function,Region
3 times more likely among Aboriginal women WKSS 1999
High schoolcompetition rates
Grade 9 - 10 achievement is the norm WKSS 1999 Trends,Region
5% of Aboriginals & 30% of non-aboriginals graduate WKSS 1999
Employment andparticipation rates
61% among Aboriginals; 80% among non-aboriginals WKSS 1999
Ratio of lowestwage to nationallegal minimum
[note: this indicator, or the percentage of workers receivingminimum wage, could be used to track whether economicbenefits of industrial development are being distributedthroughout the NWT]
GRI 2000 Trends,Region
Percentage ofwomen in seniorexecutive andsenior and middlemanagementranks
[note: a similar indicator could be also be used to measurediversity as it applies to aboriginal peoples]
GRI 2000 Trends,Region
Although no sweeping conclusions can be drawn from Tables 6 through 8, it isevident that there is some way to go before precise scientific definitions ofthresholds, or sufficient years of accumulated data, will be available for a widerange of ecological dimensions related to fauna and flora in Canada’s North. In themeantime, data are being accumulated. LAC, a fundamentally pragmatic approachthat uses the best available knowledge coupled with socially-determined thresholds,is feasible as an interim measure.
Monitoring programs, including a discussion of what to measure, how to measureit, and gaps, are discussed in section 6.0. Management systems are addressed inthe following section 5.0.

Carrying Capacity and Thresholds: Page Theory and Practice in Environmental Management
31
5.0 IMPLEMENTING A MANAGEMENT SYSTEM
Setting management goals and defining management objectives are functionscarried out at the planning stage of the management cycle. The next stage of thecycle entails implementation.
It is imperative that goals and objectives be directly tied to action steps, both toensure a degree of accountability and also to begin to actualize desired outcomes.Several management approaches have been embraced over the years, but one thatis finding current favour is ‘tiered interventions’, discussed in section 5.1. Adiscussion of the potential use of the LAC approach in NWT’s integratedmanagement system constituted by the Mackenzie Valley Resources ManagementAct and the Inuvialuit Final Agreement follows, in section 5.2. Useful precedents orexamples of management systems incorporating the concepts of carrying capacityand thresholds are presented in section 5.3.
5.1 Tiered Management Interventions
The potential for certain indicator values to act as early warning mechanisms, aswell as to trigger medium to long-term management responses to environmentalstress, has been frequently cited as a reason for developing the indicators.Canada’s Environmental Monitoring and Assessment Network (EMAN) implicitlyrecognizes these outcomes in its explanation of the “what and why of EMAN”(Environment Canada, 2001), for instance, and the OECD has likewise explicitlyacknowledged “the principal aim of helping Member countries to improve theirindividual and collective performance in environmental management” in theintroduction to its Core Set of Indicators, 1993. Formalizing some means ofachieving a graduated or tiered set of management responses builds on previouswork done in the adaptive management field.
Auster (2001) has recently provided an outline of the tiered approach in his articleDefining thresholds for precautionary habitat management actions in a fisheriescontext. He contemplates four levels of response, predicated on the level ofuncertainty inherent in a given situation (see Table 9 on the next page).
A more finely calibrated set of management responses could be achieved, in theoryat least, by defining management objectives in terms of a series of indicator valuesdesigned to trigger increasingly conservative interventions. However, the Institutefound no examples in which such a management system has been implemented.Given that most jurisdictions are still in the early stages of developing indicators andimplementing monitoring programs that collect the required data, this lack ofprecedent is not unexpected.
Nevertheless, the Institute did find some precedents (see section 5.3) whichadvance the Auster model by substituting indicator values for degree of uncertainty.The El Dorado River Management Plan (RMP) is another example, notable for itsdeliberate prescription of four levels of progressively stringent mitigative orregulatory activities to be taken in the event that adverse impacts persist over time.Although not yet implemented, the RMP prescribes specific management activitiesat what Auster has called Preventive and Corrective Approach levels of response.

Carrying Capacity and Thresholds: Page Theory and Practice in Environmental Management
32
Table 9: Tiered Management Interventions in a Fisheries Context (Auster, 2001)
Level of Response Degree of Uncertainty Example of Management Action
Preventive Approach
Low levels of uncertainty as to the impactsof an activity (e.g., use of a given type ofgear); the structure and function of ahabitat and species is well understood
Restrict use of gear; or take action tominimize the effects of such gear on habitat
Corrective Approach
Low levels of uncertainty, but unforeseenimpacts of management action taken inprevious preventive phase have occurred
Fine tune preventive actions, as, for example,adjusting boundaries or changingmanagement based on habitat recovery dataand population dynamics
PrecautionaryApproach
Moderate to high uncertainty, and fullreversibility of activity is not ensured; littleis known of the linkages between habitatand species
Designate ‘no-take’ protected areas coveringhabitat of long-lived and sensitive species
PrecautionaryPrinciple
Very high uncertainty; potential forirreversible damage is high; least is knownabout the ecosystem
Set up protected areas of at least 20% of thearea ensuring a representative sample of allpossible types of habitats is included
Figure 6 is a decision diagram (see next page) illustrating how a combination ofapproaches could work. The decision tree begins with preliminary indicator values(quantified if possible, and selected as described earlier) that describe themanagement objectives (which are concrete statements defining the goals) for aspecific geographic location. The goals, objectives and indicator values aredetermined in consultation among stakeholders. These then perform the functionof socially-determined thresholds.
The next step is to ask whether a low level of uncertainty prevails — if it does, thena series of progressively stringent measures is prescribed to achieve the thresholds.Conditions are monitored, and, if adverse conditions persist, managementintervenes and/or re-examines and adapts the indicators.
The loop continues until either the situation is corrected or higher degrees ofuncertainty are encountered.
In the event that a high or very high level of uncertainty prevails at any stage, thenmanagement actions are prescribed using the Precautionary Approach or Principle,as appropriate. Over time, as more research and data accumulate, the generallevels of uncertainty will decrease, and fewer management interventions will requirethese precautionary levels of response.

Carrying Capacity and Thresholds: Page Theory and Practice in Environmental Management
33
Are preliminary indicator values (management
objectives) equaled or exceeded in the
habitat management area? Preventive Approach
(institute 1st level of prescribed measures to
address immediate situation)NO
YES
No action
Low level of Uncertainty?
NODo exceedances
persist?
YES
Low level of Uncertainty?
Corrective Approach (progressively stringent prescribed measures to correct situation or
adapt indicators)YES
NO
Precautionary Approach
Precautionary Principle
Very High Level of Uncertainty
High Level of Uncertainty
NO
Figure 6: Tiered Management Decision Diagram
The result is a management approach that applies socially-determined thresholdswithin a framework that recognizes different levels of uncertainty. This approachhas the virtue of being pragmatic. It begins to take effective action, uses theinformation available and relies on consensus value judgements to ensure thatinterventions are principled and that public interests are balanced. From acumulative effects assessment perspective, the socially-determined thresholds canhelp to establish the significance of proposed developments. Most CEAs currentlyspend considerable time identifying issues and socially important values, project byproject. The recommended management approach will provide an overallframework within which CEAs can fine tune project-specific criteria.

Carrying Capacity and Thresholds: Page Theory and Practice in Environmental Management
34
It must be noted that the tiered management approach will only truly succeed if aconcerted effort is made, over the next several years, to collect meaningful data(see section 6.0) and to refine indicators on the basis of observed phenomena andscientific expertise. The ultimate goal is to define thresholds that work given a fullunderstanding of the complexities of northern natural systems. Human activities willinevitably continue in the meantime, however. Rather than lose valued cultural,economic and ecological resources by default, some management interventionsmust be undertaken now. The suggested approach provides the basis for thoughtfulaction.
5.2 NWT’s Integrated Management System
The previous sections of the report have discussed how principles of carryingcapacity and thresholds can be integrated into the management cycle. The LACmodel incorporates the basic premise that there are limits to acceptable change, butavoids mechanistic applications of the carrying capacity approach. Managementgoals and objectives are set within this framework, using socially-determinedthresholds that combine the best available ecological knowledge with socio-economic value judgements. Implementation builds in a respect for levels ofuncertainty through a tiered management approach. The next logical question in thesequence is: who is responsible for taking action?
Throughout the discussion so far, an underlying image of ‘one mind, many hands’has been assumed for management — as if it were a single entity capable ofundertaking a broad set of functions. That is patently not the situation in the NWT,where a multiplicity of governments and their agencies share authority.Collaboration and cooperative arrangements between these entities will benecessary to effect a seamless management system in the territory. Fortunately,the LAC model not only accommodates multi-stakeholder participation, it relies onit.
The Mackenzie Valley Resource Management Act, (MVRMA) establishes someinterconnections between a number of agencies. It is based on the Gwich’in andSahtu land claim agreements and applies to the Mackenzie Valley region south ofthe Inuvialuit Settlement Region (ISR), not including Wood Buffalo National Park.The Inuvialuit Final Agreement (IFA) governs arrangements in the ISR. Asdescribed in CIRL (Framework) 2001, five components of an integrated frameworkfor environmental and resource management are established in whole or in partunder the MVRMA and the IFA:
1. land-use policy and planning;2. rights issuance;3. project review;4. regulation; and5. feedback and decision support mechanisms.
A number of other statutes also authorize various territorial and federal departmentsand agencies to exercise functions along this “decision-making continuum” (forexample, NWT’s Resource, Wildlife and Economic Development Department(RWED), the federal Department of Fisheries and Oceans (DFO) and the NationalEnergy Board (NEB)).

Carrying Capacity and Thresholds: Page Theory and Practice in Environmental Management
35
In its framework paper, CIRL primarily focused attention on decision-making pointsalong the continuum rather than on operational details of the overall managementsystem, and then concentrated on institutional issues related to feedback anddecision support mechanisms in two companion papers. Roles, responsibilities andother arrangements regarding the regional authority referred to in section 146 of theMVRMA are discussed at length in CIRL (2001a) and CIRL (2001b).
The Institute has reviewed these three papers, together with the MVRMA, the IFA,and the two environmental agreements signed by Diavik Diamond Mines Inc. andBHP, respectively. In addition, several other statutory instruments were subjectedto a cursory review. It is the Institute’s opinion that CIRL’s proposed environmentalmanagement approach can be applied in the context of NWT’s integrated resourcemanagement system. However, five points highlight the need for coordination andcollaboration between government departments, agencies and other entities in orderfor true integration to occur.
1. Management is continuous (Figure 3, page 8 above)
Figure 3 on page 8 illustrates the fact that environmental management is acontinuous process. Decision points intervene in this cycle from time to time, butmanagement functions are being undertaken at all times throughout allorganizational levels. To be effective, organizations need to align operationalactivities with others (reducing the incidence of counter-productivity), and designprocedures so that staff can proceed reasonably efficiently (reducing the incidenceof corrective action). This is true whether addressing a single organization or many,although it becomes more critical if the benefits of an integrated managementsystem are to be realized at a regional level.
2. Goals and objectives drive the system
Activities and procedures are aligned by reference to organizational goals andobjectives. Goals and objectives drive the whole management system. Effectiveregional integration will require that all organizations adopt the same or substantiallysimilar goals and objectives. If, for example, a threshold of fewer than two caribouper square kilometer is adopted by RWED, but not by the Mackenzie Valley Landand Water Board, permits may issue and development proceed in a way thatfrustrates the ongoing efforts of wildlife managers. Also, a patchwork of rules acrossthe region may lead to a ‘race to the bottom’. Assuming resources are available atmore than one location, most resource users, whether recreational or industrial,prefer to operate in the area with the least stringent standards.
3. Compliance requires standards
Who will pull the trigger? Someone has to say ‘stop’ when activities are causingunacceptable impacts. Inspectors need a reasonably clear target in order to detectnon-compliance. They also need to have enforceable standards before they canissue ‘cease and desist’ orders. Rules must be set, and enforcement agencies givenauthority to apply penalties in the event of non-compliance. Such authority currentlyexists specifically for standards established in regulations and land-use plans, andmore generally for standards established in terms and conditions of licences,permits and the like.
Carrying Capacity and Thresholds: Page Theory and Practice in Environmental Management
36
CIRL (Institutional) has pointed out the desirability of leaving operational decisionsunspecified in regulations creating a meta-modeling agency. The same cannot besaid of standards. However, many of the socially-determined thresholds adoptedunder the LAC approach are not sufficiently crystallized to enshrine them inlegislation. Therefore, authority must be created by other means. Stipulating thethresholds in terms and conditions attached to permits would be effective, as wouldministerial direction regarding Environmental Management Plans under the BHPand Diavik Environmental Agreements. Including them in land-use plans will alsoensure enforceability (Donihee et al, 2000).
Tribunals such as the NEB and the MVEIRB typically recommend terms andconditions on which permits should be granted, but they are not allowed to fettertheir discretion in the process of making decisions. Essentially their task is todetermine whether a proposed project is in the public interest. The test for theMVEIRB’s decisions is whether the development is “likely in its opinion to have anysignificant adverse impact on the environment or to be a cause of significant publicconcern.” In forming its opinion, the board must give fair and due consideration toall relevant factors, and not merely rubber stamp applications according to somepre-determined formula (i.e., fetter its discretion). This constraint does not arise inthe case of legislated standards, because tribunals are required to apply the law asit exists in statutes and regulations.
Adopting guidelines or policies is more problematic, however. The guidelines orpolicies must be positioned as factors that the boards will take into consideration,rather than as foregone conclusions. Given this limitation, it is more effective toenshrine standards (socially-determined thresholds) in the operating manuals andland-use plans administered by permit granting agencies. Knowing that permits willbe granted only if certain thresholds are not exceeded, the tribunals can adopt thethresholds as a measure of significance when assessing predicted impacts. LACcan play a strong role in helping to determine significance, since it sets thresholds.
4. Compliance monitoring is driven by licence conditions
Monitoring for compliance purposes needs to be differentiated from monitoring forstate of the environment reports. The first is driven by licence conditions, thesecond by a broader set of ecological parameters. To align the two activities, it isessential that terms and conditions attached to permits, licences and the diamondmine environmental agreements be congruent with overall management goals andobjectives, and that project-specific performance standards be established on thebasis of the same indicators and thresholds that are used to measure progress inachieving the goals and objectives.
It should be noted that the essential purpose of the Independent EnvironmentalMonitoring Agency (IEMA) and the Diavik Monitoring Advisory Board is that of awatchdog — to see that compliance occurs; they are effectively limited tooverseeing project-specific activities outlined in operating licences. Nevertheless,their mandates are more broadly stated and so the monitoring agencies enjoy somelatitude in their advisory roles. For example, the IEMA is given the task of providing“an integrated approach to achieve the purposes in Article 1" of the EnvironmentalAgreement, of which there are five:

Carrying Capacity and Thresholds: Page Theory and Practice in Environmental Management
37
1. to respect and protect land, water and wildlife and the land-basedeconomy, essential to the way of life and well-being of the AboriginalPeoples;
2. to facilitate the use of holistic and ecosystem-based approaches forthe management and regulation of the Project;
3. to provide advice to BHP to assist BHP in managing the Projectconsistent with these purposes;
4. to maximize the effectiveness and co-ordination of environmentalmonitoring and regulation of the Project; and
5. to facilitate effective participation of the Aboriginal Peoples and thegeneral public in the achievement of the above purposes.
The monitoring agencies may therefore advise signatories to the Agreement thatcorporate monitoring programs are not (for example) achieving the ecosystem-based (LAC) approach adopted across the region, but they can neither oblige thecorporations to institute new or different monitoring programs nor can they imposenew or different performance standards on the corporations. Only permit grantingentities and the federal Minister have the authority to demand revisions orreplacement to Environmental Management Plans and licences.
5. The responsible authority is a monitoring agency (MVRMA, section 146)
The responsible authority envisioned by section 146 of the MVRMA will be, whenall is said and done, a monitoring agency. Its mandate is to “analyze data ... for thepurpose of monitoring the cumulative impact on the environment of concurrent andsequential uses of land and water and deposits of waste in the Mackenzie Valley.“Its role is not to set management goals, objectives, and performance standards, butto act as a watchdog. It cannot, therefore, be used as a substitute for management,although it can play a very useful role as a “hub for cumulative effects monitoringand research, coordinating and consolidating existing initiatives” (CIRL(Regulations)). However, the key to integrating the principles of carrying capacityand thresholds into cumulative effects assessment and management in Canada’sNorth is to coordinate goals and objectives adopted by the various standard settingand permit issuing agencies across the region (see point 2 above).
As CIRL has rightly pointed out, monitoring activities are key decision supportmechanisms, and it is necessary to ensure that data provide information which isdirectly relevant to goals and objectives. The monitoring agenda is thus effectivelyset by management in the course of setting its goals and objectives and establishingindicators and thresholds by which to measure attainment of the desired outcomes.The suggestion that the section 146 responsible authority be created as apartnership entity will help to ensure that the meta-monitoring agency is“institutionally connected to all of the key decision makers and stakeholders” CIRL(Institutional) such that the agency’s activities can be focused on delivering data thatwill provide managers with meaningful feedback on their implementation activities.

Carrying Capacity and Thresholds: Page Theory and Practice in Environmental Management
38
5.3 Examples of Implementation Elsewhere
The Institute searched for cases that encompass a regional scope, adopt relativelybroad ecological goals incorporating the concepts of carrying capacity andthresholds, and are actually being implemented. Although the literature aboundswith theoretical frameworks for integrated resource management or sustainabledevelopment, few well documented cases of actual implementation are available.Only two cases meeting the selection criteria were identified — the Lake TahoeRegional Plan and the Chesapeake Bay Agreement. No regional case study wasfound that applied solely to terrestrial ecoregions. Other programs mainlyaddressed recreation, tourism and range management. These programs tend to belocal and quite narrowly focused. They were deemed relevant to the extent thatthey provided useful illustrations of thresholds or process, but were not included inthe case studies.
In addition to the two case studies mentioned above, Alberta’s Regional SustainableDevelopment Strategy (RSDS) was reviewed (see below, at page 43) because itprimarily relates to a terrestrial landscape. However, the RSDS does notincorporate the concept of carrying capacity, and has yet to set thresholds fornonchemical stressors.
Lake Tahoe Regional Plan
Lake Tahoe’s Regional Plan (Lake Tahoe, 2001) covers about 501 square miles,including the waters of Lake Tahoe which measure 191 square miles. Thefoundation for the Plan dates back to 1979 when the Western Federal RegionalCouncil (Council) produced the Lake Tahoe Environmental Assessment. TheAssessment analyzed impacts of development on the Basin ecosystem and maderecommendations for addressing its environmental concerns. To manage theenvironmental threats facing Lake Tahoe, the Council recommended adoption ofenvironmental threshold standards and associated carrying capacities.
The recommendations of the Council were incorporated first into state law and theninto federal law (Tahoe Regional Planning Compact , Public Law 96-551) in 1980,which made extensive amendments to the original 1969 Compact that created theTahoe Region Planning Association (TRPA). The Compact directs the TRPA todevelop a regional plan that “…achieves and maintains the adopted environmentalthreshold carrying capacities.” It also stipulates that “[the] regional plan shall consistof a diagram, or diagrams, and text, or texts setting forth the projects and proposalsfor implementation of the regional plan, a description of needs and goals of theregion and a statement of the policies, standards and elements of the regional plan.”
In 1982, TRPA, in cooperation with the States of California and Nevada, federalgovernment representatives, the scientific community and local stakeholders,established threshold standards for nine categories of values considered unique to,and desirable to sustain for, the Lake Tahoe Basin.
In 1996, TRPA reviewed the environmental thresholds to determine whetherimplementation of its Regional Plan was effective in restoring and maintaining thethresholds. The Environmental Improvement Program (EIP), intended to fosterimplementation of the Regional Plan by defining restoration needs for thresholdattainment, mobilizing resources to do it, and focusing stakeholder action, wasreviewed, revised and a 20 year implementation time frame was prescribed (1996 -2016).

Carrying Capacity and Thresholds: Page Theory and Practice in Environmental Management
39
Thresholds incorporated in the Regional Plan generally relate to limits to acceptablechange, although many of them are based on available standards (e.g., scientificcriteria developed for drinking water or air quality). The initial thresholds weredeveloped based on input from stakeholder groups which included government,researchers and community members. The stakeholders identified resources orcharacteristics of the environment that they wanted to preserve and establishedthresholds and policy/ management actions related to those resources orcharacteristics. Examples are presented below (Table 10).
Stakeholder groups were further convened to identify research and capitalimprovement projects intended to meet the threshold criteria. The TRPA thenundertook to prioritize EIP components. Prioritization was based on bestprofessional judgement and opportunity, scientific evidence and monitoring results.The TRPA also established a Science Advisory Group (SAG) to develop a researchagenda for the basin related to key management questions associated with researchand monitoring. SAG ranked science projects as critical, important or needed.Program needs for implementation of the EIP were also identified through theprocess, including regulatory changes and Best Management Practices.
Table 10: Sample Thresholds and Management Policies related to Fisheries (Lake Tahoe Regional Plan)
Threshold Management Policy
Stream habitat: 75 miles rated excellent; 105 miles rated good; and 38 miles rated marginal
Unnatural blockages and other impediments to fish movementwill be prohibited and removed wherever appropriate
Support, in response to justifiable evidence, state and federalefforts to reintroduce Lahontan cutthroat trout in appropriateremote locations
Existing points of water diversion from streams shall betransferred to the Lake whenever feasible to help protect in-stream beneficial uses
Until instream flow standards areestablished, a nondegradation standardshall apply to in-stream flows
In-stream flows shall be regulated, when feasible, to maintainfishery values
An in-stream maintenance program should be developed andimplemented. In-stream monitoring could include an inventoryand removal program for undesirable debris build-up in thestream channel
Lake habitat:The equivalent of 5,948 total acres ofexcellent habitat in Lake Tahoe
The water level in Lake Tahoe should be controlled to reflectconditions that might be expected with seasonal weather andwater runoff patterns
Habitat improvement projects are acceptable practices instreams and lakes
Notes to Table 10:1. The Compact defined environmental threshold carrying capacity (ETCC) as “an
environmental standard necessary to maintain a significant scenic, recreational,educational, scientific or natural value of the region or to maintain public health andsafety within the region.
2. In 1982, the Compact adopted ETCCs in several areas such as air and water quality, conservation of soiland vegetation, and noise. In 1996, further ETCCs were identified, including fisheries, wildlife resources,scenic resources/community design and recreation.

Carrying Capacity and Thresholds: Page Theory and Practice in Environmental Management
40
The TRPA has integrated its thresholds into all five elements of its Regional Plan(see earlier discussion at pages 20 and 21). The thresholds constitute the firsthurdle for proposed new developments — applications are processed by the usualpermit-granting agencies only if they are consistent with the thresholds.
The Lake Tahoe Region has also introduced mandatory program evaluations byprescribing that all elements of the Regional Plan and all ETCCs are to be reviewedevery five years. They are, of course, evaluated in terms of progress towardsachieving the management goals and objectives.
The most recent review and updated EIP were made public in 2001. It concludedthat objectives were achieved in several areas, but not all. Recommendations forimproving the process and implementation of the Environmental ImprovementProgram stated that government, research and community stakeholders should
• agree on how to accomplish EIP implementation;
• develop a common language for the EIP (for example, no twoorganizations have the same budget authorities and typically havedifferent references for terms such as capital projects. Having acommon understanding of EIP terminology is important for movingthe EIP agenda forward and for executing internal direction);
• ensure that all levels of an organization understand the goals of theEIP and are actively aligning their operations to implement it;
• gain an understanding not only of their own operations, but also ofthose of other organizations, including budgets, missions, cultures,calendars and the like; and
• develop, support and maintain a regional information system.
In conclusion, notable features of the Lake Tahoe approach include the explicit useand application of environmental thresholds; its evaluation framework for projectsin the region as they relate to management goals and objectives; and in thecomprehensiveness of its evaluation framework. In addition, the program appearsto be successful in terms of incorporating the input of stakeholders, including severallevels of government. It should also be noted that implementing socially-determinedthresholds in management functions is mandated by a law (the Compact) that bindsall stakeholders in the Lake Tahoe Region.
The Lake Tahoe Region has taken a proactive approach to environmentalmanagement by acting to establish thresholds and management actions even whenthere is little information available. The research and monitoring/ evaluation programis intended to address those uncertainties. This approach may represent adaptivemanagement at its best. The program also includes measures in urban areas.
The program does not explicitly deal with issues of scale; however, thresholds areestablished at various scales ranging from a particular species to theregional/landscape level. The scale of the program does not go beyond the LakeTahoe Region and does not consider the more complex aspects of ecosystemssuch as overall health or integrity. However, it is an excellent model for practicalaction to assess, track and manage cumulative effects.

Carrying Capacity and Thresholds: Page Theory and Practice in Environmental Management
41
Chesapeake Bay Agreement
In 1983, 1987, and again in 2000, the US EPA, State of Maryland, theCommonwealths of Pennsylvania and Virginia, and the District of Columbia signedChesapeake Bay Agreements in recognition of the decline in “living resources” inthe Bay. The 1983 agreement called for the establishment of a ChesapeakeExecutive Council (the governors of Maryland, Virginia and Pennsylvania, the mayorof the District of Columbia, and the chairman of the Chesapeake Bay Commission)to oversee implementation of a coordinated plan to improve and protect the waterquality and living resources of the Chesapeake Bay estuarine system. The councilestablished an implementation committee of agency representatives to coordinatetechnical matters and develop and evaluate management plans.
The US federal Clean Water Act requires states to develop clean up plans forwaters that fail to meet national water quality standards. The Chesapeake Bay wasplaced on the impaired waters list and was therefore required to develop a clean upplan by 2011. However, the Chesapeake Executive Council decided to initiate actionto clean up the Bay before 2011, which gave them more flexibility in determiningcleanup criteria and processes (Blankenship, 2001). The 2000 ChesapeakeAgreement was developed to meet this goal; its overall goal is stated as follows:
... to correct the nutrient and sediment related problems in the ChesapeakeBay and its tidal tributaries sufficiently to remove the Bay and its tributariesfrom the list of impaired waters.
The Chesapeake Bay Agreement does not refer to limits of acceptable change, butit does incorporate the LAC approach implicitly. Several documents recognize thatthe Bay will never be pristine given the 15 million people currently living in itswatershed. Issue-specific objectives (related to resources such as land use, waterprotection and quality and vital habitat) are also described with reference toecological conditions that take human activities into account. For example, underthe headings “Vital Habitat Protection and Restoration” and “Shallow Water”,respectively, the following objectives are described:
• Achieve a no net loss of existing wetlands acreage; and, by 2010,achieve a net resource gain by restoring 25,000 acres of tidal andnon-tidal wetlands.
• To promote the growth of balanced native populations ofecologically, recreationally and commercially important shell fish andunderwater grasses.
The 2000 Agreement outlines 93 commitments detailing protection and restorationgoals critical to the health of the Bay watershed. It also calls for a revised processthat establishes new objectives to achieve water quality conditions that protectaquatic resources,”instead of measuring improvement against broad percentagereduction goals”. The revised process will incorporate elements traditionally foundin the existing regulatory regime “such as criteria, standards and load allocations”,but will be developed and applied through a “cooperative process involving sixstates, the District of Columbia, local governments and involved citizens.“ The intentis to develop standards that apply specifically to the Bay area and are designed withparticular environmental receptors in mind.

Carrying Capacity and Thresholds: Page Theory and Practice in Environmental Management
42
The Chesapeake Bay Program has organized a number of subcommittees that workon components such as water quality, air, nutrients, toxics, monitoring, modelling,living resources, land growth and stewardship, and communications and education.These committees are responsible for coordinating and summarizing the researchrelated to developing new standards for environmental quality in the Bay area.
Work on the new standards is ongoing and the standards are expected to befinalized in the next few months. For instance, the water quality subcommittee hascreated five zones in the Bay (shallow water, open water, spawning and nurseryareas, deep water and deep channel) according to the types of species that inhabiteach area. An objective, termed “Designated Use”, is articulated for each zone andrepresentative species/communities are enumerated, together with critical supportcommunities. Three criteria are being used as the basis for the standards (waterclarity, dissolved oxygen and chlorophyll a) since the Bay’s main water qualityimpairment is its low dissolved oxygen.
Standards are being specified for use in an integrated management system. Nosingle standard is expected to apply throughout the whole Bay area, and prescribedthresholds will vary from site to site, and season to season, to recognize bothnatural conditions and sensitive stages in species’ life cycles. Finally, “Cap LoadAllocations” (maximum amounts of pollutants allowed to flow into a waterbody andstill achieve the water quality standards) are assigned to the nine major tributarybasins in the watershed, and to 37 sub-basins. Each state and the District will beara proportional burden for achieving and maintaining the cap based on their pollutantloadings and effects on different tributaries.
The Chesapeake Bay Program devotes considerable resources to monitoring andresearch, capacity building and implementation of management activities. It alsosponsors a Citizens Monitoring Program. Over 300 non-governmental organizationsare said to be involved in various conservation activities in the Bay watershed area.For example, the Maryland Stream Waders is a volunteer stream samplingendeavour underwritten by the state. The aim is to increase the average numberof sampling sites per medium sized watershed from 7 to more than 50 locations.Samples are sent to the Department of Natural Resources for analysis, and the dataare incorporated with other monitoring feedback mechanisms. The EPA supportsthese citizen action groups by providing information bulletins, managing anelectronic bulletin board, convening conferences and publishing ‘how to’ manuals.
In summary, the Chesapeake Bay Program includes objectives that describeoutcomes in terms of acceptable environmental, social and economic outcomes;involves a host of stakeholders, including several levels of government in differentjurisdictions; and is taking a proactive approach to environmental management byacting to establish thresholds and management actions pending precise scientificformulations. Although the Program does not deal overtly with issues of hierarchyand scale or more complex ideas like ecosystem integrity, it does encompass theentire watershed and has moved to a results-oriented approach that takes variousecological dimensions into account.

Carrying Capacity and Thresholds: Page Theory and Practice in Environmental Management
43
Regional Sustainable Development Strategy (Alberta)
The Regional Sustainable Development Strategy (RSDS) focuses on the AthabascaOil Sands region in northeastern Alberta. In September 1998, Alberta Environmentcommitted to taking a lead role in developing a strategy for this region, inpartnership with regional stakeholders and regulators. Participants in the RSDSinclude First Nations and Aboriginal communities, industry, and ENGOs. In addition,several Alberta, Saskatchewan, municipal and federal government agencies anddepartments that deliver services and regulate activities in the region are included.
The RSDS explicitly states that “it provides a framework for balancing developmentwith environmental protection”. Alberta’s Commitment to Sustainable Resource andEnvironmental Management (March 1999) provides overall direction for the RSDS.Five principles are laid out in the Commitment document and quoted in Section 1of the RSDS:
• The use of Alberta’s natural resources shall be sustainable.
• The management of Alberta’s natural resources shall support and
promote the Alberta economy.
• Alberta’s environment shall be protected.
• Resources shall be managed on an integrated basis.
• Alberta’s natural resources shall be managed for multiple benefits.
The focus of the RSDS is to “address the need to balance resource developmentand environmental protection.” The Strategy itself adopted four principles:
• The environment will be protected.
• Resources will be managed effectively.
• Learning will continue.
• Stewardship will be shared.
The first step in developing the RSDS was issue identification. Meetings were heldwith industry, First Nations and Aboriginal Communities, “special interest groups”and various government agencies. A list of 72 issues “of sufficient concern to beaddressed through the RSDS” was compiled. The issues were then grouped into14 themes and categorized according to information gaps, urgency and whetherwork is underway on the issues, as follows (RSDS, page 11):
Category A (Based on information gaps and urgency; some work is underway)
1. Sustainable ecosystems and land-use
2. Cumulative impacts on wildlife
3. Soil and plant species diversity
4. Effects of air emissions on human health, wildlife and vegetation
5. Bioaccumulation of heavy metals

Carrying Capacity and Thresholds: Page Theory and Practice in Environmental Management
44
Category B(Based on information gaps; work is underway)
6. Access management
7. Cumulative impacts on fish habitat and populations
8. Effects of tailings pond emissions
9. Effects of acid deposition on sensitive receptors
10. Impacts on surface water quality
Category C(Based on information gaps; work is underway; less urgency)
11. End pit lake water quality
12. Impacts on surface water quantity
13. Impacts on groundwater quantity
14. Impacts on groundwater quality
The intent is to devote more effort to Category A themes during the first three yearperiod, and then to pay progressively more attention to issues falling withinCategories B and C. After five years, the overall success in resolving issues in thethree categories will be evaluated, and a new “blueprint for action” will bedeveloped. Funding is provided by industry and government and covers multi-stakeholder forums, research, monitoring and reporting programs, and managementactions in the region.
In July 2001, RSDS issued a Progress Report. Among other developments, aCumulative Environmental Management Association (CEMA) had been formed anddesignated as Alberta Environment’s partner in implementing the Strategy. CEMAis a multi-party group with representatives from industry, governments, localcommunities and ENGOs. CEMA uses consensus-based decision-making. It hasformed five working groups (NOx/SO2 Management; Sustainable Ecosystems; TraceMetals and Air Contaminants; Water; and Reclamation). In addition, CEMA hasthree active standing committees (Traditional Environmental Knowledge;Communications; and Funding). Funding is primarily provided by industry, while thegovernment, aboriginal communities and ENGOs support CEMA with in-kindcontributions. The budget for 2001 was approximately $3 million.
A Regional Information System is being developed by a group organised andhoused by Alberta Environment, and supports CEMA’s activities. Regionalmonitoring groups also have a role to play. The Wood Buffalo EnvironmentalAssociation is in charge of a community-driven monitoring program that measuresambient air quality at 11 monitoring stations. It also participates in the TerrestrialEnvironmental Effects Monitoring Program, which monitors soil acidification, tracemetals in foods harvested locally, vegetation stress and changes in response tonitrogen deposition.
The RSDS has adopted a “continuous improvement management model” (Figure7). The model starts with defining goals, and proceeds through managementobjectives, management options, system operation, and system evaluation until itreturns to objectives and begins the cycle once again.

Carrying Capacity and Thresholds: Page Theory and Practice in Environmental Management
45
Goals
System Evaluation
Management Objectives
System Operation
Management Options
Information
Figure 7: RSDS Management Model
Goals are described as “the ends to be achieved”, and are considered on a regionalscale. Management objectives are quantified expressions of the goals.Management options constitute means applied to achieve the objectives. Systemoperation entails specific mechanisms and actions needed to apply managementoptions. Assessment of success in achieving goals and objectives is carried out atthe system evaluation phase of the cycle. Throughout each phase, informationprovides ongoing support to the management system.
As one would expect in an evolving management system, issues and approachesare being clarified as time goes on. The Progress Report (2001), for instance, hasrefined the Strategy’s definition of objectives, by saying that an objective is
the desired level of an indicator. This is a specific, numerical target that isselected with consideration for both environmental capacity or thresholds(based on science and traditional environmental knowledge), as well associo-economic values and desires.
Two management objectives are then presented by way of illustration with thecaveat that “the numerical objectives presented do not represent real information”.CEMA’s five Working Groups are reported to be in various stages of identifyingappropriate indicators and stipulating targets for adoption as managementobjectives.
RSDS has published a timeline for each of its working groups in the ProgressReport (2001).
Figure 8: RSDS Timeline Legend
Working Group 2000 2001 2002 2003 Goals
Sustainable Ecosystems Indicators /Data Collection
Trace Metals & Air Contaminants Mgt.objectives
NOx / SO2 Management / Management tools
Water System Operation
Reclamation System Evaluation /

Carrying Capacity and Thresholds: Page Theory and Practice in Environmental Management
46
The RSDS envisions a tiered management approach at the management options phase. Particulartypes of management activity are proposed for each of three levels of environmental stress: critical,target and cautionary. The critical level is reached when an ecosystem experiences the maximumcontinuous amount of stress it can support without resulting in long-term environmental damage.At this level, a “Response Management” would include a stakeholder-derived response strategyand mandated regulatory action. The target level is the management objective for the amount ofstress on an ecosystem. Management would, at this level, adopt an “Issue Resolution” posture.The cautionary level is taken to require additional monitoring to ensure that stresses do not exceedtargets, and a continuous improvement response would be expected of management.
5.3.1 Summary of Case Studies
Highlights from the Lake Tahoe and Chesapeake Bay case studies include the following:
1. Coordination and collaboration between a range of permit granting and standardsetting agencies is necessary to achieve effective integration of carrying capacityand thresholds principles across a region;
2. Goals and objectives drive the integrated management system, and therefore seniormanagement participation is required to implement the carrying capacity andthresholds principles;
3. The goals and objectives primarily describe outcomes in terms of desired ecologicaland social conditions;
4. Socially-determined thresholds are used in the absence of precise scientificformulae, and therefore stakeholder participation is a pre-requisite for selectingindicators and determining which indicator values will be used to set standards;
5. Management actions are explicitly described in terms of the selected indicators andthresholds;
6. Implementation includes adoption of the thresholds as standards for assessingproposed new developments in programs such as land-use approvals,environmental impact assessments, transportation plans, capital improvementfunding and recreational use or facilities;
7. Monitoring programs are designed after indicators and thresholds are selected, sothat directly relevant data are collected and analyzed; and
8. Implementation is scheduled over a sufficiently long time frame to allow continuedrefinement of management goals and activities in the light of continuous feedbackand the development of more precise thresholds.
Although LAC has been applied primarily to aquatic ecoregions in these two case studies, thelessons to be learned from studying the process applied in these cases are transferable toCanada’s North. Much the same point can be made regarding the levels of disturbance involvedin the Lake Tahoe, Chesapeake Bay and Alberta’s RSDS situations. Again the process precedentscan be applied in Canada’s North, notwithstanding the fact that disturbance levels are generallymuch lower there.

Carrying Capacity and Thresholds: Page Theory and Practice in Environmental Management
47
6.0 MONITORING RESULTS
Monitoring and evaluation comprise the third stage of the management cycle. The Auditor Generalof Canada has pointed out that “for results-based management to function as intended, emphasisshould be given to identifying targets and performance standards. It is difficult to judge whetherresults are improving if one has no reference point against which to compare.” (Auditor General,2000) Results must be reported in a credible fashion, and relate directly to overall managementgoals. This aspect of the management cycle is imperative for effective management in any context;it is absolutely crucial as a necessary underpinning of adaptive management regimes in general,and LAC approaches in particular.
Distinguishing what is important to measure would be an impossible task without specific goals andobjectives to guide the process. The natural world is filled with a bewildering array of activity,ecological conditions naturally change from year to year, and natural disturbance regimes such asinsect outbreaks, fires and floods greatly obfuscate the origin of environmental stresses. Choosingwhat to measure is addressed in section 6.1, which includes a discussion of various criteria forindicators, a look at valued ecosystem and socio-economic components (VECs and VSCs), anda sample of indicators organized according to the matrix (Figure 12). Tools for measuring data arebriefly reviewed in section 6.2. NWT monitoring programs are surveyed in section 6.3.
6.1 Choosing What to Measure
The selection of indicators takes place before monitoring programs are put into place. It is in factthe third step in the LAC approach (after issue identification and definition of opportunity classes),because indicators help to “objectify” and bring clarity to overall management goals (see earlierdiscussion in section 4.1). Indicators can perform well or poorly as barometers of performance,depending upon how effective they are in capturing essential information needed to portray results.The classic example of poorly chosen indicators arose in the context of training programs, whichfor years measured throughputs rather than outcomes. The number of persons attending courseswas taken as an indicator of success. The number of persons getting value for their training (oftenmeasured in terms of individuals finding jobs in the occupation for which they were trained) wasignored. Ultimately, under serious questioning about the utility of such programs, results-orientedindicators were adopted and have since provided managers with reliable information against whichto judge their progress towards achieving organizational goals.
Criteria for Reliable Indicators
The literature is full of suggestions for criteria by which to judge whether an indicator will performas a reliable barometer of results. Table 11 is a digest of criteria, and reflects recommendationsfound in Noss and Cooperrider, 1994; Bruns et al., 1992; Udo de Haes et al., 1991; Kelly andHarwell, 1990; Rapport, 1990; Liverman et al., 1988; Schaeffer et al., 1988; and Herricks andSchaeffer, 1985.

Carrying Capacity and Thresholds: Page Theory and Practice in Environmental Management
48
Table 11: A Digest of Criteria for Reliable Ecological Indicators
Number Criterion
1 Directly representative of the results which management goals areaiming to achieve
2 Easy to monitor and relatively simple to measure and interpret
3 Cost effective
4 Easily comprehended by non-scientists
5 Not dependent on the presence, absence or condition of a singlespecies
6 Sensitive to ecological conditions being monitored; capable of both a) registering small magnitude changes; and b) a range of responses that will allow differentiation of effect from consequences
7 Predictable; accurate within a low range of measurement variability
8 Integrative; related and hierarchically appropriate for use inecosystems
9 Taken as a suite, indicative of overall ecological conditions
Griffith (1998) has pointed out that two desirable properties of good indicators — (a)sensitivity to a variety of stressors, and (b) predictability in undisturbed ecosystems— can sometimes be contradictory. This observation may be particularly true in theNWT where sensitive parameters often show a degree of unpredictable variabilitywhich is typical of the Canadian northern climate.
Valued Ecosystem and Socio-economic Components (VECs and VSCs)
A VEC is any part of the environment that is considered important by the proponent,public, scientists or government involved in an assessment process. Importancemay be determined on the basis of cultural values or scientific concern (EnvironmentCanada, 2001a). Similarly, a VSC is any part of the cultural or economic domain thatis considered important by the proponent, public, scientists or government involvedin an assessment process. A term related to VEC is “indicator species”, whichmeans a single species whose responses to various stressors are used asindicators of environmental conditions. VECs and VSCs are not indicators. “Strictlyspeaking, a VEC is a particular component of the environment whereas an indicatoris a parameter or measure of project effects on that component.” (Macleod Institute,1998)
A criticism of VECs and VSCs in planning processes has been that they focusdiscussion and monitoring on charismatic fauna and not on what should bemonitored to maintain ecological sustainability over time. Noss (1990) hassummarized a number of intellectual shortcomings encountered in the use ofindicator species:

Carrying Capacity and Thresholds: Page Theory and Practice in Environmental Management
49
The use of indicator species to monitor or assess environmentalconditions is a firmly established tradition in ecology, environmentaltoxicology, pollution control, agriculture, forestry, and wildlife andrange management. But this tradition has encountered manyconceptual and procedural problems. In toxicity testing, for example,the usual assumption that responses at higher levels of biologicalorganization can be predicted by single-species toxicity tests is notsupportable. ... Recent criticisms of the use and even the concept ofindicator species are valid. Indicator species often have told us littleabout overall environmental trends, and may even have deluded usinto thinking that all is well with an environment simply because anindicator is thriving.
However, Noss concludes by recommending that a suite of indicators be used toreflect multiple dimensions of the natural system at various spatial scales. Providedthat indicator species are chosen for valid reasons (other than charismatic charm),they may provide useful information as one data stream amongst many.
A Suite of Indicators
Table 12 provides a sample of indicators which, taken together as Noss and othershave suggested, provide a comprehensive barometer for multi-dimensional naturalsystems. This table mirrors Tables 2 and 3, which respectively illustrated typicalcharacteristics and desired outcomes for a multi-dimensional natural system. Theindicators listed in Table 12 provide a comprehensive set of nonchemical indicators,but the table is not intended to be an exhaustive compilation.
Table 12: Sample Indicators for a Multi-dimensional Natural System
Regional/Landscape
Large scale spatial contextdefined by many types ofhabitat - the full extent is
defined by the researcher &is usually $1,000 km2
Ecosystem/Community
Medium scale spatial contextdefined by an ecosystem
within which a group of species(a community) interacts
Population/Species
Fine scale context defined bya group of similar individuals(a population) or the total # ofsuch individuals in the study
area (a species)
Structure
The physical shape,composition &distribution of bioticand abiotic elements
Heterogeneity; connectivity;spatial linkages; patchiness;porosity; contrast; grain size;fragmentation; distribution;perimeter-area ratio; patternof habitat layer distribution
Substrate soil variables; slope& aspect; vegetation biomass &physiognomy; foliage density &layering; horizontal patchiness;canopy openness & gapproport ions; abundance;density; distribution of keyphysical features (e.g., cliffs,outcrops, sinks) & structuralelements (e.g., snags, downlogs); water & resourceavailability; snow cover
Dispersion; range; populationstructure (gender & age ratio);habitat variables similar tothose listed at the community /ecosystem spatial scale;within-individual morphologicalvariability
continued on the next page

Carrying Capacity and Thresholds: Page Theory and Practice in Environmental Management
50
Table 12: Sample Indicators for a Multi-dimensional Natural System (cont’d)
Regional/Landscape
Large scale spatial context definedby many types of habitat - the full
extent is defined by the researcher& is usually $1,000 km2
Ecosystem/Community
Medium scale spatial context definedby an ecosystem within which a group
of species (a community) interacts
Population/Species
Fine scale context defined by a groupof similar individuals (a population) orthe total # of such individuals in the
study area (a species)
Function
Interaction of systemcomponents whichgive rise to materialand energy cycles
Disturbance processes(aerial extent, frequency orreturn interval, rotation,per iod , p red ic tab i l i t y ,i n t e n s i t y , s e v e r i t y ,seasonality); nutrient cyclingrates; patch persistence &turnover rates; rates oferosion, geomorphic andhydrologic processes; humanland uses
B i o m a s s & r e s o u r c eproduct iv i ty ; herb ivory ;parasitism & predation rates;colonization & local extinctionrates; patch dynamics (fine-scale disturbance processes);human intrinsic rates &intensities
Demographic processes(fertility, recruitment rate,survivorship, mortal i ty);metapopulation dynamics;physiology; life history;phenology; growth rate ofindividuals; acclimation;adaptation
Interrelation-ships
Significant inter-connections betweenstructural andfunctional elements
I den t i t y ; d i s t r i bu t i on ;richness; proportions of patch(habitat) type and multipatchlandscape types; collectivep a t t e r n s o f s p e c i e sdis t r ibut ion ( r ichness,endemism)
Identity; relative abundance;frequency; richness; evenness;diversity of species &communities; proportions ofendemic, exotic, threatened &e n d a n g e r e d s p e c i e s ;dominance-diversity curves;life-form proportions; similaritycoefficients; C3:C4 plantspecies ratios
A b s o l u t e o r r e l a t i v eabundance; f requency ;importance of cover vale;biomass; density
Time (trends)
Changes in structure, function &interrelationships over time
Changes over time withrespect to any of thestructural, functional orinterrelationship dimensions(e.g., comparison of forestcover over 50 years)
Changes over time with respectto any of the structural,functional or interrelationshipdimensions (e.g., monitorsuccession over time)
Changes over time withrespect to any of the structural,functional or interrelationshipdimensions (e.g., birth rate ordeath rate over time)
6.2 Tools for Measuring
A number of different types of tools exist to support an integrated environmentalmanagement system. Tools can range from consultation with experts andstakeholders to complicated computer models depending on the questions beingasked. The LAC approach relies heavily on both scientific formulations ofthresholds (when available) and socially-defined thresholds. As has been statedbefore, data collection and data evaluation or interpretation is a crucial element ofadaptable management and LAC programs. Table 13 (see next page) outlines thetypes of tools available (Noss, 1990). They are categorized according to the spatialscales used in the matrix (Figure 2). Additional tools which are applicable at morethan one scale are addressed following the table.
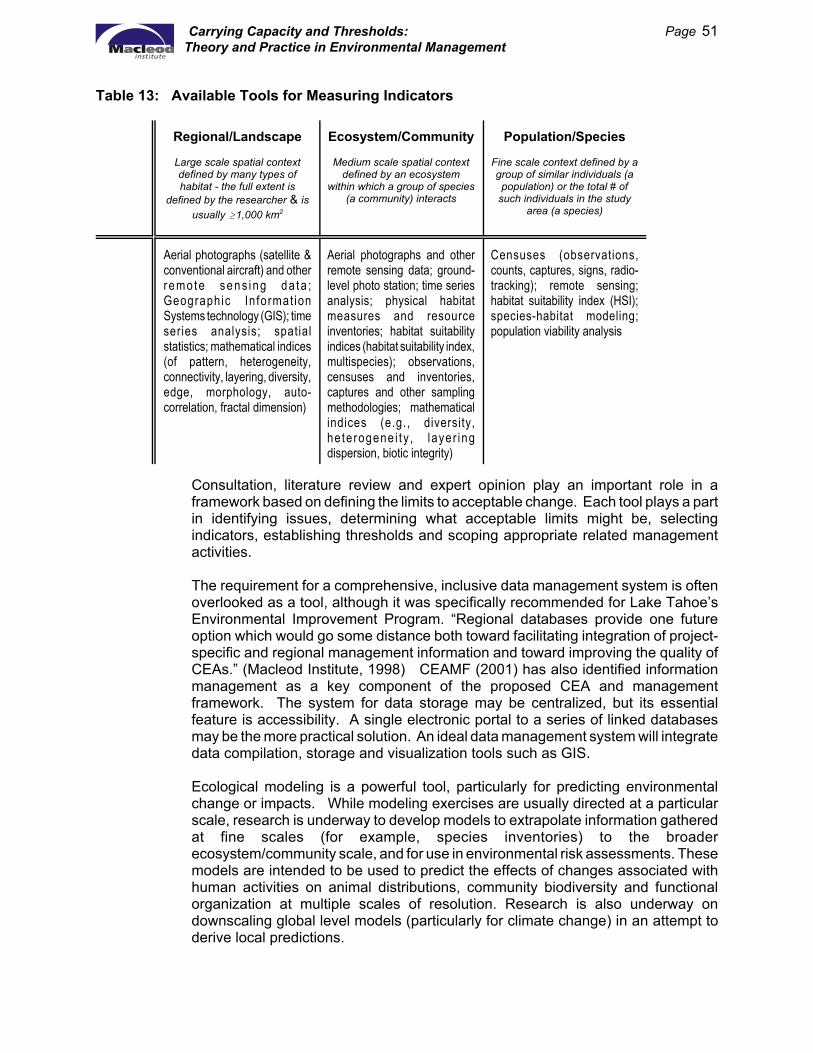
Carrying Capacity and Thresholds: Page Theory and Practice in Environmental Management
51
Table 13: Available Tools for Measuring Indicators
Regional/Landscape
Large scale spatial contextdefined by many types ofhabitat - the full extent is
defined by the researcher & isusually $1,000 km2
Ecosystem/Community
Medium scale spatial contextdefined by an ecosystem
within which a group of species(a community) interacts
Population/Species
Fine scale context defined by agroup of similar individuals (apopulation) or the total # of
such individuals in the studyarea (a species)
Aerial photographs (satellite &conventional aircraft) and otherremo te se n s ing da ta ;Geographic In format ionSystems technology (GIS); timeseries analysis; spatialstatistics; mathematical indices(of pattern, heterogeneity,connectivity, layering, diversity,edge, morphology, auto-correlation, fractal dimension)
Aerial photographs and otherremote sensing data; ground-level photo station; time seriesanalysis; physical habitatmeasures and resourceinventories; habitat suitabilityindices (habitat suitability index,multispecies); observations,censuses and inventories,captures and other samplingmethodologies; mathematicalindices (e.g., diversity,he terogene i t y , layer ingdispersion, biotic integrity)
Censuses (observations,counts, captures, signs, radio-tracking); remote sensing;habitat suitability index (HSI);species-habitat modeling;population viability analysis
Consultation, literature review and expert opinion play an important role in aframework based on defining the limits to acceptable change. Each tool plays a partin identifying issues, determining what acceptable limits might be, selectingindicators, establishing thresholds and scoping appropriate related managementactivities.
The requirement for a comprehensive, inclusive data management system is oftenoverlooked as a tool, although it was specifically recommended for Lake Tahoe’sEnvironmental Improvement Program. “Regional databases provide one futureoption which would go some distance both toward facilitating integration of project-specific and regional management information and toward improving the quality ofCEAs.” (Macleod Institute, 1998) CEAMF (2001) has also identified informationmanagement as a key component of the proposed CEA and managementframework. The system for data storage may be centralized, but its essentialfeature is accessibility. A single electronic portal to a series of linked databasesmay be the more practical solution. An ideal data management system will integratedata compilation, storage and visualization tools such as GIS.
Ecological modeling is a powerful tool, particularly for predicting environmentalchange or impacts. While modeling exercises are usually directed at a particularscale, research is underway to develop models to extrapolate information gatheredat fine scales (for example, species inventories) to the broaderecosystem/community scale, and for use in environmental risk assessments. Thesemodels are intended to be used to predict the effects of changes associated withhuman activities on animal distributions, community biodiversity and functionalorganization at multiple scales of resolution. Research is also underway ondownscaling global level models (particularly for climate change) in an attempt toderive local predictions.

Carrying Capacity and Thresholds: Page Theory and Practice in Environmental Management
52
6.3 NWT Monitoring and Information Management Programs
The defining ecological and cultural features of Canada’s North include
• slow break down of contaminants;• large variations in conditions between the years;• low temperatures;• short food chains (lack of trophic complexity);• little soil development;• cultural richness; and• reliance on natural resources (WWF 2001; Diavik Diamonds Project
1999). Development impacts in the NWT, in combination with the unique features of arcticregions, have given rise to a multitude of monitoring projects. Some of theseprograms are listed in Table 14.
Table 14: Selected Monitoring Programs in the Northwest Territories
Sponsor Program Comments
Partnership(government, ENGOs,industry, universities,aboriginal organizations)
EMAN (Ecological Monitoring and AssessmentNetwork)
Primarily involved in collecting baseline data ata regional/landscape scale (EMAN, WKSS) orecosystem/community scale (CRS, MRBB)
CRS is a collaborative effort originating incommunity concerns that drinking water wouldbe contaminated by mining activity at theCoppermine River headwaters (Lac de Gras)
EMAN is also involved in sponsoring volunteermonitoring programs and in research todevelop indicators
WKSS(West Kitikmeot Slave Study)
CRS(Coppermine River Study)
MRBB(Mackenzie River Basin Board)
Government CEAMF (2001)(Cum. Eff. Ass’t and Mgt. Framework)
CEAMF is a multi-stakeholder, territory-wideCEAM initiative aimed at developing asystematic and coordinated approach; aconceptual tool for understanding; a way toorganize activities in the current context ofsettlement negotiations; and an on-goingprocess for coordination, identifying gaps,setting priorities, and focusing resources.MVCIMP is mandated under the MV ResourceMangement Act. RWED is leading species-level research on bears and wolves.CANTTEX specializes in monitoring plantresponses to climate change. Research in theParks focuses on birds, their habitat needsand responses to ecological variations
MVCIMP(MV Cum. Impacts Monitoring Program)
RWED
CANTTEX(Cdn Tiaga and Tundra Experiment)
Nahanni National Park
Aulavik National Park
continued on next page
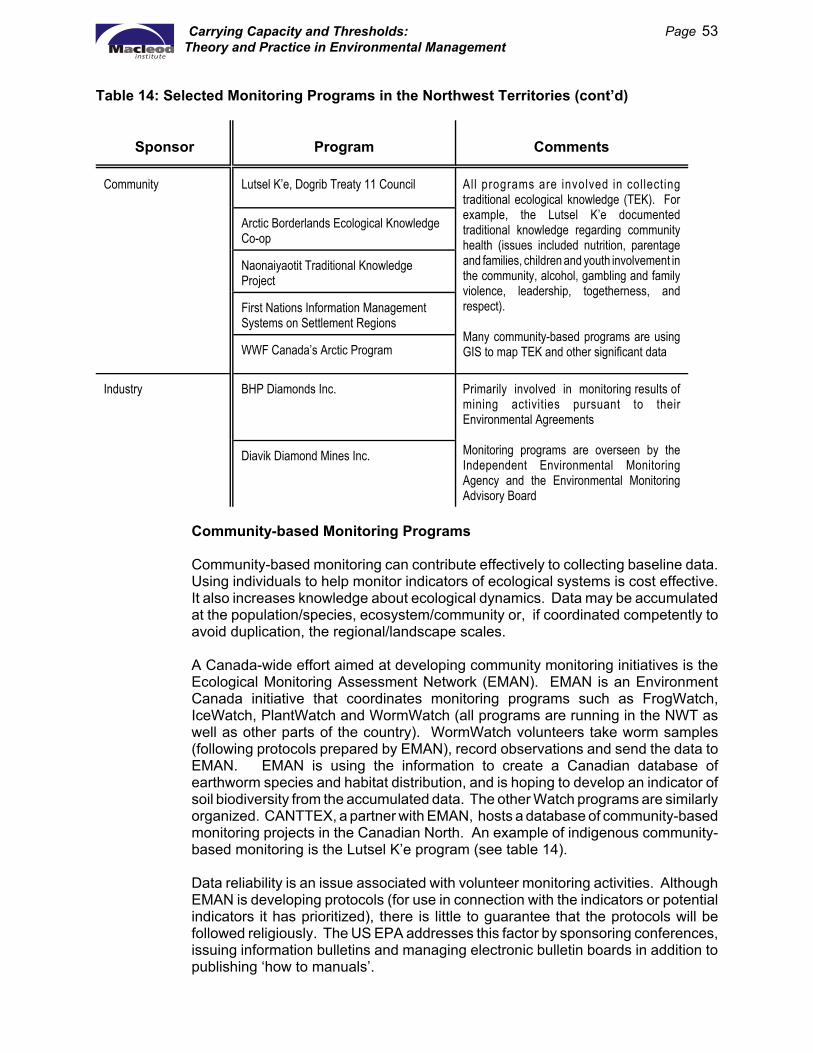
Carrying Capacity and Thresholds: Page Theory and Practice in Environmental Management
53
Table 14: Selected Monitoring Programs in the Northwest Territories (cont’d)
Sponsor Program Comments
Community Lutsel K’e, Dogrib Treaty 11 Council All programs are involved in collectingtraditional ecological knowledge (TEK). Forexample, the Lutsel K’e documentedtraditional knowledge regarding communityhealth (issues included nutrition, parentageand families, children and youth involvement inthe community, alcohol, gambling and familyviolence, leadership, togetherness, andrespect).
Many community-based programs are usingGIS to map TEK and other significant data
Arctic Borderlands Ecological KnowledgeCo-op
Naonaiyaotit Traditional KnowledgeProject
First Nations Information ManagementSystems on Settlement Regions
WWF Canada’s Arctic Program
Industry BHP Diamonds Inc. Primarily involved in monitoring results ofmining activities pursuant to theirEnvironmental Agreements
Monitoring programs are overseen by theIndependent Environmental MonitoringAgency and the Environmental MonitoringAdvisory Board
Diavik Diamond Mines Inc.
Community-based Monitoring Programs
Community-based monitoring can contribute effectively to collecting baseline data.Using individuals to help monitor indicators of ecological systems is cost effective.It also increases knowledge about ecological dynamics. Data may be accumulatedat the population/species, ecosystem/community or, if coordinated competently toavoid duplication, the regional/landscape scales.
A Canada-wide effort aimed at developing community monitoring initiatives is theEcological Monitoring Assessment Network (EMAN). EMAN is an EnvironmentCanada initiative that coordinates monitoring programs such as FrogWatch,IceWatch, PlantWatch and WormWatch (all programs are running in the NWT aswell as other parts of the country). WormWatch volunteers take worm samples(following protocols prepared by EMAN), record observations and send the data toEMAN. EMAN is using the information to create a Canadian database ofearthworm species and habitat distribution, and is hoping to develop an indicator ofsoil biodiversity from the accumulated data. The other Watch programs are similarlyorganized. CANTTEX, a partner with EMAN, hosts a database of community-basedmonitoring projects in the Canadian North. An example of indigenous community-based monitoring is the Lutsel K’e program (see table 14).
Data reliability is an issue associated with volunteer monitoring activities. AlthoughEMAN is developing protocols (for use in connection with the indicators or potentialindicators it has prioritized), there is little to guarantee that the protocols will befollowed religiously. The US EPA addresses this factor by sponsoring conferences,issuing information bulletins and managing electronic bulletin boards in addition topublishing ‘how to manuals’.

Carrying Capacity and Thresholds: Page Theory and Practice in Environmental Management
54
Information Management and Modeling Initiatives
Several information management and modeling initiatives are currently underway.Three projects of particular interest in the NWT are itemized below.
Q-LINKS(Quebec-LabradorIntegrated KnowledgeSystem)
Q-LINKS is an information system being used in Quebecand Labrador and is one of serveral models being examinedfor its utility in the NWT context. The system design iscentralized (i.e., all information is held in a centralizedserver) and interactive. Users of the site themselves manageinformation by adding, changing, moving and removinginformation.
ALCES(A LandscapeCumulative EffectsSimulator)
ALCES tracks historic land practices and projects a futurelandscape based on industry and government estimates ofdevelopment for the energy, forestry, transportation, andagriculture sectors. The model allows land-use planners,scientists, industry and other interests to predict long-termtrends based on existing information.
The ALCES model was used to illustrate the currentcomposition of a selected landscape in Deh Cho traditionallands, incorporating recent energy sector data. The ALCESmodel can also predict socio-economic indicators such aspopulation growth.
7.0 REVIEWING PROGRESS
The fourth stage in the plan–do–monitor–review cycle of management functions isthe review, or feedback, stage. It is the phase which receives least attention, yetfeedback is the secret of success for both natural selection and organizationalprocesses. “Enlightened and informed review and feedback on the performanceachieved should be carried out by the accountable parties, where achievements anddifficulties are recognized and necessary corrections made.” (Auditor General, 1998)
The review and feedback function as it is applied in the LAC approach is addressedin section 7.1. Section 7.2 contemplates the current situation in the NWT, andidentifies gaps in research that warrant further attention.
7.1 Feedback Mechanisms in the LAC Approach
Embedded as a primary precept of the LAC approach, feedback from programresults and the evolution of knowledge is routinely used to adapt managementobjectives and socially-determined thresholds. An evolutionary progress towardsunderstanding the consequences of human activities on dynamic, multi-dimensionalnatural systems leads, over a period of decades, to more finely tuned thresholds.In the meantime, thresholds are designed to signal management interventions inadvance of the point at which ecosystems evidence signs of significant change.

Carrying Capacity and Thresholds: Page Theory and Practice in Environmental Management
55
Results are then monitored to ensure that observing threshold limits does indeedachieve the desired outcomes. If not, then human activities are adjusted onceagain, new thresholds are stipulated or more appropriate indicators are selected.
The Chesapeake Bay Program exemplifies this feedback loop. Although theProgram had been in place since 1987, observed results (improvement in the Bay’scondition) were not entirely satisfactory. A major adjustment to thresholds and capload allocations was therefore undertaken in 2000. The Tahoe Region PlanningAssociation has gone one step further by instituting a formal five year evaluation andreview process for all elements of its Regional Plan.
Essentially, the LAC approach is an application of adaptive management. Actionis taken even with imperfect knowledge, and initial actions are refined as moreinformation becomes available (Ringold et al., 1996). However, tension existsbetween the ideas of adaptive management and the ideas associated with aprecautionary approach (Mitchell and Shrubsole, 1994). Many have argued thatadaptive management is reactive and the antithesis of a precautionary approach.Others recognize a danger in being so cautious that restrictions on human activitiescreate drastic repercussions in the social or economic domains. Inevitably, abalance needs to be struck. The precautionary approach or principles can beintegrated with preventive and corrective approaches (as illustrated in Figure 6 onpage 33). And feedback on observed results can be religiously and rigorouslyapplied to make necessary corrections to ongoing management programs.
7.2 Gaps in the Research
The Institute was asked to identify gaps in the research and make recommendationsfor further research or study to assist with the development and implementation ofthresholds for the management of human activities in the NWT (Appendix A,paragraph 2b). Generally speaking, the gaps fall into two categories — adapting theLAC approach, and setting the agenda for data collection and analysis.
LAC Approach
This Report has provided an overview of how the LAC approach operates, andprovided examples of both regional and recreational applications. Gaps include thefollowing:
• a detailed comparison of institutional structures, mandates andauthorities in the NWT with those in other regions such as LakeTahoe, Chesapeake Bay and the Athabasca Oil Sands (Alberta) toestablish points of convergence and deviation;
• a review of management goals and objectives among permit grantingand regulatory agencies to evaluate the degree to which they couldincorporate indicators; and
• a review of existing programs in the NWT to assess the feasibility ofa pilot project.

Carrying Capacity and Thresholds: Page Theory and Practice in Environmental Management
56
Setting the Agenda for Data Collection and Analysis
Table 15 sets out the number of data collection activities regarding nonchemicalstressors originating in the NWT (identified in Tables 6 and 7) that fall into eachmatrix category.
Table 15: Number of Data Collection Activities in each Category
Regional/Landscape
Large scale spatial contextdefined by many types ofhabitat - the full extent is
defined by the researcher &is usually $1,000 km2
Ecosystem/Community
Medium scale spatial contextdefined by an ecosystem
within which a group of species(a community) interacts
Population/Species
Fine scale context defined bya group of similar individuals(a population) or the total # ofsuch individuals in the study
area (a species)
Structure
The physical shape,composition &distribution of bioticand abiotic elements
1 1 6
Function
Interaction of systemcomponents whichgive rise to materialand energy cycles
3 5 4
Interrelation-ships
Significant inter-connections betweenstructural andfunctional elements
1 3 3
Time (trends)
Changes in structure, function &interrelationships over time
Time series analyses willoccur once data have been
collected over a sufficientnumber of years
Time series analyses willoccur once data have been
collected over a sufficientnumber of years
Time series analyses willoccur once data have been
collected over a sufficientnumber of years
Gaps include the following:
• *an exhaustive inventory of NWT monitoring activities to identify thefull extent and matrix categories of existing data collection efforts;
• *an assessment of areas in which additional monitoring is requiredto provide the basis for a more comprehensive suite of indicators;
• *a detailed review of potential indicators based on existing data sets;• a matrix for socio-economic indicators;• a preliminary assessment of existing management goals and
objectives to determine points of convergence with existing datasets; and
• a detailed compilation of indicators and thresholds being appliedelsewhere.
* Work on these gaps is underway by the Cumulative Impact Monitoring Program (CIMP)

Carrying Capacity and Thresholds: Page Theory and Practice in Environmental Management
57
8.0 STEPS TO APPLY THE LAC MODEL IN THE NWT
The Limits of Acceptable Change (LAC) model offers a practical approach tointegrating the concepts of carrying capacity and thresholds into the NWT’sintegrated management system. It factors environmental, social and economicconsiderations into the framework for managing human activities in a way thatmaintains respect for ecological well-being. Goals and objectives emphasize thepositive, by describing environmental and social conditions that reflect desiredoutcomes as seen from a multi-stakeholder perspective. LAC is also actionoriented, yet it avoids mechanistic or formula-driven management interventions.
The LAC approach builds on and is congruent with existing initiatives in the NWT.Land-use goals articulated by the Sahtu and Gwich’in communities, for example, fitwell within the model. Both have expressed a desire to balance development andpreservation, and both lean towards describing their desired outcomes in terms ofthe conditions that would prevail if the outcomes were achieved. Stakeholdersinvolved in devising the Lake Tahoe Regional Plan started in the same way, byidentifying the resources or characteristics of the environment that they want topreserve.
The LAC model is applied by following nine steps:
1. Identify issues and principles
2. Define elements and describe acceptable conditions
3. Select indicators and social conditions
4. Inventory existing resource and social conditions
5. Specify measurable standards for the resource and social indicators
selected in step 3
6. Identify alternative allocations for each element
7. Identify management actions for each alternative
8. Evaluate and select a preferred alternative allocation
9. Implement and monitor for feedback
Each of the steps is briefly discussed below. The overall product is a managementplan, complete with objectives, operating procedures, monitoring programs andfeedback mechanisms which drive systematic adaptations of the plan. Because theLAC approach produces a complete management plan, all decision makers whohave authority to establish land use plans, conduct impact assessments, regulateland and water use, carry out inspections and enforcement activities, and overallmonitoring functions, need to be included in the process. Without commitment fromall responsible authorities, the plan will not be cohesive or congruent throughout theregion to which it is applied.
This feature of the LAC approach could well be one of its strengths in the NWTcontext where a strong movement to co-management has been gaining momentumfor years. However, if experience in other jurisdictions proves to be a reliableprecedent, senior officials (elected and appointed) will be required to sign formalprotocols to launch a comprehensive regional initiative.

Carrying Capacity and Thresholds: Page Theory and Practice in Environmental Management
58
The process is designed to be collaborative and to involve a wide range ofstakeholders in addition to responsible authorities. Broad participation will help toensure that management activities are accepted and supported by both industry andcitizenry. LAC is a consensus-building model. However, the intent is to balancestakeholder interests and ensure long-term sustainability. Consensus in this contextdoes not require that decisions be unanimous.
Step 1. Identify issues and principles
The first step entails identifying issues of concern to the stakeholders. A narrativeis prepared to describe unique values, special opportunities and problems requiringspecial attention. Basic principles are also identified. Principles will likely includea commitment to integrated resource management, the precautionary principle,sustainable development and ecological integrity.
Typically, a series of scoping meetings is held with appropriate agencies andinterested parties, and the results are summarized and disseminated both toparticipants and to the public at large.
Step 2. Define elements and describe acceptable conditions
The second step addresses what elements should be included in the overallmanagement plan, and describes what will constitute acceptable conditions giventhe resource uses envisaged for each element. Examples could include IndustrialDevelopment, Conservation, Recreation and other similar classifications. It isimportant to note that these elements are dealt with in the abstract at this stage.They are not actual ‘on-the-ground’ allocations, and do not derive from specificconditions found within the region. Elements are chosen to reflect the key activitiesin a region considered to be essential or desirable for future success (however thatmay be defined by the stakeholders).
Acceptable conditions for each element are then articulated. A qualitativedescription of the kinds of resources and social conditions acceptable for eachelement is prepared. The conditions should be realistic and achievable, and reflecta balancing of stakeholder interests.
This step inevitably requires participants to make choices and to consider the trade-offs between various desired outcomes. One of the experts who participated in thisstudy rightly pointed out “there will still have to be a compromise”, but also statedthat “we do not know what the trade offs are” (Boutin, pers. com.). A useful tool forhelping to bring the trade offs into perspective is the ALCES model. ALCES is “astrategic model ... which can track change over time” to illustrate what will likelyhappen to the regional landscape as a result of different choices (Stelfox, pers.com.). For example, the program can generate a Habitat Effectiveness Index(tracking habitat quality against habitat availability) to give an indication of whetherthe landscape will (or will not) continue to support wildlife species given a certainlevel of industrial development and other human activities.
ALCES has been used to support decisions in a number of locations (includingAlberta’s northeastern boreal forest, and the Crown of the Continent Initiative), andis relatively inexpensive in itself (under $15,000 for software). Its cost-effectiveness,however, is dependent on having access to GIS data, although the minimumamount of data required for running the program can also be generated fromsatellite information (which will add some costs). Data quality and availability in theNWT needs to be assessed and is underway under the auspices of CIMP.

Carrying Capacity and Thresholds: Page Theory and Practice in Environmental Management
59
Step 3. Select indicators and social conditions
Selecting measurable indicators and social conditions is the third step in the LACprocess. The task involves choosing representative subsets of data that will givean indication, over time, of how overall conditions in each element are faring. A setof indicators is chosen for each separate element. The indicators must be directlyrelated to the acceptable conditions described in step 2, because it is theseconditions which define the desired outcomes. In the Rattlesnake NationalRecreation Area, for example, the management goal for one element is to sustainnatural ecological processes, and the acceptable conditions were described in termsof minimal human activity. The indicators therefore included campsite density andcondition as a means of directly relating the indicators to the acceptable conditions.
The number of indicators must be kept to a manageable total. It would obviously beimpractical to try to track and process excessive amounts of information. But it isalso important to be rigorous in the choice of a few, well-considered indicators inorder to identify the essential factors in achieving whatever acceptable conditionshave been defined. In the Lake Tahoe region, for instance, “cause and effectrelationships between variables were established. These relationships wereevaluated according to their individual contributions to the resource [and indicatorschosen] only for those causal factors that were most significant to the resource.”
The matrix (Table 12) illustrates the kinds of indicators that can be used to trackbiophysical conditions at a regional or landscape level. These indicators aredesigned to track natural processes (i.e., nutrient cycling, natural disturbance andsuccession) which are essential for ecological integrity (Boutin, pers. com.).Focussing attention on natural process as an indicator provides an overview ofcumulative outcomes and it is recommended that an appropriate number of suchindicators be included. However, several experts have pointed out that the existingresearch database tends to focus on particular species. Caribou have beenrecommended as a good indicator (Russell, pers. com.), because a large amountof information has been collected; the animals are wide ranging; they are largelynutritionally controlled; and they travel in a herd (unlike bears where one bear maybe affected while others are not).
Socio-economic indicators pose more of a challenge. Relatively little work has beendone in this area, and most of it relates to the wage economy (Kinsley, per.com.)However, it is quite likely that stakeholders will identify jobs as one aspect of theacceptable conditions associated with industrial development (Mapping Our Future,2001). If that is the case, then indicators such as the ratio of lowest wage paid byindustry as compared to the minimum wage, and workforce diversity measurescould be used to track the quality of employment (see Table 8).
Selecting indicators is easier said than done. Step 3 will require an analysis of theacceptable conditions once they are described by the stakeholders, in order topinpoint the three to five most significant variables associated with each condition.Potential indicators for each variable will then need to be compiled and assessedfor effectiveness against criteria such as ease and cost-effectiveness of datacollection, ease of understanding, degree to which the data is dependent on a singlespecies, and predictability (see Table 11). Although these tasks will likely beundertaken by a small task force and will involve expert input, all stakeholders havea legitimate interest in the final selection. The final stage of step 3 will thereforerequire multi-stakeholder discussions and participation in the decisions as to whichindicators are chosen.

Carrying Capacity and Thresholds: Page Theory and Practice in Environmental Management
60
Step 4. Inventory existing resource and social conditions
Step 4 compiles existing information across the region, as it relates to each indicatorselected in step 3. This step sets the stage for setting thresholds (related to desiredoutcomes) and specifying management actions.
Step 5. Specify measurable standards for the resource andsocial indicators selected in step 3
Step 5 in effect establishes thresholds for each element of the management plan.Standards are specified which assign quantitative or particular measures to theindicators. An example from the Rattlesnake National Recreation Area is “noincrease in the existing number of campsites.” Another example, from the LakeTahoe Region, is “75 miles rated excellent; 105 miles rated good; and 38 miles ratedmarginal” for stream habitat in the region. In addition to this sort of standard,existing regulations (such as the Canadian Drinking Water Guidelines) are alsotypically adopted.
As is evident from the examples given, no attempt is made to pinpoint an exact line(or even a range of values) beyond which an ecosystem is predicted to collapse.The standards are chosen well within known boundaries, or, if the boundaries arenot known, then the precautionary principle is applied. The fact that indicators andstandards are selected to achieve acceptable conditions tends to correlate resultingthresholds to successful outcomes and to discourage brinkmanship.
A certain amount of pragmatism is often inserted when standards are specified. Inthe Lake Tahoe Region, for instance, stakeholders decided that they could accepta certain amount of marginal stream habitat (about 17% of the total). They tookachievability into account when they settled on this particular threshold, knowing thatthe management plan is not cast in stone but will be revisited as time goes on. Atthe same time, the standards did not lose sight of the larger goals — 83% of thestream habitat is to be rated as ‘good’ or better.
Not all indicators lend themselves to quantification. For example, one of theindicators identified for the ‘pristine’ element of the Rattlesnake National RecreationArea is insect control. The standard adopted was “No control” (see Table 5), whichis a management standard rather than a numerical measure. The Lake TahoeRegional Plan distinguishes between three categories of thresholds: numerical,management and policy. An example of a policy threshold can be found in thetransportation element of their plan, where it is stated that “it shall be a policy of theTRPA Governing Board in the development of the Regional Plan to define, locateand establish CNEL [cumulative noise event limit] levels for transportation corridors.”
Step 6. Identify alternative allocations for each element
Step 6 begins the process of deciding what resource and social conditions are to bemaintained or achieved in specific areas of the region. All stakeholders participatein this step. Once again, choices must be made and trade offs considered. Thefinal decision is not made at this step (only responsible authorities can actually makebinding allocations — see step 8). Stakeholders generate a number of alternativesand then rank them in order of preference.

Carrying Capacity and Thresholds: Page Theory and Practice in Environmental Management
61
Step 7. Identify management actions for each alternative
The LAC model produces a complete management plan. It therefore includes astep at which stakeholders identify preferred management actions. The stipulatedactions are designed to deal with immediate action items, as well as to map outwhat kinds of action will be taken in the future. A degree of transparency andaccountability are thus introduced into the plan.
This feature of the LAC approach particularly emphasizes an important point:appropriate representatives from each responsible authority must be involved atevery step of the process. At steps 1 and 2, officials (elected and appointed) andsenior executives need to sanction the principles, goals and objectives which aredetermined. Step 3, selecting indicators, will involve managers as well as seniorexecutives. The inventory (step 4) will likely be conducted and compiled by fieldstaff, who should also be involved in identifying alternative allocations for eachelement (step 6) and establishing monitoring programs (step 9). Setting standards(Step 5) is usually a function of officials. At step 7, managers will need to agree tothe management actions identified, while final allocation decisions (step 8) will bemade by the appropriate officials and boards on the advice of senior executives.
Step 7 identifies management actions for each alternative allocation. Typically, atiered management approach is outlined (see Figure 6; the RSDS ManagementModel (Figure 7) provides another example).
When applied at a regional level, a number of different authorities have jurisdiction.Roles and responsibilities must therefore be clearly identified and assigned to theappropriate existing authorities. In the Lake Tahoe management area, for example,a mix of local, state and federal agencies all agreed to the Regional Plan, and thenconformed their own ordinances, rules, regulations and policies to the Plan toensure consistency across the region.
Step 8. Evaluate and select a preferred alternative allocation
Final allocation decisions are made by persons with the appropriate authority (basedon input from stakeholders in step 6). At the same time, selection and assignmentof management actions is finalized for each allocation (again based on stakeholderinput, particularly from step 7).
Land use planning boards in the NWT will be key decision makers in step 8,because elements of the plan are allocated to specific areas of the region. However, other agencies will also be affected. Proposed developments, forexample, must conform to land use plans and so assessment tribunals and permitissuing officials will use the same indicators and standards that accompany eachelement. Once incorporated into land and water approvals, individual companieswill then be obliged to use the indicators to demonstrate they have met theestablished standards. Compliance agencies will also refer to the same indicatorsand standards to determine whether acceptable conditions are being achieved ormaintained.
Under the MVRMA, various environmental management functions have beenassigned to different authorities. Each authority will implement a piece of the LACmodel according to their own jurisdiction. However, in order to achieve consistencyacross the entire region and spectrum of management functions, each must adoptthe same principles and management goals. It is therefore critical that all authoritiesbe included at each step of the LAC process.

Carrying Capacity and Thresholds: Page Theory and Practice in Environmental Management
62
Step 9. Implement and monitor for feedback
In step 9, each of the authorities tasked with responsibilities (see step 7) implementsits portion of the management plan.
At the same time, monitoring programs are set up to collect data with respect to theselected indicators. An authority established under Part 6 of the MVRMA couldcoordinate and oversee the monitoring activities, and act as a central agency onbehalf of various responsible authorities to continue to refine indicators. Datacollection activities would also be undertaken by industry, existing initiatives suchas the West Kitikmeot Slave Study and community-based initiatives. All of theregional programs that were reviewed included one or more community-basedmonitoring programs. The RSDS, for example, relies on the Wood BuffaloEnvironmental Association to measure ambient air quality at 11 monitoring stations,and the Chesapeake Bay Program supports the Maryland Stream Waders for thepurpose of ensuring that a sufficiently large number of samples is collected.
Step 9 feeds directly back into the first step of the LAC process, which is designedto be cyclical. LAC relies on feedback for continuous improvement of its thresholds,indicators and management activities, and feedback relies on reported observationsof actual results. Goals, objectives, indicators, standards and operating proceduresare adapted and refined as the growing information base leads to increasedknowledge of what constitutes acceptable conditions. This feature is an essentialcomponent of the model, as can be seen in the Lake Tahoe and Chesapeake Bayexamples.
9.0 CONCLUSION
The Limits of Acceptable Change (LAC) model has been tested frequently in thecontext of recreational access by the US National Forest and Parks Services. Ona regional level, explicit or implicit LAC applications are currently underway in LakeTahoe and Chesapeake Bay. It is evident from a review of these cases that themodel was adopted notwithstanding a lack of precise scientific data. Indeed, in2000 the Chesapeake Bay Program switched to an approach that adopts theprinciples of LAC, because 17 years of relying primarily on science-basedthresholds for chemical contaminants was not producing the results the Programaimed to produce.
The LAC model incorporates the principles of carrying capacity and thresholds, andis compatible with the integrated resource management system set up under theMackenzie Valley Resource Management Act and Inuvialuit Final Agreement. Itoffers considerable potential for use in Canada’s North because it is
• consensus-based — it relies on balancing multi-stakeholder views to choosedesired outcomes and to apply them in areas of primary stakeholder interestor concern;
• pragmatic — it acknowledges that human activity will continue;• principled — it establishes limits to activity that are based on social and
ecological factors; • transparent — it selects measurable indicators and sets attainable
standards; and• action-oriented — it explicitly drives toward a management program that
includes an implementation schedule and monitoring agenda.

Carrying Capacity and Thresholds: Page Theory and Practice in Environmental Management
63
Looking Ahead
One of the greatest challenges facing the world today is sustainable development.Fifteen years after the World Commission on Environment and Development issuedits call to action, relatively little progress has been made in integrating sustainablepractices in resource management. As the Brundtland report said,
Sustainable development involves more than growth. It requires a changein the content of growth, to make it less material- and energy-intensive andmore equitable in its impact. ... The process of economic development mustbe more soundly based upon the realities of the stock of [natural] capital thatsustains it. ... Income distribution is one aspect of the quality of growth. ...[as are] such non-economic variables as education and health enjoyed fortheir own sake, clean air and water, and the protection of natural beauty. ...Changing the quality of growth requires changing our approach todevelopment efforts to take account of all of their effects. (Our CommonFuture, 1987, pages 52 - 53)
Adopting the LAC model will give the NWT a good framework, not only forresponding to immediate development pressures, but also for maintaining a stateof continuous improvement. Much work remains to be done in establishingappropriate indicators for sustainable development. The LAC model offers theopportunity to get ahead of development pressures, and a chance for the NWT totake a leadership role in integrating standards of sustainability in its resourcemanagement system.