carl robinette – usda, natural resources conservation servicesurface down and field book for...
TRANSCRIPT
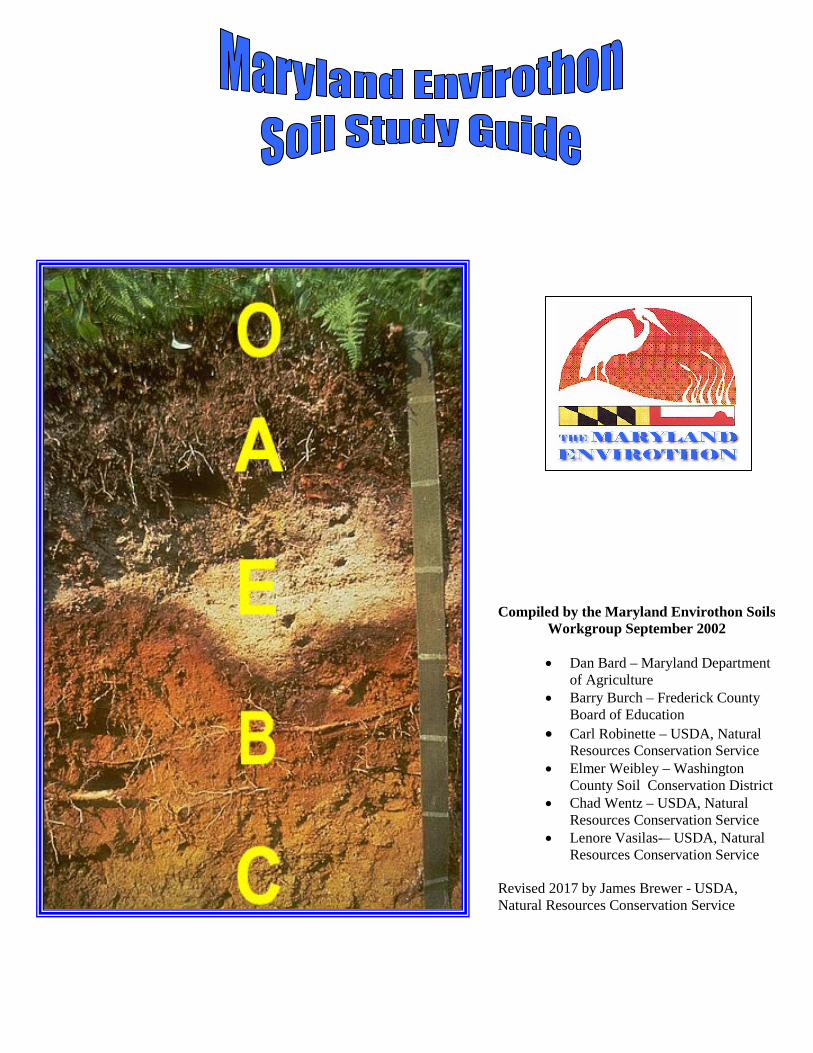
Compiled by the Maryland Envirothon Soils Workgroup September 2002
• Dan Bard – Maryland Department
of Agriculture • Barry Burch – Frederick County
Board of Education • Carl Robinette – USDA, Natural
Resources Conservation Service • Elmer Weibley – Washington
County Soil Conservation District • Chad Wentz – USDA, Natural
Resources Conservation Service • Lenore Vasilas-– USDA, Natural
Resources Conservation Service Revised 2017 by James Brewer - USDA, Natural Resources Conservation Service

Introduction
Sustaining our soil productivity and the management of our other natural resources is
an important concern of farmers, rural landowners, homeowners and governmental
agencies. This document will provide the scope by which farmers and landowners utilize
soil and water conservation plans to maintain these important resources. It will also
identify best management practices that will conserve, protect and enhance their land.
As soil scientists analyze and examine soils, they believe texture is the most
important aspect of a soil. By determining a soil’s texture, an individual is able to
characterize the interrelationships among the other soil properties of the soil. Hence, the
individual is better informed as to the ability and the uses of the land.
Stated below are objectives that an individual can learn to improve their awareness
and knowledge of soils and its capabilities:
1. Recognize the factors affecting soil formation and the composition of the soil.
2. Identify the various landforms and associated soil parent materials.
3. Identify in the field soil properties (such as texture, depth of bedrock, seasonal high
water table, flooding, slope, etc.) that directly impact soil interpretations.
4. Utilize the soil survey to develop an assessment of the limitations for regional land us
planning.
5. Develop an understanding of the soil properties that affect soil health and soil quality.
6. Determine the health and quality of the soil in the field.
7. Develop an understanding of, and the ability to apply the Land Capability
Classification System in an effort to protect farmland from urban pressure.
8. Develop an understanding of the soil’s impact on the hydrologic cycle.
We encourage the use of this document to develop a better understanding of soils,
the factors associated with soils development, and its uses, as well as soil conservation
districts and the various means to control soil erosion and water quality degradation.

Table of Contents Soils Map .................................................................................................................. Page 1 Soils Descriptions – Non-Technical ......................................................................... Page 2 Overview .................................................................................................................. Page 6 Soil Composition ...................................................................................................... Page 7 Factors of Soil Formation ......................................................................................... Page 8 Parent Material .................................................................................................... Page 8 Climate ................................................................................................................ Page 10 Living Organisms ................................................................................................ Page 11 Landscape Position .............................................................................................. Page 11 Time..................................................................................................................... Page 14 Soil Forming Processes ............................................................................................ Page 14 Soil Features ............................................................................................................. Page 18 The Soil Profile ................................................................................................... Page 18 Soil Horizons. ...................................................................................................... Page 19 Color. ................................................................................................................... Page 23 Organic vs. Mineral Soil Material ....................................................................... Page 28 Mineral Soil Texture (USDA) ............................................................................. Page 28 Rock Fragments ................................................................................................... Page 32 Soil Structure ....................................................................................................... Page 33 Permeability ......................................................................................................... Page 34 Depth ................................................................................................................... Page 35 Reaction ............................................................................................................... Page 37 Drainage .............................................................................................................. Page 37 Available Water Capacity.................................................................................... Page 43 Erosion................................................................................................................. Page 45 Erosion Potential ................................................................................................. Page 46 Land Capability Classification ............................................................................ Page 47 Other Management Interpretations ...................................................................... Page 52 Soil Surveys .............................................................................................................. Page 53 General Soil Information ..................................................................................... Page 54 Detailed Soil Information .................................................................................... Page 55 References ................................................................................................................ Page 56 Agricultural Best Management Practices............................................................. Page 57 Grassed Waterway .................................................................................................... Page 58 Contour farming ...................................................................................................... Page 59 Crop residue management ....................................................................................... Page 60 Crop rotation ............................................................................................................ Page 62 Cover crop ............................................................................................................... Page 63 Nutrient management .............................................................................................. Page 64 No-till farming ......................................................................................................... Page 65 Soil Health ................................................................................................................ Page 66 Soils in the Urban Landscape ................................................................................ Page 70 Maryland Envirothon Soils Exam Guidance Information ................................. Page 71 Outland to Soils Exam ......................................................................................... Page 71 Guidance to Soils Exam ...................................................................................... Page 113 Maryland Envirothon Soils Scorecard Example ................................................. Page 131
1

2
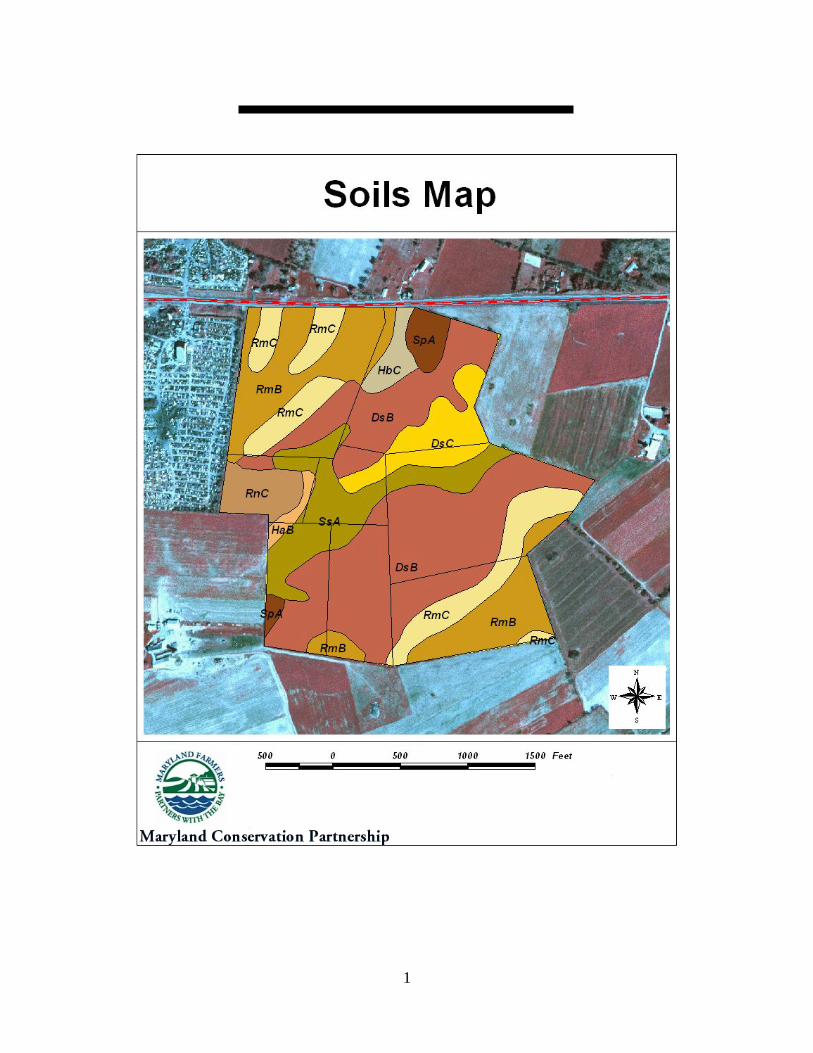
Soil Descriptions - Non-Technical Anywhere County, Maryland Only those map units that have entries for the selected non-technical description categories are included in this report. Map DsB - Duffield silt loam, 3 to 8 percent slopes Description Category: SO5
THE DUFFIELD SERIES CONSISTS OF VERY DEEP AND DEEP, WELL DRAINED SOILS ON UPLANDS. THEY FORMED IN MATERIAL WEATHERED FROM IMPURE LIMESTONE. TYPICALLY THESE SOILS HAVE A DARK GRAYISH BROWN SILT LOAM SURFACE LAYER 10 INCHES THICK. THE SUBSOIL FROM 10 TO 53 INCHES IS YELLOWISH-BROWN AND BROWNISH-YELLOW SILTY CLAY LOAM. THE SUBSTRATUM FROM 53 TO 60 INCHES IS YELLOWISH-BROWN SHALY SILT LOAM. SLOPE RANGE FROM 0 TO 35 PERCENT. Map DsC - Duffield silt loam, 8 to 15 percent slopes Description Category: SO5
THE DUFFIELD SERIES CONSISTS OF VERY DEEP AND DEEP, WELL DRAINED SOILS ON UPLANDS. THEY FORMED IN MATERIAL WEATHERED FROM IMPURE LIMESTONE. TYPICALLY THESE SOILS HAVE A DARK GRAYISH BROWN SILT LOAM SURFACE LAYER 10 INCHES THICK. THE SUBSOIL FROM 10 TO 53 INCHES IS YELLOWISH-BROWN AND BROWNISH-YELLOW SILTY CLAY LOAM. THE SUBSTRATUM FROM 53 TO 60 INCHES IS YELLOWISH-BROWN SHALY SILT LOAM. SLOPE RANGE FROM 0 TO 35 PERCENT Map HaB - Hagerstown silt loam, 3 to 8 percent slopes Description Category: SO5
THE HAGERSTOWN SERIES CONSISTS OF VERY DEEP, WELL-DRAINED, REDDISH SOILS ON UPLANDS. THEY FORMED IN MATERIALS WEATHERED FROM HARD LIMESTONE. TYPICALLY THESE SOILS HAVE AN 8 INCH PLOW LAYER OF BROWN OR DARK BROWN SILT LOAM. THE MATERIAL BELOW THIS DEPTH AND EXTENDING RATHER UNIFORMLY TO BEDROCK IS GENERALLY YELLOWISH RED CLAY OR SILTY CLAY, WITH LIMESTONE FRAGMENTS COMMON IN THE LOWER SUBSOIL AND SUBSTRATUM. SINK HOLES OCCUR IN SOME PLACES. LIMESTONE ROCK OUTCROPS ARE VERY COMMON BUT SOIL CAN USUALLY BE FARMED BETWEEN OUTCROPS. SLOPES RANGE FROM 0 TO 60 PERCENT. Map HbC - Hagerstown silty clay loam, 8 to 15 percent slopes, very rocky Description Category: SO5 THE HAGERSTOWN SERIES CONSISTS OF VERY DEEP, WELL-DRAINED, REDDISH SOILS ON UPLANDS. THEY FORMED IN MATERIALS WEATHERED FROM HARD LIMESTONE. TYPICALLY THESE SOILS HAVE AN
3
8 INCH PLOW LAYER OF BROWN OR DARK BROWN SILT LOAM. THE MATERIAL BELOW THIS DEPTH AND EXTENDING RATHER UNIFORMLY TO BEDROCK IS GENERALLY YELLOWISH RED CLAY OR SILTY CLAY, WITH LIMESTONE FRAGMENTS COMMON IN THE LOWER SUBSOIL AND SUBSTRATUM. SINK HOLES OCCUR IN SOME PLACES. LIMESTONE ROCK OUTCROPS ARE VERY COMMON BUT SOIL CAN USUALLY BE FARMED BETWEEN OUTCROPS. SLOPES RANGE FROM 0 TO 60 PERCENT. Map RmB - Ryder-Duffield channery silt loams, 3 to 8 percent slopes Description Category: SO5
THE RYDER SERIES CONSISTS OF MODERATELY DEEP, WELL-DRAINED SOILS ON UPLANDS. THEY FORMED IN MATERIAL WEATHERED FROM SHALY LIMESTONE. TYPICALLY, THESE SOILS HAVE A YELLOWISH BROWN SILT LOAM SURFACE LAYER 8 INCHES THICK. THE SUFSOIL FORM 8 TO 30 INCHES IS YELLOWISH-BROWN FRIABLE SILT LOAM IN THE UPPER PART AND LIGHT YELLOWISH-FROWN FIRM CHANNERY SILTY CLAY LOAM IN THE LOWER PART. THE SUBSTRATUM FROM 30 TO 35 INCHES IS YELLOWISH-BROWN AND BROWN VERY CHANNERY SILT LOAM. SHALY LIMESTONE IS AT 35 INCHES
THE DUFFIELD SERIES CONSISTS OF VERY DEEP AND DEEP, WELL DRAINED SOILS ON UPLANDS. THEY FORMED IN MATERIAL WEATHERED FROM IMPURE LIMESTONE. TYPICALLY THESE SOILS HAVE A DARK GRAYISH BROWN SILT LOAM SURFACE LAYER 10 INCHES THICK. THE SUBSOIL FROM 10 TO 53 INCHES IS YELLOWISH-BROWN AND BROWNISH-YELLOW SILTY CLAY LOAM. THE SUBSTRATUM FROM 53 TO 60 INCHES IS YELLOWISH-BROWN SHALY SILTLOAM. LIMESTONE OUTCROPS ARE VERY COMMON. SLOPES RANGE FROM 0 TO 45 PERCENT.
Map RmC - Ryder-Duffield channery silt loams, 8 to 15 percent slopes Description Category: SO5
THE RYDER SERIES CONSISTS OF MODERATELY DEEP, WELL-DRAINED SOILS ON UPLANDS. THEY FORMED IN MATERIAL WEATHERED FROM SHALY LIMESTONE. TYPICALLY, THESE SOILS HAVE A YELLOWISH BROWN SILT LOAM SURFACE LAYER 8 INCHES THICK. THE SUFSOIL FORM 8 TO 30 INCHES IS YELLOWISH-BROWN FRIABLE SILT LOAM IN THE UPPER PART AND LIGHT YELLOWISH-FROWN FIRM CHANNERY SILTY CLAY LOAM IN THE LOWER PART. THE SUBSTRATUM FROM 30 TO 35 INCHES IS YELLOWISH-BROWN AND BROWN VERY CHANNERY SILT LOAM. SHALY LIMESTONE IS AT 35 INCHES THE DUFFIELD SERIES CONSISTS OF VERY DEEP AND DEEP, WELL DRAINED SOILS ON UPLANDS. THEY FORMED IN MATERIAL WEATHERED FROM IMPURE LIMESTONE. TYPICALLY THESE SOILS HAVE A DARK GRAYISH BROWN SILT LOAM SURFACE LAYER 10 INCHES THICK. THE SUBSOIL FROM 10 TO 53 INCHES IS YELLOWISH-BROWN AND BROWNISH-
4
YELLOW SILTY CLAY LOAM. THE SUBSTRATUM FROM 53 TO 60 INCHES IS YELLOWISH-BROWN SHALY SILT LOAM. LIMESTONE OUTCROPS ARE VERY COMMON. SLOPES RANGE FROM 0 TO 45 PERCENT. Map RnC - Ryder-Nollville channery silt loams, 8 to 15 percent slopes Description Category: SO5
THE RYDER SERIES CONSISTS OF MODERATELY DEEP, WELL-DRAINED SOILS ON UPLANDS. THEY FORMED IN MATERIAL WEATHERED FROM SHALY LIMESTONE. TYPICALLY, THESE SOILS HAVE A YELLOWISH BROWN SILT LOAM SURFACE LAYER 8 INCHES THICK. THE SUFSOIL FORM 8 TO 30 INCHES IS YELLOWISH-BROWN FRIABLE SILT LOAM IN THE UPPER PART AND LIGHT YELLOWISH-FROWN FIRM CHANNERY SILTY CLAY LOAM IN THE LOWER PART. THE SUBSTRATUM FROM 30 TO 35 INCHES IS YELLOWISH-BROWN AND BROWN VERY CHANNERY SILT LOAM. SHALY LIMESTONE IS AT 35 INCHES. THE NOLLVILLE SERIES CONSISTS OF DEEP, WELL DRAINED SOILS ON UPLANDS. THEY FORMED IN RESIDUAL MATERIALS DERIVED FROM ARGILLACEOUS LIMESTONE AND LIMY SHALE NOLLVILLE SOILS ARE ON CONVEX UPLAND RIDGES OF LOW RELIEF. TYPICALLY THESE SOILS HAVE A DARK YELLOWISH BROWN CHANNERY SILT LOAM SURFACE LAYER 10 INCHES THICK. THE SUBSOIL FROM 10 TO 29 INCHES IS YELLOWISH BROWN SILTY CLAY LOAM OR ITS CHANNERY ANALOGUE, AND FROM 29 TO 41 INCHES IS STRONG BROWN SILTY CLAY. THE SUBSTRATUM FROM 41 TO 57 INCHES IS STRONG BROWN VERY CHANNERY SILTY CLAY LOAM. SLOPES RANGE FROM 3 TO 35 PERCENT. Map SpA - Swanpond silt loam, 0 to 3 percent slopes Description Category: SO5 THE SWANPOND SERIES CONSISTS OF VERY DEEP, MODERATELY WELL DRAINED, SLOWLY PERMEABLE SOILS. THEY FORMED IN RESIDUUM WEATHERED FROM CALCAREOUS SHALE AND LIMESTONE ROCK, ON BROAD FLAT SUMMITS, BACKSLOPES, DEPRESSIONS, AND UPLAND DRAINAGE SWALES. TYPICALLY THESE SOILS HAVE A BROWN SURFACE LAYER 12 INCHES THICK. THE SUBSOIL FROM 12 TO 70 INCHES IS A YELLOWISH BROWN CLAY. THE SUBSOILS FROM 70 TO 73 INCHES IS A BROWNISH YELLOW SILTY CLAY. SLOPES RANGE FROM 0 TO 8 PERCENT. Map SsA - Swanpond-Funkstown silt loams, 0 to 3 percent slopes Description Category: SO5
THE SWANPOND SERIES CONSISTS OF VERY DEEP, MODERATELY WELL DRAINED, SLOWLY PERMEABLE SOILS. THEY FORMED IN RESIDUUM WEATHERED FROM CALCAREOUS SHALE AND LIMESTONE ROCK, ON BROAD FLAT SUMMITS, BACKSLOPES, DEPRESSIONS, AND UPLAND DRAINAGE SWALES. TYPICALLY THESE SOILS HAVE A BROWN
5
SURFACE LAYER 12 INCHES THICK. THE SUBSOIL FROM 12 TO 70 INCHES IS A YELLOWISH BROWN CLAY. THE SUBSOILS FROM 70 TO 73 INCHES IS A BROWNISH YELLOW SILTY CLAY. SLOPES RANGE FROM 0 TO 8 PERCENT. THE FUNKSTOWN SERIES CONSISTS OF VERY DEEP, MODERATELY WELL DRAINED, MODERATELY PERMEABLE SOILS ON UPLAND DRAINAGEWAYS AND HEAD SLOPES. THEY FORMED FROM LOCAL ALLUVIAL AND COLLUVIAL MATERIALS OVERLYING LIMESTONE RESIDIUUM. TYPICALLY THE SURFACE IS YELLOWISH BROWN SILT LOAM FROM 0 TO 12 INCHES, FOLLOWED BY STRONG BROWN GRAVELLY SILT LOAM FROM 12 TO 22 INCHES. THE UPPER SUBSOIL IS STRONG BROWN VERY GRAVELLY SILT LOAM FROM 22 TO 30 INCHES. THE LOWER SUBSOIL AND SUBSTRATUM IS YELLOWISH BROWN OR YELLOWISH RED SILTY CLAY LOAM, CLAY LOAM OR SILT LOAM. SLOPE RANGES FROM 0 TO 3 PERCENT.
6
This section of the manual includes material from the NRCS publications From the Surface Down and Field Book for Describing and Sampling Soils, the University of Maryland publication A Guide to Landjudging in Maryland and the GLOBE program’s publication GLOBE 2002 Teachers Guide - Soils Chapter. For more information, citations and websites for these publications are listed at the end of this section.
Overview
Soils are a thin layer on top of most of the earth’s land surface. This thin layer is a basic
natural resource. Soils deeply affect every other part of the ecosystem. They are used by
humans to meet many needs. Soils hold nutrients and water for plants and animals. Water
is filtered and cleansed as it flows through soils. Soils affect the chemistry of water and
the amount of water that returns to the atmosphere to form rain. The food we eat and
most of the material we use for paper, buildings and clothing are dependent on soils.
Much of our life's activities and pursuits are related and influenced by the behavior of the
soil around our houses, roads, septic and sewage disposal systems, airports, parks,
recreation sites, farms, forests, schools, and shopping centers. What is put on the land
should be guided by the soil that is beneath it.
Land is a natural resource as are water and mineral deposits. It is essentially fixed; more
land cannot be made, except what little might be reclaimed from the sea or filled into
water bodies. Much land and its associated soil resources have been misused. Many acres
misused to the point where reclamation is nearly impossible or impractical. As our
population increases and the pressure for land intensifies, it is important that the wisest
use be made of this resource. We can no longer afford to mismanage land and soil.

7
SOIL COMPOSITION
Soils are composed of three main ingredients: minerals of different sizes; organic
materials from the remains of dead plants and animals; and open space that can be filled
with water or air. A good soil for growing most plants should have about 45% mineral
(with a mixture of sand, silt and clay), 5% organic matter, 25% air, and 25% water (fig.
1).
Soils are dynamic and change over time. Some properties, such as temperature and water
content change very quickly. Others, such as mineral transformations, occur very slowly
over hundreds or thousands of years.
Figure 1. The relative proportion of mineral, organic matter, air and water in a soil that is optimum for
growing plants.
Soil Composition
Mineral45%
Water25%
Air25%
Organic Matter
5%

8
FACTORS OF SOIL FORMATION
Soils are natural expressions of the environment in which they were formed. They are
derived from an infinite variety of materials that have been subjected to a wide spectrum
of climatic conditions. Soil development is influenced by the topography on which soils
occur, the plant and animal life which they support and the amount of time which they
have been exposed to these conditions.
Soi1 scientists recognize five major factors that influence soil formation: 1) parent
material, 2) climate, 3) living organisms (especially native vegetation), 4) topography and
5) time. The combined influence of these soil-forming factors determines the properties
of a soil and their degree of expression (fig. 2).
Figure 2. The five factors of soil formation affect the processes that influence soil development.
Parent Material
Parent material refers to organic (such as fresh peat) and mineral material in which soil
formation begins. Mineral material includes partially weathered rock, ash from volcanos,

9
sediments moved and deposited by wind and water, or ground up rock deposited by
glaciers. The material has a strong effect on the type of soil developed as well as the rate
at which development takes place. Soil development may take place quicker in materials
that are more permeable to water. Dense, massive, clayey materials can be resistant to
soil formation processes.
Bedrock such as limestone, sandstone, shale, granite, gneiss and schist, slate, marble and
many others break down into residuum (residue) through the weathering process. It is
this residuum that becomes the parent material of soil and imparts some of the parent
characteristics into the resulting soil profile.
Soil material and rock fragments may fall, roll or slide downslope under the influence of
gravity and water. This incoherent mass of material that generally accumulates on the
lower portion of slopes and in depressions is called colluvium. Rock fragments in
colluvium generally are angular in contrast to the rounded waterworn cobbles and stones
found in alluvium and glacial outwash.
Streams and rivers commonly overflow their banks and deposit fresh materials on the
floodplains. These fresh or recent deposits, commonly topsoil, comprise the parent
materials for the soils developed on these floodplains. Since there is new material added
almost annually, the soils never have time to form well-developed horizons. Therefore,
these young soils have poorly developed profiles, and most of their character is inherited
from the parent material. This type of parent material exceeds 0.5 m (20 in.) in depth, and
it is referred to on the scorecard as recent alluvium.
Soils located on stream terrace positions that contain water worn coarse fragments have
parent materials referred to as old alluvium. These soils were originally deposited by
water and commonly have had time to form well-developed horizons. They never or
rarely flood, and thus are not influenced by deposition of fresh materials.
10
In the Mid-Atlantic region, large areas are underlain by the complex series of water-
deposited sediments left by previous geologic events. These older sediments comprise the
Coastal Plain along the Atlantic seaboard. In Maryland, these materials occupy half of the
land area, and they comprise nearly all the parent material for Delaware soils and large
segments of New Jersey. These Coastal Plain sediments, although much older than the
recent alluvium along streams, have not been cemented and consolidated into bedrock--
thus, the name unconsolidated sediments. Often these sediments have been capped or
coated with a thin (several cm to several m) veneer or sheet of material consisting mainly
of silt (loess). The wind may have carried this material from the glacial outwash areas
before the rise in sea level that formed the Chesapeake Bay. The Coastal Plain soils are
formed in these sediments and silt-cap parent materials. Therefore, soils occurring on the
upland portions of the Coastal Plain are considered to have Coastal Plain sediments as
their parent materials on the scorecard. Recent alluvium can and does occur on the
Coastal Plain in the same landscape positions (along streams and rivers) as in other
sections of the state.
Climate
Climate is a major factor in determining the kind of plant and animal life on and in the
soil. It determines the amount of water available for weathering minerals, transporting the
minerals and releasing elements. Climate, through its influence on soil temperature,
determines the rate of chemical weathering.
Warm, moist climates encourage rapid plant growth and thus high organic matter
production. The opposite is true for cold, dry climates. Organic matter decomposition is
also accelerated in warm, moist climates. Under the control of climate freezing, thawing,
wetting, and drying break parent material apart.
Rainfall causes leaching. Rain dissolves some minerals, such as carbonates, and
transports them deeper into the soil. Some acid soils have developed from parent

11
materials that originally contained limestone. Rainfall can also be acid, especially
downwind from industrial processes.
Living organisms
Plants affect soil development by supplying upper layers with organic matter, recycling
nutrients from lower to upper layers, and helping to prevent erosion. In general, deep
rooted plants contribute more to soil development than shallow rooted plants because the
passages they create allow greater water movement, which in turn aids in leaching.
Leaves, twigs, and bark from large plants fall onto the soil and are broken down by fungi,
bacteria, insects, earthworms, and burrowing animals. These organisms eat and break
down organic matter releasing plant nutrients. Some change certain elements, such as
sulfur and nitrogen, into usable forms for plants.
Microscopic organisms and the humus they produce act as a kind of glue to hold soil
particles together in aggregates. Well-aggregated soil is ideal for providing the right
combination of air and water to plant roots.
Animals living in the soil affect decomposition of waste materials and how soil materials
will be moved around in the soil profile.
Landscape position
Landscape position causes localized changes in moisture and temperature. When rain
falls on a landscape, water begins to move downward by the force of gravity, either
through the soil or across the surface to a lower elevation. Even though the landscape has
the same soil-forming factors of climate, organisms, parent material, and time, drier soils
at higher elevations may be quite different from the wetter soils where water
accumulates. Wetter areas may have reducing conditions that will inhibit proper root
growth for plants that require a balance of soil oxygen, water, and nutrients.
12
Steepness, shape, and length of slope are important because they influence the rate at
which water flows into or off the soil. If unprotected, soils on slopes may erode leaving a
thinner surface layer. Eroded soils tend to be less fertile and have less available water
than uneroded soils of the same series.
Aspect affects soil temperature. Generally, for most of the continental United States, soils
on north-facing slopes tend to be cooler and wetter than soils on south-facing slopes.
Soils on north-facing slopes tend to have thicker A and B horizons and tend to be less
droughty.
Position
Position generally refers to the point on the landscape where the soil is located. Most soil
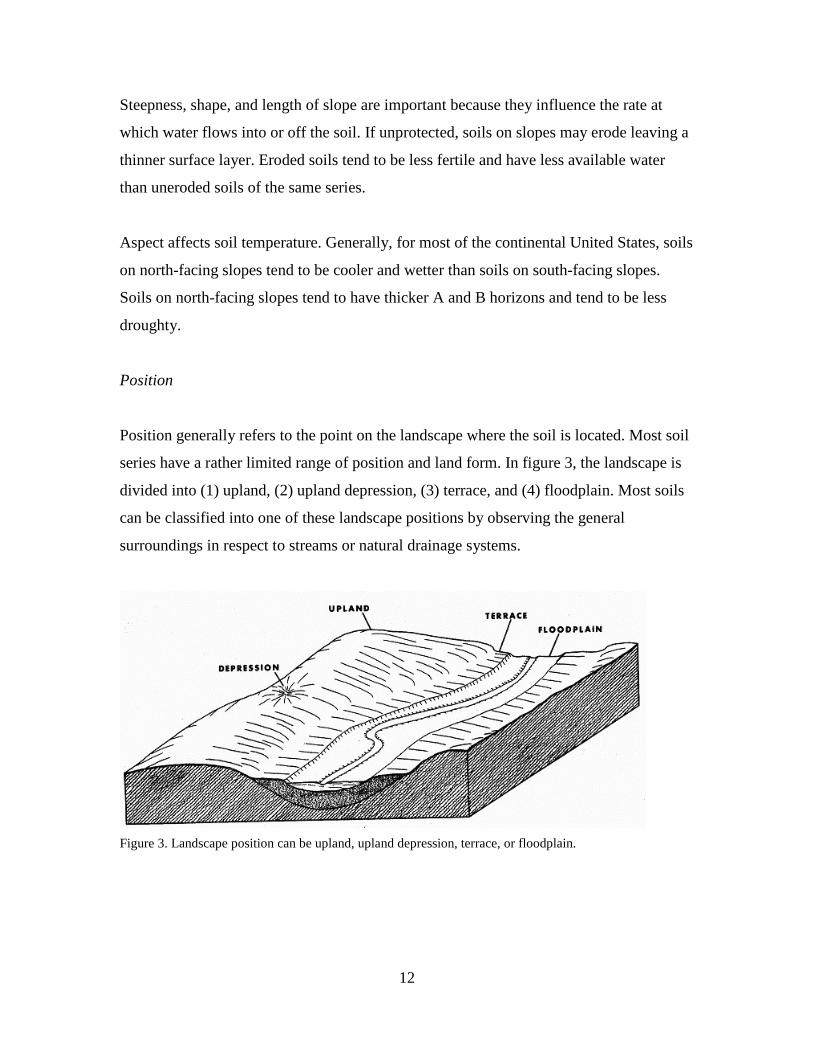
series have a rather limited range of position and land form. In figure 3, the landscape is
divided into (1) upland, (2) upland depression, (3) terrace, and (4) floodplain. Most soils
can be classified into one of these landscape positions by observing the general
surroundings in respect to streams or natural drainage systems.
Figure 3. Landscape position can be upland, upland depression, terrace, or floodplain.

13
The floodplains refer to areas near streams that flood periodically. These soils may be
quite productive, but they have a flooding hazard that seriously limits their use for urban
development or agriculture. Terrace refers to soils developed in older alluvial materials
above the zone of current flooding. Upland depressions or waterways refer to soils
developed on concave land forms or at the heads of drainage ways and along waterways
where surface drainage is retarded. Water tends to pond in these depressions, and the
soils commonly have a darker and thicker surface horizon because of organic matter
accumulations. Areas unaffected by stream activity in recent geologic time, and
ordinarily lying at higher elevations (than alluvial plains) on rolling and convex positions,
are designated upland.
Slope Characteristics
Slope generally is expressed as a percentage that is calculated by dividing the difference
in elevation between two points by the horizontal distance and multiplying by 100. For
example, a 10 percent slope would have a 10-foot drop per 100 horizontal feet. The
percent slope can be estimated visually, but the Abney level, or a similar type of
instrument, is used for more precise measurements.
Slope classes are used for interpretive purposes. The classes are nearly level, gently
sloping, strongly sloping, moderately steep, steep and very steep. The range in
percentages for these classes will vary depending on the topography of the area. Because
of contrasting landscapes, two divisions are used in establishing limits for the slope
classes in Maryland: (1) the Coastal Plain and (2) a combination formed by the
Appalachian and Piedmont provinces. The slope classes and appropriate ranges of
percent for the two divisions are shown in table 1.

14
Table 1. Slope classes for Maryland’s Coastal Plain and Piedmont-Appalachian provinces and their
corresponding letter designations in the soil survey.
Slope Class Coastal Plain Piedmont-Appalachian Soil Survey
Percentage Percentage Letter Designation
Nearly level 0-2 0-3 A
Gently sloping 2-5 3-8 B
Strongly sloping 5-10 8-15 C
Moderately steep 10-15 15 25 D
Steep 15-25 25-50 E
Very steep 25+ 50+ F
Time
Time is required for horizon formation. The longer a soil surface has been exposed to soil
forming agents like rain and growing plants, the greater the development of the soil
profile. Soils in recent alluvial or windblown materials or soils on steep slopes where
erosion has been active may show very little horizon development.
Soils on older, stable surfaces generally have well defined horizons because the rate of
soil formation has exceeded the rate of geologic erosion or deposition. As soils age, many
original minerals are destroyed and many new ones are formed. Soils become more
leached, more acid, and more clayey. In many well drained soils, the B horizons tend to
become redder with time.
SOIL FORMING PROCESSES
The four major processes that change parent material into soil are additions, losses,
translocations, and transformations.

15
Additions
The most obvious addition is organic matter. As soon as plant life begins to grow in fresh
parent material, organic matter begins to accumulate. Organic matter gives a black or
dark brown color to surface layer. Most organic matter additions to the surface increase
the cation exchange capacity and nutrients, which also increase plant nutrient availability.
Other additions may come with rainfall or deposition by wind, such as the wind blown or
eolian material. On the average, rainfall adds about 5 pounds of nitrogen per acre per
year. By causing rivers to flood, rainfall is indirectly responsible for the addition of new
sediment to the soil on a flood plain.
Losses
Most losses occur by leaching. Water moving through the soil dissolves certain minerals
and transports them into deeper layers. Some materials, especially sodium salts, gypsum,
and calcium carbonate, are relatively soluble. They are removed early in the soil's
formation. As a result, soil in humid regions generally does not have carbonates in the
upper horizons. Quartz, aluminum, iron oxide, and kaolinitic clay weather slowly. They
remain in the soil and become the main components of highly weathered soil.
Fertilizers are relatively soluble, and many, such as nitrogen and potassium, are readily
lost by leaching, either by natural rainfall or by irrigation water. Long- term use of
fertilizers based on ammonium may cause acidity in the soil and contribute to the loss of
carbonates in some areas.
Oxygen, a gas, is released into the atmosphere by growing plants. Carbon dioxide is
consumed by growing plants, but lost to the soil as fresh organic matter decays. When
soil is wet, nitrogen can be changed to a gas and lost to the atmosphere.

16
Solid mineral and organic particles are lost by erosion. Such losses can be serious
because the material lost is usually the most productive part of the soil profile. On the
other hand, the sediment relocated to lower slope positions or deposited on bottom lands
has the potential to increase or decrease productive use of soils in those areas.
Translocations
Translocation means movement from one place to another. In low rainfall areas, leaching
often is incomplete. Water starts moving down through the soil, dissolving soluble
minerals as it goes. There isn't enough water, however, to move all the way through the
soil. When the water stops moving, then evaporates, salts are left behind. Soil layers with
calcium carbonate or other salt accumulations form this way. If this cycle occurs enough
times, a calcareous hardpan can form.
Translocation upward and lateral movement is also possible. Even in dry areas, low-lying
soils can have a high water table. Evaporation at the surface causes water to move
upward. Salts that are dissolved in solution will move upward with the water and deposit
on the surface as the water evaporates.
Transformations
Transformations are changes that take place in the soil. Microorganisms that live in the
soil feed on fresh organic matter and change it into humus. Chemical weathering changes
parent material. Some minerals are destroyed completely. Others are changed into new
minerals. Many of the clay-sized particles in soil are actually new minerals that form
during soil development.
Other transformations can change the form of certain materials. Iron oxides (ferric form)
usually give soils a yellowish or reddish color. In waterlogged soils, however, iron oxides
lose some of their oxygen and are referred to as being reduced. The reduced form of iron

17
(ferrous) is quite easily removed from the soil by leaching. After the iron is gone,
generally the leached area has a grayish or whitish color.
Repeated cycles of saturation and drying create a mottled soil (splotches of colored soil in
a matrix of different color). Part of the soil is gray because of the loss of iron, and part is
a browner color where the iron oxide is not removed. During long periods of saturation,
gray lined root channels develop. This may indicate a possible loss of iron or an addition
of humus from decayed roots.

18
SOIL FEATURES
There are many properties or features that describe and characterize soils (fig. 4). Some
of these features (such as color, texture and depth) are relatively easy to record while
others require very sophisticated equipment and highly technical procedures (such as
chemical data and mineralogical analysis).
Figure 4. Soil properties that can influence use and management of land.
The Soil Profile
Due to the interactions of the five soil-forming factors, soils differ greatly. Each section
of soil on a landscape has its own unique characteristics. The way a soil looks if you cut a
section of it out of the ground is called a soil profile. When you learn to interpret it, the
profile can tell you about the geology and climate history of the landscape over thousands
of years, the archeological history of how humans used the soil, what the soil properties
are used today, and the best way to use the soil. In a sense, each soil profile tells a story
about the location where it was found.
SOIL Physical
Properties
Water Supplying Capacity Wetness Nutrient
Supplying Capacity
Texture
Chemical Properties
Slope Climate
Vegetation
Erosion
Overflow
19
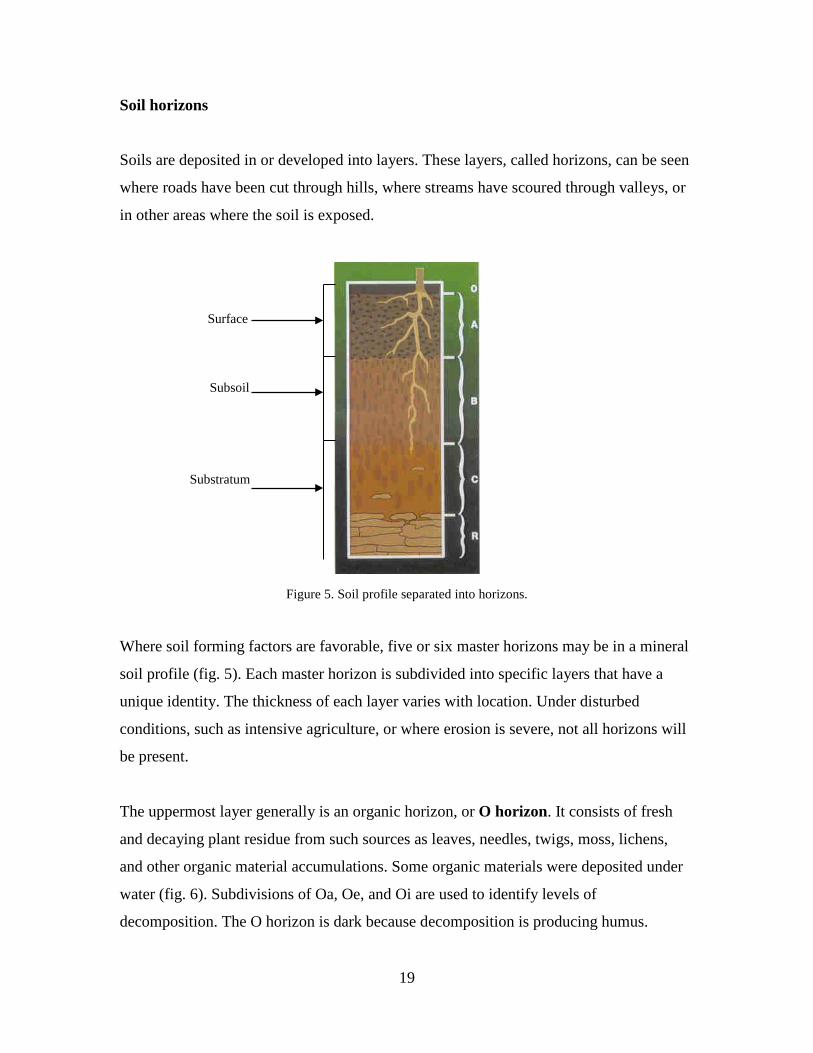
Soil horizons
Soils are deposited in or developed into layers. These layers, called horizons, can be seen
where roads have been cut through hills, where streams have scoured through valleys, or
in other areas where the soil is exposed.
Surface
Subsoil
Substratum
Figure 5. Soil profile separated into horizons.
Where soil forming factors are favorable, five or six master horizons may be in a mineral
soil profile (fig. 5). Each master horizon is subdivided into specific layers that have a
unique identity. The thickness of each layer varies with location. Under disturbed
conditions, such as intensive agriculture, or where erosion is severe, not all horizons will
be present.
The uppermost layer generally is an organic horizon, or O horizon. It consists of fresh
and decaying plant residue from such sources as leaves, needles, twigs, moss, lichens,
and other organic material accumulations. Some organic materials were deposited under
water (fig. 6). Subdivisions of Oa, Oe, and Oi are used to identify levels of
decomposition. The O horizon is dark because decomposition is producing humus.

20
Figure 6. Profile on the left shows an Oi horizon at the surface; an organic horizon with little
decomposition. Profile to the right shows an Oa horizon; an organic horizon that is highly decomposed.
Figure 7. The soil profile to the right shows a well drained soil with an A horizon from the surface to a
depth of 5 cm (2 in.). The measuring tape is in feet. The middle soil profile is a somewhat poorly drained
soil with the top of the gray due to wetness occurring at 40 cm (16 in.). Tape measure is in meters. The
middle soil profile has a buried A horizon starting at 1 m (40 in.). The soil profile to the left is moderately
well drained with an Ap horizon from the surface to 20 cm (8 in.).
A horizon
Ab horizon
Ap horizon
Oi horizon
21
Below the O horizon is the A horizon. The A horizon is mainly mineral material. It is
generally darker than the lower horizons because of the varying amounts of humified
organic matter (fig. 7). It is the horizon of maximum biological activity. This horizon is
where most root activity occurs and is usually the most productive layer of soil. It may be
referred to as a surface layer in a soil survey. An A horizon that has been buried beneath
more recent deposits is designated as an "Ab" horizon (fig. 7). An A horizon that has
been plowed or otherwise manipulated is an Ap horizon (fig. 7).
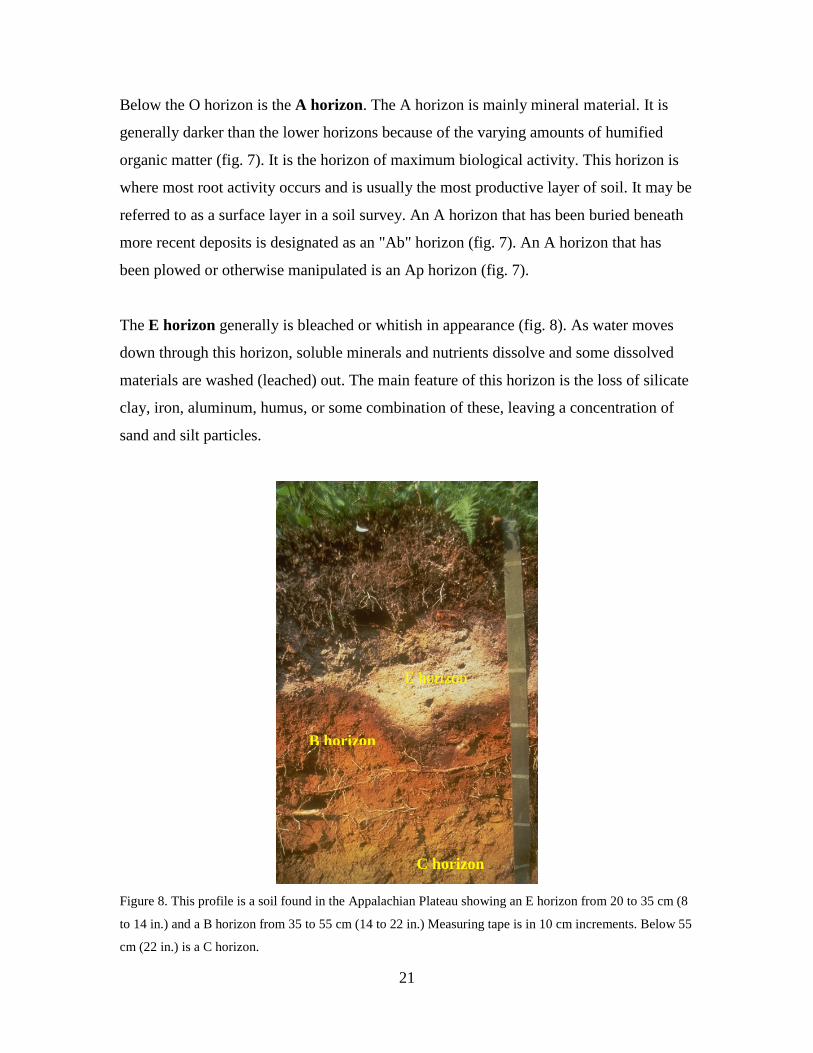
The E horizon generally is bleached or whitish in appearance (fig. 8). As water moves
down through this horizon, soluble minerals and nutrients dissolve and some dissolved
materials are washed (leached) out. The main feature of this horizon is the loss of silicate
clay, iron, aluminum, humus, or some combination of these, leaving a concentration of
sand and silt particles.
Figure 8. This profile is a soil found in the Appalachian Plateau showing an E horizon from 20 to 35 cm (8
to 14 in.) and a B horizon from 35 to 55 cm (14 to 22 in.) Measuring tape is in 10 cm increments. Below 55
cm (22 in.) is a C horizon.
E horizon
B horizon
C horizon

22
Below the A or E horizon is the B horizon, or subsoil (fig. 8). The B horizon is usually
lighter colored, denser, and lower in organic matter than the A horizon. It commonly is
the zone where leached materials accumulate. The B horizon is further defined by the
materials that make up the accumulation, such as "t" in the form of "Bt", which identifies
that clay has accumulated. Other illuvial concentrations or accumulations include iron,
aluminum, humus, carbonates, gypsum, or silica. Soil not having recognizable
concentrations within B horizons but show color or structural differences from adjacent
horizons is designated "Bw".
Still deeper is the C horizon or substratum (fig. 8). The C horizon may consist of less
clay, or other less weathered sediments. Partially disintegrated parent material and
mineral particles are in this horizon. Some soils have a soft bedrock horizon that is given
the designation Cr. C horizons described as "2C" consist of different material, usually of
an older age than horizons which overlie it.
The lowest horizon, the R horizon, is bedrock (fig. 9). Bedrock can be within a few
centimeters of the surface or many meters below the surface. Where bedrock is very deep
and below normal depths of observation, an R horizon is not described.
Figure 9. This soil profile has 110 cm (44 in.) of unconsolidated soil material over hard bedrock.
R horizon

23
Generally, soil horizons are found in the order presented (fig. 10). However, a soil profile
may lack certain horizons or have horizons out of order due to factors that influenced that
soil’s development. For example, a soil profile may lack E and B horizons if it is a young
soil that has not had the time for an E and B horizon to develop. Or, a soil may have a
buried A horizon if that soil has had material deposited on top of what was once the soil
surface (fig. 7). This may occur on flood plains after a flooding event deposits sediments,
because of erosion deposition, or because man has deposited material on top of the soil.
O horizon – Organic material
A horizon – Mineral material high in organic matter
E horizon – Horizon of maximum eluviation
(leaching)
EB or BE horizon – transitional horizon from E
to B horizon
B horizon – zone of illuviation (accumulation), maximum
soil development
BC or CB horizon – transitional horizon from B
to C horizon
C Horizon – unconsolidated mineral horizon with little
weathering
R horizon – hard bedrock
Figure 10. Common horizons designations and the order in which they are most commonly found.
Color
To the casual observer, color is the most noticeable soil property. Maryland soils vary in
color from red, yellow and brown to gray in the subsoil (B horizon) and from black to
very light gray in the topsoil (A horizon). Color is a significant indicator of several soil
properties, including the organic matter content and drainage condition. The three
components that have the most affect on soil color are organic compounds (usually black
or dark brown), iron oxides (usually red, orange or yellow) and the color of the mineral
grains (usually gray).
0
10
in.
20
30
40
50
60
Undisturbed Forested Soil Cultivated Soil
Ap

24
Black or very dark colors in the A horizon suggest relatively high organic matter
contents. Most cultivated Maryland soils have organic matter in their plow layer ranging
between 1 and 4 percent by weight. In some poorly drained soils, the organic matter
content will reach 10 percent and higher. Generally, the darker the A horizon the higher
the organic matter content. In Maryland, this generalization can be taken a step further; a
deep, dark colored A horizon indicates the soil was formed under very poorly drained
conditions. Organic matter enhances soil tilth (physical condition) or structure and is a
natural nitrogen supplier under favorable conditions. As the organic matter content
decreases, the color is determined more by the mineral components of the horizon. Pale
colors indicate that the horizon has low organic matter content (fig. 11).
Figure 11. The soil profile on the left has a dark surface high in organic matter, while the soil profile on the
right has a pale surface low in organic matter. The measuring tapes are in meters.
25
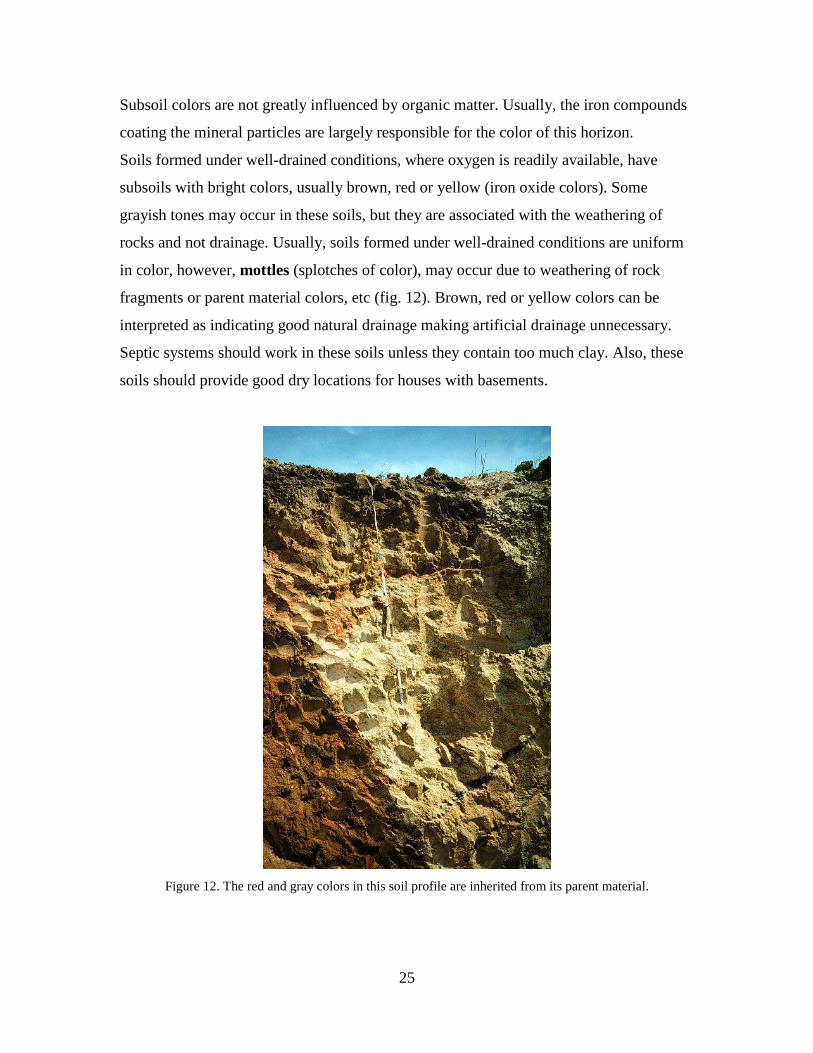
Subsoil colors are not greatly influenced by organic matter. Usually, the iron compounds
coating the mineral particles are largely responsible for the color of this horizon.
Soils formed under well-drained conditions, where oxygen is readily available, have
subsoils with bright colors, usually brown, red or yellow (iron oxide colors). Some
grayish tones may occur in these soils, but they are associated with the weathering of
rocks and not drainage. Usually, soils formed under well-drained conditions are uniform
in color, however, mottles (splotches of color), may occur due to weathering of rock
fragments or parent material colors, etc (fig. 12). Brown, red or yellow colors can be
interpreted as indicating good natural drainage making artificial drainage unnecessary.
Septic systems should work in these soils unless they contain too much clay. Also, these
soils should provide good dry locations for houses with basements.
Figure 12. The red and gray colors in this soil profile are inherited from its parent material.

26
When these bright colors are mixed with areas of gray (color of the mineral grains) the
soil developed under conditions of imperfect drainage. The mixed pattern, called
redoximorphic features, indicates that the soil is saturated with water for significant
periods during the year (fig. 13). This pattern is caused when iron is reduced due to
wetness and moved leaving splotches where of gray colors where the mineral grains have
been stripped of iron. Artificial drainage usually is necessary for good crop production
and septic systems are subject to periodic failure when installed in these soils.
Figure 13. The red and gray colors in these soil profiles are due to wetness. These splotches of colors due to
wetness are called redoximorphic features. The soil profiled and the left has a predominance of gray due to
the loss of iron starting close to the bottom of the spade. The soil on the right has a predominance of red
with gray splotches starting at 1 m (40 in.). The measuring tape for the profile on the right is in meters.
When gray (color of the mineral grains) predominates with only streaks and spots of
brighter colors (redoximorphic features) the soil was formed under poorly drained
conditions. The spots of brighter colors are where the iron has re-oxidized forming spots

27
similar to rust. These soils are called hydric soils, soil that have a water table near the
surface for significant periods of time. Artificial drainage is necessary for crop
production, and these soils are poor building sites, especially where septic systems are
needed.
Figure 14. This soil profile is a hydric soil. The predominance of gray colors with splotches of red near the
soil surface demonstrates the typical pattern of redoximorphic features found in a hydric soil.
When determining colors, make sure that the soil is moist. Moistened soil better
illustrates color variations, making it easier to distinguish one horizon from another. Soil
scientists use standard color (Munsell) charts to determine color (fig. 15); this permits
uniformity and eliminates some of the human variable. According to the chart, a soil
horizon described as yellowish-brown in Maryland has exactly the same color as a
yellowish-brown horizon in California.

28
Figure 15. The Munsell soil color book is used to standardize soil color designations.
Organic vs. mineral soil material
Organic soil contains high amounts of organic matter. Organic soil material will be very
dark in color, contain fibers, and will feel greasy when rubbed. Organic soil material is
usually found at the soil surface, where leaves, twigs, and other sources of organics
accumulate. When observing organic soil material, you may be able to readily identify
leaves and twigs and other sources of organics. This is relatively undecomposed and is
considered to be peat. If the source of organics is not easily identified the organic matter
is more highly decomposed and would be considered mucky-peat (intermediate
decomposition) or muck (high decomposition).
Mineral soil texture (USDA)
Texture is determined by the relative proportion of sand, silt, and clay (mineral material
<2mm in diameter). Sands range in size from 2 millimeters (very coarse) to 0.05
millimeter (very fine); silts range from 0.05 to 0.002 millimeter and clays are less than
0.002 millimeter. Figure 16 illustrates the relative sizes between the three major particles.
Particles larger than 2 millimeters, such as gravel, stones and coarse fragments are

29
considered as modifiers of soil texture, but are not included in the textural class. Coarse-
textured (light) soils are composed predominantly of sand particles. Fine-textured (heavy)
soils are dominated by clay particles. Medium-textured soils, such as loams, are
characterized by having sand, silt and clay in such proportions as to exert nearly equal
influence on the character of the soil.
Figure 16. The relative sizes of sand silt and clay.
Soil texture is very important; it influences a soil’s available water capacity; tilth; ease of
tillage; resistance or susceptibility to erosion; drainage and permeability; and capacity to
absorb and release nutrients. Therefore, texture exerts a profound influence on soil
productivity and management requirements.
Sand particles can be distinguished by the naked eye. The coarse silt fraction can be seen
under a low-power magnifying glass, but individual clay particles are so fine that only
electron microscopes can reveal them.
Soil texture can be determined in the lab by measuring the proportion of sand, silt and
clay. A textural triangle (fig. 17) is used to determine the texture once the proportion of
sand, silt and clay are known. However, soil scientists need a quick method for
determining soil texture in the field. This is done by feel. Moistening the soil and rubbing
it between the thumb and forefinger permit a close textural class estimate (fig. 18). By
employing this method, even the beginning student can acquire the skill of determining
several textural classes. (Remember to use only less than the 2-millimeter material.)
Usually, the subsoil in most Maryland soils will contain more clay than the surface

30
Figure 17. Textural triangle used to determine texture of soil once proportion of sand, silt and clay are
known.
soil. Thus, the surface or A horizon may be classed as 'coarse' or 'medium' while the
subsoil might be classed as 'medium', 'moderately fine' or 'fine'. Many moderately fine- or
fine-textured soils do not allow water to percolate very rapidly, making them poorly
suited for septic systems.
Coarse. Coarse-textured soils feel gritty and do not hold together when moist. The sand
and loamy sand soils belong in this group. They tend to be droughty and very permeable.
However, these soils may contain enough silt and clay to provide some available water
and nutrient holding capacity. Thus, under ideal rainfall or irrigation, these soils
commonly are used for agriculture. They are preferred for early spring truck crops

31
because they drain quickly (where water tables are not high) and warm rapidly. Irrigation
commonly is practiced to ensure timely watering. Where drainage is good, these soils
provide adequate sites for septic systems although renovation of the wastewater and
ground water contamination may be a problem.
Moderately Coarse. Moderately coarse-textured soils feel gritty but they hold together
in a ball or when rolled out under gentle pressure. The sandy loam soils fall into this
textural category. These soils hold more water than the coarse-textured soils, but they
also are commonly irrigated since they do not have the available water capacity of the
medium-textured soils. Moderately coarse-textured soils are highly desirable for crop
production, and they also make excellent building sites when well drained.
Medium. Medium-textured soils, such as loams, silt loams and sandy clay loams contain
significant proportions of sand, silt and clay. When rubbed between the fingers, medium-
textured soils feel smooth but not sticky. A ribbon tends to form when a moistened
sample is rubbed out, but this ribbon breaks apart because of insufficient quantities of
clay. These textures provide good water and nutrient supplying capacities, and they are
usually the most productive agricultural soils. Septic systems usually are long lived if
these soils are well drained.
Moderately Fine. Moderately fine-textured soils such as silty clay loams and clay loams
contain between 27 to 40 percent clay. When moist, these soils feel slightly sticky and are
slightly plastic. When a sample is rubbed between the thumb and forefinger, a ribbon can
be formed. The more clay that is present the stickier the sample and the longer and more
flexible the ribbons.
Fine. Fine-textured soils are those containing greater than 40 percent clay. When moist
samples are rubbed between the forefinger and thumb, a ribbon can be formed. This
ribbon will feel stiff and usually has a very shiny appearance. These soils feel sticky or
very sticky when moist. Fine-textured soils harden and form clods when dry and are
puddled easily if worked when wet. For this reason, they are very difficult to manage and

32
are not the best agricultural soils or best soils for building sites that require septic
systems.
Rock fragments
Rock fragment is used as a texture modifier. The size and percentage of rock fragments in
the soil are important to land use. Rock fragments within soil layers reduce the amount of
water available for plant use and may restrict some tillage operations. Particles larger
than 2 millimeters (0.08 in) in diameter are called rock fragments (fig. 19). The following
is a list of gravel types.
• Rounded
– Gravel >2 to 75 mm diameter (0.08 to 3 in.)
– Cobbles >75 to 250 mm diameter (3 to 10 in.)
– Stones >250 to 600 mm diameter (10 to 25 in.)
– Boulders >600 mm diameter (>25 in.)
• Flat
– Channers >2 to 150 mm long (0.08 to 6 in.)
– Flagstones >150 to 380 mm long (6 to 15.2 in.)
– Stones >380 to 600 mm long (15.2 to 25 in.)
– Boulders >600 mm long (>25 in.)
Figure 19. This soil profile contains cobble size rock fragments in a high enough concentration to put an
extremely cobbly modifier on the texture.
33
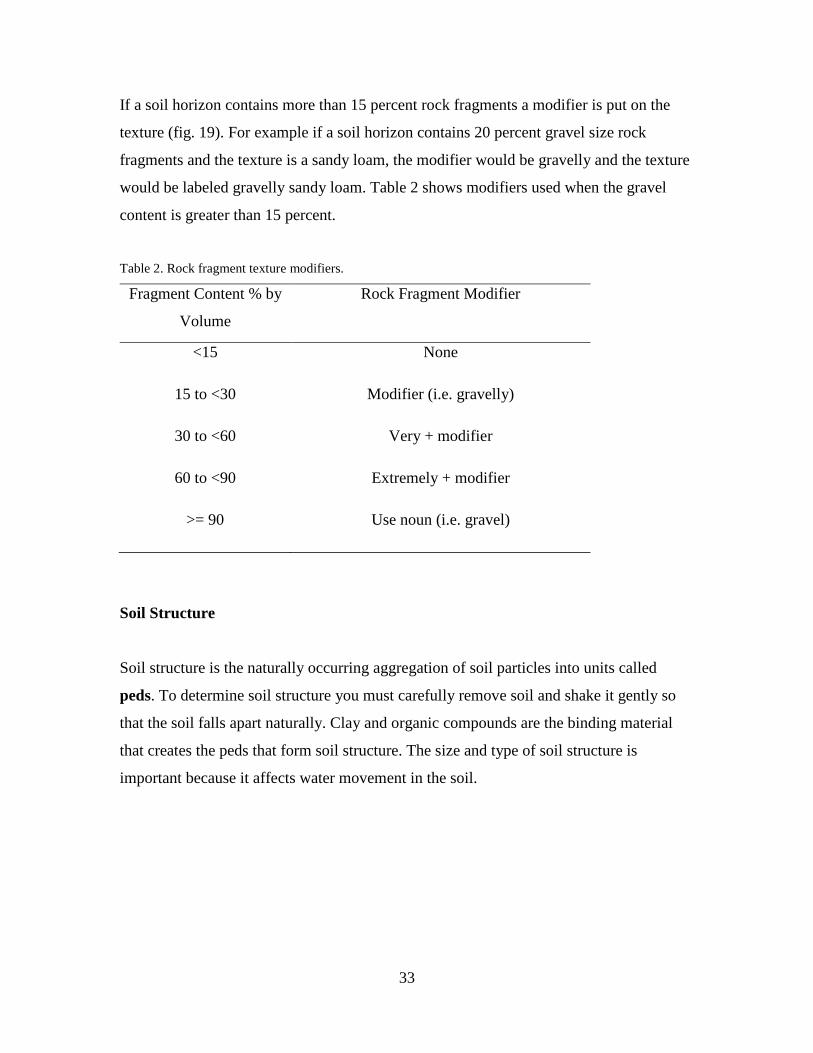
If a soil horizon contains more than 15 percent rock fragments a modifier is put on the
texture (fig. 19). For example if a soil horizon contains 20 percent gravel size rock
fragments and the texture is a sandy loam, the modifier would be gravelly and the texture
would be labeled gravelly sandy loam. Table 2 shows modifiers used when the gravel
content is greater than 15 percent.
Table 2. Rock fragment texture modifiers.
Fragment Content % by
Volume
Rock Fragment Modifier
<15 None
15 to <30 Modifier (i.e. gravelly)
30 to <60 Very + modifier
60 to <90 Extremely + modifier
>= 90 Use noun (i.e. gravel)
Soil Structure
Soil structure is the naturally occurring aggregation of soil particles into units called
peds. To determine soil structure you must carefully remove soil and shake it gently so
that the soil falls apart naturally. Clay and organic compounds are the binding material
that creates the peds that form soil structure. The size and type of soil structure is
important because it affects water movement in the soil.
34
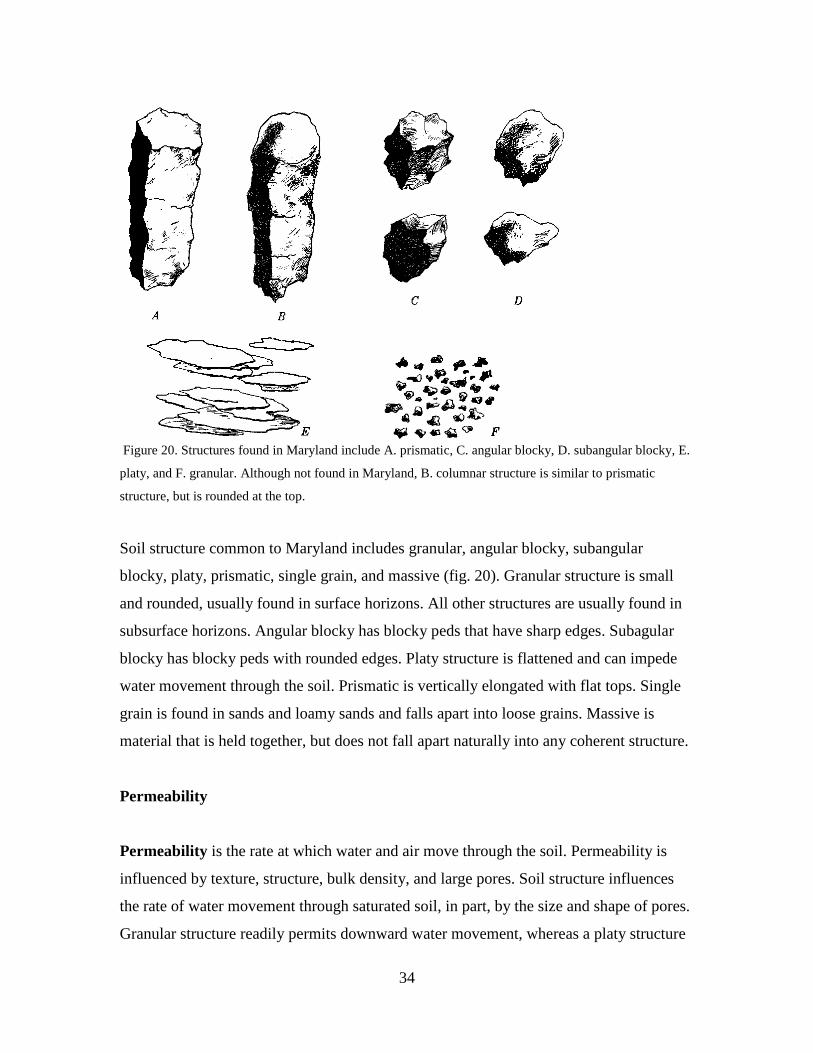
Figure 20. Structures found in Maryland include A. prismatic, C. angular blocky, D. subangular blocky, E.
platy, and F. granular. Although not found in Maryland, B. columnar structure is similar to prismatic
structure, but is rounded at the top.
Soil structure common to Maryland includes granular, angular blocky, subangular
blocky, platy, prismatic, single grain, and massive (fig. 20). Granular structure is small
and rounded, usually found in surface horizons. All other structures are usually found in
subsurface horizons. Angular blocky has blocky peds that have sharp edges. Subagular
blocky has blocky peds with rounded edges. Platy structure is flattened and can impede
water movement through the soil. Prismatic is vertically elongated with flat tops. Single
grain is found in sands and loamy sands and falls apart into loose grains. Massive is
material that is held together, but does not fall apart naturally into any coherent structure.
Permeability
Permeability is the rate at which water and air move through the soil. Permeability is
influenced by texture, structure, bulk density, and large pores. Soil structure influences
the rate of water movement through saturated soil, in part, by the size and shape of pores.
Granular structure readily permits downward water movement, whereas a platy structure

35
requires water to flow over a much longer and slower path (fig. 21). Permeability is used
in drainage design, irrigation scheduling, and many conservation practices. Permeability
classes are shown in table 3.
Figure 21. Paths of water flow through soils with granular, prismatic, subangular blocky, and platy
structure, respectively
Table 3. Permeability classes
Class Rate (in/hr)
Very slow <0.06
Slow 0.06-0.02
Moderately slow 0.02-0.6
Moderate 0.6-2.0
Moderately rapid 2.0-6.0
Rapid 6.0-20
Very rapid >20
Depth
The depth of a soil is considerably important both for agricultural and nonagricultural
uses. A shallow-rooted crop may produce equally well on either a deep or shallow soil.
However, deeply rooted plants such as trees or alfalfa require deep soils for best growth.
During droughty periods, crops on shallow soils usually are the first to show damage
because of the lack of moisture. This results from a soil volume that cannot hold
adequate water.
36
Houses with basements or septic systems should be built on deep, well-drained soils. The
lack of deep soil may necessitate a house with a slab or shallow foundation, and a septic
system may not be functional or permitted on such soils.
Shallow soils restrict plant growth by impeding root growth and provide only limited
water and nutrient re-serves. The processes of soil formation may have been such that
only a thin veneer of soil has formed over a very hard or resistant parent material.
Erosion may have reduced the thickness of a once-deep soil. Coarse gravel and sand
layers also can impede root penetration as can sustain high water tables. In addition,
root-restricting horizons or pans may have been formed during soil formation.
Most of the better agricultural soils in Maryland have a thickness of at least 1 m (40 in.).
These soils are considered deep for agricultural and judging purposes. A soil that has a
thickness of greater than 1.5 m (60 in.) is very deep. Any soil possessing a root-restricting
horizon at a depth of less than 0.5 m (20 in.) is considered shallow (fig. 22). Moderately
deep soils are those between these two extremes.
In summary, the categories of soil depth are:
Very deep ...................... greater than 1.5 m (greater than 60 in.)
Deep ............................... 1 to 1.5 m (40 to 60 in.)
Moderately deep............. 0.5 to 1 m (20 to 40 in.)
Shallow .......................... 0.25 to 0.5 m (10 to 20 in.)
Very shallow .................. less than 0.25 m (less than 10 in.)
37
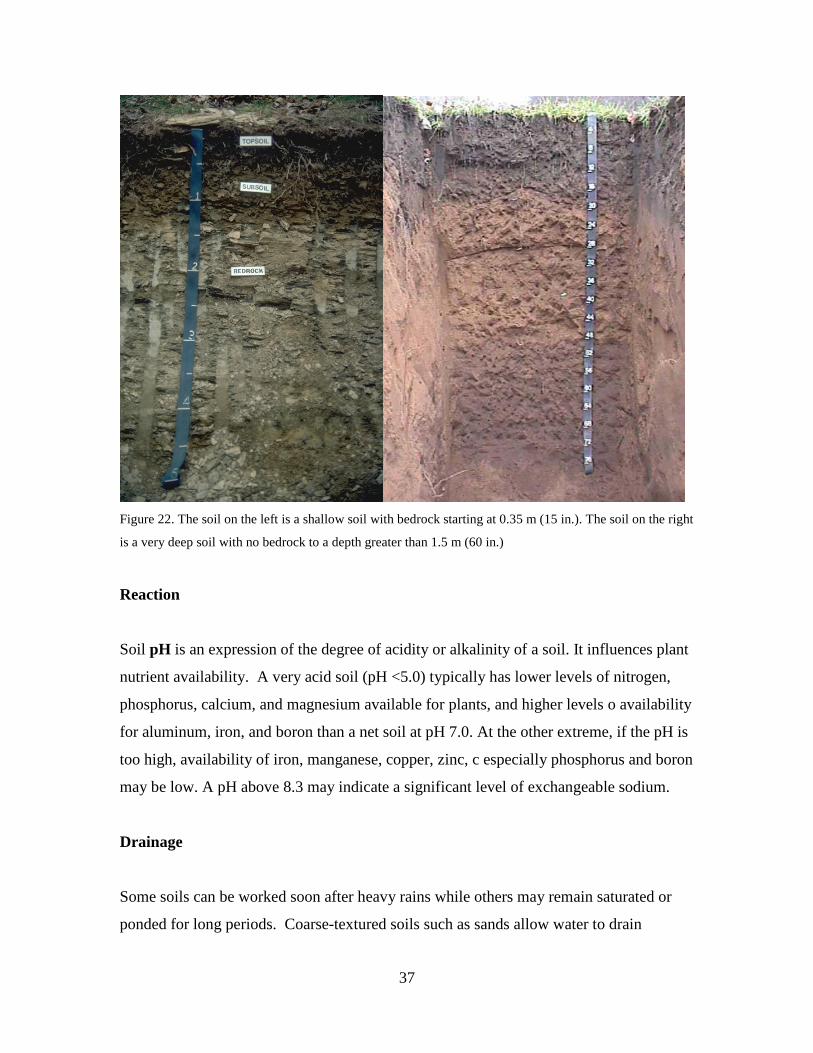
Figure 22. The soil on the left is a shallow soil with bedrock starting at 0.35 m (15 in.). The soil on the right
is a very deep soil with no bedrock to a depth greater than 1.5 m (60 in.)
Reaction
Soil pH is an expression of the degree of acidity or alkalinity of a soil. It influences plant
nutrient availability. A very acid soil (pH <5.0) typically has lower levels of nitrogen,
phosphorus, calcium, and magnesium available for plants, and higher levels o availability
for aluminum, iron, and boron than a net soil at pH 7.0. At the other extreme, if the pH is
too high, availability of iron, manganese, copper, zinc, c especially phosphorus and boron
may be low. A pH above 8.3 may indicate a significant level of exchangeable sodium.
Drainage
Some soils can be worked soon after heavy rains while others may remain saturated or
ponded for long periods. Coarse-textured soils such as sands allow water to drain

38
through the soil very rapidly if outlets are available. Moderately coarse-, medium-,
moderately fine-, and fine-textured soils on similar landscape positions usually require
correspondingly longer periods before they can be worked. Soils on extensive level areas
or those in depressions commonly are poorly drained, and water tables may be at or near
the surface for a long time.
Plants require good aeration as well as moisture for optimum growth. Soils that are
excessively drained (such as sand) are well aerated but dry out quickly thus restricting
crop production. Poorly drained soils that are not artificially drained retard crop
production because long periods of water saturation starve roots of required oxygen.
Also, these soils do not warm readily in the spring. Thus, the best agricultural soils are
those that are deep and allow excess water to readily pass through the profile while
retaining enough water to supply crops until the next rain.
Soils that are deep, well drained, moderately coarse and medium textured are preferred
for agricultural production because they have a very desirable air-water relationship for
many crops. These soils are about half mineral and organic material and half pore space.
Ideal conditions exist when approximately half of this pore space is filled with water and
half with air. Of course, these proportions fluctuate with the rainfall pattern. Coarse-
textured soils (such as sand) contain a much greater proportion of air than water in this
pore space, and they must be irrigated for good crop production. On the other hand, fine-
textured soils (such as clay) possess a higher proportion of water than air in the pore
space.
Well-drained soils also are preferred for many nonagricultural uses. Home sites and
housing developments should be located in well-drained soils, especially if basements are
to remain dry and septic systems are to function efficiently.
One of the best indicators of drainage class is soil color. The more redoximorphic
features (mottling due to wetness) and gray in the subsoil, the poorer the soil drainage,
the longer and higher the water tables stand in a soil profile, the more intense is the
39
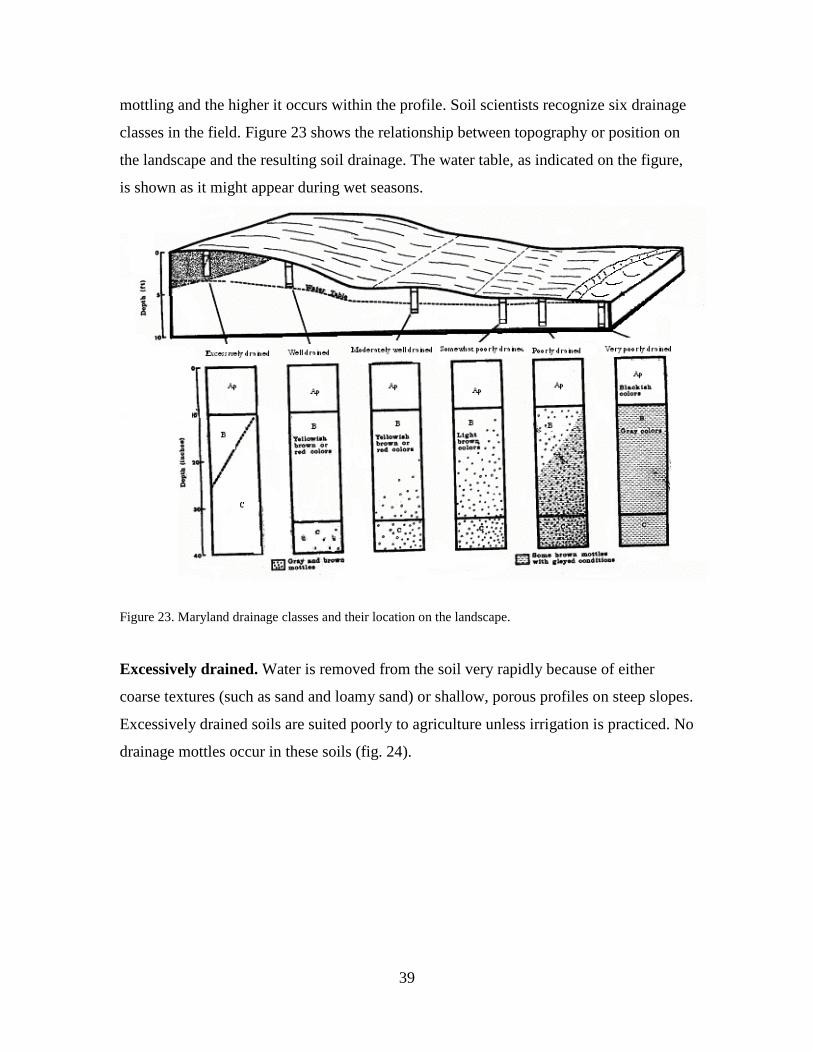
mottling and the higher it occurs within the profile. Soil scientists recognize six drainage
classes in the field. Figure 23 shows the relationship between topography or position on
the landscape and the resulting soil drainage. The water table, as indicated on the figure,
is shown as it might appear during wet seasons.
Figure 23. Maryland drainage classes and their location on the landscape.
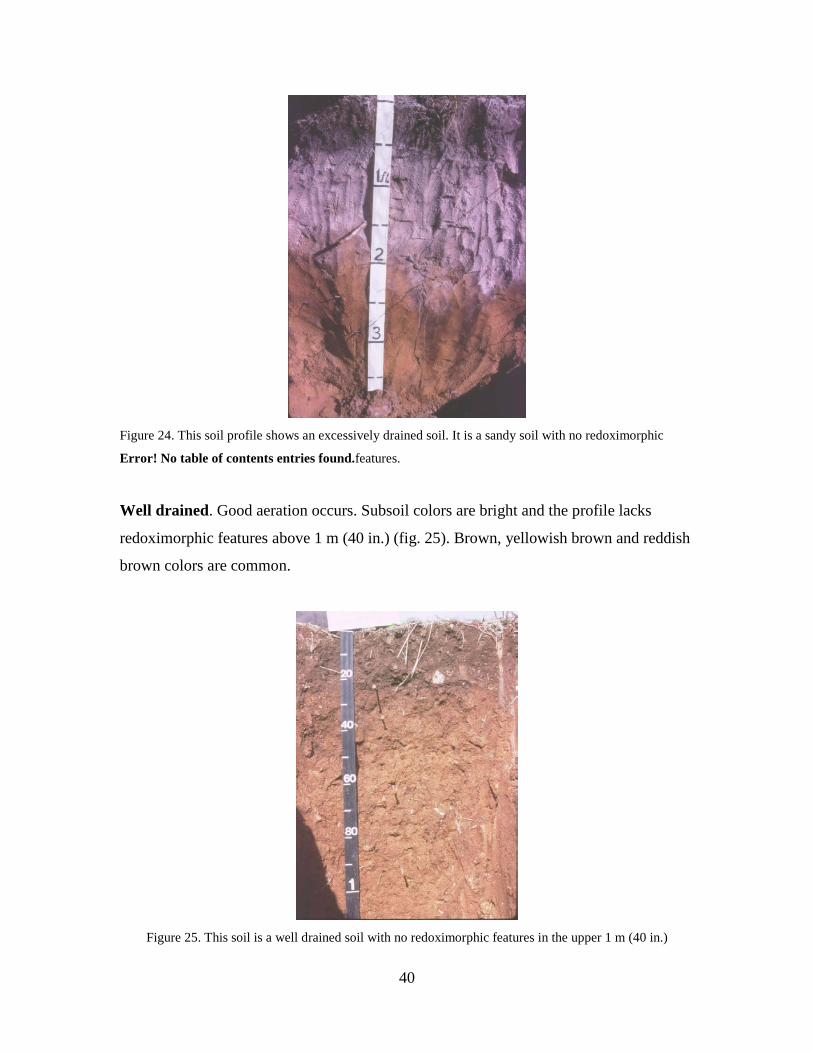
Excessively drained. Water is removed from the soil very rapidly because of either
coarse textures (such as sand and loamy sand) or shallow, porous profiles on steep slopes.
Excessively drained soils are suited poorly to agriculture unless irrigation is practiced. No
drainage mottles occur in these soils (fig. 24).
40
Figure 24. This soil profile shows an excessively drained soil. It is a sandy soil with no redoximorphic
Error! No table of contents entries found.features.
Well drained. Good aeration occurs. Subsoil colors are bright and the profile lacks
redoximorphic features above 1 m (40 in.) (fig. 25). Brown, yellowish brown and reddish
brown colors are common.
Figure 25. This soil is a well drained soil with no redoximorphic features in the upper 1 m (40 in.)

41
Moderately well drained. In these soils, redoximorphic features are present above 1 m
(40 in.) indicating that saturated conditions or water tables occur above this depth at
various times during the year (fig. 26). Mottles are restricted to the 0.5 to 1 m (20 to 40
in.) zone for classification in this category. These soils may retard crop growth in wet
years, but crops may do very well during drought periods. Artificial drainage may be
beneficial during wet periods. Septic systems may experience periodic failure during
saturated conditions.
Figure 26. This is a moderately well drained soil with redoximorphic features occurring starting at 0.75 m
(30 in.)
Somewhat poorly drained. Redoximorphic features occur within the 10 to 20 in. zone,
indicating prolonged periods of saturation or high water tables. Serious crop injury or
failure may result during wet years (fig. 27). Unless artificial drainage is provided, crop
production is restricted and septic systems commonly fail.

42
Figure 27. This is a somewhat poorly drained soil with a predominantly gray matrix starting at 0.35 m (15
in.)
Poorly drained. These soils have dark surface horizons and gray subsoils with
redoximorphic features occurring above 25 cm (10 in.) (fig. 28). They have high water
tables or are ponded for long periods or both. These soils usually occupy level areas or
footslope positions and are productive only if they are artificially drained. Development
of these soils for home sites should be avoided.
Figure 28. This is a poorly drained soil with a predominantly gray matrix due to wetness occurring at the
surface.

43
Very poorly drained. Water is removed so slowly that the water table remains at or on
the surface much of the year (fig. 29). These soils usually occupy low-lying and concave
or depressed positions on the landscape. They normally have very dark or black, thick
surface horizons with relatively high organic matter contents. The subsoils usually are
gray. These soils can be used for agriculture, but only if intensive drainage is practiced.
Figure 29. This is a very poorly drained soil with a black surface due to organic matter accumulation
underlain by a predominantly gray matrix due to wetness.
Available Water Capacity
The available water capacity of a soil is closely related to texture. As mentioned
previously, air and water occupy the pore space between the particles comprising the soil
skeleton. The bigger the soil particles (such as sand or gravel), the larger the pores
between them. Thus, water drains first and rapidly from these larger pores. This results in
droughty soils because the plants are supplied only from the small amount of remaining
moisture. Irrigation is necessary on these soils even in humid climates.
44
As the particles become smaller, the pores between the grains also are reduced in size.
This results in the retention of more water for plant use. Therefore, medium-textured and
moderately fine-textured soils, such as loam, silt loam and clay loam have much higher
available water capacities than coarse-textured soils. The moderately coarse-textured
soils (such as sandy loam) are intermediate in those categories. Fine-textured soils (such
as clay) have such small pores that plant roots are unable to obtain much more water from
these fine soils than is available from medium-textured soils. Moderately coarse-,
medium- and moderately fine-textured soils are, therefore, preferred for agricultural use
because they provide good, available water capacity and aeration while being easily
worked.
To calculate the water available within the soil profile, consider only the first 1 m (40 in.)
or to a root limiting layer if it occurs above 1 m (40 in.). The available water capacity of
each horizon down to 1 m (40 in.), when added together, will give the total available
water for the profile. A deep silt loam will hold more water than a soil with 0.25 m (10
in.) of silt loam surface soil and the remainder sand. Therefore, both the surface and
subsoil must be considered in computing the available water
See Table 4 for a general guide when calculating the amount of available water in a 40 in.
profile. The range and average water availability are presented in inches of available
water per inch of soil depth.
For example, if a soil consists of 20 in. of silt loam over loamy sand, the available water
capacity would be affected by both textural classes. In determining the water in the 20 in.
of silt loam or medium-textured material, simply multiply the depth (20 in.) by the
amount of available water held by the silt loam textural class (0.23 in. of water per inch
of soil). This calculation gives 4.6 in. of available water in the 20 in. zone. Now the
remaining 20 in. (to complete the 40 in. profile) is loamy sand or coarse-textured material
which holds only 0.05 in. of water per in. of soil. Multiplying 20 in. of loamy sand times
0.05 yields a total of 1.0 in. of available water. Therefore, the 40 in. soil profile has an

45
available water capacity of 4.6 in. (silt loam) plus 1.0 in. (loamy sand) or 5.6 in. of
available water.
Table 4. Amount of available water by textural class.
Textural class Available water (in. water/in. soil
Range Average
Coarse (sand, loamy sand) .02-.09 0.05
Moderately coarse (sandy loam, fine sandy loam .09-.19 0.14
Medium (loam, sandy clay loam, silt loam .19-.27 0.23
Moderately fine (clay loam, silty clay loam) .10-.19 0.15
Fine (silty clay, sandy clay, clay) .07-.19 0.13
Available Water Capacity Categories Range in in. H20 per 40 in. soil
Very Low Less then 2.5
Low 2.6 to 4.5
Medium 4.6 to 7.0
High Greater then 7.0
Erosion
Soils under their natural vegetative cover attain equilibrium with their environment.
When this vegetative cover is removed and the soils are cultivated, this equilibrium is
changed. At certain times of the year the soils are exposed to heavy rains with little or no
vegetative cover to break the impact of the rain drops. As a result, soil particles are
dislodged and runoff waters carry these particles downslope and deposit them on other
parts of the landscape or carry them into streams. Wind also is an effective carrier of
particles on sandy soils. Regardless of the process, the removal of soil is called erosion.
Some soils in Maryland have been cultivated for hundreds of years and many of these
soils are severely eroded. Often, the entire original surface horizon has been removed,
leaving the subsoil exposed. In some parts of the Piedmont, it is estimated that from 60 to

46
90 cm (24 to 36 in.) of the soil have been lost. The degree or severity of erosion is an
important soil property.
The degree of past erosion can be determined by comparing the original soil depth,
observed in virgin forests, with the present soil depth. The less surface soil, or the closer
the subsoil is to the surface, the more severe the erosion problem.
The amount of past erosion is estimated as a measure of the soil that remains in relation
to the given original thickness. The following categories are used to define the severity or
degree of erosion in Maryland.
None to slight. Less than 7.5 cm (3 in.) of the original soil have been lost. No mixing of
the subsoil into the plow layer is evident.
Moderate. Between 7.5 to 20 cm (3 to 8 in.) of the original soil have been removed.
Subsoil material may be mixed with the plow layer, but the plow layer remains darker
than the subsoil.
Severe. More than 20 cm (8 in.) of the original soil have been lost. Commonly, subsoil
material is mixed with the plow layer, and the plow layer color closely resembles the
subsoil color. Where the subsoil is exposed or gullies occur, the soil is severely eroded.
Erosion Potential
Erosion potential is determined by the steepness of the slope, length of slope, the nature
of the soil (soil texture, infiltration rate and tilth) and the type of vegetative cover. A
soil's susceptibility to erosion will influence greatly how the soil is used. Erosion
potential can be determined primarily by evaluating factors such as slope gradient, slope
length and soil texture.

47
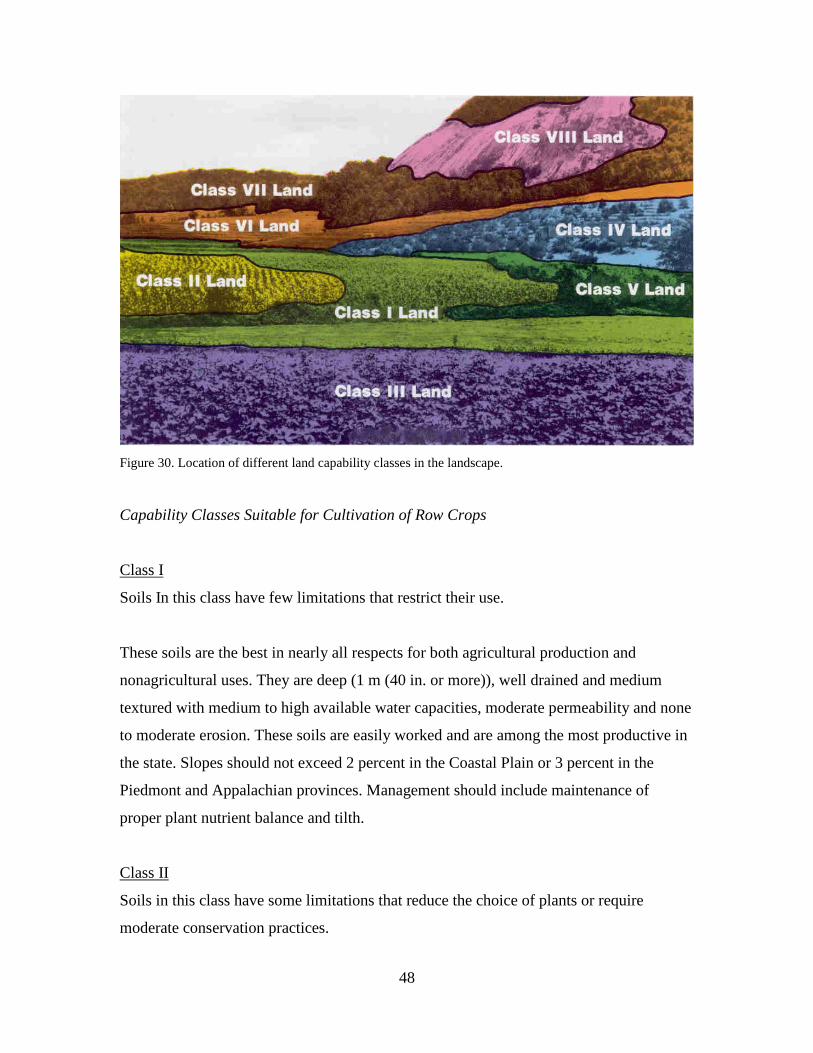
Land Capability Classification
Land capability classes and in most cases, subclasses are assigned to each soil. They
suggest the suitability of the soil for field crops or pasture and provide a general
indication of the need for conservation treatment and management. There are 8 capability
classes. Capability classes are designated by either Arabic or Roman numerals (I through
VIII), which represent progressively greater limitations and narrower choices for
practical land use (fig. 30). Capability subclasses are noted with an e, w, s, or c following
the capability class; for example, IIe. The "e" indicates that the soil is erosive. A "w"
signifies a wetness limitation. An "s" denotes a shallow, droughty, or stony soil. A "c"
indicates a climatic limitation. No subclasses are shown for capability class I because
these soils have few limitations. Figure illustrates some of the capability classes on a
landscape.
Of the eight capability classes, only the first four are considered usable for cropland.
Class I land has little or no hazard for crop production and is the best agricultural land.
Classes II, III and IV need progressively more care and protection when cultivated crops
are grown. Soils in classes V, VI and VII are suited for adapted native plants (such as
forests), although some soils in classes V and VI are capable of producing specialized
crops such as fruit trees and ornamentals. Soils in class VIII do not respond to
management without major reclamation since they include the very steep and rocky areas
of the mountain regions and the very wet tidal marshes in Maryland.
48
Figure 30. Location of different land capability classes in the landscape.
Capability Classes Suitable for Cultivation of Row Crops
Class I
Soils In this class have few limitations that restrict their use.
These soils are the best in nearly all respects for both agricultural production and
nonagricultural uses. They are deep (1 m (40 in. or more)), well drained and medium
textured with medium to high available water capacities, moderate permeability and none
to moderate erosion. These soils are easily worked and are among the most productive in
the state. Slopes should not exceed 2 percent in the Coastal Plain or 3 percent in the
Piedmont and Appalachian provinces. Management should include maintenance of
proper plant nutrient balance and tilth.
Class II
Soils in this class have some limitations that reduce the choice of plants or require
moderate conservation practices.

49
Although these soils are rated good and usually are productive, some physical conditions
render them less desirable than class I land. Likewise, the drainage class, soil depth,
permeability or available water capacity maybe less desirable than class I soils. In
general, slopes ranging between 2 and 5 percent in the Coastal Plain, and 3 and 8 percent
in the remainder of the state would place this soil in class II. Drainage may be the
limiting factor with mottling within the 20 to 40 in. zone of the profile. A slow or rapid
permeability, low available water capacity or moderate soil depth (0.5 to 1 m (20 to 40
in.)) also could eliminate this soil from class I. Although several limitations may exist,
only one is necessary to place this soil in class n. Management practices, in addition to
those for class I, should include moderate erosion control (including rotations with sod or
cover crops), contour fanning, moisture retention methods or drainage depending on the
type of limitation.
Class III
Soils in this class have severe limitations that reduce the choice of plants or require
special conservation practices, or both.
Limitations similar to class II soils may be present in these soils, but these limitations are
more severe, restricting the use of these soils. Large acreages of class III land are strongly
sloping and subject to moderate to severe erosion. Slope limits for this class range
between 5 and 10 percent for the Coastal Plain and 8 and 15 percent for the remainder of
the state. If drainage is the limiting factor, mottling should occur within the 20 in. zone,
indicating that saturated conditions or high water tables are present at some time during
the year .Shallow soils (less than 0.5 m (20 in.)), coarse-textured surface layers, fine-
textured subsoils with slow permeability or very low available water capacity also can
limit the use of soils to the extent that they are placed in this class. The very coarse soils
with very low available water capacities also fit into this class and require irrigation to
realize production.
The soils in this class require more intense management than the previous classes.
Management practices should include intensive erosion control measures such as
50
terracing and strip-cropping. Where excessive water is limiting, drainage practices are
necessary to make these soils productive.
Class IV
Soils In this class have very severe limitations that restrict the choice of plants or require
very careful management, or both.
Where erosion is limiting, this land is good for only occasional cultivation under careful
management. Sod crops should occupy a large portion of the rotation be- cause of the
severe erosion hazard. Slope limits for this class range between 10 and 15 percent in the
Coastal Plain, and 15 and 25 percent in the Piedmont and Appalachian sections of the
state. Very poorly drained soils in depressions have such high water tables, or are
saturated for such long periods, that only very intensive drainage management can make
these soils productive.
Soils that are severely eroded or gullied with little or no surface soil must be placed in
this capability class, even though these soils may occur on slopes similar to those
required for class III soils (see note on Figure 9).
Very intensive management practices are required for production on these soils. Where
erosion is the hazard, cultivated crops may be grown only once in several sea- sons. Sod
crops such as hay, pasture or cover crops are necessary to minimize the erosion loss.
Even under excel- lent management, crop failures or severe yield reductions can be
expected occasionally.
Capability Classes Unsuited for Cultivation
Class V
Soils in this class are nearly level and not subject to erosion, but because of excessive
wetness resulting from frequent flooding or some permanent obstruction like rock
outcrops, they are not suited for cultivation.

51
Streams that overflow frequently, excessive seepage, very stony soils or numerous
outcroppings of bedrock make these soils unsuited for cultivation. Many of these soils are
deep, however, and they have few limitations for pasture or forestry. These soils respond
to good management, which is necessary for satisfactory production.
Class VI
Soils in this class have severe limitations that make them generally unsuited for
cultivation, and that limit their use largely to pasture, woodland, or wildlife food and
cover.
These soils have continuing limitations that cannot be corrected economically such as
steep slopes (15 to 25 percent in the Coastal Plain and 25 to 50 percent in the Piedmont
and Appalachian provinces), a severe erosion hazard, effects of past erosion, or stoniness.
These factors produce some limitation for pasture and forestry .It should be pointed out
that even for most of these uses, the better classes are preferred for maximum protection.
Class VII
Soils in this class have very severe limitations that make them unsuited for cultivation
and that restrict their use largely to grazing, woodland or wildlife.
Although not suited for cultivation, intensive management can make productive pasture
and woodland possible. Even in rough, timbered areas, special care is required to prevent
excessive erosion. Soils on very steep slopes, very shallow soils and very stony soils that
occur on slopes greater than 25 percent in the Coastal Plain and greater than 50 percent in
the Piedmont are the most common members of this class. This class includes the least
capable soils with regard to pasture and woodland.
Class VIII
Soils and landforms in this class have limitations that preclude their use for commercial
production of plants and restrict their use to recreation, water supply, wildlife or esthetic
purposes.

52
Tidal marshes that are flooded daily, continuously ponded areas (areas containing water
for more than 6 months of a year), and areas with greater than 90 percent rock outcrop,
stones or boulders are included in this class as well as borrow pits, barren mine dumps
and sandy beaches. These land areas have few or none of the physical soil features (found
in class I soils) necessary to support any type of agriculture.
Other management interpretations
Some soil surveys, or addenda to the surveys, have special tables on important agronomic
soil interpretations. A few tables may be in the form of a soil's potential for a specified
use, such as its potential for cropland. Other tables group soils for specific programs;
such as prime or unique farmland, land capability classification, highly erodible lands,
and hydric soils.
Hydric soils are wet soils defined as a group for the purpose of implementation of
legislation for preserving wetlands and for assessing the potential habitat for wildlife. The
soils considered to be hydric were selected on the basis of flooding, water table, and
drainage class criteria. Hydric soils developed under wet conditions (anaerobic within 30
cm (12 in.)) and can support the growth and regeneration of hydrophytic vegetation.
Indicators we look for in the field to identify hydric soils include organic soils, 40 cm (16
in.) of organic soil material in the upper 80 cm (32 in.); histic epipedon, 20 cm (8 in.) of
organic soil material in the upper 40 cm (16 in.); gleyed or low chroma colors, a
predominance of gray colors due to wetness; high organic matter in sandy soils; and
organic streaking in sandy soils.
You can also identify the soil series and look to see if it is listed on the county hydric
soils list. The hydric soils list, developed for the 1982 Farm Bill, is included in the Soil
Conservation Service Field Office Technical Guide, Section II. Some map units that have
inclusions of soils that meet the hydric soil criteria are added to the field office listing.
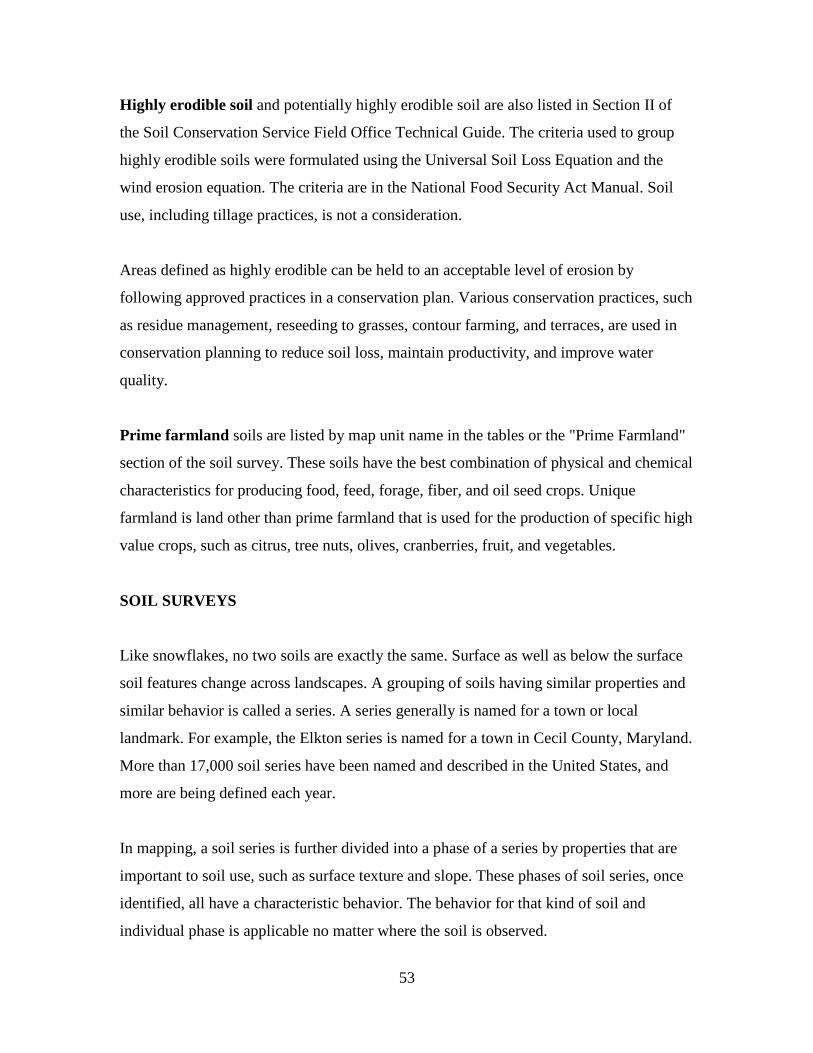
53
Highly erodible soil and potentially highly erodible soil are also listed in Section II of
the Soil Conservation Service Field Office Technical Guide. The criteria used to group
highly erodible soils were formulated using the Universal Soil Loss Equation and the
wind erosion equation. The criteria are in the National Food Security Act Manual. Soil
use, including tillage practices, is not a consideration.
Areas defined as highly erodible can be held to an acceptable level of erosion by
following approved practices in a conservation plan. Various conservation practices, such
as residue management, reseeding to grasses, contour farming, and terraces, are used in
conservation planning to reduce soil loss, maintain productivity, and improve water
quality.
Prime farmland soils are listed by map unit name in the tables or the "Prime Farmland"
section of the soil survey. These soils have the best combination of physical and chemical
characteristics for producing food, feed, forage, fiber, and oil seed crops. Unique
farmland is land other than prime farmland that is used for the production of specific high
value crops, such as citrus, tree nuts, olives, cranberries, fruit, and vegetables.
SOIL SURVEYS
Like snowflakes, no two soils are exactly the same. Surface as well as below the surface
soil features change across landscapes. A grouping of soils having similar properties and
similar behavior is called a series. A series generally is named for a town or local
landmark. For example, the Elkton series is named for a town in Cecil County, Maryland.
More than 17,000 soil series have been named and described in the United States, and
more are being defined each year.
In mapping, a soil series is further divided into a phase of a series by properties that are
important to soil use, such as surface texture and slope. These phases of soil series, once
identified, all have a characteristic behavior. The behavior for that kind of soil and
individual phase is applicable no matter where the soil is observed.

54
One of the main references available to help land users determine the potentials and
limitations of soils is a soil survey. Copies of a soil survey for a specific county are
available from the Soil Conservation Service office responsible for that county.
Reference copies are also available in the county or depository libraries. A soil survey is
prepared by soil scientists who determine the properties of soil and predict soil behavior
for a host of uses. These predictions, often called soil interpretations, are developed to
help users of soils manage the resource.
A soil survey generally contains soils data for one county, parish, or other geographic
area, such as a major land resource area. During a soil survey, soil scientists walk over
the landscapes, bore holes with soil augers, and examine cross sections of soil profiles.
They determine the texture, color, structure, and reaction of the soil and the relationship
and thickness of the different soil horizons. Some soils are sampled and tested at soil
survey laboratories for certain soil property determinations, such as cation-exchange
capacity and bulk density. To be proficient in using soil survey data, a basic
understanding of the concepts of soil development and of soil-landscape relationships is
imperative.
General soil information
The general soil map is near the back of the soil survey publication. This generalized map
of the soils for the soil survey area is color coded to show major soil associations (or
groupings) of the major soils. Soils within a soil association may vary greatly in slope,
depth, drainage, and other characteristics that affect management. Descriptions of each of
the soil associations are near the front of the soil survey report immediately following the
short introductions to cultural and natural features of the area. This section is labeled
"General soil map units" in the Contents.

55
The general soil map can be used to compare the suitability of large areas for general land
uses. Because of the scale, it is not intended to be used to make management decisions on
specific sites. Each color-coded area on the map has a corresponding description. For
example, on the general soil map illustrated by figure 9 areas coded 1 and shaded light
yellow designate the Lamoni-Shelby soil association. As the name of the unit implies,
Lamoni and Shelby soils are the major soils that occupy the landscape in this area.
Likewise, the description of association 1 gives general information about this section of
the county.
Some soil surveys include three-dimensional drawings depicting the relationships of
soils, parent material, and landscape position for the major soils. Figure 10 illustrates the
dominant Lamoni and Shelby soils and the minor Colo soils as they occur in association
1. Note the relationship of parent material and landscape positions to the different soils.
Please refer to Section II "How is Soil Formed?" and to figure 3 for additional insights on
these relationships.
Detailed soil information
To obtain information about a particular plot of land from a soil survey, locate the general
area on the "Index to Map Sheets", and select the appropriate map sheet number. The
sheets are in numerical order in the soil survey. After selecting the correct sheet, a
specific parcel of land is located on the aerial map by using section numbers, roads,
streams and drainage- ways, towns, or the imagery on the map sheet. Areas on the aerial
photograph are delineated for individual soil map units and each contains a unique map
unit symbol.
The symbols on the detailed maps are listed on the back of the "Index to Map Sheets"
with the names of each soil they represent. Some soil names include terms for the surface
texture, slope range, and erosion. Detailed information can be obtained about each unit by
referring to the map unit description or soil interpretive tables. Each unit is easily located

56
by using the Index to Map Units or Summary of Tables in the front of the publication.
Both the map unit descriptions and soil survey interpretive tables have information about
the soils.
In each map unit description, soil information is given for the common uses. Major
limitations or hazards affecting these uses are stated. Also listed are possible alternatives
to help overcome each major limitation or hazard.
Areas delineated on the soil maps are not necessarily made up of just one soil, but include
smaller areas of similar or different soils. The composition of soils in the map unit is
explained in each map unit description.
REFERENCES
GLOBE. 2002. 2002 GLOBE Teachers Guide. (www.globe.gov)
University of Maryland Cooperative Extension Service. 1985-86. A Guide to Land
Judging in Maryland. (To obtain a copy, contact the Maryland NRCS State Office at
www.md.nrcs.usda.gov)
USDA Natural Resources Conservation Service, 1994. From the Surface Down An
Introduction to Soil Surveys for Agronomic Use.
(www.statlab.iastate.edu/soils/nssc/nsscprod/surdown.pdf)
USDA Natural Resources Conservation Service. Version 1.1. Field Book for Describing
and Sampling Soils. (www.statlab.iastate.edu/soils/nssc/field_gd/field_gd.htm)

57
Agricultural Best Management Practices
The following will discuss a few of the Best Management Practices (BMP’s) that can
address soil conservation and water quality and improved production on agricultural land.
Each practice is based on USDA Natural Resource Conservation Service (NRCS)
technical standards.
Each practice will work most effectively in combination with others as part of a farm
plan. All of the BMP’s that will be discussed in this section provide multiple benefits.
The following pages will describe each BMP and identify their benefits with the symbols
below.
Benefit Symbols
Helps reduce soil
erosion & sediment
runoff; or may add to
the soil organic matter
Provides wildlife
habitat or food.
Helps protect or
improve water quality
Helps improve air
quality by reducing
odor and other
problems
May help increase
profits by reducing
costs, increasing
production or both
May qualify for state
or federal cost-share
assistance.

58
Grassed waterway
Shaping and establishing grass in a natural drainageway to prevent gullies from farming
How it works
A natural drainageway is graded and shaped to form a smooth, bowl-shaped channel.
This area is seeded to sod-forming grasses. Runoff water that flows down the
drainageway flows across the grass rather than tearing away soil and forming a larger
gully. An outlet is often installed at the base of the drainageway to stabilize the waterway
and prevent a new gully from forming.
How it helps
• Grass cover protects the drainageway from gully erosion.
• Vegetation may act as a filter, absorbing some of the chemicals and nutrients in
runoff water.
• Vegetation provides cover for small birds and animals.

59
Contour farming Farming with row patterns nearly level around the hill – not up and down hill
How it works
Crop row ridges built by tilling and planting on the contour create hundreds of small
dams. These ridges or dams slow water flow and increase infiltration, which reduces
erosion. Can also be used with stripcropping, whereby the crop is alternated with strips of
meadow or small grain planted on the contour. The small grain/meadow strip slows
runoff, increases infiltration, traps sediment and provides overall cover. Crop rotation
with legumes may also be included to add nitrogen as part of the stripcropping measure.
How it helps
• Contouring can reduce soil erosion by as much as 50% compared with up and down
hill farming.
• By reducing sediment and runoff, and increasing water infiltration, contouring
promotes better water quality.

60
Crop residue management
Leaving last year’s crop residue on the soil surface by limiting tillage. Includes no-till
and ridge till
How it works
Leaving last year's crop residue on the surface before and during planting operations
provides cover for the soil at a critical time of the year. The residue is left on the surface
by reducing tillage operations and turning the soil less. Pieces of crop residue shield soil
particles from rain and wind until plants can produce a protective canopy.
How it helps
• Ground cover prevents soil erosion and protects water quality.
• Residue improves soil tilth and adds organic matter to the soil as it decomposes.
• Fewer trips and less tillage reduces soil compaction.
• Time, energy and labor savings are possible with fewer tillage trips.

61
Measuring crop residues
You can estimate residue levels by using a line that has 50 or 100 equally divided marks.
Stretch the line diagonally across crop rows. Count the number of marks that have
residue under the leading edge when looking from directly above the mark. Walk the
entire length of the rope. The total number of marks with residue under them is the
percent of residue cover. If the line has only 50 marks, multiply your count by two.
Repeat this three to five times in a representative area of the field.
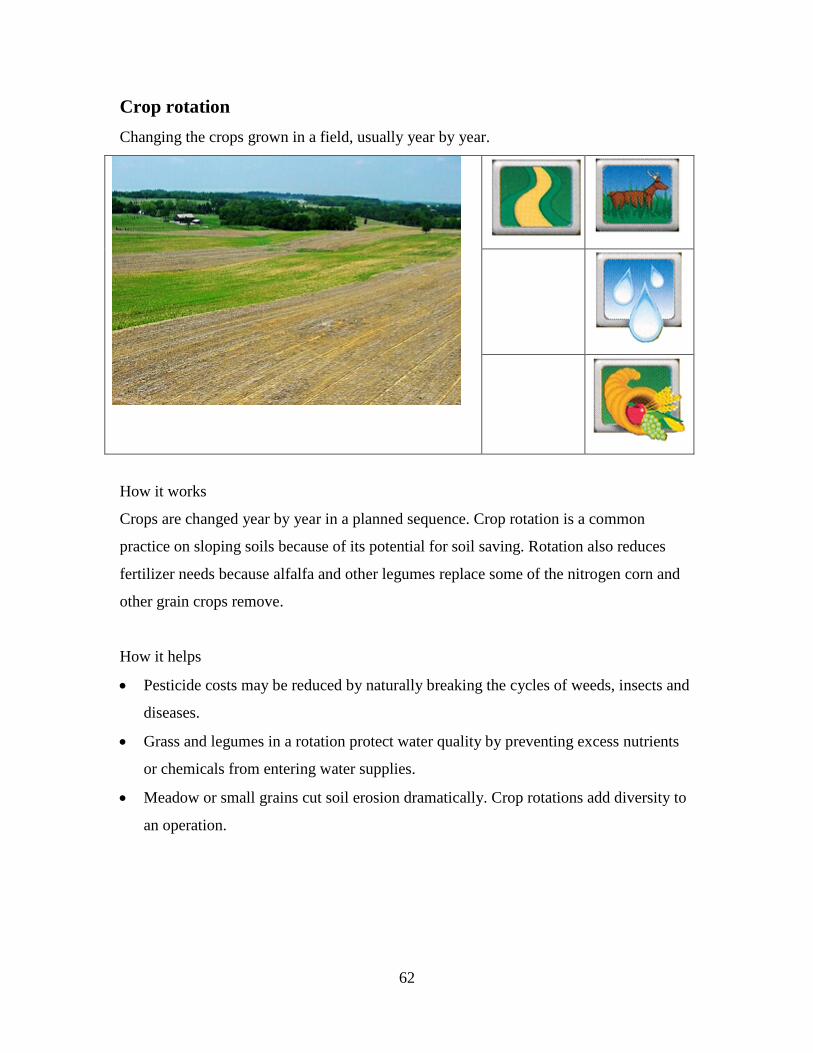
62
Crop rotation Changing the crops grown in a field, usually year by year.
How it works
Crops are changed year by year in a planned sequence. Crop rotation is a common
practice on sloping soils because of its potential for soil saving. Rotation also reduces
fertilizer needs because alfalfa and other legumes replace some of the nitrogen corn and
other grain crops remove.
How it helps
• Pesticide costs may be reduced by naturally breaking the cycles of weeds, insects and
diseases.
• Grass and legumes in a rotation protect water quality by preventing excess nutrients
or chemicals from entering water supplies.
• Meadow or small grains cut soil erosion dramatically. Crop rotations add diversity to
an operation.
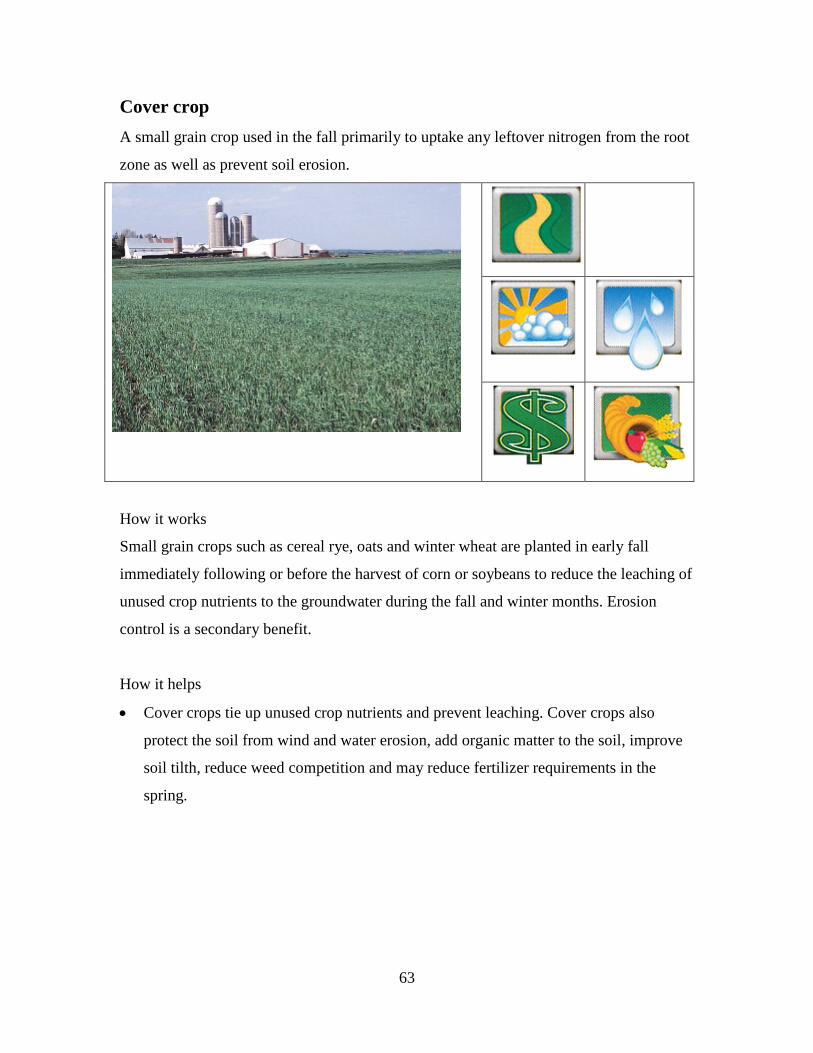
63
Cover crop A small grain crop used in the fall primarily to uptake any leftover nitrogen from the root
zone as well as prevent soil erosion.
How it works
Small grain crops such as cereal rye, oats and winter wheat are planted in early fall
immediately following or before the harvest of corn or soybeans to reduce the leaching of
unused crop nutrients to the groundwater during the fall and winter months. Erosion
control is a secondary benefit.
How it helps
• Cover crops tie up unused crop nutrients and prevent leaching. Cover crops also
protect the soil from wind and water erosion, add organic matter to the soil, improve
soil tilth, reduce weed competition and may reduce fertilizer requirements in the
spring.

64
Nutrient management Applying the correct amount and form of plant nutrients for optimum yield and minimum
impact on water quality.
How it works
After taking a soil test, setting realistic yield goals, and taking credit for contributions
from previous years' crops and manure applications, crop nutrient needs are determined.
Nutrients are then applied at the proper time by the proper application method. Nutrient
sources include animal manure, biosolids and commercial fertilizers. These steps reduce
the potential for nutrients to go unused and wash or infiltrate into water supplies.
How it helps
• Sound nutrient management reduces input costs and protects water quality by
preventing over-application of commercial fertilizers and animal manure.
• Correct manure and biosolids application on all fields can improve soil tilth and
organic matter.

65
No-till farming A method of farming where the soil is not tilled between each year’s crops.
How it works
This method of farming includes no seedbed preparation other than opening a small slit
for the purpose of placing the seed at the intended depth.
How it helps
• Ground cover prevents soil erosion and protects water quality.
• Residue improves soil tilth and adds organic matter to the soil as it decomposes.
• Fewer trips and less tillage reduce soil compaction.
• Time, energy and labor savings are possible with fewer tillage trips.
66
Soil Health – It’s Alive
Many people don’t realize that soil, especially healthy soil, is full of life. Millions of species and billions of organisms make up a complex and diverse mix of microscopic and macroscopic life that represents the greatest concentration of biomass anywhere on the planet. Bacteria, algae, microscopic insects, earthworms, beetles, ants, mites, and fungi are among them. Estimates vary, but if you could weigh all the organisms in the top six inches of soil on an acre of land, you’d find they would weigh between 2,500 pounds to more than 5,000 pounds, depending on how healthy the soil is. That is a LOT of life.
What these low-lying creatures lack in size, they make up for in numbers. Consider bacteria, the soil microbes with the highest numbers, for example. You can fit 40 million of them on the end of one pin. In fact, there are more soil microorganisms (microbes for short) in a teaspoonful of soil than there are people on the earth.
These microbes, which make up only one-half of one percent of the total soil mass, are the yeasts, algae, protozoa, bacteria, nematodes, and fungi that process soil into rich, dark, stable humus.
Like other living creatures, the organisms in the soil also need food and shelter. Some feed on dead organic matter, and some eat other microbes. As a group, they cycle nutrients, build the soil and give it structure.
The healthiest soils are those with a diversity and abundance of life. Farmers with the healthiest soils nurture that life by creating a diversity of plant life above the soil surface, with year-round ground cover, no tillage, and judicious pesticide use. For those producers, farming centers around feeding the organisms that build healthy soils.
These farmers understand that tillage, the turning of the soil that has been the standard for growing crops for years and years, is disruptive to soil microbes and destructive to the soil system.
Instead, they disturb the soil as little as possible. And, they grow a diversity of living plants in the soil as much of the time as practical covering the soil and offering food to soil microbes through living roots. Those soil organisms, in turn, cycle nutrients back to the plant, allowing it to grow and flourish.
It’s a natural, symbiotic system that leads to healthy soils and more sustainable and profitable agriculture.
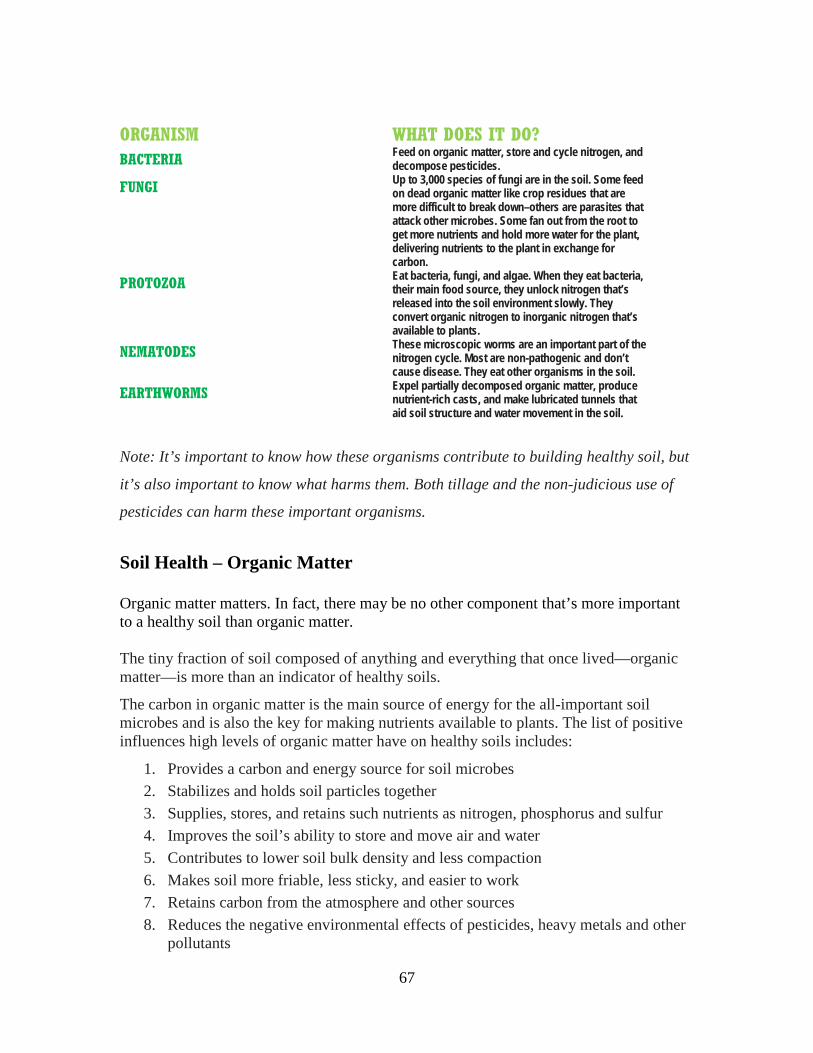
67
ORGANISM WHAT DOES IT DO? BACTERIA Feed on organic matter, store and cycle nitrogen, and
decompose pesticides.
FUNGI Up to 3,000 species of fungi are in the soil. Some feed on dead organic matter like crop residues that are more difficult to break down–others are parasites that attack other microbes. Some fan out from the root to get more nutrients and hold more water for the plant, delivering nutrients to the plant in exchange for carbon.
PROTOZOA Eat bacteria, fungi, and algae. When they eat bacteria, their main food source, they unlock nitrogen that’s released into the soil environment slowly. They convert organic nitrogen to inorganic nitrogen that’s available to plants.
NEMATODES These microscopic worms are an important part of the nitrogen cycle. Most are non-pathogenic and don’t cause disease. They eat other organisms in the soil.
EARTHWORMS Expel partially decomposed organic matter, produce nutrient-rich casts, and make lubricated tunnels that aid soil structure and water movement in the soil.
Note: It’s important to know how these organisms contribute to building healthy soil, but
it’s also important to know what harms them. Both tillage and the non-judicious use of
pesticides can harm these important organisms.
Soil Health – Organic Matter Organic matter matters. In fact, there may be no other component that’s more important to a healthy soil than organic matter. The tiny fraction of soil composed of anything and everything that once lived—organic matter—is more than an indicator of healthy soils.
The carbon in organic matter is the main source of energy for the all-important soil microbes and is also the key for making nutrients available to plants. The list of positive influences high levels of organic matter have on healthy soils includes:
1. Provides a carbon and energy source for soil microbes 2. Stabilizes and holds soil particles together 3. Supplies, stores, and retains such nutrients as nitrogen, phosphorus and sulfur 4. Improves the soil’s ability to store and move air and water 5. Contributes to lower soil bulk density and less compaction 6. Makes soil more friable, less sticky, and easier to work 7. Retains carbon from the atmosphere and other sources 8. Reduces the negative environmental effects of pesticides, heavy metals and other pollutants
68
9. Improves soil tilth in surface horizons 10. Increases water infiltration rates 11. Reduces crusting 12. Reduces water runoff 13. Encourages plant root development and penetration 14. Reduces soil erosion
Cover crops, green manure crops, and perennial forage crops add organic matter, as do compost and manure. Growing crops and roots add biomass above and below the soil surface. However, not all that biomass is converted to soil organic matter—much of it is released as carbon dioxide and water. It can take 20,000 pounds of organic inputs such as crop residue to increase the actual soil organic matter from 4 percent to 5 percent.
Compost in particular breaks down more slowly and improves soil structure more quickly than other organic materials. Manure breaks down quickly to add nutrients for crops, but takes longer to improve the soil than compost.
Soil Health – Soil Structure “Soft and crumbly.” “Like cottage cheese.” “Like a sponge.” “Loose and full of holes.”
Those and other common descriptions of what healthy soil looks and feels like refer to good soil structure.
Soil structure, the arrangement of the solid parts of the soil and the pore space between them, is critical to how the soil functions. When the solid parts—sand, silt and clay particles—cling together as coarse, granular aggregates, the soil has a good balance of solid parts and pore space.
Highly aggregated soils—those granular, durable, distinct aggregates in the topsoil that leave large pore spaces between them—are soils with good tilth and good structure.
Well-structured soils have both macropores (large soil pores generally greater than 0.08 mm in diameter) and micropores (small soil pores with diameters less than 0.08 mm that are usually found within structural aggregates).
An interconnected network of pores associated with loosely packed, crumbly, highly aggregated soils allows rapid infiltration and easy movement of both water and air through the soil and provides habitat for soil organisms.
Chemical and physical factors play a prominent role in small aggregate formation in clay soils, while biological processes drive development of large aggregates and macropores. Earthworms, for instance, produce both new aggregates and pores. Their binding agents are responsible for the formation of water-stable, macro-aggregates, and their burrowing creates continuous pores linking surface to subsurface soil layers. As they feed, earthworms also speed plant residue decomposition, nutrient cycling, and redistribution of nutrients in the soil profile.

69
Soil organic matter also helps develop stable soil aggregates. Soil microorganisms that are fed with organic matter secrete a gooey protein called glomalin, an effective short-term cementing agent for large aggregates. Organic glues are produced by fungi and bacteria as they decompose plant residues. Water-resistant substances produced by microorganisms, roots, and other organic matter, provide long-term aggregate stability from a few months to a few years.
TILAGE DESTROYS STRUCTURE Management practices that reduce soil cover, disrupt continuous pore space, compact soil, or reduce soil organic matter, negatively impact soil structure. Since tillage negatively affects all of these properties, it’s high on the list of practices damaging to healthy soils.
When tillage loosens the soil, it leaves soil particles exposed to the forces of wind and water. Transported by wind and water, detached soil particles settle into pores, causing surface sealing, compaction and reduced infiltration. When this happens less water is available to plants and runoff and erosion increases.
By contrast, soils that are not tilled and are covered with diverse, high residue crops throughout the year have better soil structure, are highly aggregated, with high levels of organic matter and microorganism activity, high water holding capacity, high infiltration rates, and little compaction.

70
Soil in the Urban Landscape Soil is the foundation upon which we build our homes, schools, businesses, workplaces,
streets and highways. How we treat this soil resource as we build homes, construct
highways and other structures, as well as how we treat the soil as we go about our daily
activities after construction is complete, has a direct impact on the quality of our water
and our lives.
Urban construction activity generates considerable potential for soil erosion, which may
impact water quality as a result of construction runoff.
Clearing of vegetation such as grasses and trees exposes large site areas to erosion
processes, which in turn can pollute streams with sediment and nutrients that wash off the
areas not covered with vegetation. This type of pollution is referred to as a type of Non-
Point Source Pollution because there is no specific point of discharge to streams and
other waterways such as pipe discharge or Point Source Pollution.
The basic principles of control for soil erosion are to:
• Keep disturbed areas as small as practicable.
• Stabilize and protect disturbed areas from raindrop and runoff energies as soon as
practicable.
• Retain sediment within the construction site.
• Reduce the time that soil is exposed with no vegetation.
After the construction activities are completed it is still essential that urban residents
maintain their soil resources by being sure that erosion does not occur around their homes
or business. Maintaining a healthy lawn and incorporating appropriate plantings of tree
and shrub species ensures that the soil will stay in place for many years into the future.
Parts of this section have been adapted from a booklet produced by the United States Department of Agriculture, Natural Resources Conservation Service, Iowa State Office. For more information on practices described in this section, contact your local soil conservation district or the Maryland Department of Agriculture, 50 Harry S. Truman Parkway, Annapolis, MD 21401. Phone 410.841.5863
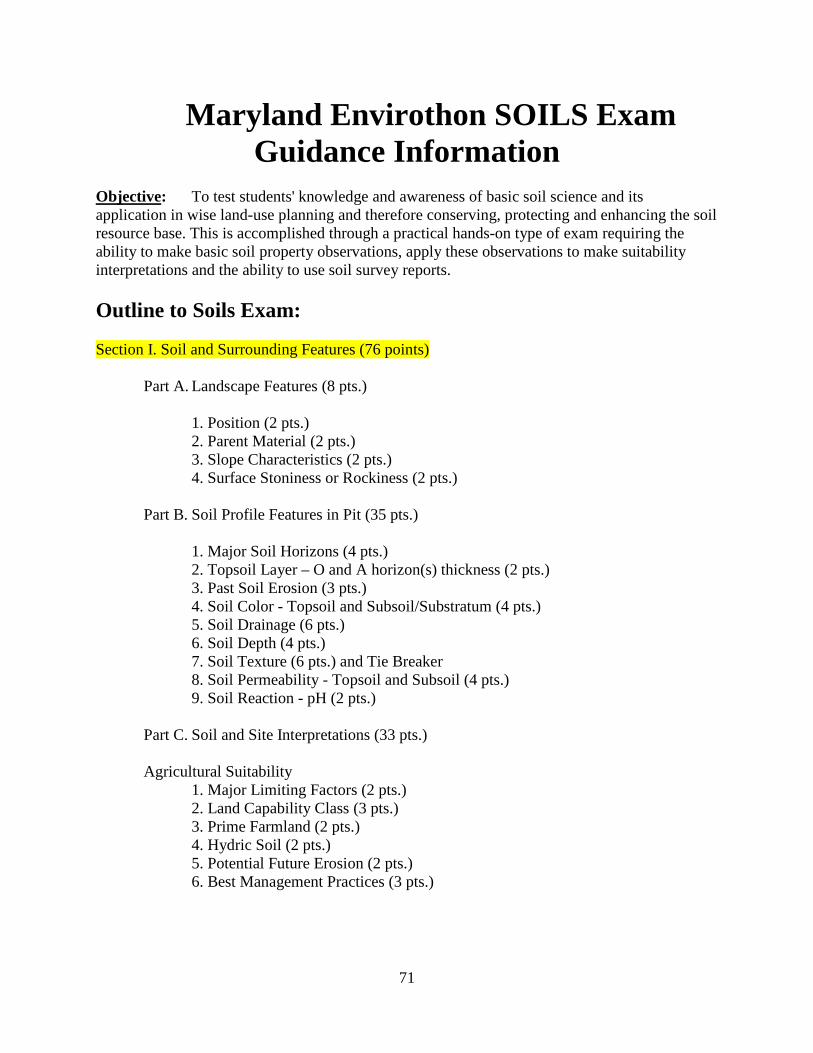
71
Maryland Envirothon SOILS Exam Guidance Information
Objective: To test students' knowledge and awareness of basic soil science and its application in wise land-use planning and therefore conserving, protecting and enhancing the soil resource base. This is accomplished through a practical hands-on type of exam requiring the ability to make basic soil property observations, apply these observations to make suitability interpretations and the ability to use soil survey reports. Outline to Soils Exam: Section I. Soil and Surrounding Features (76 points) Part A. Landscape Features (8 pts.) 1. Position (2 pts.) 2. Parent Material (2 pts.) 3. Slope Characteristics (2 pts.) 4. Surface Stoniness or Rockiness (2 pts.) Part B. Soil Profile Features in Pit (35 pts.) 1. Major Soil Horizons (4 pts.) 2. Topsoil Layer – O and A horizon(s) thickness (2 pts.) 3. Past Soil Erosion (3 pts.) 4. Soil Color - Topsoil and Subsoil/Substratum (4 pts.) 5. Soil Drainage (6 pts.) 6. Soil Depth (4 pts.) 7. Soil Texture (6 pts.) and Tie Breaker 8. Soil Permeability - Topsoil and Subsoil (4 pts.) 9. Soil Reaction - pH (2 pts.) Part C. Soil and Site Interpretations (33 pts.) Agricultural Suitability 1. Major Limiting Factors (2 pts.) 2. Land Capability Class (3 pts.) 3. Prime Farmland (2 pts.) 4. Hydric Soil (2 pts.) 5. Potential Future Erosion (2 pts.) 6. Best Management Practices (3 pts.)
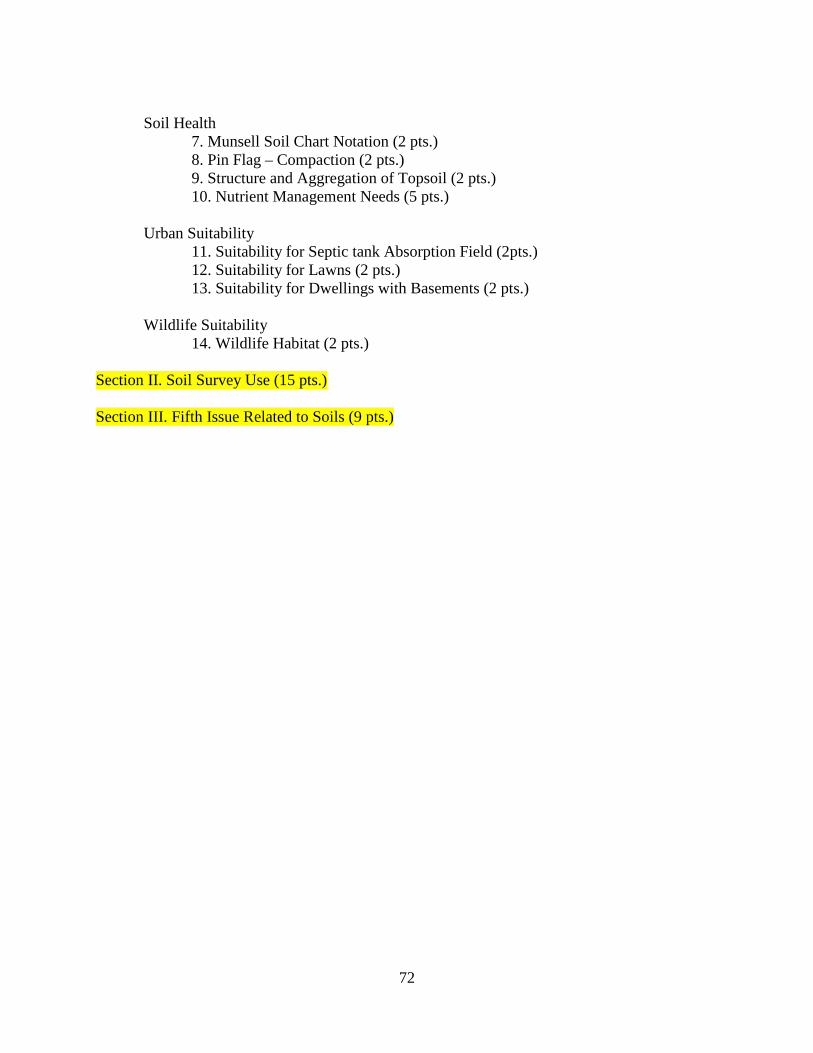
72
Soil Health 7. Munsell Soil Chart Notation (2 pts.) 8. Pin Flag – Compaction (2 pts.) 9. Structure and Aggregation of Topsoil (2 pts.) 10. Nutrient Management Needs (5 pts.) Urban Suitability 11. Suitability for Septic tank Absorption Field (2pts.) 12. Suitability for Lawns (2 pts.) 13. Suitability for Dwellings with Basements (2 pts.) Wildlife Suitability 14. Wildlife Habitat (2 pts.) Section II. Soil Survey Use (15 pts.) Section III. Fifth Issue Related to Soils (9 pts.)

73
Guidance to Soil Exam (page number indicates location in Maryland Envirothon Soil Study Guide) Section I. Soil and Surrounding Features - This section pertains to the exposed soil profile and the area to be evaluated as provided by the information sign or the pit proctor. Part A. Landscape Features – based on area surrounding the soil pit 1. Position (page 11) - requires understanding of kinds of landscape positions and the ability to differentiate in field.
• Upland: usually level, rolling or convex, unaffected by stream activity • Upland depression or drainageway: concave landforms or at the heads of drainage
ways, surface water retarded, sometimes ponded, usually thick dark surface (black), at least three sides are sloping to the bottom, parent material may be accumulated depositional material, may not be poorly drained.
• Terrace: above zone of current flooding, usually gravel lines or coarse sands in profile, older alluvium parent material
• Floodplain: near stream, has flood frequency, recent alluvium parent material 2. Parent Material (page 8) - requires knowledge of characteristics of 5 major types and ability to differentiate in field. Soil profiles may contain multiple types.
• Residual: soils formed in place from bedrock (bedrock may not be present in profile) • Colluvium: generally located on lower part of slopes, moved down slope
by gravity and water, soil material and angular coarse fragments, some maybe rounded. • Recent alluvium: fresh or recent deposits, floodplain position or an upland depression
with >20 inches depositional material, poorly developed profile in the recent alluvial material.
• Old alluvium: water worn (rounded) coarse fragments in the soil profile, stream terrace position, should have a developed profile, never or rarely flooded, no fresh materials
• Coastal Plain sediments: on coastal plain region, can have silty cap (loess) 3. Slope Characteristics (page 13) - requires the ability to use clinometers or Abney levels to determine slope percentage and place in appropriate class based on physiographic province of the State. Guidance to appropriate physiographic province will be provided in training and/or by site proctor. The participant may need to know the exact percentage of slope for urban interpretations. SLOPE COASTAL PIEDMONT SOIL SURVEY CLASS PLAIN OR MOUNTAIN LETTER SYMBOL Nearly level 0 to 2% 0 to 3% A Gently sloping >2 to 5% >3 to 8% B Strongly sloping >5 to 10% >8 to 15% C Moderately steep >10 to 15% >15 to 25% D Steep >15 to 25% >25 to 50% E Very steep >25% >50% F
74
4. Surface Stoniness or Rockiness (page 32) - must be able to recognize stoniness or rock outcrops and assess quantities present to determine significance.
• None: less than listed below • Very stony: tillage of intertilled crops impracticable, hay or pasture possible, no better
than class V, stones exposed on soil surface that are >10 inches in diameter and are less than 30 feet apart, not gravel or cobble
• Rock outcrop: bedrock exposures, intertilled crops impracticable, hay or pasture possible, no better than class V, two or more bedrock exposures less than 100 feet apart
within designated area to be judged, commonly found in limestone valleys Part B. Soil Profile Features - based on exposed soil profile in the pit and provided samples 1. Major soil horizons (page 19) - requires knowledge of characteristics of major soil horizon and ability to differentiate in field. Will be asked to circle soil horizons visible in the profile (wall of the pit). Possible horizons are O, A, E, B, C, R. 2. Topsoil layer thickness - requires measurement to nearest inch of the A horizon(s) in cropland or of any O horizons plus A horizon(s) in forested or grass areas. 3. Past Soil Erosion (page 45) - The appropriate class is determined by measuring the thickness of existing topsoil layer, A horizon(s) in cropland or O horizon plus A horizon(s) in forested or grass areas, and comparing this measured thickness to the original topsoil thickness given on the information sign. This is determined by subtracting the measured thickness from the original thickness. The answer could be a loss of topsoil due to erosion or an increase of topsoil due to a deposition of soil material. Class criteria are included on the exam.
• None to slight: <3" original soil lost (no mixing of subsoil) • Moderate: 3-8" original soil lost (some subsoil layer mixed with surface, but still darker
then subsoil) • Severe: >8" original soil lost (surface layer and subsoil layer similar in color)
4. Soil Color (page 23) - influenced by organic matter content, drainage condition, or eroded condition. Requires assessment of color of both the A horizon and subsoil and substratum horizons. Topsoil (A-horizon)--dominant moisten color of horizon
• Brown or dark brown: normal • Reddish brown: eroded soil surface, subsoil closer to surface, inherited from
parent material • Gray or grayish brown: usually poor drainage condition and usually gray below • Black: high organic matter content could be very poorly drained
Subsoil and Substratum (B and/or C horizons) -- from bottom of surface layer to bottom of pit (look at as a whole), mainly iron compound coatings responsible for color, generally these colors reflect the drainage class of the soil. The more gray colors (redox depletions) and the higher in the soil profile, the wetter the condition of the soil (saturation), which is indicating the seasonal high water table in the soil profile.
• Yellowish brown or red, no redox depletions (gray mottling due to wetness): usually well drained condition, oxygen readily available, some gray colors may be due to parent material

75
• Yellowish brown or red, some redox depletions (gray mottling due to wetness)
• Gray, some redox concentrations (brown mottling): these colors indicate a wet condition, wetter than the above colors; only for poorly drained or very poorly drained soils and should be directly under surface layer.
5. Soil Drainage (page 37) - soil color is a good indicator; based on entire profile. Requires ability to recognize redox depletions (gray soil colors attributable to wetness), measure the depth these colors first appear below the surface, place in appropriate depth class and place the profile into its appropriate natural drainage class.
• Excessively drained: all coarse textures or shallow to bedrock porous profiles on steep slopes; no redoximorphic features (mottles due to wetness)
• Well drained: no redoximorphic features (mottles due to wetness) above 40" • Moderately well drained: redoximorphic features (mottles due to wetness) between
20-40" • Somewhat poorly drained: redoximorphic features (mottles due to wetness) between
10-20" • Poorly drained: redoximorphic features (mottles due to wetness) are dominantly directly
below the surface layer • Very poorly drained: low-lying and concave or depressions, very dark or black, thick
surface layer (high organic matter), gray subsoil, usually ponded 6. Soil Depth (page 35) - root restricting or affecting basements or septic systems interpretations. Both effective rooting depth and depth to bedrock is required. Criteria for both depth classes are given on exam. Effective rooting depth is the same as depth to bedrock unless a fragipan (hardpan), sustained (permanent) high water table, or significant layer of coarse gravel and sand (greater than 60% gravel) occurs above bedrock. Information sign and/or proctor will provide guidance as to depth to these restrictions.
• Very deep: >60" • Deep: 40-60" • Moderately deep: 20-40" • Shallow: 10-20" • Very shallow: <10"
7. Soil Texture (page 28) - requires the ability to determine texture by feel on both topsoil and subsoil horizons and place in one of the 5 broad textural groups. USDA textural classes are provided on exam for further guidance. Texture samples may be provided or a depth increment may be designated for extraction of texture samples from the profile. Topsoil (A-horizon)--organic matter may increase feeling of smoothness
• Coarse: sand, loamy sand, very gritty, none to very little ribbon, poorly formed stable ball (if at all)
• Moderately coarse: sandy loam, fine sandy loam, gritty, some ribboning, stable ball

76
• Medium: loam, silt loam, sandy clay loam, maybe gritty or smooth, good ribbon (>2"), (if real gritty then must be sticky also)
• Moderately fine: clay loam, silty clay loam, smooth, excellent ribbon, sticky • Fine: clay, sandy clay, silty clay, hard to work up, very sticky, long ribbon (>3")
Subsoil (B horizon)—see individual textural group information above
• Coarse • Moderately coarse • Medium • Moderately fine • Fine
8. Soil Permeability (page 34) - is required on both the topsoil and subsoil layers and is primarily dependent upon textural group of each of these layers. Textural groups are given on exam and correlated to respective permeability rates. Caution - textural group defines permeability unless the soil contains a fragipan (hardpan) or it is formed in a limestone or similar parent material where structure is strongly expressed. Soils with fragipans have slow permeability in the subsoil regardless of texture and soils developed from limestone have moderate permeability although subsoil texture may be in the "fine" textural group.
• Rapid: >6.0 in./hr., coarse textures • Moderately rapid: 2.0-6.0 in./hr., moderately coarse textures • Moderate: 0.6-2.0 in./hr., medium textures • Moderately slow: 0.2-0.6 in./hr., moderately fine textures • Slow: <0.2 in./hr., fine textures or fragipan present
9. Soil Reaction (page 37) - requires the ability to properly use Hellige -Truog or other test kits as demonstrated in training session to determine pH on both topsoil and subsoil layers. More precise information may or may not be provided by proctor for sampling locations. pH should be estimated to the nearest tenth, i.e. 5.7. In most cases, a 1 to 1 1/2 pH range, bracketing the measured pH, is allowed for full credit. Part C. Soil and Site Interpretations - these responses are based on landscape features and soil property decisions made in the preceding Parts A and B. Agriculture Suitability 1. Major limiting factors - can check more than one; limiting to crop growth. Check all that apply, based on previous determinations and information provided on the information sign. Limiting criteria for each factor are given on the exam.
• None: Land Capability Class I • Flooding or ponding: check if occasional or frequent; will be noted on pit
information sign • Slope: check for any >2% • Past Erosion: check only if severe • Effective rooting depth: check for any <40" deep
77
• Drainage: check when redox depletions, gray mottles due to wetness are found <40" deep, this includes all drainage classes except well and excessively drained
• Permeability: check if rapid or slow • Available water capacity: check if all coarse textures • Stoniness or rock outcrop: check if found at soil pit site
2. Land Capability Class (page 47) - while technical criteria for Land Capability Class and subclass as provided in soil survey reports, can be quite complex, only the major Land Capability Class is requested based upon criteria listed on the exam. Caution - carefully heed the meaning of the words, "and" and "or" in these criteria. 3. Prime Farmland (page 52) - based on Land Capability Classification; check if Land Cap. Class is I or II from answer above. 4. Hydric Soil (page 52) - is included to illustrate relationship to poorly drained and very poorly drained soils, as identified in question Part B #5, and possible wetland implications. 5. Potential Future Erosion (page 46) - is included to emphasize the significance of future erosion potential on the site if cultivated for agricultural purposes, or otherwise disturbed in timber harvest operations, or in other urban related uses. For this exam it is based strictly on slope class determined in question Part A. #3.
• Slight-- nearly level slopes (0 to 2% or 0 to 3%) • Moderate--gently slopes (2 to 5% or 3 to 8%) • Severe-- strongly sloping to very steep (>5% or >8%)
6. Best Management Practices (page 57) - while there are numerous BMP’s available for erosion control and water quality improvement, this question uses drainage class, slope, and Land Cap. Class to identify needed BMP's for the soil and site. Criteria are given on the exam.
• Drainage: would be needed for moderately well drained, or somewhat poorly drained, or poorly drained, or very poorly drained soils, and Land Cap. Class ≤ IV.
• Irrigation: would be needed for excessively well drained soils and Land Cap. Class ≤ IV. • Contour farming: gently sloping soils and Land Cap. Class II • Contour stripcropping: strongly sloping or moderately steep soils and Land Cap.
Class ≤ IV. • Grassed waterways: site is located in a drainageway or swale which conveys
concentrated runoff and Land Cap. Class ≤ IV • No-till Farming: Land Cap. Class ≤ IV • Permanent vegetation: Land Cap. class V, VI, VII, or VIII • Cover crops: Land Cap. Class ≤ IV
Soil Health (page 66) 7. Munsell Soil Chart Notation – the color of the topsoil layer can be used to infer organic matter content which is related to soil health. The darker the soil color the higher the organic matter content, the better the health of the soil.
• Good: Soil is dark brown or black in color; organic matter is visible in the topsoil layer. Value < 3 and chroma < 3.
• Fair: Soil is somewhat dark in color; little organic matter is visible in the topsoil layer. Value = 4 and chroma = 4

78
• Poor: Soil is bright to dull colored; no organic matter is visible in the topsoil layer. Value > 4 and chroma > 4
8. Pin Flag – Compaction – the amount of compaction of the topsoil layer is related to soil health and root growth. The more compaction the worst the health of the soil is. Insertion of a pin flag, into the topsoil, can infer the amount of compaction.
• Good: Wire flag enters soil easily to a depth below the topsoil layer; unrestricted root penetration.
• Fair: Wire flag enters soil, but requires force to reach a depth below the topsoil layer; root growth restricted.
• Poor: Wire flag enters soil with force, but does not penetrate through the topsoil layer; roots growing laterally.
9. Structure and Aggregation of Topsoil – the amount of aggregation/structure of the topsoil layer is related to soil health. The more aggregation and fine roots in the layer the better the soil health.
• Good: Soil is granular, soft and crumbly, held together with many fine roots. Looks like cottage cheese.
• Fair: Soil is blocky and firmer with some fine roots. • Poor: Soil is single grain, massive or platy and hard to break apart. It has few or no
fine roots. 10. Nutrient Management (page 64) - requires basic knowledge of types of crops (legumes vs. non legumes), soil test results, and when nutrients as well as lime should be applied. Legume crops such as soybeans, alfalfa, and clovers do not require nitrogen. All other crops such as corn, small grains, and grasses for hay or pasture require supplemental nitrogen for optimum productivity. Recommendations are given for the crop indicated on information sign irrespective of what might actually be growing on the site. Soil tests for magnesium, phosphorus, and potassium will be given on information sign as VL = Very low, L = Low, M = Medium, H = High or VH = Very high. These nutrients are needed or recommended if the soil test is VL, L or M. Lime is recommended if the pH of the topsoil layer is less than 6.5.
• Lime: check if pH <6.5 • Nitrogen: check if anything other than legumes • Phosphorus (Phosphate): check if not high or very high • Potassium (Potash): check if not high or very high • Magnesium: check if not high or very high
Urban Suitability 11. Suitability for Septic Tank Absorption Fields - requires the ability to apply soil properties, determined from exposed soil profile and site in previous parts of the exam, to arrive at a suitability rating for this use. Soil features include slope, flooding, depth to bedrock, depth to redox features (wetness), and subsoil permeability. The most limiting level of any of the five soil properties dictates the overall degree of suitability. Example, if the site were nearly level, no flooding, with bedrock > 72 inches, depth to redox depletions (gray colors/wetness) in the 40 - 72 inch range and slow permeability, the suitability would be SEVERE because of the slow permeability. Caution - since many soil pits, for safety purposes are seldom excavated to a depth of 72 inches or more, it is presumed that conditions evident at the bottom of the exposed profile, i.e. at 60 inches for example, also represent conditions at > 72 inches unless specific guidance to the contrary is provided on the information sign or by the proctor.

79
12. Suitability for Lawns - is similar in format to suitability for septic tank absorption fields except that key soil properties are different as are some criteria depth ranges, i.e. depth to redox depletions (wetness). This suitability rating also requires the estimation of % rock fragment (gravel) by volume in the surface layer. Representative samples of varying gravel contents should be carefully evaluated during training sessions for reference. Soil properties include slope, soil surface texture, rock fragments in or on surface, past erosion, and, depth to redox depletions (gray colors/wetness) 13. Suitability for Dwellings with basements - is similar in format to other suitability questions except soil features and criteria change. Again, soil features determined in earlier portion of exam are used to arrive at an overall suitability. Soil features include slope, flooding, depth to bedrock, depth to redox depletions (gray colors/wetness). Wildlife Suitability 14. Suitability for Wildlife habitat - Section II. Soil Survey Use (page 53) - this portion of exam is intended to expose the participant to the soil survey report and how to find soils information contained in it. The participant will be given a real-life scenario and a soils map with a legend of the mapping units. They will be required to use the report to find the answers to questions related to the soil map. Some questions may be related to soil interpretations others to specific soil properties. In most cases the questions will be the same across the county or state but responses will change depending upon the soil survey area. An example of a scenario is: “You have just purchased a piece of property in ??????? County. The following is the soils map and soil legend for the property you just purchased. You’re unsure of what you want to do. You may want to develop it, do some farming, or change some areas to attract wildlife. Using the soil survey, answer the following questions to help you decide where the most appropriate places are to do these things on your property.” NOTE: Although the “official” soil surveys for Maryland are all on the NRCS Web Soil Survey internet site (http://websoilsurvey.nrcs.usda.gov/app/), for the contest, soil survey information reports will be provided to the students for answering questions. Section III. Fifth Issue as Related to Soils - this portion of the exam consists of general knowledge questions of the current Fifth Issue subject as it is related to soils. The questions are usually taken from reference materials posted on the State Envirothon web page or from handouts provided by the soil instructors.