carbon stocks in danish forest types - welcome to epsilon...
TRANSCRIPT

Swedish University of Agricultural Sciences Department of Soil and Environment
Carbon Stocks in Danish Forest Types Judith Boveland
Master’s Thesis in Environmental Science Environmental Science in Europe – Master’s Programme Institutionen för mark och miljö, SLU Uppsala 2012 Examensarbeten 2012:13


SLU, Swedish University of Agricultural Sciences Faculty of Natural Resources and Agricultural Sciences Department of Soil and Environment Judith Boveland Carbon Stocks in Danish Forest Types Supervisor: Erik Karltun, Department of Soil and Environment, SLU Assistant supervisors: Inge Stupak Møller & Lars Vesterdal, Department of Forest and Landscape, University of Copenhagen Examiner: Johan Stendahl, Department of Soil and Environment, SLU EX0431, Independent Project in Environmental Science - Master´s thesis, 30 credits, A2E Environmental Science in Europe – Master’s Programme 120 credits Series title: Examensarbeten, Institutionen för mark och miljö, SLU 2012:13 Uppsala 2012 Keywords: forest carbon storage, carbon pools, biomass carbon, dead wood carbon, forest floor carbon, soil carbon Online publication: http://stud.epsilon.slu.se Cover: photo from http://www.pluswallpapers.com/nature/landscape.htm


Abstract
Carbon stocks in Danish forest types i
Abstract
As part of international agreements, countries are now obliged to monitor their greenhouse gas
emissions as well as to report their possible sources and sinks. Carbon dioxide is one of the six green-
house gases listed in the Kyoto Protocol, contributing to global warming. Research is conducted to
gain knowledge on how to maximise forest carbon storage capacity, albeit, there are some con-
straints and limitations to both the role of forests in CO2 mitigation efforts and the estimation and
comparison of forest carbon stocks. Forests provide multiple services which might be in conflict to a
management strategy solely addressing carbon storage. The estimation and comparison of forest
carbon stocks is insofar limited as for instance studies use different definitions for dead wood and
different soil depth. With respect to a changing climate, forests are subjected to changes that are not
fully predictable yet.
In this study, I have examined the effect of stand age, soil category, tree species, crown cover, broad-
leaf fraction, tree species biodiversity, precipitation as well as previous land use on biomass, dead
wood, forest floor and soil carbon stock on Danish forests. The main influence derives from stand
age, soil category, tree species and crown cover. Depending on the carbon pool one to two of these
variables explain more than 50% of the variation in the respective model. In general, older forests
contain more C than younger ones. With increasing age, the biomass volume grows and the forest
floor develops, thus, accumulates C. Each soil category is characterized by its properties, which
among others determine the turnover rate of SOM, and consequently influencing the soil C stock.
The tree species significantly influence the C stocks due to their different litter quality and root sys-
tem. On average, a high crown cover indicates bigger biomass volumes and hence, greater C stock.
Previous land use significantly influences only the forest floor C stock. The relative C stocks are simi-
lar to the absolute ones; here the soil C pool differs most, were e.g. the effect of broadleaf fraction
and biodiversity enters the model. Furthermore, other factors such as forest management and the
market for forest products influence C storage. The former especially affects the dead wood, forest
floor and soil C stock. The wood market in turn, influences the forest management and gives an ex-
planation for the average age of tree species. In total, broadleaf forests and forests on organic soil
category contain the most C. The average soil C stock amounts to 184 tC ha-1
, the biomass C stock
contains 81.2 tC ha-1
on average, about 1.16 tC ha-1
is stored in dead wood and 15.3 tC ha-1
in forest
floor.

Table of Contents
Carbon stocks in Danish forest types ii
Table of Contents
Abstract .................................................................................................................................................... i
Table of Contents .....................................................................................................................................ii
Index of Figures ....................................................................................................................................... iv
Index of Tables ....................................................................................................................................... vii
List of Abbreviations ................................................................................................................................ ix
1. Introduction ..................................................................................................................................... 1
1.1. Background .............................................................................................................................. 1
1.2. International agreement on reporting forest carbon ............................................................. 1
1.3. Estimating forest carbon ......................................................................................................... 2
2. Literature review ............................................................................................................................. 4
2.1. The global carbon cycle ........................................................................................................... 4
2.2. Forest carbon sequestration ................................................................................................... 6
2.3. Carbon dynamics in temperate forests ................................................................................... 8
2.4. Factors influencing forest C storage ........................................................................................ 9
2.5. Climate change impacts on forest ecosystems ..................................................................... 14
2.6. Constraints on the role of forests in greenhouse gas mitigation .......................................... 17
2.7. Danish forests ........................................................................................................................ 18
3. Objectives and hypothesis............................................................................................................. 19
4. Material and methods ................................................................................................................... 21
4.1. Description of the study sites ................................................................................................ 21
4.2. Sampling design ..................................................................................................................... 22
4.3. Data acquisition of biomass and dead wood carbon ............................................................ 23
4.4. Data acquisition of soil and forest floor carbon .................................................................... 24
4.5. Data acquisition of explaining variables ................................................................................ 24
4.6. Laboratory preparation of soil and forest floor samples ...................................................... 27
4.7. Chemical analysis................................................................................................................... 27
4.8. Calculations of carbon stocks ................................................................................................ 27
4.9. Statistical analysis .................................................................................................................. 29
5. Results ........................................................................................................................................... 31
5.1. Total carbon stock ................................................................................................................. 32
5.2. Individual carbon pools ......................................................................................................... 34
5.2.1. Biomass .............................................................................................................................. 34
5.2.2. Dead wood ........................................................................................................................ 35

Table of Contents
Carbon stocks in Danish forest types iii
5.2.3. Forest floor ........................................................................................................................ 36
5.2.4. Soil ..................................................................................................................................... 38
5.3. Relative carbon stock ............................................................................................................ 40
5.2.5. Biomass .............................................................................................................................. 40
5.2.6. Dead wood ........................................................................................................................ 41
5.2.7. Forest floor ........................................................................................................................ 42
5.2.8. Soil ..................................................................................................................................... 44
6. Discussion ...................................................................................................................................... 45
6.1. Stand age ............................................................................................................................... 46
6.2. Soil category .......................................................................................................................... 47
6.3. Crown cover .......................................................................................................................... 47
6.4. Tree species category ............................................................................................................ 48
6.5. Precipitation .......................................................................................................................... 50
6.6. Previous land use ................................................................................................................... 50
6.7. Broadleaf fraction .................................................................................................................. 51
6.8. Biodiversity ............................................................................................................................ 51
6.9. Other factors ......................................................................................................................... 51
6.10. Statistical considerations ................................................................................................... 52
7. Conclusion ..................................................................................................................................... 52
Acknowledgement ................................................................................................................................. 54
References ............................................................................................................................................. 55
Appendix ................................................................................................................................................ 63
Appendix I: List of Variables and Measurement Units ...................................................................... 63
Appendix II: Basic statistics for relative C stocks ............................................................................... 65
Appendix III: Distribution of total C stock to single tree species ...................................................... 65
Appendix IV: Original model result for absolute dead wood C stock ............................................... 66
Appendix V: Residual plots for total C stock and each absolute C pool ............................................ 66
Appendix VI: Residual plots for each relative C pool ........................................................................ 71
Appendix VII: Mean values for categorical variables for each carbon pool ...................................... 74
Appendix VIII: Soil types (GEUS_200 map and definition of soil type codes) ................................... 77
Index of Figures
Carbon stocks in Danish forest types vi
Index of Figures
Fig. 1. The global carbon cycle with data for the 1990s, showing the main annual pre-
industrial fluxes in GtC yr-1. The red lines indicate anthropogenic fluxes, the black
ones show natural fluxes. GPP is the terrestrial annual gross primary production
(IPCC 2007b). ........................................................................................................................................................ 4
Fig. 2. Left: CO2 concentrations from sites in the SIO Air Sampling Network in ppmv
from 1960 – 2010 at Mauna Lao, Hawaii (Keeling et al. 2009). Right: Global
temperature anomalies from 1880-2011 (land meteorological stations only).
Modified from J.E. Hansen, R. Ruedy, M. Sato, and K. Lo; NASA Goddard Institute
for Space Studies (Hansen et al. 2012). ...................................................................................................... 6
Fig. 3. Carbon cycle within the forest ecosystem (Lorenz & Lal 2010). ................................................ 7
Fig. 4. Forest types occurring in Denmark at seven time-slices (Bradshaw et al. 1999). ........... 19
Fig. 5. Landscape types in Denmark (Krogh & Greve 2006). .................................................................. 22
Fig. 6. Design of the Secondary Sampling Unit (SSU), with a radius of 15 m. The
samplings are taken to the north, east, south and west, respectively with a radius
of 5, 10 and 15 m from the middle point. They are displayed in the black dots,
named N15, N10, N5 etc. In the middle of the SSU is a metal pin to help finding the
plot. ........................................................................................................................................................................ 24
Fig. 7. Average relative carbon content of each pool. ................................................................................ 31
Fig. 8. Total C stock as a function of stand age for different soil category (left).
Influence of crown cover and tree species category on total carbon stock after the
effects of the variables before (1. effect: stand age. 2. effect: soil category. 3. effect:
crown cover. 4. Effect: tree species category) have been removed. Shows how
much is explained by the added variable on the X-axis (right). ................................................... 33
Fig. 9. Biomass carbon by stand age (left) and by crown cover (right). ........................................... 34
Fig. 10. Dead wood carbon by crown cover (left). Influence of the interaction of
crown cover and tree species category on dead wood carbon stock after the effect
of the variable before (crown cover) has been removed. Shows how much is
explained by this interaction (right). ...................................................................................................... 35
Fig. 11. Forest floor carbon stock as a function of stand age for different tree species
categories (top). Forest floor carbon stock as a function of stand age by single tree
species (bottom left: broadleaf species; bottom right: conifer species). ............................... 38
Fig. 12. Relative biomass carbon by stand age (left) and by crown cover (right). ..................... 41
Fig. 13. Relative dead wood carbon by crown cover. ............................................................................... 42
Fig. 14. Relative forest floor carbon stock as a function of stand age for different tree
species categories. ........................................................................................................................................... 43
Fig. 15. Relative soil carbon by stand age (top left). Influences of broadleaf fraction
on relative soil carbon stock after the effects of the variables before have been
removed (stand age and crown cover). Shows how much is explained by the
added variable on the X-axis (top right). Relative soil carbon stock as a function of
biodiversity for different stand age classes (bottom). ..................................................................... 45
Fig. 16. Influences of each significant variable on total carbon stock after the effects of
the variables before have been removed. Shows how much is explained by the
added variable on the X-axis. 1. effect: stand age. 2. effect: soil category (here: the
median, the interval of 25% to 75% (box) and minimum and maximum values are
shown). 3. effect: crown cover. 4. effect: stand age*crown cover (classes). 5. Effect:

Index of Figures
Carbon stocks in Danish forest types v
tree species category. 6. effect: interaction of crown cover * tree species category.
7. effect: interaction of stand age and soil category. .......................................................................... 67
Fig. 17. Total carbon stock by stand age and tree species category. (1) and stand age
and single tree species ((2)= broadleaf species; (3)= conifer species). As no clear
pattern is detectable, this interaction has no significant influence on total carbon
stock. ...................................................................................................................................................................... 68
Fig. 18. Influences of each significant variable on biomass carbon stock after the
effects of the variables before have been removed. Shows how much is explained
by the added variable on the X-axis. 1. effect: stand age. 2. effect: crown cover. 3.
effect: soil category (here: the median, the interval of 25% to 75% (box) and
minimum and maximum values are shown). ....................................................................................... 68
Fig. 19. Influences of each significant variable on forest floor carbon stock after the
effects of the variables before have been removed. Shows how much is explained
by the added variable on the X-axis. 1. effect: tree species category. 2. effect: stand
age. 3. effect: precipitation. 4. Effect: interaction of stand age * tree species
category. 5. effect: previous land use (here: the median, the interval of 25% to
75% (box) and minimum and maximum values are shown). ....................................................... 69
Fig. 20. Distribution of forest floor carbon by previous land use (here: the median, the
interval of 25% to 75% (box) and minimum and maximum values are shown). ................. 70
Fig. 21. Influences of each significant variable on soil carbon stock after the effects of
the variables before have been removed. Shows how much is explained by the
added variable on the X-axis. 1. effect: soil category. 2. effect: tree species category
(here: the median, the interval of 25% to 75% (box) and minimum and maximum
values are shown). ........................................................................................................................................... 70
Fig. 22. Distribution of total carbon by soil categories (bottom) (here: the median,
the interval of 25% to 75% (box) and minimum and maximum values are shown)........... 71
Fig. 23. Influences of each significant variable on relative biomass carbon stock after
the effects of the variables before have been removed. Shows how much is
explained by the added variable on the X-axis. 1. effect: stand age. 2. effect: crown
cover. 3. effect: soil category (here: the median, the interval of 25% to 75% (box)
and minimum and maximum values are shown). 4. effect: tree species category. ............... 72
Fig. 24. Influences of each significant variable on relative forest floor carbon stock
after the effects of the variables before have been removed. Shows how much is
explained by the added variable on the X-axis. 1. effect: tree species category
(here: the median, the interval of 25% to 75% (box) and minimum and maximum
values are shown). 2. effect: precipitation. 3. effect: stand age. 4. effect: PLU. 5.
effect: stand age*tree species category. .................................................................................................. 72
Fig. 25. Distribution of relative forest floor carbon by previous land use (here: the
median, the interval of 25% to 75% (box) and minimum and maximum values are
shown). ................................................................................................................................................................. 73
Fig. 26. Influences of each significant variable on relative soil carbon stock after the
effects of the variables before have been removed. Shows how much is explained
by the added variable on the X-axis. 1. effect: stand age. 2. effect: crown cover. 3.
effect: broadleaf fraction. 4. effect: soil category (here: the median, the interval of
25% to 75% (box) and minimum and maximum values are shown). 5. effect:
biodiversity*stand age (classes). ............................................................................................................... 74
Fig. 27. Soil type classification in Denmark, according to the GEUS_200 map……………….77

Index of Tables
Carbon stocks in Danish forest types vii
Index of Tables
Tab. 1. Forest carbon stock in t ha-1 by region, in 2010 (modified from FAO 2010). ................... 8
Tab. 2. Forest area divided into land use classes (changed after Nord-Larsen et al.
2010). .................................................................................................................................................................... 21
Tab. 3. Definition and distribution of soil category on total sample plots. .................................... 25
Tab. 4. Sample distribution of tree species category on total sample plots (n=277). ............... 26
Tab. 5. Sample distribution of single tree species (n=185). ................................................................. 26
Tab. 6. Sample distribution of tree species category on soil category and previous
land use. ............................................................................................................................................................... 30
Tab. 7. Sample distribution of single tree species on soil category and previous land
use. 30
Tab. 8. Basic statistics of total carbon stock and the four carbon pools. ........................................ 31
Tab. 9. Model results for total carbon stock: significant effects influencing total
carbon stock, loge-transformed (n=277). ............................................................................................... 32
Tab. 10. Basic statistics of total carbon stocks distributed to soil category, tree species
category and single tree species. ............................................................................................................... 33
Tab. 11. Model results for biomass carbon stock: significant effects influencing
biomass carbon stock, square-root transformed (n=267). ............................................................. 34
Tab. 12. Basic statistics of biomass carbon stocks distributed to soil category. ............................ 35
Tab. 13. Model results for dead wood carbon stock: significant effects influencing dead
wood carbon stock, loge-transformed (n=87). ..................................................................................... 36
Tab. 14. Model results for forest floor carbon stock: significant effects influencing
forest floor carbon stock, loge-transformed (n=275). ....................................................................... 36
Tab. 15. Basic statistics of forest floor carbon stocks distributed to PLU, tree species
category and single tree species. ............................................................................................................... 37
Tab. 16. Model results for soil carbon stock: significant effect influencing soil carbon
stock; loge -transformed (n=277). ............................................................................................................. 39
Tab. 17. Basic statistics of soil carbon stocks distributed to soil category, tree species
category and single tree species. ............................................................................................................... 39
Tab. 18. Model results for relative biomass carbon stock: significant effects influencing
relative biomass carbon stock; sqrt-transformed (n=267). ........................................................... 40
Tab. 19. Basic statistics of relative biomass carbon stocks distributed to soil category
and tree species category. ............................................................................................................................ 41
Tab. 20. Model results for relative dead wood carbon stock: significant effects
influencing relative dead wood carbon stock; loge –transformed (n=87). ............................... 42
Tab. 21. Model results for relative forest floor carbon stock: significant effects
influencing relative forest floor carbon stock; loge –transformed (n=275). ............................ 43
Tab. 22. Basic statistics of relative forest floor carbon stocks distributed to PLU and
tree species category. ..................................................................................................................................... 43
Tab. 23. Model results for relative soil carbon: significant effects influencing relative
soil carbon stock; sqrt –transformed (n=268). .................................................................................... 44
Tab. 24. Basic statistics of relative soil carbon stocks distributed to soil category. ..................... 44
Tab. 25. List of variables (Variables, Abbreviation, Description, Unit) .............................................. 63
Tab. 26. Basic statistics for relative carbon stocks. .................................................................................... 65
Tab. 27. Basic statistics of total carbon stocks distributed to single tree species ......................... 65

Index of Tables
Carbon stocks in Danish forest types viii
Tab. 28. Model results for dead wood carbon stock: significant effects influencing dead
wood carbon stock, loge-transformed (n=87). ..................................................................................... 66
Tab. 29. Basic statistics for total carbon stock; for each categorical variable. ................................ 74
Tab. 30. Basic statistics for biomass carbon stock; for each categorical variable. ........................ 75
Tab. 31. Basic statistics for dead wood carbon stock; for each categorical variable. ................... 75
Tab. 32. Basic statistics for forest floor carbon stock; for each categorical variable. .................. 76
Tab. 33. Basic statistics for soil carbon stock; for each categorical variable. .................................. 76
Tab. 34. Definition of Danish soil type codes……………………………………………………………………..77

List of Abbreviations
Carbon stocks in Danish forest types ix
List of Abbreviations
AFF Afforested forest
BVOC Biogenic Volatile Organic Compounds
°C Degree Celsius
C Carbon
CO2 Carbon dioxide
DBH Diameter at Breast Height
FLEGT Forest Law Enforcement, Governance and Trade
FRF Forest remaining as forest
GHG Greenhouse Gas
GIS Geographical Information System
GLM General Linear Model
GPP (annual) Gross primary production
Gt Gigatons
ha Hectare
LIDAR Light Detection and Ranging
LSmean Least Square Mean
LULUCF Land Use, Land Use Change and Forestry
N Nitrogen
NFI National Forest Inventory
Pg Picogramm
PLU Previous Land Use
ppm Parts Per Million
PSU Primary Sampling Units
r² Coefficient of determination
REDD Reducing Emissions from Deforestation and Forest Degradation
SOC Soil Organic Carbon
SOM Soil Organic Matter
SSU Secondary Sampling Units
Std. Err. Standard Error of the Mean
t Metric tons
Temp. unst. Temporarily unstocked
TSU Tertiary Sampling Units
UNFCCC United Nations Framework Convention on Climate Change
VOC Volatile Organic Compound
yr Year
Introduction
Carbon stocks in Danish forest types 1
1. Introduction
1.1. Background
In the 1960/70s, it was first noticed that the atmospheric CO2 concentration was increasing and
that it could be correlated to an increase of global temperatures (UNFCCC n.d. (c)). More than
two decades later, it found widespread agreement among scientists that this development
should be counteracted. Therefore, international agreements to reduce greenhouse gas emis-
sions have been reached (UNFCCC n.d. (a)). These agreements encompass greenhouse gas inven-
tories, implying, among others, accurate measurements as well as transparent reporting of CO2
emissions and C stock changes. Moreover, the gained information on national C stocks and de-
velopment need to be comparable among each other. Taking CO2 emissions as an example, it was
and still is necessary to gain a better understanding of the processes affecting carbon sequestra-
tion and storage, in order to be able to manage forests appropriately and set the right policies.
According to UNEP et al. (2008) “a sink is any process, activity or mechanism that removes a
greenhouse gas, an aerosol or a precursor of a greenhouse gas or aerosol from the atmosphere.
[…] The uptake of CO2 in a reservoir, whether natural or artificial is also called carbon sequestra-
tion.”
Trees, grasses as well as most other plants are able to take up CO2 via photosynthesis. Carbon is
stored in biomass, dead wood, forest floor (O-Horizon) and soil when the net primary produc-
tion in an ecosystem is higher than the heterotrophic respiration rate (Vejre et al. 2003). Com-
paring tropical, temperate and boreal forests (including vegetation and soil to 1 m depth), most
carbon, 408 t C ha-1, is stored in boreal forests, followed by tropical forests with 243 t C ha-1.
Temperate forests store far less carbon, averaging only 152 t C ha-1 (18.9%) (IPCC 2000), com-
prising the smallest total area (5% of the world’s forest area (Lorenz & Lal 2010)) of the three
major forest biomes. Forests as a whole display a huge sink for C but can also become a source
for C emissions due to human induced deforestation, especially in the tropics (Pan et al. 2011).
Therefore, terrestrial ecosystems play a major part in the global C cycle.
1.2. International agreement on reporting forest carbon
At the United Nations Conference in Rio de Janeiro in 1992, countries admitted the increasing
global temperature and confessed the importance of limiting greenhouse gas (GHG) emissions
by launching the United Nations Framework Convention on Climate Change (UNFCCC). Along
with the Kyoto Protocol signed in 1997 and entered into force in 2005, signatory countries were
now obliged to conduct annual GHG inventories, including the Land Use and Land Use Change
and Forestry (LULUCF) sector, to report their emissions by sources and sinks as well as their
achievements in limiting GHG emissions. For the latter, countries get carbon credits with which
they can trade (art. 6 Kyoto Protocol). As stated in art. 3.1 of the Kyoto Protocol, all Annex I
countries are compelled to achieve an overall emission reduction of at least 5% compared to the
level of the year 1990 (and 1995 for industrial gases) in the first commitment period 2008 –
2012 (United Nations 1998). The European Union committed itself to an 8% reduction (United
Nations n.d.). The EU burden sharing agreement lead Denmark to set an emission reduction tar-
get of 21% (UNFCCC 2002b).

Introduction
Carbon stocks in Danish forest types 2
Guidelines for the GHG’s inventories were established by the Intergovernmental Panel on Cli-
mate Change in 2002 (UNFCCC 2002a). The inventory for the UNFCCC within the LULUCF sector
implies five carbon pools, namely above- and belowground biomass, dead wood, litter and soil
organic C with uncertainty estimation at a confidence interval of 95% (IPCC 2003). These pools
are also an integral part of fulfilling the Kyoto Protocol requirements (art. 3.3 and 3.4). To be
able to report the GHG emissions for the forest sector, including a differentiation between the
above mentioned four C pools, countries undertake a National Forest Inventory (NFI). Besides
the estimation of the C stock size, the data can be used to determine the degree to which certain
aspects, like stand age or tree species, influence the C stock in both the different pools and in
total (all pools combined). However, soil C pools that turn out not to be a source of C emissions
could be excluded from the inventory (United Nations 1998). Denmark applies the “non-source”
principle, meaning that it will not report C fluxes in forest soils since it is proved that they are
not a source for C emissions (Sverrild et al. 2009).
Reports on forest C, like national forest inventories, not only reveal the amount of C accumulated
in forests in the respective inventory year, it has also made it possible to follow changes in the
forest C budget over the years. A further aspect of C reporting is to set a baseline for trading with
carbon credits. Moreover, instruments exist that address the reduction of deforestation. For ex-
ample within the Clean Development Mechanism, developed nations have the possibility to off-
set their C emissions by financially supporting developing countries e.g. to conserve their forests
or to support carbon mitigation projects (UNFCCC n.d. b). Another method for deforestation re-
duction, which is not part of the Kyoto Protocol, is the REDD(+) concept. It aims at reducing
emissions from deforestation and forest degradation in the context of C trading (FAO et al.
2008). In addition, private certification schemes, such as the Forest Stewardship Council, or oth-
er voluntary partnership agreements like the Forest Law Enforcement, Governance and Trade
action plan (FLEGT) of the European Union, contribute to the attempt by substituting clear cuts
and illegal logging with substituting sustainable forest management and strengthening good
forest governance of participating countries (European Forest Institute n.d.). However, these
methods also have constraints. Basically, they will only function properly, if forested areas yield
a higher price than the conversion to agricultural fields. In other words, they will only function if
they can be implemented in an economically reasonable way (FAO 2012; Lorenz & Lal 2010).
1.3. Estimating forest carbon
As forests are heterogeneous ecosystems, it is difficult to estimate the C stock and fluxes over
large areas. Common problems include the comparison or combination of results of inde-
pendently conducted sampling designs of forest C pools within the same type of ecosystem. Suf-
ficient data has to be collected to guarantee a statistically sound analysis (Jia & Akiyama 2005).
The best established method for measuring C in forests is based on statistically correct sampling
designs, including permanent sampling plots and a division in forest C pools (Brown 2002; Jia &
Akiyama 2005), as it is conducted in Denmark. Nevertheless, it is challenging to assess soil C
stocks due to the inhomogeneous nature of soil ecosystems (Grace 2004). Most soil surveys are
restricted to 100 cm depth. Jia & Akiyama (2005) criticise this fixed number and argue for en-
larging the sampling depth, because there are great variations over the landscape which in turn
impact the size of the soil C pool and thereby, the total forest C pool. For example in their study,
an extension of the sampling depth to 300 cm led to an increase in soil C stock of 24% in com-

Introduction
Carbon stocks in Danish forest types 3
parison to 100 cm depth. In addition, soil C stock are exposed to overestimations if no correction
of the bulk ratio of rocks is being made (Jia & Akiyama 2005).
Biomass and dead wood biomass are directly calculated from the tree measurement data by
using biomass expansion factors or regression equations. However, those equations bear some
uncertainties, too (Mäkipaä et al. 2008). Biomass equations are restricted mainly due to their
poor representativeness on a national-scale. In most cases they are based on only a few felled
sample trees on a few number of sites (Mäkipaä et al. 2008). A comparison with other studies is
not always possible since different equations for calculating the biomass volume are applied.
For calculating dead wood biomass, a decomposition factor (depending on decomposition rates)
is used with which the wood density is determined. This might cause wrong results because
such a correlation does not always exist. Heartwood, for instance, is very resistant. It can still
have a very high density even though it has already lost the bark and sapwood, which leads to a
wrong classification of decomposition rate (Brown 2002). Comparison of dead wood contents in
forests among countries and studies is rarely possible since most countries only have begun to
conduct dead wood inventories. Additionally, different definitions of dead wood hinder a har-
monization of national forest inventories yet, some countries only measure standing dead wood,
while others also include coarse roots. What is more, the minimum diameters for both standing
and lying dead wood vary with country (Woodall et al. 2009). In total, Jia & Akiyama (2005) in-
dicate that the C storage of vegetation can be underestimated by about 12%, at least in cool-
temperate forests, if standing dead trees and coarse woody debris are left out of the analysis (Jia
& Akiyama 2005)(Jia & Akiyama 2005)(Jia & Akiyama 2005)(Jia & Akiyama 2005)(Jia & Akiyama
2005)(Jia & Akiyama 2005)(Jia & Akiyama 2005)(Jia & Akiyama 2005)(Jia & Akiyama 2005)(Jia
& Akiyama 2005)(Jia & Akiyama 2005)(Jia & Akiyama 2005)(Jia & Akiyama 2005).
Bradford et al. (2010) found that aboveground biomass has by far the highest sampling re-
quirements compared to aboveground dead woody biomass, forest floor and soil (in increasing
order), in order to ensure valid estimation of this C pool. Dead wood C pool requires more sam-
pling plots than for both forest floor and mineral soil C pool. Regarding the size of the sampling
plots, it is most efficient to sample a greater number of smaller individual plots, that are spread
over the study area instead of large plots or plots grouped into clusters (Bradford et al. 2010).
In the future, measurements of forest biomass C might be conducted via remote sensing
(Bradford et al. 2010; Grace 2004; Brown 2002). Especially the canopy height measuring LIDAR
(light detection and ranging) sensor is a promising technique to monitor the world’s forests.
Combined with the Earth Systems Science Pathfinder programme, developed by NASA, it
measures maximum canopy height, vertical distribution of canopy elements and surface topog-
raphy below the vegetation canopy. On small scales, dual-camera digital videos are coupled with
a pulse laser profiler, data recorders and differential GPS. Fixed on a single engine airplane, it
collects images that are transformed to 3D models of the terrain, from which it is possible to gain
the number of stems per unit area, the crown area, the tree crown density and the tree height
(Brown 2002). These new techniques will help to provide a more complete image of the global
forest C pool.
A predictive model not only for absolute but also for relative forest C stocks, including a differen-
tiation between the forest C pools, is another way of estimating forest C. Using this model, it
might not be necessary to conduct costly inventories every year.

Literature review
Carbon stocks in Danish forest types 4
2. Literature review
2.1. The global carbon cycle
The natural and human induced C cycle encompasses atmosphere, terrestrial biosphere and
oceans (Fig.1). Out of these three pools, oceans are the biggest C reserves (>38,000 Gt). The ter-
restrial biosphere contains about 2,300 GtC (2/3 accounting to the soils (Malhi 2002)) and the
atmosphere approximately 760 Gt (Fig. 1). Having a rather small pool, atmospheric C is relative-
ly active in terms of its exchange rate with the other two reservoirs. The main flux is between
the land and the atmosphere, in which the exchange between forest ecosystems and atmosphere
is the most significant in the short-term C cycle (<100,000 years). In this cycle, atmospheric C is
taken up via photosynthesis and returned to the atmosphere as CO2 and CH4 through respiration
by plants, animals and microbes (Lorenz & Lal 2010).
Fig. 1. The global carbon cycle with data for the 1990s, showing the main annual pre-industrial fluxes in GtC
yr-1
. The red lines indicate anthropogenic fluxes, the black ones show natural fluxes. GPP is the terrestrial
annual gross primary production (IPCC 2007b).
About 120 GtC yr-1 from the atmospheric C stock is transferred to the terrestrial biosphere via
plant photosynthesis (depicting the Gross Primary Production, GPP). This is almost 16% of the
total atmospheric C stock. At the same time, almost the same amount is returned to the atmos-
phere due to autotrophic and heterotrophic respiration. This process is dependent on tempera-
ture, precipitation, atmospheric CO2 and nutrient availability. The transfer to the soil C pool var-
ies with the type of soil and the microbial community (IPCC 2007b). Small fractions are exported
from this flux by herbivores or other animals (Malhi 2002). About 90 GtC yr-1 are flowing be-
tween the oceans and the atmosphere, while only 0.6 GtC yr-1 is exchanged from land to the
oceans. Atmospheric C is transferred to the oceans in form of CO2 by physical dissolution form-
ing HCO3 and CO23. The main uptake and release of C due to photosynthetic processes and decay
or death occurs at the surface (euphotic zone). Most of it remains in the depth of the ocean, and a
small fraction is embedded in the oceans’ sediments (IPCC 2007b).

Literature review
Carbon stocks in Danish forest types 5
An atom of C has a residence time of about 300 years in the ocean (Meier-Reimer & Hasselmann
1987). However, most of the oceanic C is recycled in the surface zone within a couple of days
(Eppley et al. 1983) to a year (Malhi 2002), depending on regional conditions affecting the ex-
port and transport of C within the ocean layers (Lutz et al. 2002; IPCC 2007b). The residence
time of C in terrestrial biosphere and atmosphere is higher than in the surface layer of the ocean
but far lower of that in deep ocean: about 17 years in the terrestrial biosphere, including 12
years in the soil, and about 4 years in the atmosphere (Malhi 2002). As C is stored in the terres-
trial biosphere over a relatively long time span, while in the oceans it is exchanged and degraded
faster, C storage in the terrestrial biosphere is essential to the attempts of increasing global C
storage as well as in reducing degradation of land with high C stocks.
The role of the ocean-atmosphere flux is an important factor considering future changes in the
atmospheric C pool. Since most of the oceans’ C is recycled within the surface layer, but only
small amounts are stored for several hundred years in deep ocean layers, processes like changes
in ocean circulation need to be investigated further. Additionally, oceans represent the biggest
CO2 sink, reaching –2.2 ± 0.4 GtC yr–1 in the 1990s and –2.2 ± 0.5 GtC yr–1 from 2000-2005. About
half as much is stored in terrestrial biosphere: -1.0 ± 0.6 GtC yr–1 in the 1990s and –0.9 ± 0.6 GtC
yr–1 from 2000-2005 (IPCC 2007b). Regarding land use changes, global forests do not regrow as
fast as deforestation is proceeding and already, the emissions due to land use change amount 1.6
GtC yr-1 in the 1990s (IPCC 2007b). This implies that C is taken up somewhere else in the terres-
trial ecosystem. Several studies (IPCC 2007b; Stephens et al. 2007) suggest that this sink might
be in forests. Firstly, because the C stock of tropical forests has been underestimated so far, and
secondly, the increased C concentration in the atmosphere itself could have a stimulating effect
on forest growth by increasing photosynthesis activity (Malhi & Wright 2004). However, at the
same time it is possible that rising temperatures increase respiration and decrease water availa-
bility. Furthermore, CO2 uptake could be restricted by nutrient deficiency or constrained by light
competition (Körner 2004).
The fluxes between atmosphere, land and ocean are more or less in balance along a timespan of
several years, whereas they may vary from one year to the next. Especially the fluxes of soil C,
including weathering of rocks, are important for the global C balance on the long term (IPCC
2007b). Since pre-industrial times, the C concentration has been linearly increasing, from 280 to
380 ppm in 2010 (Fig. 2, left) (NOAA-Research 2012; Nieder & Benbi 2008), hence, the global C
cycle is not balanced. Not only atmospheric CO2 concentrations but also other direct GHGs as
methane (CH4), nitrous oxide (N2O), perfluorocarbons (PFCs), hydrofluorocarbons (HFCs) and
sulphur hexafluoride (SF6) are increasing. Greenhouse gases absorb and emit solar radiation,
which causes the atmosphere to warm up. Without natural GHG such as water vapour (H2O),
carbon dioxide (CO2), methane (CH4), nitrous oxide (N2O) and ozone (O3), the earth’s tempera-
ture would be approximately 30 °C colder than at present. A further increase in GHG concentra-
tions, however, may lead to disastrous consequences for humanity.
Consequently, it is not surprising that the temperature anomaly increased (Fig. 2, right). Since
the 1970s land and ocean temperatures have increased by 0.6°C (Hansen et al. 2012). A fact that
cannot only be explained by natural causes such as the Milankovitch cycle, describing changes of
the earth’ orbit (IPCC 2007b). The C cycle gained specific attention because rising temperatures
are attributable to the increase in C concentrations from pre-industrial times until today for
about 60% (Grace 2004).

Literature review
Carbon stocks in Danish forest types 6
Fig. 2. Left: CO2 concentrations from sites in the SIO Air Sampling Network in ppmv from 1960 – 2010 at
Mauna Lao, Hawaii (Keeling et al. 2009). Right: Global temperature anomalies from 1880-2011 (land me-
teorological stations only). Modified from J.E. Hansen, R. Ruedy, M. Sato, and K. Lo; NASA Goddard Insti-
tute for Space Studies (Hansen et al. 2012).
After pre-industrial times the proportion of the C-13 isotopes in the atmosphere has declined. As
this isotope is more abundant in the oceans and volcanic or geothermal emissions, it leads to the
conclusion that the additional C originates from fossil fuel combustion and vegetation (IPCC
2007b). Continued burning of fossil fuels has the most severe effect on the global C cycle as a
consequence of increased atmospheric CO2 concentrations. CO2 is the most voluminous GHG
based on human-induced emissions (Gorte 2009), accounting for 75% of anthropogenic emis-
sions. These increased from 5.4 ± 0.4 GtC yr-1 in the 1980s to 6.4 ± 0.4 GtC yr -1 in the 1990s and
to 7.2 ± 0.3 GtC yr -1 from 2000-2005 (Marland et al. 2006). Moreover, due to the on-going dis-
turbance of natural ecosystems, including deforestation, and land use change (1.6 GtC yr-1, Fig.1)
the human-caused emissions have exceeded the natural capacity to keep the C cycle balanced
(Malhi 2002; IPCC 2007). According to Hougthon (2008) emissions from land to atmosphere
averaged 1.5 PgC yr-1 in the 1980s, 1.56 PgC yr-1 in the 1990s and declined to 1.47 PgC yr-1 from
2000-2005.
In order to mitigate possible adverse impacts of climate change on nature and society, investiga-
tions are undertaken to achieve a better understanding of the factors that influence the C cycle
as well as CO2 storage. One of these investigations addresses the forest C cycle.
2.2. Forest carbon sequestration
Forests cover about 31% of the earth’s land area, corresponding to about 4 billion hectares (FAO
2011). The smallest fraction has temperate forests, covering only 5%. Boreal forests cover about
11% and tropical forests 15% (Lorenz & Lal 2010). More than half of the total forest area can be
attributed to only five countries: Russia, Brazil, Canada, the United States of America and China
(FAO 2011). Deforestation declined from 16 million ha yr-1 in the 1990s to 13 million ha yr-1
from 2000-2010 (FAO 2011), even though it is still exceeding afforestation efforts (IPCC 2007b).
Main deforestation activities occur in the tropical regions, while afforestation primarily takes
place in the temperate and boreal zones. South America and Africa have the largest deforestation
and lowest afforestation rate, losing 4 million ha yr-1 and 3.4 million ha yr-1 during 2000-2010,

Literature review
Carbon stocks in Danish forest types 7
respectively. During the same time period, forests in Europe and Asia were expanding. Especially
China carries out large afforestation measures (FAO 2010). These areas, however, consist mainly
of plantation forests. In whole East Asia, these forests account for up to 35% of their total forest
area, followed by Europe (excluding Russia) with 27%. In a global perspective, 7% constitute
planted forests and 36% primary forests. More and more forests are included in management
plans, with a trend towards sustainable forest management (FAO 2010). By now, 2/3 of the
world’s forests are under a national forests programme (FAO 2011). Since forests provide mul-
tiple environmental services, it is difficult to designate forests for one specific use. About 24% of
all forests provide a “multiple use”, meaning that their management considers a combination of
several environmental services, e.g. protection of soil and water, production of goods, provision
of social services and conservation of biological diversity. Yet, forests (30%) are predominantly
used for production of wood and other forest products, the remaining are mainly subject to one
function (e.g. conservation of biodiversity) (FAO 2010).
Regarding the C stock of forests, not only the different forest biomes essentially impact the po-
tential C storage, but also different management practices (Gorte 2009; Lorenz & Lal 2010;
Dixon et al. 1994; Apps & Price 1996) All forest ecosystems sequester C by the uptake of atmos-
pheric CO2 via photosynthesis (Fig. 3).
Fig. 3. Carbon cycle within the forest ecosystem (Lorenz & Lal 2010).
The sequestered C is mainly bound as organic compounds in plant tissue, detritus (accumulating
on the forest floor) and soil. It accumulates in the soil via root growth and as decomposition
product of dead organic matter via microorganisms (Gorte 2009). Though, the process of C stor-
age is dynamic as the amount of C that is converted into biomass and transferred to the detritus
and soil pools varies with tree species, age, growth pattern and other local conditions (Gorte
2009, Lorenz & Lal 2010). In addition, temporal changes of the C stock depend on disturbances
and stand development, including canopy cover and stand age. These factors cause significant
changes in the microenvironment, e.g. the intensity of radiation, the amount of precipitation that
reaches the forest floor. Eventually, this results in changes in the nutrient availability and there-
by in return effecting biomass accumulation (Apps & Price 1996).
Forests present a paramount importance to the global C cycle since they store about half of the
total terrestrial C (Nieder & Benbi 2008). Boreal forests represent the greatest share in terres-
trial C stock, containing 26%. Temperate forests account only for 7%, while the C stock in tropi-
cal forests amounts to 20% of the terrestrial C stock (Nieder & Benbi 2008). As stated in the
Global Forest Resource Assessment Report (FAO 2010), the C stock in the world’s forest ecosys-

Literature review
Carbon stocks in Danish forest types 8
tem amounts to 162 t ha-1 in 2010, of which 45% were stored in forests soils, closely followed by
biomass C stock with 44% of total forest C stock. Dead wood and forest floor C constitute 11%
(Tab.1). In forests, up to 80% of all aboveground C and 40% of all belowground C is stored
(Dixon et al. 1994). The ratio of soil and biomass C varies between forest biomes. Temperate
forests, such as those in Europe, store two-thirds of total forest C in soils, while the soil C stock of
boreal forests is 5 times higher than its biomass C stock. Tropical forests depict a one to one ra-
tio of soil and biomass C pool (Dixon et al. 1994; FAO 2010; Lorenz & Lal 2010). As this study
uses data from Denmark, the further focus lies on temperate forests.
Tab. 1. Forest carbon stock in t ha-1
by region, in 2010 (modified from FAO 2010).
REGION Carbon
in biomass Carbon in dead wood and for-
est floor
Carbon in soil
Total carbon stock
Africa 82.8 11.7 51.1 146
Asia 60.2 5.8 59.6 126
Europe 44.8 20.5 96.4 162
North and Central
America 56.1 38.2 58.4 153
Oceania 54.8 15.3 43.2 113
South America 118 11.6 87.3 217
World 71.6 17.8 72.3 162
2.3. Carbon dynamics in temperate forests
Temperate forests cover approximately 10.4 million km², which is about 25% of the global for-
ests (Dixon et al. 1994). They represent an estimated C sink of 0.2-0.4 Pg C yr-1 (Tyrrell et al.
2012). Regarding aboveground biomass C, most of it is accumulated in tree stems, less in tree
foliage. The tree foliage shows by far the biggest C flux within the aboveground biomass, which
is due to the process of photosynthesis (17.3 t ha-1 yr-1). Furthermore, a considerable amount is
transported to the roots (8.28 t ha-1 yr-1). Belowground, C accumulates most in soil organic mat-
ter (SOM), followed by coarse roots. The fluxes belowground derive mainly from autotrophic
respiration (7.82 t ha-1 yr-1) (Malhi et al. 1999). However, with a shifting balance of photosynthe-
sis and respiration rates, temperate forests might become a C source. This also depends on their
resilience to disturbances, which mainly derive from humans (Tyrrell et al. 2012). Temperate
forests are highly seasonal. Their growth and hence the productivity mainly depends on light
and temperature (Malhi et al. 1999). Additionally, there is a high variability in C uptake within
different stand structures (addressing age and disturbance for instance). While younger stands
sequester more C than older stands, because they grow faster and their photosynthesis rate ex-
ceeds their respiration level, older stands contain (2-5 times) more C in total, which is due to the
longer accumulation period (Jandl et al. 2007; Tyrrell et al. 2012). Carbon sequestration peaks in
11-30 year old stand classes (Tyrrell et al. 2012). As most temperate forests are N-limited, ele-
vated N concentrations have a fertilizing effect on forest growth, at least until the saturation
point has been reached. The same effect is observed by increased CO2 concentrations (Malhi et
al. 1999). Overall, the C storage process is influenced by several factors.

Literature review
Carbon stocks in Danish forest types 9
2.4. Factors influencing forest C storage
Carbon storage in general depends on the balance between photosynthesis, autotrophic respira-
tion and heterotrophic respiration (Fig. 3). These factors in turn are affected by the length of the
growing season, fire, drought, wind and ice, insects, N, ozone, as well as forest management and
land use. Also the interaction of those variables should not be disregarded, though they are
poorly understood. An early starting growing season can result in early bug breaks and an early
end of the winter dormancy in conifers, thus increasing the C uptake in spring (Tyrrell et al.
2012).
A fire event leads to direct CO2 release to the atmosphere through combustion. Carbon is also
lost due to increased decomposition rates of the burned area and reduced biomass of the regen-
erated area (Tyrrell et al. 2012). In addition, depending on the frequency and magnitude, fire
outbreaks promote bigger areas of younger forests with lower C stocks. Notwithstanding that,
fire may cause soil C to increase (Lal 2005), which can be attributed to the incorporation of
charcoal (Jandl et al. 2007). Drought events have a major influence on forest C storage since
water is the predominant factor controlling tree growth as well as tree species distribution and
therefore forest composition (Tyrrell et al. 2012; Lal 2005). Though, water limitation leads to a
reduction of decomposition of soil C. Particularly wind storms affect forest succession phases.
Generally, storms do not result in big C losses as long as the downed trees or branches remain on
the ground (Jandl et al. 2007). Hence, the biomass C pool decreases, while the dead wood C pool
as well as the forest floor C stock increase.
In N-limited forest types, N deposition increases tree growth and C uptake as well as decreases
CO2 emissions (Lal 2005; Jandl et al. 2007) due to declined soil respiration, at least in the short-
term (Tyrrell et al. 2012). As N becomes directly available, the demand for recalcitrant N forms
is reduced and consequently, lowers the soil respiration (Bowden et al. 2000). In contrast, the
fertilization effect of N on N-limited forest sites is controlled by the specific site conditions
(mainly soil processes). Thus, it does not necessarily lead to an increased C uptake, but could
also decrease the soil C content when N additions cause root biomass to decline (Jandl et al.
2007). Moreover, high ozone levels diminish tree growth especially in conifers by injuring foliar,
subsequently, reducing C sequestration. High ozone levels occur in areas with high levels of sun
radiation and fossil fuel emissions (Tyrrell et al. 2012).
In addition to those abiotic disturbances, insects, particularly defoliating insects, can alter the C
sequestration rates in forests by increasing the mortality rate of with widespread defoliation.
Although, this has just a slight effect on net ecosystem productivity (Tyrrell et al. 2012). Though,
increased litter fall and accompanied changes in C:N ratio, photosynthesis and decomposition
rate through defoliation may affect nutrient cycling. Increased mortality result in a shift of C
from biomass pool to dead wood pool as well as overall decreasing photosynthesis rates but
increasing decomposition rates and consequently in a higher soil C stock (Tyrrell et al. 2012).
Finally, the forest management affects C sequestration and storage. Management for timber
harvesting, for instance, includes various rotation phases where C is released at the initial phase
and later on, sequestered again. Beyond the harvesting, the gained wood products still contain
stored C. The turnover time, however, varies by product. Wooden building structures have far
longer turnover times than paper for example (Tyrrell et al. 2012).

Literature review
Carbon stocks in Danish forest types 10
More importantly, some of the above mentioned factors are also influenced by climate variables,
mainly temperature and precipitation. Within the tree, C is assimilated in the chloroplasts where
the photosynthetic reaction takes place and the assimilated C is further transported to sites
where it is needed for consumption or the formation of plant tissues. These sites appear in foli-
age and stem as well as in reproductive materials (inflorescences, fruits/seeds, nectar) and in
roots (Lorenz & Rattan Lal 2010). In addition, C is also exported to soil microorganisms and my-
corrhiza. Further, it is lost from the tree biomass through leaching in form of dissolved C to the
soil.
Already in the chloroplasts, C3 plants respire about 20-40% of the photosynthetically fixed C
through photorespiration. Additionally, the process of creating sugar for the Calvin cycle leads to
CO2 respiration. Furthermore, CO2 is also released by mitochondria during plant leaf and root
respiration for maintenance, synthesis and growth, which is correlated to photosynthesis rates.
In general, maintenance respiration rises with increasing stand age of trees and about 25% more
C is released through growth respiration than is sequestered in new tissues. In total, about half
of the absorbed CO2 in temperate forests is released to the atmosphere (Lorenz & Lal 2010). The
optimal temperature for photosynthesis in trees is between 5 and 25°C. Most C is taken up in
spring and early summer. Although high temperatures during this time enhance C uptake, it is
decreased when high temperatures continue during summer or occur at the end of the growing
season (Malhi et al. 1999).
Young leaves that have not yet reached 25% of its full size are C sinks, taking up C from photo-
synthesis and older leaves. Older leaves, instead, are C sources, exporting C to other parts within
the tree (Lorenz & Lal 2010). During the whole life span of a tree, stem wood represents the
largest C stock. With continued age, sapwood in the inner part of the tree is converted to hard-
wood which has a higher wood density and thus higher C content (CRFR. n.d.). In general, gym-
nosperms (coniferous trees) contain lower wood densities than angiosperms (broad-leaved
trees), varying with the height within the tree as well as within individuals (Jandl et al. 2007).
Annual trees belong to r-strategists meaning that they have a short generation time and a high
reproduction rate relative to K-strategists. Hence they partition more C to reproductive organs
than perennials (Lorenz & Lal 2010). About 50% of the aboveground stored C is allocated to the
belowground biomass. As Ericsson et al. (1996) indicates, C limitation in trees causes root
growth to decrease, no matter if the C shortage is a consequence of reduced photosynthesis rates
or of competition between root growth and ammonium uptake. The same effect is reached due
to competition from intensive shoot growth and with low soil temperatures. Furthermore, tree
roots can become a C source within the tree, for instance in spring growth. Dead roots display a
source of C for the decomposition of litter or act as a substrate for litter decomposition, whereas
living roots release C to the soil by various processes, e.g. through root-associated symbionts or
respiration (Lorenz & Lal 2010). Root respiration varies with soil temperature. Generally, C re-
lease by roots is higher in forest floor than in the soil independent of the temperature, as root
tissues in the forest floor have higher nutrient concentrations (Tyrrell et al. 2012). It has to be
taken into consideration that the difference between forest floor and soil is not always clearly
detectable.
Outside the tree, the litter input, decomposition rate and SOM content determine the C flow to
soil microorganisms and mycorrhiza. Litter input depends on the normal senescence process
and seasonal fall off of vegetative and reproductive parts. Besides this, also natural disturbances
such as fire, wind, ice, snow and heavy rainfall in form of e.g. hail contribute to litter input to
forest floor and the soil. While plant residues constitute the main substrate for decomposition

Literature review
Carbon stocks in Danish forest types 11
and thus, make up the highest share (about 70-80% are derived from litter (Baritz et al. 2010))
of soil organic carbon (SOC) content, microbial biomass represents only about 5% of SOC
(Lorenz & Lal 2010). Decomposition of litter and consequently of the decomposer’s respiration
rate is controlled by plant specific litter properties (e.g. C/N ratio), by physical and chemical
properties of the surroundings (soil temperature, soil moisture), by the composition of the de-
composer community (Horwath n.d.) and by nutrient availability (Tyrrell et al. 2012). For in-
stance, high lignin or tannin contents reduce the speed of litter decomposition. Moreover, pro-
longed water-saturation of the top soils induces slower decomposition rates (Baritz et al. 2010).
In contrast to the formation of SOM, where C is reassembled in new molecules, the mineraliza-
tion process leads to C release in form of CO2 and CH4 due to heterotrophic activities (Lorenz &
Lal 2010). The heterotrophic activity is positively correlated with temperature, resulting in de-
creasing residence time of SOC (Tyrrell et al. 2012).
At the initial stage of decomposition, organic material (of plants, microbes and animal residues)
is leached by water and either absorbed to SOM (Raich & Nadelhoffer 1989) or taken up by soil
organisms or lost as dissolved organic carbon (DOC) (Lorenz & Lal 2010). Further, the soil mac-
ro- and mesofauna carry out litter fragmentation by feeding on detritus, as well as transport
litter fragments deeper into the soil. What is more, they affect the litter quality by altering the
chemical compounds of detrital C within their digestive system, making litter organic matter
more stable to further decomposition. The microfauna further decompose the remaining detri-
tus. In comparison to bacteria, fungi dominate the decomposition process. Fungi can perform at
lower pH than bacteria. Additionally, soil food webs that mainly constitute of fungi have higher
SOM concentrations compared to those dominated by bacteria. Since the different decomposi-
tion phases occur with different speed, the litter pool may be over- or under-estimated, using
short- or long-term decomposition rates respectively (Lorenz & Lal 2010). In addition to de-
composition processes in litter and soil layers, it also takes place in standing dead wood. The
SOM derived from coarse woody debris is more stable to decomposition than that of litter. In
general, gymnosperm wood decomposes slower than angiosperm wood because the wood is less
dense, has a higher lignin content, lower N and P concentrations and a higher lignin:N ratio.
While a relationship between decomposition rate of angiosperm wood and N & P concentrations
(faster) as well as C:N ratios (slower) has been observed, gymnosperms do not show such a cor-
relation (Lorenz & Lal 2010). The slowest decomposition rate and thus a stable C content in the
long-term, is in passive SOM pool with a turnover time of 100 to >1,000 years. The labile com-
pounds are already degraded in the first decomposition phases, leaving more recalcitrant com-
pounds with every further degradation step. However, the turnover rate depends on soil proper-
ties (e.g. texture, moisture, pH), site conditions and C composition (Silver & Miya 2001). Its ac-
cumulation is encouraged in low temperate and low oxygen-containing soils. On the whole,
deeper soil layers contain relatively more stabilized and recalcitrant C than upper layers. Never-
theless, increased amounts of C from roots leaching in the soil show a stimulating effect on de-
composer activity, hence enabling further decomposition of SOC in deeper layers resulting in a
loss of ancient buried C (Lorenz & Lal 2010).
Last but not least, leaching of dissolved C is a further component of C dynamics in forests. De-
ciduous trees are more susceptible to leaching than conifer trees. More C leaches from older
leaves than from younger ones (Lorenz & Lal 2010). In addition, trees emit biogenic volatile or-
ganic compounds (BVOC) and VOC compounds as well as CH4 and CO, although at far lower
magnitude than CO2. BVOC emissions (e.g. isoprene) increase with increasing temperatures, hav-
ing a protective function, but are inhibited with elevated CO2 concentrations (Lorenz & Lal

Literature review
Carbon stocks in Danish forest types 12
2010). In case if trees are beetle-infested they release up to 20% more VOC compounds as
healthy trees to defend against them (Amin et al. 2012).
Biomass carbon stock
Regarding aboveground biomass, the tree species composition is an important factor for the C
sequestration potential. In comparison to stands with a similar age structure, beech and Doug-
las-fir stands consist of a higher aboveground C stock. Forests with a mixed-species stand con-
tain more C than single species stands (Tyrrell et al. 2012). On the one hand, an explanation
would be that in a mixed species stand, the characteristics of the tree species complement each
other enabling the stand at a whole to a more efficient resource use. On the other hand this effect
can be explained by a facilitation effect between different species. According to this, one species
might increase the nutrient availability for others due to its relatively nutrient rich litter (Tyrrell
et al. 2012).
In general, the C allocation of trees to belowground biomass is lower than in aboveground bio-
mass, but highest on dry sites, whereas the stand age shows no effect on the aboveground-to-
belowground biomass proportion (Tyrrell et al. 2012).
Dead wood carbon stock
In general, more dead wood is accumulated in unmanaged than in managed forests, albeit the
amount also depends on the natural mortality rate and the decay rate. In addition, the frequency
and severity of disturbances through e.g. extreme weather events plays a major role in the pro-
portion of dead wood in a forest. Especially after disturbances, dead wood constitutes an im-
portant share in the total forest C stock by offsetting the C loss in the biomass pool (Mäkipaä et
al. 2008). Woody debris can contain large amounts of C and store it for a longer time due to slow
decomposition (Tyrrell et al. 2012).
Forest floor carbon stock
The litter quantity and quality varies with tree species and hence for forest types (Lorenz & Lal
2010; Jandl et al. 2007; Currie et al. 2003). In deciduous forests, litter accumulates during the
winter season as it decomposes slowly, and diminishes quickly in the growing season. In com-
parison to coniferous forests, deciduous forests receive larger litter fall. However, the litter layer
is higher in coniferous forests. Since coniferous litter has higher lignin content, it decomposes
slower. Nevertheless, the C pool is similar in both forest types (Tyrrell et al. 2012). Decomposing
of litter results in emission of CO2 to the atmosphere as well as in further distribution to the soil
in form of organic compounds (Tyrrell et al. 2012). Under given conditions of dryness and older
stands, the litter C pool constitutes to about 10% of the total C stock (Tyrrell et al. 2012). Moreo-
ver, environmental changes such as alterations in tree species composition (which contradict
the notation of Tyrrell et al. 2012) cause rapid changes in the forest floor layer (Baritz et al.
2010; Currie et al. 2003). All in all, this pool is highly variable due to its rapid turnover times.
Soil carbon stock
The soil C stock accumulates depending on climatic conditions (e.g. precipitation), soil type,
turnover rates of fine roots, leaching, decomposition rate as well as input rate of litter and SOM,
perturbations (Raich & Nadelhoffer 1989; Lal 2005), and activity of arthropods (Lorenz & Lal

Literature review
Carbon stocks in Danish forest types 13
2010). The latter are mixing litter and soil and thereby, affecting the soil C pool both positively
and negatively. Positive effects are gained by the mixing of soil into deeper layers. A negative
aspect of this could be that deeper soil layers, containing recalcitrant C pools, are exposed to
greater mineralization when brought to the upper soil layers. Therefore, rapid decomposition of
litter due to high arthropod activity can result in declining soil C stock and higher soil respira-
tion rates. As part of the SOM, the root mortality and decomposition varies with soil type and
influences the soil C stock (Silver & Miya 2001; Jandl et al. 2007). The root distribution and thus
the incorporation of C in the mineral soil also depends on tree species (Vesterdal et al. 2008). As
in general, the root system is rather shallow and widespread, by far the main portion (90-99%)
of the root system is found within a soil depth of down to 1 m (Crown 2005). Thus, the main C
fluxes from tree to soil occur in the top 1 m. In combination with this, the microbial activity and
hence decomposition rate is highest within the same soil depth. Moreover, root respiration
contributes a major part to total soil respiration (Raich & Nadelhoffer 1989). According to
Crown (2005), roots in coarse textured soils penetrate to a greater depth than those in loamy or
organic rich soils. However, besides the species-specific root system, high bulk density e.g. in
fine sandy soils and compacted clay soils, constrains the rooting depth. Further, low oxygen
availability and high moisture content inhibit root growth, whereas organic-rich fertile soils
enable root proliferation (Crown 2005; Coder 1998).
Degradation and mineralisation processes and thereby soil respiration are dependent on climate
variables, such as temperature and precipitation, composition of the microorganism community
and nutrient availability. It is generally higher under warm or moist conditions. Additionally, the
magnitude of soil disturbance also affects the overall soil C pool (Tyrrell et al. 2012). Baritz et al.
(2010) indicates that coarse texture soils, like sandy soils, store C differently than fine textured
soils. Fine textured soils are expected to have higher C stocks because of their high litter and
root production as well as an active decomposer system (Baritz et al. 2010; Lal 2005). Further-
more, as Baritz et al. (2010) suggests, parental material influences C stock of soils since soils
developed on calcareous parent material store significantly more C than non-calcareous soils.
Stand age and forests with similar land use history, however, do not influence soil C stock
(Tyrrell et al. 2012; Jandl et al. 2007). In order to compare study results, soil C surveys are un-
dertaken up to 1m depth. Yet, studies indicate that in addition to the upper 1m, deep mineral soil
(1-9m) also has a relatively large and stable C stock. As a consequence, the soil C stock might still
be underestimated (Tyrrell et al. 2012).
The forest floor and soil C pool are linked since DOC leaches from the upper layers to the mineral
soil (Currie et al. 2003; Vesterdal et al. 2008). On the whole, soil C stocks are less influenced by
temperature and moisture, disturbances, changed management practices and tree species com-
position as it is the case for forest floor C stock (Currie et al. 2003), but more by constant factors
e.g. climatic zone, texture or elevation (Baritz et al. 2010). However, generally, soil disturbance
leads to net soil C losses (Jandl et al. 2007). On the one hand, soil disturbances cause changes in
microclimate which in turn stimulate the decomposition of SOM and lead to soil C losses. On the
other hand, water infiltration is improved and roots might have better development conditions,
thus displaying a C input (Jandl et al. 2007).
Forests are not only of significant importance to the global C cycle in terms of C sequestration,
but also because of their reaction to changing climatic conditions which in turn affects the forest

Literature review
Carbon stocks in Danish forest types 14
C stock in total as well as in its different pools. Magnani et al. (2007) demonstrated that at least
the C cycle in boreal and temperate forests is directly or indirectly influenced by humans due to
forest management or N deposition. As trees have a relatively high longevity and therefore can-
not easily adapt to rapid changes in climate conditions, forests are quite sensitive to climate
change (Lindner et al. 2008). Moreover, species that are better adapted to certain climate condi-
tions cannot migrate fast enough to replace those that cannot stand the alterations and have
stopped to reproduce (Sedjo & Sohngen 1998).
2.5. Climate change impacts on forest ecosystems
Climate change will have both negative and positive effects on C sequestration in forests. They
have to adapt to changes in mean temperature, combined with an atmospheric CO2 increase and
precipitation as well as to an increased variability of conditions. In addition to this, they also
have to adjust to extreme weather events such as droughts, storms and floods as well as their
changed frequency and duration (Lindner et al. 2010). Since there are different climate change
scenarios, the impact on forests might vary (IPCC 2007a; Lindner et al. 2008). For instance,
global temperature is predicted to increase within a range of 1.8°C to 4°C by 2100 compared to
1990. Furthermore, precipitation pattern will differ, depending on e.g. topography and vegeta-
tion. All in all, these changes and the kind of impact vary between seasons and regions and its
different site conditions.
In general, all these changes will affect the (a) forest area extent, (b) biodiversity comprising
competition between species, (c) health and vitality including resistance to pest and disease
outbreaks, tree growth, productivity and changes in damage by natural disturbances such as fire
or storms, and (d) ecosystem services. However, boreal, temperate or tropical forests show a
different vulnerability (FAO 2012; Lorenz & Lal 2010; Lindner et al. 2008).
(a) Forest area
The total forest area is expected to be affected by changes in temperature and precipitation, spe-
cies composition including biological diversity, and more frequent and more intense natural
disturbances. The forest area extent, though, is expected to increase in temperate regions,
whereas it will contract in boreal and tropical regions (Lindner et al. 2008).
(b) Biodiversity
Whether species survive and grow is largely dependent on climate variables and the species
specific tolerance to changes in living conditions. Most species show their highest growth rate,
competitive strength and robustness to disturbances, pests and diseases best under specific op-
timal conditions. Thus, some species adapt better to changing climate than others, hence they
displace others, causing a shift in biological diversity with a possible dominance of invasive spe-
cies (Lucier et al. 2009). Above all, besides the geological aspect, temperature and precipitation
wield the greatest influence on species distribution and composition (Whittaker 1967 in
Breshears et al. 2008). The growing season is longer and might start earlier leading to an earlier
bud break for some species, changing time in flowering, pollination and litter fall. Consequently,
productivity and C sequestration rates are changing (FAO 2012). Earlier bud break affects the
amount of radiation reaching the forest floor, influencing the microclimate, whereas litter fall
affects the soil C content (Breshears et al. 2008). According to Chapin III (2003) (in Breshears et

Literature review
Carbon stocks in Danish forest types 15
al. 2008), deciduous-dominated forests have a lower proportion of incoming radiation than coni-
fer forests.
(c) Health and vitality
Atmospheric CO2 acts as a fertilizer (Lal 2005) because photosynthesis rates increase with ele-
vated concentrations of this GHG, depending on the plant N status and the species (Norby et al.
1999). Deciduous tree species respond to raised CO2 more than conifer species as a short-term
study of Ceulemans & Mousseau (1994) shows. Contrary to this, Norby et al. (1999) discovered
in long-term studies that unstressed conifers have a more similar response than deciduous trees.
However, tree growth is not proportionally linked to increased photosynthesis activity, hence
other factors like nutrient availability create a limiting effect on growth rates (Körner 2003). For
instance, the demand for N increases with increasing CO2 (Luo et al. 2004). Moreover, increased
atmospheric CO2 is beneficial for the plants’ water use efficiency: stomata are partially closed
and thus, less water is lost through transpiration (Picon et al. 1996). Contrary, transpiration re-
sults in a cooling effect, so that with raising temperature, the positive effects on water use effi-
ciency may be reversed, e.g. respiration rates of most European tree species increase and photo-
synthesis is impeded if the temperature exceeds 30°C (Rennenberg et al. 2006). In contrast to C3
plants, C4 plants have solved the problem of water loss through stomata while performing pho-
tosynthesis at higher temperatures. Here, CO2 concentrations are higher at the site of the Calvin
cycle where the stomata do not necessarily have to open (Lorenz & Lal 2010). Alongside with an
increased CO2 uptake, C allocation to root growth increases, allowing trees to take up soil water
in deeper soil layers and therefore improving their adaptation to water-limited environments
(Wullschleger et al. 2002).
Since increased CO2 concentrations are coupled with increasing temperature, temperature is
expected to stimulate tree growth and extend the growing season. However, only increased
temperature alone only has a positive impact on boreal and temperate forests (Lindner et al.
2008). In combination with other factors, e.g. water availability, the response of forests may be
adverse (droughts). Furthermore, warmer temperatures lead to enhanced availability of mineral
N for plant uptake (Lal 2005). In addition to CO2 and temperature, also precipitation affects pho-
tosynthesis rates. In areas where tree growth is water limited, increased rainfall causes higher
productivity as Kirschbaum (2004) describes (in Lindner et al. 2008). Once trees are saturated,
production will not further increase (FAO 2012). Another effect accompanied with climate
change displays increased cloudiness, resulting in reduced sun radiation, which can lead to some
extent to a decrease in net primary production (Melillo et al. 1993). Finally, precipitation and
temperature also affect forest soils. Litter is decomposing faster, releasing SOC and the residence
time of nutrients is shortened with increasing temperatures and moisture (Townsend &
Rastetter 1996; Lensing & Wise 2007; Rennenberg et al. 2006).
Forests are not only directly influenced by increasing temperatures but also indirectly through
growing insect populations, that benefit from elevated temperatures (Lindner et al. 2010; Lucier
et al. 2009; Tyrrell et al. 2012). On the one hand, mortality of herbivore and pathogen population
during winter decreases with global warming, whereas on the other hand, raising temperatures
in the tropics lead to a shortened life span of pathogens. Additionally, pest species might expand
to other forests (northwards). Beside climate, the resistance also depends on tree species and
stand age (Lucier et al. 2009) as well as plant nutritional quality and community interaction, e.g.
host-parasitoid balance (Lindner et al. 2008).

Literature review
Carbon stocks in Danish forest types 16
Moreover, increasing temperatures accompanied with water shortage, amplify the risk of fires
(Lindner et al. 2008; IPCC 2007a). As a result, organic matter is removed and nutrients are lost
due to e.g. leaching and volatilisation. This does not happen without affecting the C stock. The
caused damage in turn makes trees more susceptible to insects and pathogens (Lucier et al.
2009). The same is true for damages caused by windthrow, storm and flooding. Extreme flood-
ing events have a severe effect on forest health during the growing season. Beside injuries, the
mortality and senescence is higher and the production of seeds is inhibited (Glenz et al. 2006 in
Lindner et al. 2008).
(d) Ecosystem services
The way forests respond to climate change also affects its ecosystem services. As tree growth
benefits from increased atmospheric CO2 and warmer temperatures, the enhanced productivity
is beneficial for timber harvesting. Accompanied with increasing productivity, the rate of C se-
questration and storage of forests rises. However, in the long-run, increasing atmospheric CO2
concentrations combined with longer drying seasons and increasing temperatures, are expected
to turn forests in a C source instead of expanding the stored C pool or at least reduce the forest C
sinks (FAO 2012). Other ecosystem services, such as soil and water protection largely depend on
the regional variability of climate change concerning e.g. precipitation levels, extent of the dry
season.
Overall, boreal and temperate forest biomes are expected to shift polewards, whereas tropical
forests are likely to expand polewards. In general, there are high uncertainties in the predicted
response of forests to climate change. Nevertheless, the northwards shift of boreal forests and
higher temperatures result in changes of the species composition, e.g. in the southern regions of
boreal forest biomes coniferous species are replaced by deciduous trees. In addition, thawing
permafrost soil lead to increased microbial decomposition and thus, in a release of CH4 and CO2.
All this is accompanied by insect invasions (e.g. bark beetles) to new areas and increased fire
outbreaks. Even though elevated CO2 accelerate tree growth and soil C stock, since the chemical
changes in leaves due to altered CO2 concentrations lead to slower decomposition, it does not
offset the predicted C losses. Therefore, boreal forests are likely to become a significant C source
(Lorenz & Lal 2010).
Temperate forests are less severely affected by climate change than other forest biomes. Gener-
ally, enhanced tree growth benefits C storage in biomass and soil. Carbon sequestration and
storage occur at higher levels and for longer time periods in conifer dominated forests than in
deciduous forests. Yet, increased CO2 concentrations affect competitive interactions of tree spe-
cies, which in turn affects decomposition rates and root production. A paramount importance is
attributed to human induced disturbances (in terms of land use and forest management, e.g.
addressing harvesting practices), with a potential to increase the total C stock of temperate for-
ests (Lorenz & Lal 2010; Tyrrell et al. 2012).
The impact of climate change on tropical forest C pool is highly uncertain. Warmer temperatures
will alter the rainfall pattern, causing the C sequestration in biomass to decrease with heavier
rainfalls. In addition, plant respiration is increased and likely to offset C storage due to enhanced
tree growth. Moreover, the risk of disturbances through fire is amplified not only by more
drought events but also by human induced disturbances (Lorenz & Lal 2010).

Literature review
Carbon stocks in Danish forest types 17
Net C storage in forests implies that the sequestration of C is higher than the amount of C emit-
ted by forests through respiration and removed by harvest. Hence, it is of major interest to un-
derstand the storage processes in forests, as well as its influencing factors. If so, it is possible to
increase the C sink in each forest type as long as the maximum C stock is not reached yet. This in
turn, results in a reduction of the rate at which global temperature is rising. In order to strength-
en the adaptive capacity and diminish the vulnerability, the most efficient measure comprises to
maintain forest areas and support biodiversity. Old and damaged trees should be removed in
order to reduce the risk of pest outbreaks (FAO 2012; Nieder & Benbi 2008). However, using
forests as a climate change mitigation tool can only be a supplementary option, while the overall
reduction of C emissions from fossil fuels should be the major target (Nieder & Benbi 2008).
There are constraints and limitations on the role of forests as a GHG mitigation tool.
2.6. Constraints on the role of forests in greenhouse gas mitigation
Besides its use for the national reporting, the data from NFIs may support elaboration of instruc-
tions for a more C friendly management of Danish forests e.g. advising to plant tree species that
sequester more C than others. This may give rise to conflicts with supporting the regrowth with
natural vegetation, as C often accumulates more slowly on areas left for natural vegetation re-
growth than on planted stands with fast growing species. Basically, an increase in forest C sinks
could be reached through increasing growth, afforestation, reforestation, regeneration, agrofor-
estry and/or urban and community forestry (Apps & Price 1996; Dixon et al. 1994). The forest
area does not necessarily have to extent but an increase in the growing stock (biomass) is suffi-
cient in order to raise the total C stock (Karjalainen et al. 2002), albeit there are some major con-
straints to forest management practices that focus solely on C sequestration, including both eco-
logical and geopolitical issues. First of all, high C uptake rates do not imply that much C is se-
questered. Maximal C sequestration is obtained in younger stands because they are growing
faster, whereas a maximum C storage rate is achieved in old forests or through extended rota-
tion periods (Carroll et al. 2012). Secondly, as the C cycle and the influence of forests in this cycle
are of global magnitude, all countries have to be involved in negotiations about the implementa-
tion of measures to reduce global warming. Nevertheless, these international responsibilities
have to be reconciled with national interests (e.g. poverty alleviation). Further, it has to be con-
sidered that forests provide more services than C storage. These services encompass mostly
positive effects on biodiversity, culture, society and economy not only at local but also on na-
tional and international levels (Steward & Maini 1996). Thus, the expansion of existing C sinks
by limiting collection of fuelwood for instance, as suggested in (Dixon et al. 1994), is not always
possible or desirable. Despite the urgent need to take joint actions, each state has its right for
sovereignty, which has to be respected but could be met with well adapted compromises and /or
subventions.
Besides the efforts of managing forests in a way that a maximum C sink is guaranteed, the future
influence of forests to the global C cycle is also affected by the rate of deforestation especially in
the tropics, which constitute the biggest C source of the global forest biomes (Lorenz & Lal
2010). Double the amount of C is released compared to the C forest sink as a consequence of
tropical deforestation. The emissions not only derive from aboveground biomass, but also from
SOC, since the turnover rate of fine roots as well as the allocation of C into the soil alters on clear
cutted areas. Furthermore, deforestation of one area also affects the surrounded forest areas;
increasing the sun radiation throughfall, leading to higher temperatures and risk of fire, hence

Literature review
Carbon stocks in Danish forest types 18
changes in the microclimate and microbial activity, resulting in C release. In addition to tropical
forests, both peatland forests and old-growth forests constitute a large share of the total terres-
trial C sink (Lorenz & Lal 2010). Therefore, any perturbation could cause immense C emissions.
Overall, unused forests show the greatest C sequestration potential, while selective cutting
yields the best results in terms of C sequestration under management activities. This inevitably
leads to conflicts with wood production (Fischlin 1996). Conflicts facing the maintenance or ex-
pansion of forest areas lie within expanding population accompanied with an increasing demand
for natural resources, e.g. forest products, and land, causing deforestation and forest degrada-
tion (FAO 2012). Moreover, agricultural subsidies and the demand for renewable energy from
corn and oil seeds, such as oil-palm plantations, make the conservation of forests more difficult.
While conducting studies to estimate forest C and to determine influencing factors, like in this
study, the above mentioned constraints have to be considered in the final forest management
strategy.
2.7. Danish forests
Denmark is aiming to further increase the forest area to 25% before 2100 (Christensen &
Iversen 2004). In general, a conversion into e.g. croplands hardly occurs (Nielsen et al. 2011).
However, some forests are cleared in order to transform the land to grassland or settlements. In
2002, the Danish National Forest Programme was put into force promoting a sustainable forest
management, that encompasses a near-to-nature approach for forest management (Christensen
& Iversen 2004). With the new guidelines, although voluntary, one seeks to achieve an im-
provement of forest biodiversity as well as forest economy. Additionally, those measures facili-
tate stakeholder participation and allow a more flexible management (Christensen & Iversen
2004). This appears central to Danish forest policy since most of the forest area (68%) is pri-
vately owned, whereas only 18.5% belongs to the state (Nord-Larsen et al. 2010).
According to Bradshaw et al. (1999) the natural forest composition today would be less diverse
deciduous forest. Former species-rich deciduous forest types would have been replaced by
Fagus dominated combinations. The Danish forests today are dominated by Picea (especially
Norway Spruce) and Pinus along with Fagus (Bradshaw et al. 1999, Nord-Larsen et al. 2010)
(Fig. 4). Pure conifer and broadleaf forests cover 41% and 39% of the whole forested land, re-
spectively. Forests with a mixed proportion of broadleaves and conifers, with less than 75% of
each type, account for 12%, Christmas tree plantations for 4 % and the remaining area is tempo-
rarily unstocked or unstocked (Nord-Larsen et al. 2010). Exotic species have become more
widespread particularly due to plantation forestry (Bradshaw et al. 1999). About 66% of the
forest area is managed as evenly aged plantation forest (Nord-Larsen et al. 2010). Yet, as a con-
sequence of the new policies, more indigenous tree species have been planted and land has been
afforested, so that the fraction of broadleaf forests is increasing (Eggertsson et al. n.d.). The near-
to-nature management approach focuses on native species and mixed stands, and will therefore
help to create forests that are ecologically more valuable. Additionally, these forests are more
likely to withstand climatic changes because it is proved that the native species survived former
changes in the climate during the history of earth (Bradshaw et al. 1999).
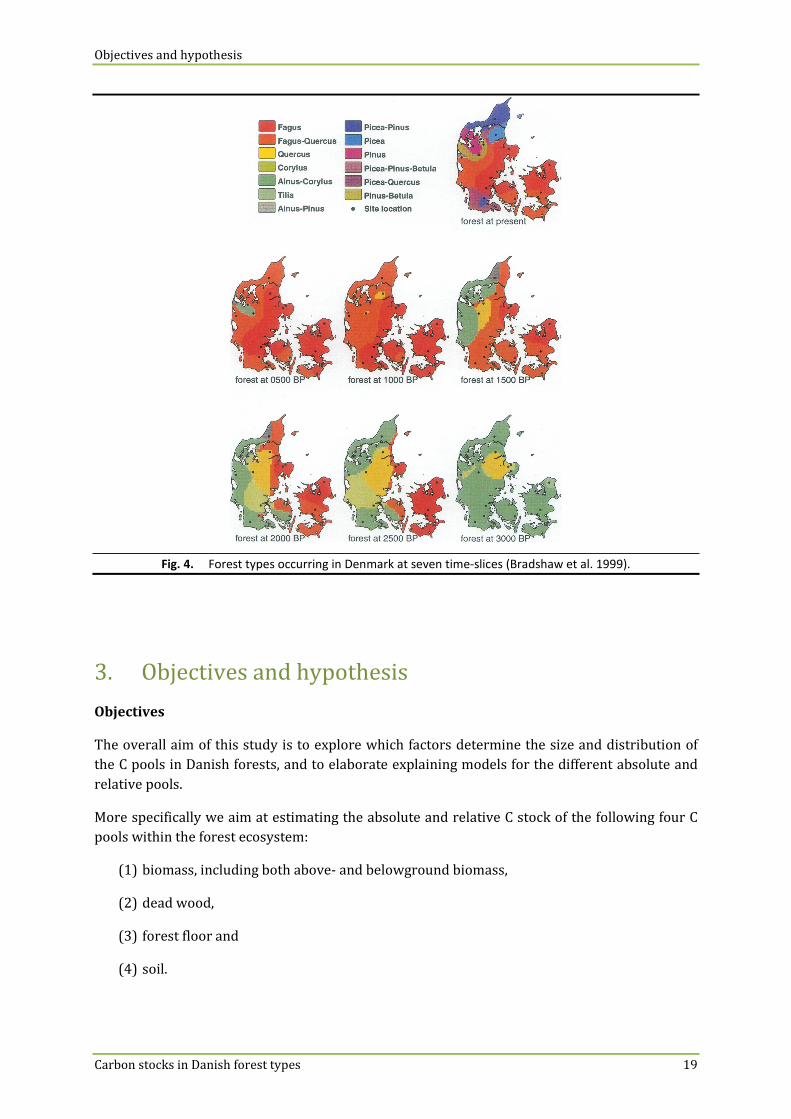
Objectives and hypothesis
Carbon stocks in Danish forest types 19
Fig. 4. Forest types occurring in Denmark at seven time-slices (Bradshaw et al. 1999).
3. Objectives and hypothesis
Objectives
The overall aim of this study is to explore which factors determine the size and distribution of
the C pools in Danish forests, and to elaborate explaining models for the different absolute and
relative pools.
More specifically we aim at estimating the absolute and relative C stock of the following four C
pools within the forest ecosystem:
(1) biomass, including both above- and belowground biomass,
(2) dead wood,
(3) forest floor and
(4) soil.
Objectives and hypothesis
Carbon stocks in Danish forest types 20
Hypothesis
We generally expect:
• the largest C pool in the soil, on average being twice as big as the biomass C pool (Dixon
et al. 1994; FAO 2010; Lorenz & Lal 2010), with forest floor and dead wood C pools hold-
ing a rather small share of the total C stock. However, the relation of soil and biomass C
pool varies with different stand ages.
Moreover, we hypothesize that the absolute and relative C pools are related to:
• soil category (loamy, organic, sandy),
• tree species category (conifers, broadleaves, mixed, temporarily unstocked) as well as to
some specific tree species (ash, beech, oak, fir, larch, Nordmann fir, Norway spruce, pine
and Sitka spruce),
• stand age,
• crown cover,
• broadleaf fraction,
• tree species biodiversity (using the Simpson-Index),
• precipitation and
• previous land use (afforested areas (since 1990) and forests remaining forests).
We assumed that:
(1) for the biomass C stock especially the tree species category, the stand age and the crown
cover will have a significant effect. The species effect is, however, confounded with the
soil category to some extent as the properties of the soil gives the basic conditions for
plants to grow and survive on that site. Stand age and crown cover is expected to be of
significance for the biomass C pool because both are expressions of the C accumulation
in trees (Jandl et al. 2007; Tyrrell et al. 2012). Nevertheless, a high crown cover does not
necessarily include a high biomass C stock compared to areas with lower crown cover. A
stand with a high crown cover can be composed of both only young trees and only older
trees. Although the crown cover is high on both stands, the biomass C stock differs as
younger trees contain less C than older trees (Carroll et al. 2012; Lorenz & Lal 2010).
(2) the dead wood C pool might not have a significant and representative effect of one of the
explanatory variables, since there are only very few plots with dead wood content.
(3) the main explaining variable for forest floor C is tree species category (Vesterdal et al.
2008; Lorenz & Lal 2010; Tyrrell et al. 2012; Horwath n.d.). Previous land use is likely to
affect the forest floor C stock, because the forest floor in recently afforested areas has not
yet accumulated as much organic material and C as in forests existing for a longer time
(Vesterdal et al. 2009; Jandl et al. 2007).

Material and methods
Carbon stocks in Danish forest types 21
(4) the soil C stock is significantly influenced by the soil category (Silver & Miya 2001; Baritz
et al. 2010; Lal 2005). In the short term, previous land use might also affect the soil C
(Vesterdal et al. 2009; Jandl et al. 2007).
It is not clear which effect to expect of tree species biodiversity. It might, however, be displayed
by significant differences between the tree categories, if for example plots consisting of mixed
conifer and broadleaf forests have a bigger C pool in biomass or soil than those dominated by
one of them.
4. Material and methods
4.1. Description of the study sites
Denmark is a northern European country, situated to the north of Germany between the north-
ern and the Baltic Sea, at 56° N longitude and 13° E latitude, comprising an area of 43,098 km2.
The land is flat to undulating with an average altitude of 30 m above sea level and a maximum
elevation of 173 m above sea level. It is characterized by a temperate climate with mild winters
and cool summers, having an annual mean temperature ranging from 7.7 to 8.1 °C during the last
60 years. The annual mean precipitation ranges from 670 to 750 mm (Cappelen 2011). At the
end of the Pleistocene, the glaciers decreased and the climate in Denmark has changed several
times since that time. These factors influenced soil forming processes and contributed to present
soil properties in Denmark. The country is divided into six landscapes that are differentiated by
soil properties and/or parent material (Fig. 5). Denmark is dominated by a Weichselian moraine
landscape with glacial sand, gravel as well as till. The western part of the country consists of
deposits from the older Saale glaciation in form of sand and gravel which are surrounded by a
Weichselian plain landscape with glacio-fluvial deposits. The northern area is composed of up-
lifted marine sediments from the Holocene that enclose a Weichselian marine core. West Den-
mark is fringed by dunes, which can also be found as inland deposits in central Jylland. Small
parts in west and south-west Denmark present marsh landscapes consisting of mainly tidal sed-
iments (Fig. 5) (Gravesen et al. 2004).
About 60% of the land is used for agricultural purposes, followed by forests as the second big-
gest land use. Since 1951, when forests made up 10 % of the country, the forested areas have
slightly but steadily increased to 11% in 2000 (Levin & Normander 2008). More efforts have
been made in the following years and the forest area comprises 13.5% (579,700 ha) in 2009
(Nord-Larsen et al. 2010) (Tab. 2).
Tab. 2. Forest area divided into land use classes (changed after Nord-Larsen et al. 2010).
Total forested
area
Conifer forests
Broadleaf forests
Mixed forest (conifer & broadleaf)
Christmas tree planta-
tions
Temporar-ily un-
stocked
Unstocked
ha 580 235 229 72.2 23.8 12.0 7.91
% 13.5 40.5 39.5 12.5 4.1 2.1 1.3

Material and methods
Carbon stocks in Danish forest types 22
The percentage of natural areas in the open land, including heathland, meadows and grasslands,
has drastically decreased during the last decades. While in the late nineteenth century open nat-
ural and semi-natural habitat types covered about 25% of the total land area, it reaches only 9%
in 2011. During the same period, build-up areas like roads and housing constructions have in-
creased from about 3% to 10% (Levin & Normander 2008; Anon 2010).
Fig. 5. Landscape types in Denmark (Krogh & Greve 2006).
4.2. Sampling design
The data used in this study is taken from the Danish National Forest Inventory and from the
Danish SINKS project.
National Forest Inventory (NFI)
The Danish National Forest Inventory was initiated in 2002 and is now in its second cycle. The
NFI includes about 5000 primary sampling units (PSU) located in a 2x2 km grid covering the
whole of Denmark. About 1/3 of the PSUs are permanent and re-measured in five-year cycles.
Each PSU consists of four circular secondary sampling units (SSU) with a radius of 15 m, located
in the corners of a square of 200x200 m. If the SSU plot covers different land uses or tree species
the plot is subdivided in tertiary sampling units (TSU). The sampling radius of 15 m in each SSU

Material and methods
Carbon stocks in Danish forest types 23
is subdivided in three circles, 3.5 m, 10 m and 15 m. Only plots where the forest cover had a min-
imum of 50% were selected. Following the analysis of aerial photos, the actual percentage of
forest cover (X) has been calculated on each individual SSU (j):
Xj = �����,�
where A is the forested area and A15 the total area of the 15m radius SSU
(Nielsen et al. 2011).
The inventory follows the forest definition from the FAO (UNECE n.d.): “Land with tree crown
cover […] of more than 10 % and area of more than 0.5 ha [and a minimum width of 20 m]. The
trees should be able to reach a minimum height of 5 m at maturity in situ. […] firebreaks and
other small open areas […]” that constitute an integral part of the forest, are also included.
SINKS project
The Danish SINKS project is an inventory of forest soil C under art. 3.4 of the Kyoto Protocol,
aiming to reporting forest soil C dynamics. However, Denmark applies the “non-source” princi-
ple (see chapter 1.2) after providing sufficient information that Danish forest soils are not a
source for C emissions (Sverrild et al. 2009). This principle enforces that Denmark does not have
to report to the UNFCCC how much C is sequestered exactly in this pool but only needs to verify
that this pool is not a source (Omogyi & Reudenschuss 2010).
To discover changes in soil C pools more efficiently, 277 plots that are located in the NFI project
have been added to the SINKS project (Sverrild et al. 2009). For this study, only data from 2007
and onwards were available from the SINKS project.
4.3. Data acquisition of biomass and dead wood carbon
• The biomass C pool is defined as “Carbon in all living biomass above the soil, including
stem, stump, branches, bark, seeds and foliage “, as well as “carbon in all biomass of live
roots. Fine roots of less than 2 mm diameter are excluded, because these often cannot be
distinguished empirically from soil organic matter or litter” (FRA 2010).
• Dead wood C encompasses “carbon in all non-living biomass not contained in the litter,
either standing, lying on the ground, or in the soil. Dead wood includes wood lying on the
surface, dead roots, and stumps larger than or equal to 10 cm in diameter […]”(FRA
2010).
The data for biomass C, including both (above-and belowground) biomass and dead wood, are
derived from NFI plots. In order to compare the amount of C stored in biomass with the amount
stored in forest floor and soil, only data from 2007 - 2011 was used from the NFI. Within the
inner 5m circle of the SSU, a single caliper measurement of the diameter at breast height (DBH),
of 1.3 m is taken of every tree. Trees with a diameter larger than 10 cm are measured in the 10
m circle. Within the 15 m circle, only trees with a diameter of more than 40 cm are included in
the measurements. The same principles apply for measuring standing dead wood; as long as the
DBH exceeds 4 cm. Lying dead wood is included within the whole plot when it has a diameter of
more than 10 cm at the midpoint. For further measurements, about 2-6 trees are randomly se-
lected. Total height, crown height, diameter at stump height and age are recorded. In addition,
signs for the state of health, such as defoliation, discoloration, mosses and lichens are document-

Material and methods
Carbon stocks in Danish forest types 24
ed. The tree species composition as well as ground vegetation is registered for the whole plot
and the forest floor layer is measured.
The collected data are used for further calculations e.g. the height of trees, the basal area per
hectare of individual trees, the stem number per hectare, volume of each live tree as well as the
volume of standing or lying dead wood and biomass of individual trees (Nielsen et al. 2011).
4.4. Data acquisition of soil and forest floor carbon
• The litter (forest floor) C pool comprises “carbon in all non-living biomass with a diame-
ter less than the minimum diameter for dead wood […], lying dead in various states of
decomposition above the mineral or organic soil” (FRA) 2010).
• Soil C is defined as “organic carbon in mineral and organic soils (including peat) to a
specified depth […]”(FRA) 2010).
The basic data of this project were collected in 277 sampling plots of the National Forest Inven-
tory. The plots were selected randomly among the permanent sampling plots of the NFI. The
information, that is needed to estimate soil C and forest floor C, was derived from the SINKS pro-
ject. These 277 plots are located at the same PSUs and SSUs as from the NFI plots. The sampling
took place from 2007 to 2011.
Fig. 6. Design of the Secondary Sampling Unit (SSU), with a radius
of 15 m. The samplings of the forest floor and mineral soil are taken
to the north, east, south and west, respectively with a radius of 5,
10 and 15 m from the middle point. They are displayed in the black
dots, named N15, N10, N5 etc. In the middle of the SSU is a metal
pin to help finding the plot.
In each SSU, 10 sampling points were identified (see the location of the sampling points in Fig. 6)
(Sverrild et al. 2009). A frame of 25x25 cm was placed on each sampling point, the forest floor
from this area was removed and the thickness of the forest floor was measured on all four sides.
Soil cores were removed in the same 10 sampling points using an EJH auger soil corer of 2-2.5
cm in diameter, and each core was separated according to its depth: 0-10 cm, 10-25 cm, 25-50
cm, 50-75 cm and 75-100 cm soil depth. The samples of similar depths were pooled for all 10
sampling points, giving 5 soil samples in addition to the 10 forest floors samples (Sverrild et al.
2009).
4.5. Data acquisition of explaining variables
The following variables were considered to be of interest for explaining total C sequestered as
well as C sequestered in the four pools (biomass, dead wood, forest floor and soil):
N5
N10
N15
S5
S10
S15
Ø10 Ø15V15 V10
N5
N10
N15
S5
S10
S15
Ø10 Ø15V15 V10
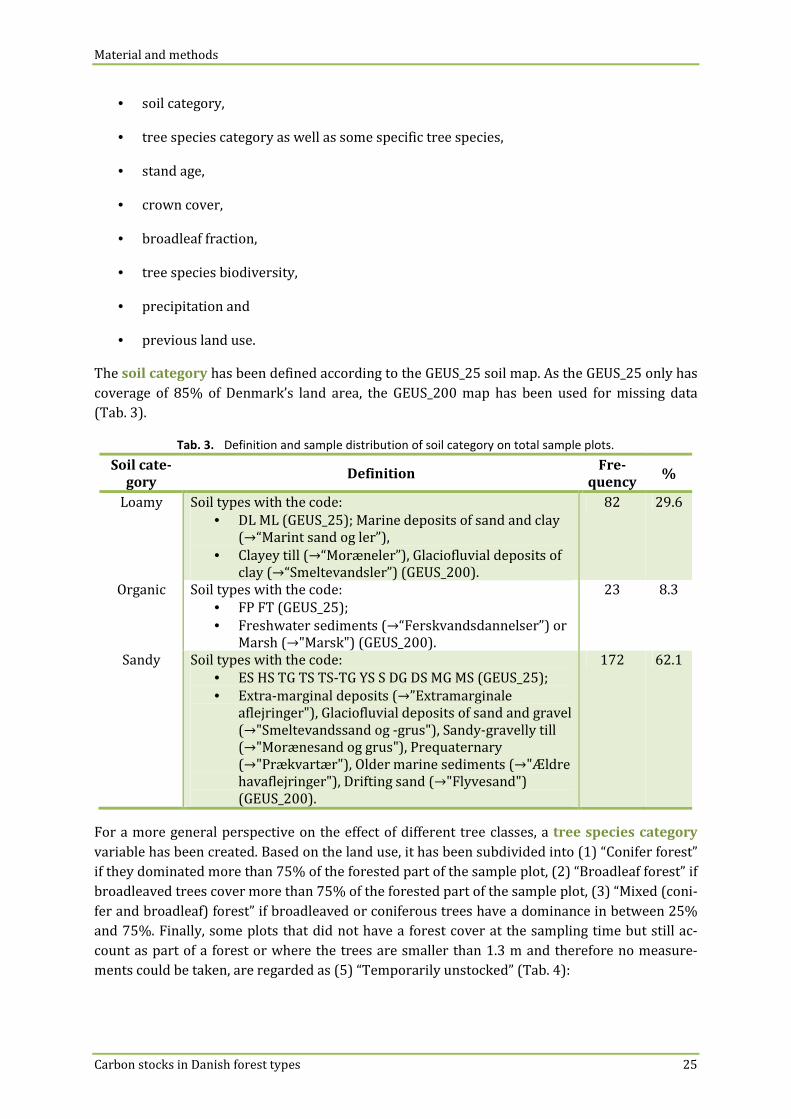
Material and methods
Carbon stocks in Danish forest types 25
• soil category,
• tree species category as well as some specific tree species,
• stand age,
• crown cover,
• broadleaf fraction,
• tree species biodiversity,
• precipitation and
• previous land use.
The soil category has been defined according to the GEUS_25 soil map. As the GEUS_25 only has
coverage of 85% of Denmark’s land area, the GEUS_200 map has been used for missing data
(Tab. 3).
Tab. 3. Definition and sample distribution of soil category on total sample plots.
Soil cate-gory
Definition Fre-
quency %
Loamy Soil types with the code: • DL ML (GEUS_25); Marine deposits of sand and clay
(→“Marint sand og ler”), • Clayey till (→“Moræneler”), Glaciofluvial deposits of
clay (→“Smeltevandsler”) (GEUS_200).
82 29.6
Organic Soil types with the code: • FP FT (GEUS_25); • Freshwater sediments (→“Ferskvandsdannelser”) or
Marsh (→"Marsk") (GEUS_200).
23 8.3
Sandy Soil types with the code: • ES HS TG TS TS-TG YS S DG DS MG MS (GEUS_25); • Extra-marginal deposits (→”Extramarginale
aflejringer"), Glaciofluvial deposits of sand and gravel (→"Smeltevandssand og -grus"), Sandy-gravelly till (→"Morænesand og grus"), Prequaternary (→"Prækvartær"), Older marine sediments (→"Ældre havaflejringer"), Drifting sand (→"Flyvesand") (GEUS_200).
172 62.1
For a more general perspective on the effect of different tree classes, a tree species category
variable has been created. Based on the land use, it has been subdivided into (1) “Conifer forest”
if they dominated more than 75% of the forested part of the sample plot, (2) “Broadleaf forest” if
broadleaved trees cover more than 75% of the forested part of the sample plot, (3) “Mixed (coni-
fer and broadleaf) forest” if broadleaved or coniferous trees have a dominance in between 25%
and 75%. Finally, some plots that did not have a forest cover at the sampling time but still ac-
count as part of a forest or where the trees are smaller than 1.3 m and therefore no measure-
ments could be taken, are regarded as (5) “Temporarily unstocked” (Tab. 4):

Material and methods
Carbon stocks in Danish forest types 26
Tab. 4. Sample distribution of tree species category on total sample plots (n=277).
Conifer for-
est Broadleaf
forest Mixed
Temporarily unstocked
Frequency 114 110 47 6
% 41.2 39.7 17 2.2
With the purpose of examining the effect of the most common single tree species in Denmark
on C sequestration potential nine species categories have been selected (Tab. 5). Precondition is
that the fraction of the species belonging to the in Table 5 mentioned species categories is larger
than 50%. This has been the case for only 185 out of 277 plots.
Tab. 5. Sample distribution of single tree species (n=185).
Ash Beech Fir Larch Nordmann
fir Norway spruce
Oak Pine Sitka
spruce
Frequency 7 41 12 11 10 32 23 28 21
% 2.5 14.8 4.3 3.9 3.6 11.6 8.3 10.1 7.6
Stand age, crown cover, broadleaf fraction and previous land use have been derived from the NFI
data table, directly.
The stand age is defined as the average age of trees on SSU level. For plots that are subdivided
in TSUs the stand age refers to the average age of trees from the biggest TSU. However, some
plots were lacking data about the average age. In that case, either the age of the oldest tree was
taken, if available, or the age of the same sampling plot from the first NFI (2002-2007) was used
and the missing years were added. For instance, only the age of the plot from 2008 (second cycle
of NFI) was missing but it was given for the same plot in the year 2003 (first cycle of NFI). Con-
sequently, this age was added up by 5.
The crown cover is an estimate of the canopy cover on a percentage basis.
The species fraction of broadleaved trees calculates the broadleaf fraction. The species fraction
is calculated as the fraction of the basal area on the forested part of the SSU.
The previous land use (PLU) is based on changes in land use since 1990. Either it is “forest
remaining forest” (FRF), meaning that the area was forested before 1990 and still is, or it has
been “afforested” (AFF) between 1990 and 2007.
The degree of tree species biodiversity for each plot is calculated by the Simpson Index, using
the species fraction. It expresses the probability to not find the same species at two randomly
selected spots within one plot.
The data for precipitation amount are calculated from samples taken in 10x10 km grid.

Material and methods
Carbon stocks in Danish forest types 27
4.6. Laboratory preparation of soil and forest floor samples
Forest floor
The 10 samples of the forest floor of each SSU plot were dried at 40°C until the largest forest
floor samples did not lose weight, or did lose less than 1 g, from one day to the next, thus, a con-
stant weight was reached. The samples were weighed 30 min after they have been removed
from the drying oven. Then, the mineral soil particles, green plant material and large roots were
removed before weighing a last time. Subsequently, they were ground in a Retsch SM 2000 mill
through a 2 mm sieve. In addition, 10% of each of the 10 samples was mixed to a composite
sample out of which a subsample of 100 ml was taken for further finer grinding with a Tecator
mill.
Soil
The merged samples from each of the 5 soil layers for each SSU plot were dried at 40°C until a
constant weight was detected. While sandy soil samples could be sieved or crushed directly,
more clay-rich soils were ground in a mortar until it could be sieved to 2 mm. Stones, bigger than
2 mm, were extracted and weighed separately. Before weighing the fine soil was dried again at
40°C for a minimum of 48 hours. Thereafter, a subsample of 20 g was taken for finer grinding in
an agate mortar.
4.7. Chemical analysis
All samples were sent to Agrolab/Institut Koldingen, Sarstedt, Germany, for chemical analysis. A
dry combustion method (Elementar analyzer, ISO 10694) was used to determine total organic C
in the forest floor and in the soil samples. Carbonates were removed prior to the analysis.
4.8. Calculations of carbon stocks
Calculation of biomass carbon
Calculating biomass C of above- and belowground biomass begins with estimating species spe-
cific volume (based on Madsen 1987 and Madsen & Heusèrr 1993) and expansion factor. For the
latter purpose the species were only subdivided in conifers and deciduous for which an expan-
sion factor model developed for Norway spruce (=1.8) and beech (=1.2), respectively, was ap-
plied. After that, the biomass (B) of each tree (i) per sample plot (j) as the total volume (VTot)
multiplied with the density specific for the respective specie (based on Moltesen, 1988 in
Nielsen et al. 2011).
Bij = VTot ∙ Densityij
A C percentage of 50% for biomass was assumed. Following, the biomass of each tree, C (C) of
each tree (i) on each plot (j) can be calculated as:
Cij = Bij ∙ 0.5

Material and methods
Carbon stocks in Danish forest types 28
To estimate the total biomass C stock (C, t ha-1) for each plot, the biomass C stock in every circle
(3.5m, 10m, 15m) in each plot at TSU level, was calculated before the average area weighted C of
each circle could be estimated. Until, finally, the overall average C per hectare for each sample
plot is multiplied with the forest area.
C = (C3.5 + C10 + C15) ∙ ASkov
Calculation of dead wood carbon
The calculation of standing dead wood C is similar to biomass C. First of all, the same volume
functions and expansion factor as for estimating biomass C was used. Then, the biomass (Bs for
standing and Bl for lying dead wood) of each tree (i) in each sampling plot (j) was calculated.
Besides the volume (Vs, Vl) and species specific density, a reduction factor (rk) giving the struc-
tural decay of the wood was added.
Bs,ij = Vs ∙ Densityij ∙ rk, ij
Bl,ij = Vl ∙ Densityij ∙ rk, ij
Again, a C percentage of 50% for dead wood biomass was assumed. Thus, the biomass of each
tree and the C (K) of each tree (i) of each plot (j) can be calculated as:
Ks,ij = Bs,ij ∙ 0.5 Kl,ij = Bl,ij ∙ 0.5
To estimate the total dead wood C stock (KD, t ha-1) for each plot, the dead wood C stock in every
circle (3.5m, 10m, 15m) in each plot at TSU level, including both standing and lying dead wood,
was calculated before the average area weighted dead wood C of each circle could be estimated.
For the last step, the overall average C per hectare for each sample plot is multiplied with the
forest area.
KD = (C3.5 + C10 + C15) ∙ ASkov
For final analysis, the biomass and dead wood data of TSU level are weighted for SSU level.
Calculation of forest floor carbon
The forest floor C stock (t ha-1) was calculated by the dry weight DWff2007-2011,i of each individual
forest floor sample number i (i=1-10) in g and the C concentration cff2007-2011 of the pooled sam-
ple in mg g-1:
�ff2007-2011 =#$%ff2007-2011,i
�&
'(�
∙ 0.0016 ∙ cff2007-2011
Calculation of soil carbon
The mineral soil C stock (t ha-1) was calculated by the depth dm of the given horizon (m) in cm,
the relative volume of the stone content RVstone2007-2011 (>2mm) without unit, the bulk density of
soils ρsoil in g cm-3 (fine soil < 2mm) and the C concentration csoil2007-2011 in mg g-1:

Material and methods
Carbon stocks in Danish forest types 29
�m2007-2011 = # ,m-2011
-(./�)
'(�∙ 10000 ∙ (1 − 12
stone2007-2011� ∙ ρ
soil∙ c
soil2007-2011
(Nielsen et al. 2011)
The soil bulk density was estimated using the pedotransfer functions by Vejre et al. (2003).
4.9. Statistical analysis
Once the dataset was finalized and the explanatory variables defined, the same statistical analy-
sis was applied for all dependent variables (total forest C stock and all C pools). The final data set
was still missing some data. Precipitation and biomass data were missing for 2 and 10 plots out
of 277, respectively. Since 6 plots were defined as temporarily unstocked, the broadleaf fraction
is regarded as missing for those plots. Moreover, the broadleaf fraction is missing for 2 more
plots because the species fraction has not been given, for the same reason, the same 8 plots plus
one for the biodiversity index is also missing. Originally, information on biomass C was missing
for 16 plots. For 6 out of these, data were also missing for crown cover, tree species and stand
age. According to their land use and after comparing aerial pictures on GIS, these 6 plots were
defined as temporarily unstocked. As a consequence, the missing variables were attributed the
value zero.
All effects were analysed using a general linear model (GLM). This has been done for each de-
pendent variable separately by the proc GLM procedure in SAS 9.2 (SAS Institute Inc. n.d.) using
the method of least squares. The least square mean (LSMean) was chosen in order to compare
the different average C content of the unbalanced categorical variables. It estimates the marginal
or within-group mean considering the different size of the compared groups (unbalanced data).
The LSMean is based on the model used (SAS Institute Inc. 2009).
Due to the large number of explanatory variables, the GLM select statement was applied to de-
tect the order of those variables and its second order interactions that result in the best model
fit. To determine statistical significance for entry and removal to the selection process the signif-
icance level α was set to 0.05. The null hypothesis was defined as the explanatory variables not
having significant influence on the response variable.
After the order of the variables has been determined with the GLM select statement, the pure
GLM procedure was applied in order to get the final parameter estimates and p-values. Within
the GLM procedure multiple regression analysis and one-way ANOVA was conducted to find
possible relationships between response and explanatory variables that have a significant effect
on C storage. Furthermore, the Tukey-Kramer procedure was used to detect significant differ-
ences among the categorical variables’ means and adjust for their homogeneity of variance (SAS
Institute Inc. 2009).
Finally, a best model fit was taken to gain parameter estimates with which it should be possible
to predict total C content and C content of each pool, respectively. The model-output derived
from GLM was further examined on a graphical basis. This led to an occasional exclusion of one
variable because the choice made by the GLM select process of having a significant effect on C
storage was based on <10 plots and hence not statistically sound (Tab. 6 and Tab. 7). The p-
values in the model were taken from the Type III sum of squares.

Material and methods
Carbon stocks in Danish forest types 30
Tab. 6. Sample distribution (frequency) of tree species category on soil category and previous land use.
Conifer Broadleaf Mixed Temporarily
unstocked
Loamy 17 55 10 0
Organic 2 18 3 0
Sandy 95 37 34 6
Stand age 33 58 43 0
AFF PLU FRF
3 4 3 0
111 106 44 6
Tab. 7. Sample distribution (frequency) of single tree species on soil category and previous land use.
Ash Beech Fir Larch Nordmann
fir Norway spruce
Oak Pine Sitka
spruce
Loamy 3 28 3 2 4 8 7 1 2
Organic 2 3 0 1 0 0 1 0 1
Sandy 2 10 9 8 6 24 15 27 18
Stand age 46 73 34 38 21 35 48 35 31
AFF PLU FRF
0 1 0 0 0 3 1 0 0
7 40 12 11 10 29 22 28 21
When (as it was the case for total, dead wood and soil C) the effect of broadleaf fraction was
found to be significant by the GLM select procedure, the graphical analysis revealed that this
effect was only due to some plots with 100% broadleaf fraction having a larger C stock than
plots with less than 100% broadleaf fraction. This suspicion was confirmed by running the mod-
el with the modified broadleaf fraction (plots that have 0 and 100% broadleaf cover have been
removed) resulting in the non-significance of the broadleaf fraction. Instead, the tree species
category entered the model. For the forest floor C model the broadleaf fraction was still signifi-
cant, but while excluding this variable, the tree species category appeared significant. Moreover,
this model yields a higher coefficient of determination (r²). In addition, it was checked that the
interactions involving tree species category never based solely on temporarily unstocked areas.
The parameter estimates for the final model are given in Tab. 9, Tab. 11, Tab. 13, Tab. 14, Tab.
16, Tab. 18, Tab. 20, Tab. 21 and Tab. 23.
In order to fulfil the statistical requirement of normal distribution of the residuals, all but one of
the dependent variables were loge-transformed; for biomass data, the square root was taken.
The normality was tested with the Anderson-Darling test and verified by the plot of quantiles
using the Univariate procedure in SAS Stat Version 9.2 (SAS Institute Inc. n.d. a). The total fol-
lowing analysis was conducted on the transformed variables. For presentational purposes of the
results the variables were back-transformed.
A basic statistical summary, including the number of observations, the mean (for comparing the
C pools) and LSmean (for comparing the categorical variables within the models for each C
pool), the standard error of the mean (Std. Err.), the 95% confidence interval limits as well as the
minimum and maximum value, was produced for total forest C, biomass, dead wood, forest floor
and soil C stock (Tab. 8) as well as for the categorical variables based on the respective model

Results
Carbon stocks in Danish forest types 31
(Tab. 10, Tab. 12, Tab. 15, Tab. 17, Tab. 19, Tab. 22, Tab. 24). In addition, the frequency distribu-
tion was created for tree species category and single tree species on soil category, stand age and
previous land use respectively (Tab. 6 and Tab. 7).
5. Results
The focus is on those variables that appear to have a significant effect on the C sequestration
potential for each pool respectively as well as for the total forest C content per hectare.
As expected, the largest C stock of our sampling plots is in forest soils. It accounts for about
66.5% of total C stored in Danish forests. Biomass (above- and belowground) constitutes the
second highest stock with 27.4%, whereas only small amounts are stored in forest floor (6.6%)
and dead wood (0.4%) (Fig. 7). When comparing the mean biomass C stock with the other C
pools, it has to be considered that the number of plots for biomass C stock is 10 less than for the
other pools. Thus, the relative biomass C stock could be slightly over- or underestimated. More
detailed numbers about the mean, standard error of the mean, 95% confidence interval and min-
imum and maximum amounts, are shown in table 8.
Tab. 8. Basic statistics of total carbon stock and the four carbon pools.
biomass dead wood forest floor soil
%
0
10
20
30
40
50
60
70
Fig. 7. Average relative carbon content of each pool.
CARBON STOCK
(t/ha-1)
Number of plots
Mean Std. Err.
95% confidence limits min. max.
Total 277 279 8.54 262 296 78.4 942
Biomass 267 81.2 4.27 72.8 89.6 0 440
Dead wood 277 1.16 0.19 0.79 1.53 0 22.7
Forest floor 277 15.3 0.89 13.6 17.1 0.24 69.5
Soil 277 184 7.33 170 199 36.6 698
lower | upper

Results
Carbon stocks in Danish forest types 32
Ta
b.
9.
Mo
de
l re
sult
s fo
r to
tal
carb
on
sto
ck:
sig
nif
ica
nt
eff
ect
s in
flu
en
cin
g t
ota
l ca
rbo
n s
tock
, lo
ge-t
ran
sfo
rme
d (
n=
27
7).
I
A
B
C
C*A
D
C
*D
A*B
FIN
AL
M
OD
EL:
LO
Ge
TO
TA
L C
inte
rce
pt
sta
nd
ag
e
soil
ca
te-
go
ry
cro
wn
co
ve
r cr
ow
n c
ov
er
* st
an
d a
ge
tr
ee
sp
eci
es
cate
go
ry
cro
wn
co
ve
r *
tre
e s
pe
cie
s ca
teg
ory
sta
nd
ag
e *
so
il c
ate
go
ry
p-v
alu
e
<.0
00
1
0.0
05
<
.00
01
<
.00
01
0
.04
0
.00
01
0
.00
2
0.0
1
r²
0
.17
0
.35
0
.38
0
.39
0
.43
0
.45
0
.47
pa
ram
ete
r e
stim
ate
4
.91
0
.01
Lo
amy
0
.03
Org
anic
0
.97
San
dy
0
0.0
1
-0.0
00
08
Bro
adle
af
0.1
8
C
on
ifer
-0
.55
Mix
ed
-0.4
9
te
mp
.un
st.
0
*Bro
adle
af
-0.0
08
*Co
nif
er
-0.0
00
9
*M
ixed
0
*t
emp
.un
st.
0
*Lo
amy
-0
.00
06
*Org
anic
-0
.00
8
*S
and
y
0
a, c
= o
bse
rved
val
ues
for
stan
d a
ge a
nd
cro
wn
co
ver
resp
ecti
vely
5.1. Total carbon stock
For total C stock, the best fitted model explained 47% of the variance (Tab. 9). Stand age was the
single factor which explained the largest part of the variance. It amounts almost 20%. Additional
15% of the variance can be attributed to the soil category. On average, organic soils store the
most C (Appendix V), and the C stock in organic soils is significantly different from the C stock of
other soil categories. However, the total C stock on organic soils decreases with increasing stand
age, whereas the C content in loamy and sandy soils increases with stand age (Fig. 8, left). The
decreasing trend for C in organic soils is due to only two observations in older stands. This
makes the interaction between soil category and stand age uncertain. Furthermore, the amount
of variance explained for all
three significant interactions
is very small, probably un-
certain, and therefore not
further interpreted.
To
tal C
arb
on
= I
+a
∙A+
B+
c∙C
+(a
+c)
∙A*C
+D
+c∙
C*D
+a
∙A*B

Results
Carbon stocks in Danish forest types 33
stand age
0 20 40 60 80 100 120 140 160 180
carb
on (
t ha-1
)
0
200
400
600
800
1000
loamyorganicsandy
crown cover
0 20 40 60 80 100
resi
dual
s
-1.5
-1.0
-0.5
0.0
0.5
1.0
1.5
broadleafconifermixedtemp. unst.
Fig. 8. Total C stock as a function of stand age for different soil category (left). Influence of crown cover and
tree species category on total carbon stock after the effects of the variables before (1. effect: stand age. 2.
effect: soil category. 3. effect: crown cover. 4. Effect: tree species category) have been removed. Shows
how much is explained by the added variable on the X-axis (right).
In comparison to conifer and mixed forests, broadleaf forests store significantly more C (317 t
ha-1). Conifer trees have the lowest C content (262 t ha-1), while mixed broadleaf and conifer
forests have the highest variation in C contents (Tab. 10). None of the differences between single
tree species were significant, even though it amounts to almost 100 t C ha-1 (in case of ash and
pine). Nevertheless, the single tree species representing broadleaf forests store on average more
C (~283 t C ha-1) than conifer species (~269 t C ha-1); albeit all conifers but pine have a higher C
content than oak forests (Tab. 10).
The C content stored in broadleaf forests is decreasing with increasing crown cover. However, in
order to examine the effect of the interaction of tree species category and crown cover, a se-
quence of residual plots were made (see Appendix V). Now, it becomes obvious that regarding
the interaction of tree species category and crown cover, broadleaf as well as conifer forests still
have an increasing effect on C storage while having a bigger crown cover, even though it is not a
strong one (Fig. 8, right). Yet, mixed forests show the highest increase in C stock with expanding
crown cover.
Tab. 10. Basic statistics of total carbon stocks distributed
to soil category, tree species category and single tree species.
TOTAL C (t ha-1)
LSMean 95% confidence limit
Loamy Non-est. a
Organic Non-est. b
Sandy Non.est. a
Conifer 262 a 237 287
Broadleaf 317 b 293 340
Mixed 299 ab 265 337
Temp.
unst. Non-est.
lower | upper
Note: a b indicate significant differences within
one group; | temp. unst. means temporarily un-
stocked; | non-est. means not estimable. | In order
to get the LSMean for the tree species category,
the tree species category variable was replaced by
the single tree species variable, using the same
model.

Results
Carbon stocks in Danish forest types 34
5.2. Individual carbon pools
5.2.1. Biomass
The model for biomass C stock has the highest determination coefficient (r²=0.53) of all (Tab.
11). The variation in C content in biomass is mainly explained by stand age and crown cover,
with the amount of variance explained with only stand age and crown cover included, reaching
39% and 14%, respectively. In addition, the effect of soil category is explaining an additional 2%
of the variance. Carbon storage in biomass does not increase linearly with stand age but tends to
stabilise when the trees are more than 100 years old (Fig. 9, left). At the first glance, increasing
crown cover is accompanied with an increasing biomass C stock (Fig. 9, right). However, per
definition a high crown cover does not automatically include a high biomass C stock. It only
shows the percentage of the covered area, meaning that a high crown cover can consist of many
young trees (with a lower biomass C stock each) on the one hand and of older trees that store on
average more C than younger ones, on the other hand.
Tab. 11. Model results for biomass carbon stock: significant effects influencing biomass carbon stock, square-
root transformed (n=267).
I A B C
FINAL MODEL:
SQRT BIOMASS C intercept stand age crown cover soil category
p-value 0.33 0.05 <.0001 <.0001
r² 0.39 0.52 0.53
parameter estimate
0.12 0.06 0.06
Loamy 1.09
Organic
0.32
Sandy 0
a, b = observed values for stand age and crown cover respectively
stand age
0 20 40 60 80 100 120 140 160 180
Car
bon
(t h
a-1)
0
100
200
300
400
500
crown cover
0 20 40 60 80 100
Car
bon
(t h
a-1)
0
100
200
300
400
500
Fig. 9. Biomass carbon by stand age (left) and by crown cover (right).
BiomassCarbon�I�a∙A�b∙B�C

Results
Carbon stocks in Danish forest types 35
Unlike the effect of the different soil categories on total C, the biomass C pool is significantly
larger in areas with loamy soils (on average 78 t ha-1), followed by sites with organic soils (on
average 65 t ha-1), with the generally lowest amount of C in biomass found on the sandy soils (on
average 60 t ha-1) (Tab. 12).
Tab. 12. Basic statistics of biomass carbon stocks distributed to soil category.
BIOMASS C (t ha-1)
LSMean 95% confidence limits
Loamy 78.4 a 68.1 89.4
Organic 65.4 a 48.3 85.0
Sandy 60.2 b 53.9 66.9
5.2.2. Dead wood
The model for dead wood C pool is the least fitting (r²=0.04). Only crown cover showed a signifi-
cant effect (see Appendix IV). According to the parameter estimate increasing crown cover caus-
es a decrease in dead wood C. Looking at Fig. 10, however, the opposite seems to be true.
crown cover
0 20 40 60 80 100
Car
bon
(t h
a-1)
0
5
10
15
20
251. residuals: after crown cover. with crown cover*tree_cat
crown cover
0 20 40 60 80 100
resi
dual
s
-4
-3
-2
-1
0
1
2
3
broadleafconifermixed
Fig. 10. Dead wood carbon by crown cover (left). Influence of the interaction of crown cover and tree species
category on dead wood carbon stock after the effect of the variable before (crown cover) has been re-
moved. Shows how much is explained by this interaction (right).
The tree species category does not have a significant effect. However, the interaction of crown
cover and tree species category is almost significant (p-value = 0.0575) (Tab. 13). This model
explains almost three times as much variation (r²=0.11) as the one with crown cover as the sin-
gle effect. It becomes obvious that the interaction of crown cover with broadleaves and conifers
results in a decreasing adjustment of the curve (Fig. 10, right), while mixed forests seem to have
a higher dead wood C content (Tab. 13).
lower | upper

Results
Carbon stocks in Danish forest types 36
Tab. 13. Model results for dead wood carbon stock: significant effects influencing dead wood carbon stock,
loge-transformed (n=87).
I A B
FINAL MODEL:
LOGe DEAD WOOD
C intercept crown cover
crown cover*tree spe-cies category
p-value 1.92 0.03 0.06 r² 0.05 0.11
parameter estimate -0.01
*Broadleaf
-0.004
*Conifer
-0.01
*Mixed
0
5.2.3. Forest floor
The best fitted model for the forest floor C pool explains 38% of the variation. Six variables had a
significant effect on forest floor C stock (Tab. 14). About 29%, which is more than 75% of what
the total model to predict forest floor C explains, is explained by tree species category and stand
age. The effect of precipitation, the interaction of stand age and tree species category describe
the remaining variance; about 5% and 3% each. Finally, previous land use contributes to 2% of
the explained variance.
Tab. 14. Model results for forest floor carbon stock: significant effects influencing forest floor carbon stock,
loge-transformed (n=275).
I A B C B*A D
FINAL MODEL:
LOGe FOREST
FLOOR C intercept
tree species category
stand age precipita-
tion
stand age * tree species
category
previous land use
p-value 0.03 0.005 <.0001 <.0001 0.0005 0.01
r² 0.22 0.29 0.34 0.37 0.39
parameter estimate
-1.87 Broadleaf
1.23
Conifer
1.40
Mixed
1.50
Temp.unst.
0
0.02 0.003 *Broadleaf
-0.01
*Conifer
0.008
*Mixed
0
*Temp.unst.
0
AFF
-0.75
FRF
0
ForestFloorCarbon�I�A�b∙B�c∙C�b∙B*A�D
DeadWoodCarbon�I�a∙A�a∙B
a = observed value for crown cover
b, c = observed values for stand age and precipitation respectively

Results
Carbon stocks in Danish forest types 37
In forest floors of conifer forests the C stock is up to 2.5 times higher than in broadleaf forests
(Tab. 15). The lowest C stock in forest floors of mixed forests is still higher than the highest val-
ues found for broadleaf forests. This is also reflected by the single tree species. Only fir and
Nordmann fir do not differ significantly from broadleaf species. For all but one plot each for co-
nifer and mixed forests, only broadleaf forests reach a higher age than 100 years (Fig. 11, top).
As a conclusion, the older stands have a higher forest floor C stock than younger ones. However,
five plots with beech and three plots with oak contain much more forest floor C than the other
broadleaf species (Fig. 11, bottom left). Except one plot with beech which is located on loamy
soils, they are all situated on sandy soils.
Tab. 15. Basic statistics of forest floor carbon stocks distributed
to PLU, tree species category and single tree species.
FOREST
FLOOR C (t ha-1)
LSMean 95% confidence limits
AFF
PLU
FRF
Non-est.
Non-est.
Conifer 11.5 b 8.12 16.2
Broadleaf 4.14 a 3.01 5.69
Mixed 8.78 b 6.12 12.6
Temp.
unst. Non-est.
Ash 2.62 a 1.32 5.19
Beech 5.89 a 3.99 8.68
Fir 7.75 ab 4.29 14
Larch 16.6 b 9.39 29.2
Nordmann
fir 9.82 ab 9.19 21.0
Norway
spruce 13.9 b 9.19 21.0
Oak 5.08 a 3.35 7.69
Pine 20.2 b 13.1 31.3
Sitka
spruce 17.9 b 10.4 30.6
In comparison to the other pools, the forest floor model is the only one where previous land use
has a significant effect. The C content is significantly lower on afforested areas than on those
areas that have been covered by forests also before 1990 (Appendix V).
lower | upper
Note: a b indicate significant differences within
one group; | temp.unst. means temporarily un-
stocked; | non-est. means not estimable. | In order
to get the LSMean for the tree species category,
the tree species category variable was replaced by
the single tree species variable, using the same
model.

Results
Carbon stocks in Danish forest types 38
stand age
0 20 40 60 80 100 120 140 160 180
Car
bon
(t h
a-1 )
0
10
20
30
40
50
60
70
broadleaf conifermixed temp. unst.
stand age
0 20 40 60 80 100 120 140 160 180
Car
bon
(t h
a-1)
0
10
20
30
40
50
60
Ash Beech Oak
stand age
0 20 40 60 80 100 120 140 160 180
Car
bon
(t h
a-1)
0
10
20
30
40
50
60
70
FirLarch Nordmann fir Norway spruce Pine Sitka spruce
Fig. 11. Forest floor carbon stock as a function of stand age for different tree species categories (top). Forest
floor carbon stock as a function of stand age by single tree species (bottom left: broadleaf species; bottom
right: conifer species).
5.2.4. Soil
The final model for soil C reaches a coefficient of determination (r²), of 0.30. Most of the factors
influencing the C stock are explained by the soil category (~22%). In addition to soil category, it
appears significant whether it is a broadleaf, conifer or mixed forest (Tab. 16). Organic soil dif-
fers significantly from the others (Tab. 17). It stores about twice as much C as loamy or sandy
soils. Even the lowest value in the 95% confidence interval is 46% higher than the highest value
in the interval of loamy and sandy soils. Soils under conifer forests store least C – about 31% less
than broadleaf forests, which is even less than under temporarily unstocked areas. However,
conifer and temporarily unstocked areas show no significant difference. The difference between
conifer and broadleaf forests is confirmed by single tree species. Soils under ash, beech and oak
have the highest C content. There is a significant difference between pine and all broadleaf tree
species as well as between pine and Norway spruce.

Results
Carbon stocks in Danish forest types 39
SoilCarbon�I�A�B
Tab. 16. Model results for soil carbon stock: significant effect influencing soil carbon stock; loge -transformed
(n=277).
I A B
FINAL MODEL:
LOGe SOIL C intercept soil category tree species
category
p-value <.0001 <.0001 <.0001
r² 0.22 0.30
parameter estimate
4.90
Loamy
-0.04
Organic
0.72
Sandy
0
Broadleaf
0.29
Conifer
-0.08
Mixed
0.20
Temp.unst.
0
Tab. 17. Basic statistics of soil carbon stocks distributed
to soil category, tree species category and single tree species.
SOIL C (t ha-1)
LSMean 95% confidence limits
Loamy 143 a 124 164
Organic 306 b 248 378
Sandy 149 a 134 165
Conifer 156 a 139 174
Broadleaf 225 b 205 246
Mixed 206 b 179 238
Temp.
unst. 168 ab 117 243
Ash 243 a 178 330
Beech 169 a 147 194
Fir 161 ab 126 205
Larch 146 ab 113 187
Nordmann
fir 166 ab 128 217
Norway
spruce 168 a 143 1967
Oak 177 a 148 212
Pine 115 b 96.2 137
Sitka
spruce 164 ab 135 199
lower | upper
Note: a b indicate significant differences within
one group; | temp.unst. means temporarily un-
stocked. | In order to get the LSMean for the tree
species category, the tree species category varia-
ble was replaced by the single tree species varia-
ble, using the same model.
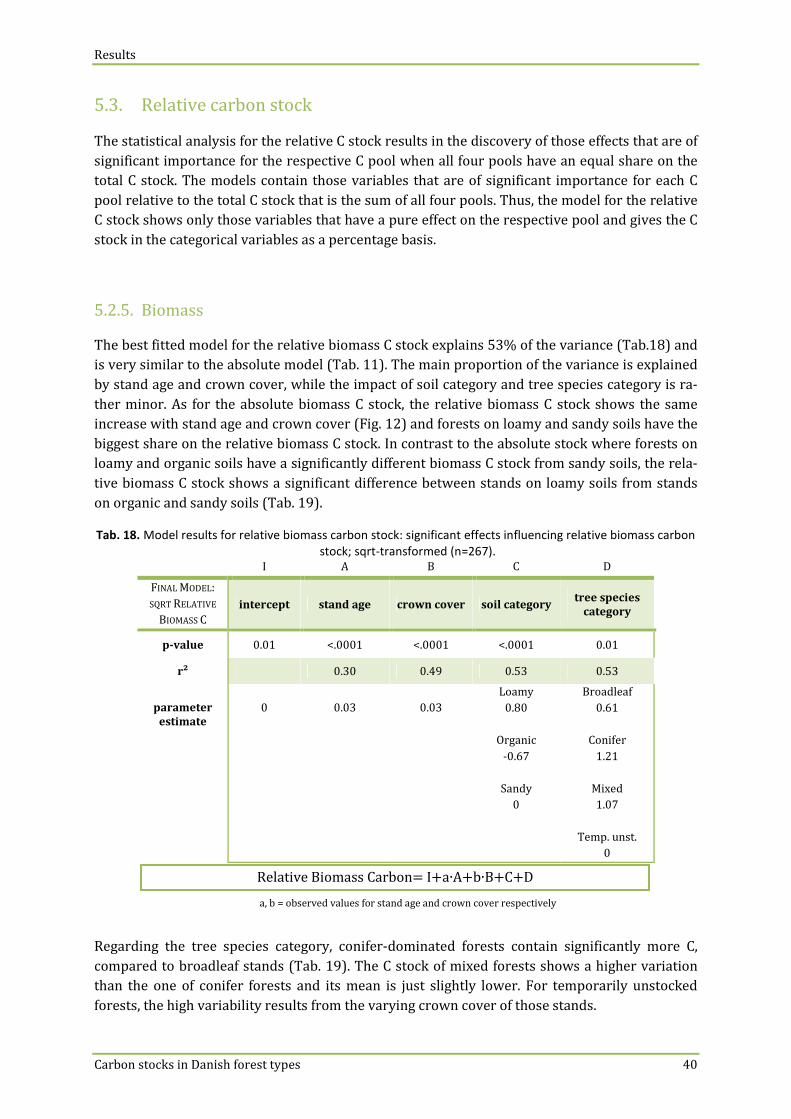
Results
Carbon stocks in Danish forest types 40
RelativeBiomassCarbon�I�a∙A�b∙B�C�D
a, b = observed values for stand age and crown cover respectively
5.3. Relative carbon stock
The statistical analysis for the relative C stock results in the discovery of those effects that are of
significant importance for the respective C pool when all four pools have an equal share on the
total C stock. The models contain those variables that are of significant importance for each C
pool relative to the total C stock that is the sum of all four pools. Thus, the model for the relative
C stock shows only those variables that have a pure effect on the respective pool and gives the C
stock in the categorical variables as a percentage basis.
5.2.5. Biomass
The best fitted model for the relative biomass C stock explains 53% of the variance (Tab.18) and
is very similar to the absolute model (Tab. 11). The main proportion of the variance is explained
by stand age and crown cover, while the impact of soil category and tree species category is ra-
ther minor. As for the absolute biomass C stock, the relative biomass C stock shows the same
increase with stand age and crown cover (Fig. 12) and forests on loamy and sandy soils have the
biggest share on the relative biomass C stock. In contrast to the absolute stock where forests on
loamy and organic soils have a significantly different biomass C stock from sandy soils, the rela-
tive biomass C stock shows a significant difference between stands on loamy soils from stands
on organic and sandy soils (Tab. 19).
Tab. 18. Model results for relative biomass carbon stock: significant effects influencing relative biomass carbon
stock; sqrt-transformed (n=267).
I A B C D
FINAL MODEL:
SQRT RELATIVE
BIOMASS C intercept stand age crown cover soil category
tree species category
p-value 0.01 <.0001 <.0001 <.0001 0.01
r² 0.30 0.49 0.53 0.53
parameter estimate
0 0.03 0.03
Loamy
0.80
Organic
-0.67
Sandy
0
Broadleaf
0.61
Conifer
1.21
Mixed
1.07
Temp. unst.
0
Regarding the tree species category, conifer-dominated forests contain significantly more C,
compared to broadleaf stands (Tab. 19). The C stock of mixed forests shows a higher variation
than the one of conifer forests and its mean is just slightly lower. For temporarily unstocked
forests, the high variability results from the varying crown cover of those stands.

Results
Carbon stocks in Danish forest types 41
stand age
0 20 40 60 80 100 120 140 160 180
Rel
ativ
e C
arbo
n (%
)
0
20
40
60
80
crown cover
0 20 40 60 80 100
Rel
ativ
e C
arbo
n (%
)
0
20
40
60
80
Fig. 12. Relative biomass carbon by stand age (left) and by crown cover (right).
Tab. 19. Basic statistics of relative biomass carbon stocks distributed to soil category and tree species category.
RELATIVE
BIOMASS C (%)
LSMean 95% confidence limits
Loamy 28.0 a 23.5 32.8
Organic 14.9 b 9.96 20.1
Sandy 20.2 b 17.2 23.3
Conifer 25.2 ac 21.8 28.8
Broadleaf 19.5 b 17.1 22.1
Mixed 23.8 bc 19.8 28.2
Temp.
unst. 14.5 bc 6.49 25.7
Note: a b c indicate significant differences within one group.
5.2.6. Dead wood
The model for relative dead wood C stock is the least fittable, reaching a coefficient of determi-
nation of only 0.05 (Tab. 20). Crown cover is the only effect likely to influence this relative C
pool. However, the graphical analysis (Fig. 13) supports the assumption that crown cover is ra-
ther an occasional effect chosen to significantly influence the relative dead wood C stock.
lower | upper

Results
Carbon stocks in Danish forest types 42
RelativeDeadWoodCarbon�I�A
Tab. 20. Model results for relative dead wood carbon stock: significant effects influencing relative dead wood
carbon stock; loge –transformed (n=87).
I A
FINAL MODEL:
LOGe RELATIVE
DEAD WOOD C intercept crown cover
p-value 0.1469 0.0242
r² 0.06
parameter estimate
0.83 -0.02
crown cover
0 20 40 60 80 100
Rel
ativ
e C
arbo
n (%
)
0
2
4
6
8
10
Fig. 13. Relative dead wood carbon by crown cover.
5.2.7. Forest floor
The final model for estimating the relative forest floor C stock accounts for 41% of the total ef-
fects influencing the C stock. Tree species category describes more than half of it. Precipitation,
stand age, PLU and the interaction of stand age and tree species category only play a secondary
role, raising the determination coefficient together by an additional 11% (Tab. 21).
Conifer dominated stands contribute a significantly greater share on the relative forest floor
stock than broadleaf forests (Tab. 22). The same is true for mixed stands which also differ signif-
icantly from broadleaf dominated forests. Moreover, with an increasing stand age, the relative
forest floor C stock rises as well (Fig. 14). Additionally, PLU displays a significant difference in
forest floor C stock. Forests that have been remaining as forests since 1990 show a higher rela-
tive forest floor C stock than those that have been afforested (see Appendix VI).
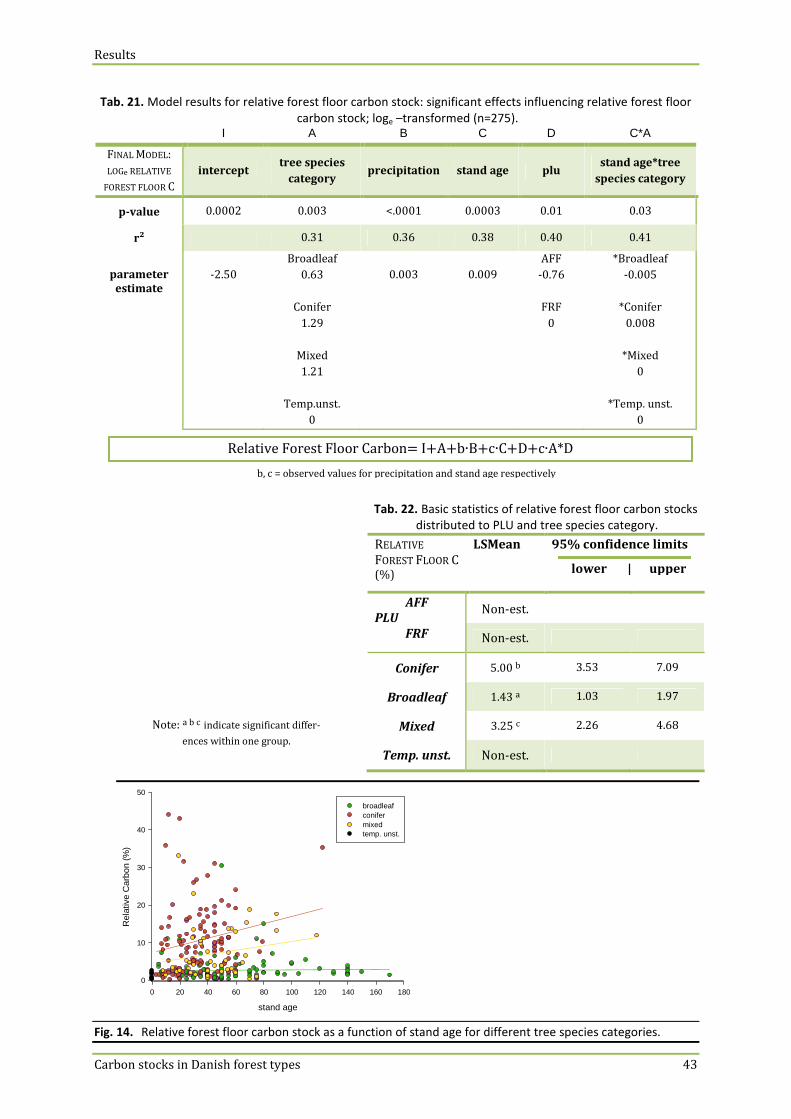
Results
Carbon stocks in Danish forest types 43
RelativeForestFloorCarbon�I�A�b∙B�c∙C�D�c∙A*D
Tab. 21. Model results for relative forest floor carbon stock: significant effects influencing relative forest floor
carbon stock; loge –transformed (n=275).
I A B C D C*A
FINAL MODEL:
LOGe RELATIVE
FOREST FLOOR C
intercept tree species
category precipitation stand age plu
stand age*tree
species category
p-value 0.0002 0.003 <.0001 0.0003 0.01 0.03
r² 0.31 0.36 0.38 0.40 0.41
parameter estimate
-2.50
Broadleaf
0.63
Conifer
1.29
Mixed
1.21
Temp.unst.
0
0.003 0.009
AFF
-0.76
FRF
0
*Broadleaf
-0.005
*Conifer
0.008
*Mixed
0
*Temp. unst.
0
Tab. 22. Basic statistics of relative forest floor carbon stocks
distributed to PLU and tree species category.
RELATIVE FOREST FLOOR C (%)
LSMean 95% confidence limits
AFF
PLU
FRF
Non-est.
Non-est.
Conifer 5.00 b 3.53 7.09
Broadleaf 1.43 a 1.03 1.97
Mixed 3.25 c 2.26 4.68
Temp. unst. Non-est.
stand age
0 20 40 60 80 100 120 140 160 180
Rel
ativ
e C
arbo
n (%
)
0
10
20
30
40
50
broadleafconifermixedtemp. unst.
Fig. 14. Relative forest floor carbon stock as a function of stand age for different tree species categories.
lower | upper
b, c = observed values for precipitation and stand age respectively
Note: a b c indicate significant differ-
ences within one group.

Results
Carbon stocks in Danish forest types 44
RelativeSoilCarbon�I�a∙A�b∙B�c∙C�D�(a+e)∙A*E
5.2.8. Soil
In total, the r² amounts to 0.42 (Tab. 23). Stand age and crown cover constitute the largest effect
(r²=0.35 together) on the relative soil C stock. While stand age and crown cover are increasing,
they both show a decline in the relative soil C stock (Fig. 15, top left). Broadleaf fraction, soil
category and the interaction of stand age and tree species biodiversity account for the remaining
7%. A conifer fraction of 100%, which is equivalent to a broadleaf fraction of 0, indicates a posi-
tive adjustment of the curve of the relative soil C stock than a broadleaf fraction of 100% (Fig.
15, top right).
Tab. 23. Model results for relative soil carbon: significant effects influencing relative soil carbon stock; sqrt –
transformed (n=268).
I A B C D A*E
FINAL MODEL:
SQRT RELATIVE
SOIL C
intercept stand age crown cover broadleaf
fraction
soil
category
stand
age*biodiversity
p-value <.0001 <.0001 <.0001 <.0001 0.004 0.02
r² 0.26 0.35 0.39 0.42 0.43
parameter estimate
9.68 -0.02 -0.01 0.70
Loamy
-0.20
Organic
0.50
Sandy
0
0.003
a, b, c, e = observed values for precipitation and stand age respectively
In comparison to loamy and sandy soils, organic soils contribute a significantly higher propor-
tion of the relative soil C stock (Tab. 24). The upper limit of the 95% confidence interval of
loamy soils is even less then the lower limit of organic soils.
Tab. 24. Basic statistics of relative soil carbon stocks distributed to soil category.
RELATIVE
SOIL C (%)
LSMean 95% confidence limits
Loamy 61. 6 a 58.4 64.8
Organic 73.1 b 66.8 79.7
Sandy 64.8 a 62.5 67.1
Note: a b indicate significant differences within one group.
At rates with the lowest biodiversity, the relative soil C stock decreases with stand age. As soon
as the biodiversity increases, the relative soil C stock increases with stand age (Fig. 15, bottom).
lower | upper

Discussion
Carbon stocks in Danish forest types 45
stand age
0 20 40 60 80 100 120 140 160 180
Rel
ativ
e C
arbo
n (%
)
0
20
40
60
80
100
broadleaf fraction
0.0 0.2 0.4 0.6 0.8 1.0
resi
dual
s
-4
-3
-2
-1
0
1
2
3
biodiversity
0 1 2 3 4 5 6 7
Rel
ativ
e C
arbo
n (%
)
0
20
40
60
80
100
120
0-19 years 20-39 years40-59 years 60-79 years80-99 years>=100 years
Fig. 15. Relative soil carbon by stand age (top left). Influences of broadleaf fraction on relative soil carbon
stock after the effects of the variables before have been removed (stand age and crown cover). Shows how
much is explained by the added variable on the X-axis (top right). Relative soil carbon stock as a function of
biodiversity for different stand age classes (bottom).
6. Discussion
In comparison to the world’s average forest C stock (162 t ha-1 (FAO 2010)) as well as to the
world’s temperature forest C stock (152 t C ha-1 (IPCC 2000)) , the C content in Danish forests is
higher (279 t ha-1). During the last approximately 10 years the above- and belowground bio-
mass, the dead wood and the forest floor C pool in Danish forests have been increasing: Biomass
C stock amounts to 36.9 million t in 2010, which is almost 1.5 times more than in the year 2000.
The forest floor C stock increased by 1 million t to 6.8 million t in 2010, while the dead wood C
stock shows a growth by 0.1 million t to 0.5 million t in 2010. Data for the soil C stock are not
available for comparisons (FRA 2010). A study on the forest C pools in Wisconsin, U.S.A., reveal a
total C stock of 252 t ha-1, with an allocation of about 65% to the soil C pool, 22.7% to the bio-
mass, 7.5% to the forest floor and 4% to the dead wood C stock (Wisconsin DNR n.d.). According

Discussion
Carbon stocks in Danish forest types 46
to the U.S. Agriculture and Forestry Greenhouse Gas Inventory from 1990-2009 (U.S.
Environmental Protection Agency 2011), most C is stored in above- and belowground biomass,
accounting for 44.7% together, the second biggest amount is stored in the soil (38.0%). Forest
floor and dead wood account for 10.7% and 6.75% each. The comparison is, however, difficult
since different definitions of these pools are applied. For the latter study for instance, the living
understory is included in the aboveground C pool. This might explain the higher biomass C stock
compared to the soil. There are several possible explanations for the lower average world’s C
stock compared to Danish forests. First of all, the average C fraction globally used amounts 0.48,
Denmark applies a C fraction of 0.50. Secondly, the average world’s forest C stock does not rep-
resent 100% but 94% of the world’s forest area. Moreover, the response of the countries to the C
pools varied. Only 61% of all countries replied to the dead wood C stock and about 78% to the
soil C stock. Thirdly, despite efforts of harmonization of national forest inventories, different
forest definitions and soil sampling depth were applied (FAO 2010).
All but two independent variables examined in this study are significant for the absolute forest C
stock in one way or the other. Tree species biodiversity and broadleaf fraction are only signifi-
cant for the relative soil C stock. While precipitation and PLU significantly affect the forest floor
only stand age, soil category, crown cover and tree species category constitute significant effects
on three out of five C pools (including the total C stock). The amount of a single effect explaining
the major variance in the total C stock decreases in the order stand age > soil category > crown
cover > tree species category (Tab. 9).
6.1. Stand age
In general, the results supported the hypothesis that the total C stock as well as the biomass C
raises with increasing stand age. Moreover, the same effect applies for the forest floor C stock.
This can be attributed to varying photosynthesis and decomposition rates (Tyrrell et al. 2012).
Older trees do not sequester as much C as younger trees which is explained by a slower growing
rate. Nevertheless, older trees have a larger biomass in which the C has had more time to accu-
mulate (Lorenz & Lal 2010). Other studies confirm this finding (e.g. Tyrrell et al. 2012). Accord-
ing to Pregitzer et al. (2008) (in Tyrrell et al. 2012), the C sequestration peaks within the age
class of 11 to 30 years old stands. The results from this study indicate a peak in the C stock at
stands between 35-60 years (Fig. 8, Fig. 9 and Fig. 11). The following stagnation phase becomes
most visible within the biomass C stock (Fig. 9). In this pool, the two most important significant
effects are stand age and crown cover, displaying the biomass production rate. In combination
with crown cover, the influence of stand age is highest on younger to medium old stands and
lowest on older stands. Logically, the total C stock has a higher potential to increase in younger
stands with low crown cover than in older stands.
Stand age within forest floor C pool comes second after tree species category (Tab. 14), but
third after precipitation in relative forest floor (Tab. 21). With increasing age, more leaves and
other plant materials accumulate on the ground, leading to a steady input of organic matter over
time. Therefore, depending on the tree species category and on the litter quality, more C is ac-
cumulated, too. Contrary to the stand age’s effect on biomass and forest floor, the relative soil C
stock decreases with increasing stand age since older stands contain more C in biomass than
younger. Thus, the percentage of soil C decreases.

Discussion
Carbon stocks in Danish forest types 47
6.2. Soil category
The soil category is the most critical for the soil C stock, as initialliy hypothesized, but it also has
a significant influence on the biomass C stock and of course on the total C stock (Tab. 16, 11 and
9). Overall, the high variation of the C content in the soil categories might be caused by the very
heterogeneous plots (Rodeghiero et al. 2010). Within the soil and total C pool, the organic soil
category has a significantly higher C stock than loamy and sandy soils which could mainly be
attributed to its higher SOM content. The same might explain the minor difference between
loamy and sandy soils. Both contain far less organic matter than the organic soil category
whereas the variability of organic matter content in loamy and sandy soils indeed varies with
samples but obviously to almost the same extent. Each soil category is characterized by its
properties (e.g. clay content, pH, soil moisture). These in turn determine, among others (site
conditions, litter input quality and quantity and its type of C compounds -labile or stable C), the
turnover rate of SOM (Jandl et al. 2007). Soil respiration increases with soil temperature, hence
the amount of SOM is lower in areas with higher temperatures. Yet, the turnover of SOM
containing stable C is independent of temperature (Jandl et al. 2007). In general, low
temperature and excess soil moisture surpress soil respiration. Furthermore, clay minerals and
oxides enable C to form stable complexes, impeding mineralization of C (Jandl et al. 2007). Soil
microbial processes are hindered in sandy soils and in soils where nutrient availability is low or
with a low pH (Jandl et al. 2007).
Regarding the biomass C pool, the biggest C amount is stored on areas with loamy soils,
followed by organic soils. Both differ significantly from sandy soils (Tab. 12). This could be
explained by the influence of the tree species categories representing the site conditions.
Meaning that the soil conditions influence which kind of species is growing best on the
respective site. According to the total C stock, most C accumulates in broadleaf forests, least in
conifer forests (Tab. 6). Approximately 66% of the plots on loamy soils are covered with
broadleaf dominated forests of which about 50 % are located on loamy and 16% on organic
soils. Conifer forests, instead, are largely located on sandy soils (83%). Hence, the biomass C
stock on sandy soils is lowest. On the other hand, this distribution could occur no matter what
tree species is growing on loamy, organic or sandy soils because the tree species are not equally
distributed on the different soil categories. This is confirmed by the analysis of the relative
biomass C stock. Here, conifer dominated forests contain the significantly biggest relative
biomass C stock compared to mixed, broadleaf and temporarily unstocked stands (Tab. 19).
6.3. Crown cover
The crown area helps to determine the extent to which a tree is able to conduct photosynthesis
since photosynthesis is mainly carried out via leaves. Consequently, increasing crown cover
indicates a bigger amount of trees in the respective area. However, the same cover ratio can be
composed of both a few old trees on the one hand, and multiple young trees on the other hand.
Since younger trees contain less C than older ones, a high crown cover does not necessarily
indicate bigger biomass C stocks. Nevertheless, the overall effect of increasing crown cover is
positive for the biomass C stock. Additionally, crown cover extent also has a positive significant
effect on the total C stock (Tab. 9).

Discussion
Carbon stocks in Danish forest types 48
The forest floor development depends on decomposition rates, hence on litter properties (e.g.
C:N ratio), and disturbances such as heavy rain or strong wind events causing leaves or branches
to fall down (Woodall et al. 2012). As the C accumulation in forest floor increases with forest
floor development (Vesterdal et al. 2007), it is surprising that the crown cover does not have a
significant impact on forest floor C stock. Penne et al. (2010) investigated the impact of the can-
opy structure of a pure pine stand on the spatial variability on forest floor C stocks and found out
that only the mass of input material is crucial for the accumulation of C in the forest floor. While
the canopy structure influences the litter fall, the mass reaching the ground affects the environ-
mental conditions for microbial/enzymatic activity that determine the mineraliza-
tion/decomposition.
As expected, the results for dead wood C content are not very representative and have to be
carefully interpreted. Although crown cover had the single weakly significant effect on this C
pool, the following has to be considered: First of all, there were relatively few sample plots (only
87 out of 277 contained dead wood), hence, the representativeness is lacking (Bradford et al.
2010). Secondly, the final model has a low coefficient of determination and is accordingly not
very reliable. Thirdly, regarding the graphical analysis, the pattern for high crown cover can also
be assigned to areas with lower crown cover (Fig. 10). As Nord-Larsen et al. (2008) indicate, the
distribution of dead wood volume is highly dependent of the sample plot size. Thus, the
assumption is having more sample plots with dead wood content, which might be achieved by
extending the sample plot size, the C stock in dead wood might not significantly differ with
varying crown cover. Additionally, the interaction of crown cover and tree species category
might not be relevant for dead wood either. Instead, dead wood C stock is expected to depend on
stand age. This can be attributed to the senescence process of trees since it leads to e.g. more
input of woody debris (Lombardi et al. 2008; Lorenz & Lal 2010). Moreover, the dead wood vol-
ume increases with the frequency and intensity of disturbances (Christensen et al. 2003). In ad-
dition to the above mentioned factors, forest type and species composition as well as local soil
and climatic conditions influence the decomposition and therefore affect the C stock of dead
wood (Lombardi et al. 2008). Calculating dead wood C stock, the different constitution of wood
of conifer and broadleaves (hard- and softwood proportion) has to be considered determining
the decomposition factor (Brown 2002).
The relative soil C stock decreases with increasing crown cover for the same reason as it de-
clines with increasing stand age. Higher crown cover indicates more biomass C. Therefore the
soil C pool shows a smaller percentage in the total C stock.
6.4. Tree species category
As hypothesised, the tree species significantly affect the C stocks of the forest floor, soil and the
total C stock (Tab. 14, 16 and 9). Due to the different growing patterns, meaning the different
increase in biomass volume over the years as well as heart- and sapwood contents of broadleaf
and conifer trees it was expected that their different C stocks have a significant influence on the
total biomass C stock. This is, however, not the case. In addition to the variables stand age and
crown cover that are explaining the development of biomass volume, the soil category is signifi-
cant. The soil type sets the conditions for species to survive and grow on that specific site as well
as influencing the vegetation productivity (Baritz et al. 2010). Therefore, the tree species catego-

Discussion
Carbon stocks in Danish forest types 49
ry is still addressed to a certain degree in the absolute biomass C stock. The tree species effect is
eventually revealed in the relative biomass C stock.
Regarding the forest floor C stock, the tree species category constitutes the main significant
effect. The litter of conifer trees for instance contains more lignin than that of broadleaved trees
and is thus more resistant to decomposition. Consequently, more litter accumulates on the
ground and the forest floor layer becomes thicker. The main influence of tree species on the
forest floor C stock is derived from the varying turnover rates (Vesterdal et al. 2008). This could
also explain the higher forest floor C content under mixed stands. Eight plots with broadleaved
forests (consisting of beech and oak dominated stands) constitute an exception. Since all plots
are located on sandy (7) or loamy (1) soils, an underlying effect of soil category on forest floor C
stock might be expected (higher on sandy and loamy soils than on organic soils). This is also
confirmed by the fact that a higher percentage of conifer species than broadleaved is situated on
sandy and loamy soils. Unlike Tyrrell et al. (2012) stated, in this survey the C pool differs
significantly with tree species category. The interaction of stand age and tree species category
indicate that besides the single effects of these variables, the combination of e.g. old stands
dominated by broad-leaved trees still store significantly less forest floor C than conifer stands of
the same age. Moreover, coniferous species have a shallow root system leading to higher
accumulations of SOM in the forest floor than in the mineral soil (Jandl et al. 2007).
Whether forests are dominated by conifer or broadleaved trees also influences the soil C stock
significantly. In contrast to a study from Wisconsin (Wisconsin DNR n.d.), the results from this
study show that most C is stored in soils under broadleaved forests (Tab. 17). Firstly, this effect
can be attributed to the different litter quality and quantity, leading to a different SOM quality
(Thuiller et al. 2006). The litter quality determines whether microbes can decompose it easily or
if it is more resistant. In general, C allocation to roots and consequently, the SOC content in-
creases with rising litter input (Raich & Nadelhoffer 1989) and forest productivity combined
with unfavourable decomposition conditions (Baritz et al.2010). Secondly, it can be explained by
the different root development, quality and finally root decay rates of conifers and broadleaves
(Vesterdal et al. 2008), which is, however, also depending on the soil (Silver & Miya 2001).
Moreover, C is released to the soil via root-associated symbionts which may not only differ by
tree species category but also by soil category. However, these results may as well be caused by
the uneven distribution of forest types over the soil categories thereby only mirroring the
already discussed effects of soil categories on soil C stocks. In agreement with a study by
Vesterdal et al. (2008), species with low forest floor C, contain more C in the soil (Tab. 15 and
Tab. 17).
The total C stock surprises by the clear difference between broadleaved and conifer forests.
Forests dominated by broadleaved trees store in total more C (Tab. 10). Only the forest floor C
stock has a higher C content in conifer forests (Tab. 15). Since tree species set different condi-
tions to their environment which is expressed in varying tolerances of the site conditions (e.g.
conifers grow on lower pH than broadleaves), species occupy different ecological niches, and
hence they can complement each other (Jandl et al. 2007). Therefore, mixed forests have higher
biomass production and C stock than those dominated by conifers. As the soil C stock, attributing
the highest C stock to broadleaf forests, contributes the most to the total C stock, it is likely that
these forest types show the highest C stock in total (after combing all C pools) as well. However,
as discussed above, the high total C stock in broadleaf forests can be attributed to the uneven
distribution of forest types over the soil categories resulting in higher soil C stock under broad-

Discussion
Carbon stocks in Danish forest types 50
leaf forests. Moreover, it can be attributed to the higher average stand age of broadleaves com-
pared to conifers (see Chapter 6.9).
The results for the single tree species rather give indications about the C allocation than being
reliable. In order to get reliable results the sample size need to be larger. Moreover, pure stands
of a specific tree species need to be sampled to further strengthen the validity of the results.
Nevertheless, the results for C allocation under single tree species in this study mostly confirm
those of the tree species category, e.g. the fact that forest floor C stock under conifer dominated
stands is higher than under broadleaf trees, is confirmed by the single conifer tree species (Tab.
15).
6.5. Precipitation
The effect of precipitation is only significant for the forest floor C stock. Heavy rainfalls, ice and
snow contribute to litter input to forest floor and the soil (Lorenz & Lal 2010). As Baritz et al.
(2010) points out, a prolonged water-saturation of the top soils impede decomposition, hence
resulting in a thicker forest floor layer, containing more C. In Denmark, however, the
precipitation range is too low to result in prolonged water-saturation. This might rather be an
aspect of topography. On the other hand, Lensing & Wise (2007) suggest that increased leaching
and growth of microflora might explain the accelerated decay rate in case of increased rainfall.
However, precipitation could also be an effect displaying the growth of the stand.
Moreover, it has to be mentioned that the effect of precipitation could cover the impact of soil
category. If the variable of precipitation is left out, the soil category entered the model.
According to the precipitation pattern, it is highest in western Denmark. In addition, most sandy
soils are located in western Denmark and on sandy soils in turn, grow mostly conifer forests.
This again represents the effect of the tree species category with highest forest floor C stocks
under conifer forests.
6.6. Previous land use
Previous land use affects only the forest floor C stock to a significant extent. The reference year
for PLU is 1990. Forests remaining as forests beyond this date still have a significantly higher
forest floor C stock than afforested areas. Thus, the C content in the forest floor increases con-
sistently as the forest floor develops (Jandl et al. 2007). This is also confirmed by a study of C
sequestration in soil and biomass following afforestation carried out by Vesterdal et al. (2007).
It could have been expected that also the forest soil C stock is influenced by the previous land
use. Comparing the soil C stock of arable land and forests, it leads to the conclusion that PLU
affects soil C sequestration and storage since forest soils contain more C (Vesterdal et al. 2009).
In addition, it has been reported that the soil C content following deforestation declines
(Vesterdal et al. 2007; Jandl et al. 2007). Therefore, it has been inferred that afforestation
measures on arable land would increase soil C as well as forest floor C stock –if afforestation
took place on nutrient-poor sandy soils (Vesterdal et al. 2007). Nevertheless, planting can induce
the mineralization of SOM evoking to C losses if they are not offset by litter fall (Jandl et al.
2007). As PLU is not a significant factor for soil C pool even so, it could be related to the time

Discussion
Carbon stocks in Danish forest types 51
span, explaining that after a maximum of 20 years after the afforestation took place (which was
in 1990) no significant difference is detectable anymore.
6.7. Broadleaf fraction
Regarding the relative soil C stock, not the tree species category but the broadleaf fraction is
significant. The increase in relative soil C stock with an increasing content on broadleaf trees
shows that the amount of broadleaf trees is more important than the single tree species catego-
ry. This result supports the result of the absolute soil C stock, indicating that soils under broad-
leaf trees contain more C than those under conifer or mixed stands. A higher percentage of soil C
under broadleaf forests means that at the same time, the other C pools are relatively smaller.
Consequently, this reveals that conifer forests, which have a smaller percentage of soil C than
broadleaved forests, have a bigger percentage of e.g. forest floor C.
6.8. Biodiversity
Biodiversity has a significant effect on the relative soil C pool only. Younger and less diverse
stands store more C than older stands with the same low biodiversity rate. On the whole, the
relative soil C stock of more diverse stands increases with stand age. Forests that are used for
harvesting are probably cut more often than unmanaged forests and are dominated by single
species. This results in generally younger, less diverse stands that have a higher percentage in
soil C, whereas unmanaged stands may be more diverse and relatively older, containing less
relative soil C but more C in biomass.
6.9. Other factors
Besides those factors examined in this study, the C stock in forests is influenced by several other
factors. Regarding the total C stock, another argument for the high C stock in broadleaf forests is
the generally older broadleaf stands. Especially beech dominated forests show a relatively high
average age (Tab. 7). The age of the different stands could be influenced by the wood market for
instance. Regarding old beech stands, this would indicate a bad market situation/ low prices for
beech wood. Consequently, beech stands were not cut but maintained and conifer stands have in
general a shorter rotatoin rate. The average young age for conifer forests could also be a result of
windthrows. As their root system is rather swallow, they are more prone to windthrows than
broadleaf trees. In combination with crown cover, conifer and mixed forests show a higher
influence on total C stock than broadleaf forests (Fig. 8). This might also be explained by the fact
that broadleaf forests are on average older than the other two categories, hence, the average
total C stock is higher regardless the crown cover extent.
Besides the natural factors (e.g. senescence process), the management of a forest has the main
influence on dead wood volume and consequently, on C stock. In general, dead wood volume is
higher in unmanaged than in managed forests (Lombardi et al. 2008). A slight indication of that
founding by Lombardi et al. (2008) within the results of this study might be derived from the
distribution of dead wood C between the tree species categories (Tab. 13). In comparison to co-
Conclusion
Carbon stocks in Danish forest types 52
nifer and broadleaf dominated forests, mixed forests contain most dead wood C. Plantation for-
ests that are used for wood production, and thus fall into the category of managed forests, main-
ly contain the same species. Therefore, they are either classified as conifer or as broadleaf
stands. As a result, this might support the fact that managed forests contain less dead wood C.
Forest management can also influence the soil C stock. An increased productivitiy leads to an
increased amount of C allocated to the soil. However, tree species affect the rate of how much C
accumulates and how it is distributed within the soil. Mixed forests show less high rates of SOM
decomposition and contribute to the forest’s stability. In general, C losses are reduced when
disturbances in the stand structure and the soil are kept to a minimum (Jandl et al. 2007).
Moreover, concentrations of Ca and P as well as the pH affect the decomposer system and thus
the accumulation of C in forest floor and soil. The increasing soil nutrient status causes the forest
floor C content to decrease. However, different pH and C/nutrient ratios in forest floor under
various tree species may be related to their genetically different litter quality, which in turn sup-
ports the result of the forest floor C model indicating the significant influence of the tree species
category (Vesterdal & Raulund-Rasmussen 1998).
6.10. Statistical considerations
The automatic selection procedure of the “best fitted” regression model has its constraints. It is
criticized that the statistical rules for deciding the entrance and removal threshold of each vari-
able to the model are somewhat randomly chosen within this process (Quinn & Keough 2002).
Moreover, statistical hypothesis testing and the significance levels or the F statistics are not well
suited for this procedure. There is a risk of “overfitting” the model, occurring when some predic-
tor variables are added to the model since they yield a higher r² but at the same time adding only
slightly more to the explanatory power. Therefore, the chosen variables in the final model might
not be always related to the response variable. Moreover, collinearity between the predictor
variables influences the selection process (Quinn & Keough 2002; SAS Institute Inc. n.d. b).
However, efforts to avoid these constraints have been made by testing for collinearity of predic-
tor variables before running the model. Further, the model results have been checked for validi-
ty by graphical analysis. This has been done by creating a sequence of residual plots, including a
procedure of added variable testing (see Appendix V and VI).
In total, addressing the soil category and tree species category as well as single tree species and
PLU, some results are rather weak. The representation of conifer and mixed forests on organic
soils for instance is small (Tab. 6 and Tab. 7). The same is true for afforested (AFF) sites.
7. Conclusion
Since forests are of profound importance to the global C cycle, reporting on forest C is fully rea-
sonable. Firstly, changes can be detected, secondly, factors influencing C storage can be deter-
mined and finally, efforts in forest management promoting C storage can be adapted respective-

Conclusion
Carbon stocks in Danish forest types 53
ly. The C trading might give incentives to developing countries, where the main deforestation
occurs, to make more efforts to maintain and expand their forests. In comparison to the world’s
temperate forest C stock, the study results indicate a higher C accumulation in Danish forests. A
combination of a further extension of Denmark’s forest area with efforts to increase the existing
C stock is not only beneficial for the nation’s GHG balance but also for the world in general.
The overall expectation that, at least in temperate forests, two-thirds of the total C stock is
located in the soil could be confirmed in this study. The most significant variables on the total C
stock are mainly those affecting biomass volume (stand age and crown cover) and its
composition (different lignin and hardwood content of different tree species). Moreover, a
significant effect on the total C pool can be attributed to the soil category. As assumed, the effect
of soil category on C accumulation in biomass displays the impact of tree species. In contrast to
the general observations this study showed that broadleaf forests have a bigger C stock than
conifer forests. This, however, might be attributed to an uneven distribution of forest types on
soil categories or to the fact that conifer forest stands were in this study generally younger than
broadleaved stands. Other factors influencing the biomass C stock might derive from the
industry and market prices for wood.
The result for dead wood C pool is not representative since there were too less samples. Besides,
the age and the previous land use is determining the forest floor C stock. This indicates a high
potential in the overall forest floor C stock to show a net increase in the future, provided that the
forest area/ average stand age also increases. The assumption that the PLU also significantly
influences soil C stock is not confirmed. However, not only the soil category but also the tree
species category affect the soil C stock. On the whole, both the dead wood C stock and the soil C
stock are influenced by forest management strategies.
All in all, this study gives a broad overview about the C content in Danish forests as well as about
some selected influencing factors. In order to estimate the influence of single tree species, a
study area with forests dominated by the respective specie has to be set up. The comparison of
forest C inventories in general, is only possible if the sampling design is the same. Moreover, the
utilization of this explanatory model as a predictive model for absolute and relative C stocks is
subject to restrictions. The application in other countries and under site conditions different to
this study has to be further examined. Finally, the extend to which forests can store C is mostly
unknown. At some point the C sinks might be saturated and enter a state of equilibrium.

Acknowledgement
Carbon stocks in Danish forest types 54
Acknowledgement
At the end of this work, I would like to thank my supervisors Inge Stupak Møller, Lars Vesterdal
and Erik Karltun for their endless support and stimulating discussions. It has been a great pleas-
ure to work at your department. I am grateful to Petros who helped me among others to get ac-
quainted with SASSASASASAS and thank you for not running away. Many thanks also to Sebas-
tian. Your contributions to my statistical knowledge were of great importance for me. Moreover,
I express my thanks to all my friends for the moral support, especially to Ludo who knows when
it is time for a “forest floor” tea. Furthermore, it has been a great help of Daniel, my sister and my
boyfriend who - more or less - volunteered in trying to spot even the very last error or spelling
mistake. Thank you, Pol, for listening, for arguing, for comforting me, for encouraging me … basi-
cally for bearing me during this time and just being there. Merci! Last but not least, special
thanks to my parents for their never ending support and for making it possible to do my Masters
programme abroad.

References
Carbon stocks in Danish forest types 55
References
Amin, H., Tyson Atkins, P., Russo, R.S., Brown, A.W, Sive, B., Gannet Hallar, A., Huff Hartz, K.E., 2012. Effect of Bark Beetle Infestation on Secondary Organic Aerosol Precursor Emissions. Environmental Science & Technology, 46(11), pp.5696-5703.
Anon, 2010. Land use (Denmark). EEA. Available at: http://www.eea.europa.eu/soer/countries/dk/soertopic_view?topic=land [Accessed May 21, 2012].
Apps, M. & Price, D.T. eds., 1996. Forest Ecosystems, Forest Management and the Global Carbon Cycle, NATO ASI Series, Vol.I 40, Springer-Verlag Berlin Heidelberg.
Baritz, R., Seufert , G., Montanarella, L., Van Ranst, E., 2010. Carbon concentrations and stocks in forest soils of Europe. Forest Ecology and Management, 260(3), pp.262-277. Available at: http://linkinghub.elsevier.com/retrieve/pii/S0378112710001787 [Accessed March 16, 2012].
Bowden, R.D., Rullo, G., Stevens, G.R., Steudler, P.A., 2000. Soil Fluxes of Carbon Dioxide, Nitrous Oxide, and Methane at a Productive Temperate Deciduous Forest. Journal of Environmental Quality, 29(1), pp.268-276.
Bradford, J.B., Smith, M.L., Kolka, R., Birdsey, R., Ollinger, S., Ryan, M., 2010. Carbon pools and fluxes in small temperate forest landscapes: Variability and implications for sampling design. Forest Ecology and Management, 259, pp.1245-1254.
Bradshaw, R., Holmqvist, B.H. & Danish, B.H., 1999. Danish forest development during the last 3000 years reconstructed from regional pollen data. Ecography, 22, No.1, pp.pp.53-62.
Breshears, D.D., Huxman, T., Adams, H., Zou, C., Davison, J., 2008. Vegetation synchronously leans upslope as climate warms. PNAS, 105(33), pp.11591-11592.
Brown, S., 2002. Measuring carbon in forests: current status and future challenges. Environmental Pollution, 116(116), pp.363-372.
Cappelen, J., 2011. DMI Annual Climate Data Collection 1873-2010, Denmark, The Faroe Islands and Greenland - with graphics and Danish summary, Available at: www.dmi.dk/dmi/tr11-04.
Carroll, M., Milakovsky, B., Finkral, A., Evans, A., Ashton, M., 2012. Managing Carbon Sequestra-tion and Storage in Temperate and Boreal Forests. In M. S. Ashton et al., eds. Ashton, M. Tyr-rell, M. Spalding, D. Gentry, B. Managing Forest Carbon in a Changing Climate. Dordrecht: Springer Netherlands, pp. 205-226. Available at: http://www.springerlink.com/index/10.1007/978-94-007-2232-3 [Accessed March 27, 2012].
Ceulemans, R. & Mousseau, M., 1994. Tansley Review No.71. Effects of elevated atmospheric CO2 on woody plants. New Phytologist, 127, pp.425-446.
Christensen, H.H. & Iversen, P.A., 2004. National Report to the Fifth Session of the United Nations Forum on Forests Denmark, Denmark.

References
Carbon stocks in Danish forest types 56
Christensen, M., Hahn, K., Mountford, E.P., Wijdeven, S.M., Manning, D.B., Standovar, T., Odor, P., Rozenbergar, D., 2003. A study on deadwood in European beech forest reserves, Work-package 2 in the Nat-Man project (Nature-based management of beech in Europe) funded by the European Community 5th Framework Programme.
Coder, K.D., 1998. Soil Constraints On Root Growth. In Tree Root Growth Control Series. The Uni-versity of Georgia. Available at: http://warnell.forestry.uga.edu/service/library/for98-010/for98-010.pdf [Accessed June 5, 2012].
CRFR, Campbell River Forest Research Ltd., Carbon and Forests. Available at: http://crfr.ca/samples/carbon/index.html [Accessed June 3, 2012].
Crown, P., 2005. The Influence of Soils and Species on Tree Root Depth. Forestry Comission (www.forestry.gov.uk).
Currie, W.S., Yanai, R., Piatek, K., Prescott, C., Goodale, C., 2003. Processes Affecting Carbon Stor-age in the Forest Floor and in Downed Woody Debris. In in Kimble, J.M. et al., Eds., The Poten-tial for U.S. Forests to Sequester Carbon and Mitigate the Greenhouse Effect. Lewis, Boca Ra-ton, FL, pp. 135-147.
Dixon, R.K., Brown, S., Houghton, R.A., Solomon, A.M., Trexler, M.C., Wisniewski, J., 1994. Carbon Pools and Flux of Global Forest Ecosystems. Science, 263, pp.185-190.
Eggertsson, O., Nygaard, P.H. & Skovsgaard, J.P., History of afforestation in the Nordic countries. Available at: http://www.skogoglandskap.no/filearchive/history_afforestation_nordic_countries.pdf [Accessed April 23, 2012].
Eppley, R.W., Renger, E.H. & Betzer†, P.R., 1983. The residence time of particulate organic carbon in the surface layer of the ocean. Elsevier Ltd., 30(3), pp.311-323.
Ericsson, T., Rytter, L. & Vapaavuori, E., 1996. Physiology of carbon allocation in trees. Biomass and Bioenergy, 11(2-3), pp.115-127.
European Forest Institute (EFI), FLEGT. Available at: http://www.euflegt.efi.int/portal/ [Ac-cessed May 15, 2012].
FAO, Food and Agriculture Organization of the United Nations, 2010. Forest global resource as-sessment, Rome.
FAO, Food and Agriculture Organization of the United Nations, 2012. Forests and Climate Change Working Paper 10 Forest Management and Climate Change : a literature review, Rome.
FAO, Food and Agriculture Organization of the United Nations, 2011. State of the World’s Forests, Rome: Food and Agirculture Organization of the United Nations (FAO). Available at: http://www.fao.org/docrep/013/i2000e/i2000e00.htm [Accessed June 5, 2012].
FAO, UNDP & UNEP, 2008. UN Collaborative Programme on Reducing Emissions from Deforesta-tion and Forest Degradation in Developing Countries (UN-REDD),
Fischlin, A., 1996. Conflicting objectives while maximising carbon sequestration by forests. In Apps, M., Price, D. 1996. Forest Ecosystems, Forest Management and the Global Carbon Cycle. NATO ASI Series, Vol.I 40, Springer-Verlag Berlin Heidelberg.

References
Carbon stocks in Danish forest types 57
FRA, Forest Resources Assessment Programme., 2010. Global Forest Resources Assessment 2010 - Country Report Denmark. Rome.
Geological Survey of Denmark and Greenland (GEUS), 2008. Digital National Soil Map, 1:25.000. Danish Ministry of the Environment, Copenhagen, Denmark.
Gorte, R.W., 2009. Carbon Sequestration in Forests. Congressional Research Service 7-5700. RL31432. Available at: http://www.fas.org/sgp/crs/misc/RL31432.pdf [Accessed June 25, 2012].
Grace, J., 2004. Understanding and managing the global carbon cycle. Journal of Ecology, 92(2), pp.189-202.
Gravesen, P., Larsen, K., Klitten, K., Kelstrup, N., Krüger, H., 2004. Geologi og grundvand Regis-treringsblad, København.
Hansen, J.E., Ruedy, R., Sato, M., Lo, K., 2012. NASA GISS Surface Temperature (GISTEMP) Analysis. In Trends: A Compendium of Data on Global Change., Tenn., U.S.A. Available at: http://cdiac.ornl.gov/trends/temp/hansen/hansen.html [Accessed June 1, 2012].
Horwath, W., 2007. Carbon Cycling and Formation of Soil Organic Matter. In Paul, E. 2007. Soil Microbiolog, Ecology and Biogeochemistry. Elsevier Inc. Acadamic Press, pp. 303-339.
Hougthon, R.A., 2008. Carbon Flux to the Atmosphere from Land-Use Changes: 1850-2005. In TRENDS: A Compendium of Data on Global Change., Tenn., U.S.A.
IPCC, 2007a. Climate Change 2007: Impacts, Adaptation and Vulnerability. Contribution of Work-ing Group II to the Fourth Assessment Report of the Intergovernmental Panel on Climate Change. [M.L. Parry, O.F. Canziani, J.P. Palutikof, P.J. van der Linden and C.E. Hanson, Eds.], Cambridge University Press, Cambridge, UK, 976 pp.
IPCC, 2007b. Climate Change 2007: The Physical Science Basis. Contribution of Working Group I to the Fourth Assessment Report of the Intergovernmental Panel on Climate Change [ S. Solomon, D. Qin, M. Manning, Z. Chen, M. Marquis, K.B. Averyt, M. Tignor and H.L. Miller, Eds.] Cambridge University Press, Cambridge, United Kingdom and New York, Ny, USA, 996 pp.
IPCC, 2000. IPCC Special report - Land Use , Land-Use Change , and Forestry - Summary for Policy-makers, Available at: http://www.ipcc.ch/pdf/special-reports/spm/srl-en.pdf [Accessed June 1, 2012].
Jandl, R., Lindner, M., Vesterdal, L., Bauwens, B., Baritz, R., Hagedorn, F., Johnson, D.W., Mink-kinen, K., Byrne, K.A., 2007. How strongly can forest management influence soil carbon se-questration? Geoderma, 137, pp.253-268.
Jia, S. & Akiyama, T., 2005. A precise, unified method for estimating carbon storage in cool-temperate deciduous forest ecosystems. Agricultural and Forest Meteorology, 134, pp.70-80.
Karjalainen, T. , Lisiki, J., Nabuurs, G-J., Erhards, M., Eggers, T., Sonntag, M., Mohren, G.M.J., 2002. An approach towards an estimate of the impact of forest management and climate change on the European forest sector carbon budget: Germany as a case study. Forest Ecology and Man-agement 2, 162, pp.87-103.

References
Carbon stocks in Danish forest types 58
Keeling, R.F. et al., 2009. Atmospheric CO2 Records from Sites in the SIO Air Sampling Network - In Trends: A Compendium of Data on Global Change., Tenn., U.S.A. Available at: http://cdiac.ornl.gov/trends/co2/sio-mlo.html [Accessed May 7, 2012].
Krogh, L. & Greve, M.H., 2006. Evaluation of World Reference Base for Soil Resources and FAO Soil Map of the World using nationwide grid soil data from Denmark. Soil Use and Management, 15(3), pp.157-166. Available at: http://doi.wiley.com/10.1111/j.1475-2743.1999.tb00082.x [Accessed May 1, 2012].
Körner, C., 2004. Through enhanced tree dynamics carbon dioxide enrichment may cause tropical forests to lose carbon. Philos. Trans. R. Soc. London Ser. B,, 359, pp.493-498.
Körner, C., 2003. Carbon limitation in trees. Journal of Ecology, 91, pp.4-17.
Lal, R., 2005. Forest soils and carbon sequestration. Forest Ecology and Management, 220, pp.242-258.
Lensing, J.R. & Wise, D.H., 2007. Impact of changes in rainfall amounts predicted by climate-change models on decomposition in a deciduous forest. Applied Soil Ecology, 35(3), pp.523-534.
Levin, G. & Normander, B., 2008. Arealanvendelse i Danmark siden slutningen af 1800-tallet, Available at: http://www.dmu.dk/Pub/FR682.pdf [Accessed April 17, 2012].
Lindner, M., Maroschek, M., Netherer, S., Kremer, A., Barbati, A., Garcia-Gonzalo, J., Seidl, R., Del-zon, S., Corona, P., Kolström, M., Lexer, M., Marchetti, M., 2010. Climate change impacts, adaptive capacity, and vulnerability to European forest ecosystems. Forest Ecology and Man-agement, 259, pp.698-709.
Lindner, M., Garcia-Gonzalo, J., Kolström, M., Green, T., Reguera, R., Maroschek, M., Seidl, R., Lex-er, M., Netherer, S., Schopf, A., Kremer, A., Delzon, S., 2008. Impacts of Climate Change on Eu-ropean Forests and Options for Adaptation, AGRI-2007-G4-06 Report to the European Com-mission Directorate-General for Agriculture and Rural Development.
Lombardi, F., Lasserre, B., Tognetti, R., Marchetti, M., 2008. Deadwood in Relation to Stand Mangement and Forest Type in Central Apennines (Molise, Italy). Ecosystems, 11, pp.882-894.
Lorenz, K. & Lal, R., 2010. Carbon Sequestration in Forest Ecosystems, Dordrecht: Springer Neth-erlands. Available at: http://www.springerlink.com/index/10.1007/978-90-481-3266-9 [Accessed May 18, 2012].
Lucier, A., Ayres, M., Karnosky, D., Thompson, I., Loehle, C., Percy, K., Sohngen, B., 2009. Forest responses and vulnerabilities to recent climate change. In Seppala, R., Buck, A. & Katila, P. 2009. Adaptation of forests and people to climate change. IUFRO World Series 22.
Luo, Y., Su, B.O., Currie, W., Dukes, J., Finzi, A., Hartwig, U., Hungate, B., Murtrie, R., Oren, R.A.M., Parton, W., Pataki, D., Shaw, M.R., Zak, D., Field, C., 2004. Progressive Nitrogen Limitation of Ecosystem Responses to Rising Atmospheric Carbon Dioxide. BioScience, 54(8), pp.731-739.
Lutz, M., Dunbar, R. & Caldeira, K., 2002. Regional variability in the vertical flux of particulate or-ganic carbon in the ocean interior. Global Biogeochemical Cycles, 16(3)(1037).

References
Carbon stocks in Danish forest types 59
Madsen, S.F., 1987. Vedmassefunktioner for nogle vigtige danske skovtrærter. Det Forstlige For-søgsvæsen 40, 47-242.
Madsen, S.F., Heusèrr, M., 1993. Volume and stem taper functions for Norway spruce. Forest and Landscape Research 1, 51-78.
Magnani, F., Mencuccin, M., Borghetti, M., Berbigier, P., Berninger, F., Delzon, S., Grelle, A., Hari, P., Jarvis, P.G., Kolari, P., Kowalski, A.S., Lankreijer, H., Law, B.E., Lindroth, A., Loustau, D., Mana, G., Moncrieff, J.B., Rayment, M., Tedeschi, V., Valentini, R., Grace, J., 2007. The human foot-print in the carbon cycle of temperate and boreal forests. Nature, 447, pp.849-851.
Malhi, Y., 2002. Carbon in the atmosphere and terrestrial biosphere in the 21st century. Philosoph-ical transactions. Series A, Mathematical, physical, and engineering sciences, 360(1801), pp.2925-45. Available at: http://www.ncbi.nlm.nih.gov/pubmed/12626274 [Accessed May 18, 2012].
Malhi, Y., Baldocchi, D.D. & Jarvis, P.G., 1999. The carbon balance of tropical, temperate and boreal forests. Plant, Cell and Environment, 22(6), pp.715-740. Available at: http://doi.wiley.com/10.1046/j.1365-3040.1999.00453.x [Accessed May 18, 2012].
Malhi, Y. & Wright, J., 2004. Spatial patterns and recent trends in the climate of tropical rainforest regions. Philos. Trans. R. Soc. London Ser. B, 359.
Meier-Reimer, E. & Hasselmann, K., 1987. Transport and storage of CO2 in the ocean - an inorgan-ic ocean-circulation carbon cycle model. Climate Dynamics, 2, pp.63-90.
Melillo, J.M., McGuire, A.D., Kicklighter, D.W., Moore, B., Vorosmarty, C.J., Schloss, A.L., 1993. Global climate change and terrestrial net primary production. Nature, 363, pp.234-240.
Mäkipaä, R., Lehtonen, A. & Peltoniemi, M., 2008. Monitoring Carbon Stock Changes in European Forests Using Forest Inventory Data. In A. J. Dolman, A. Freibauer, & R. Valentini, eds. The Continental-Scale Greenhouse Gas Balance of Eurpe. New York, USA: Springer Science + Business Media, LLC.
NOAA-Research, 2012. Earth System Resear Laboratory-Global monitoring division. Available at: http://www.esrl.noaa.gov/gmd/ccgg/trends/weekly.html [Accessed April 19, 2012].
Nieder, R. & Benbi, D.K., 2008. Carbon and Nitrogen in the Terrestrial Environment, Springer Sci-ence + Business Media B.V.
Nielsen, O.-K., Mikkelsen, M.H., Hoffmann, L., Gyldenkærne, S., Winther, M., Nielsen, M., Fauser, P., Thomsen, M., Plejdrup, M.S., Albrektsen, R., Hjelgaard, K., Bruun, H.G., Johannsen, V.K., Nord-Larsen, T., Bastrup-Birk, A., Vesterdal, L., Møller, I.S., Rasmussen, E., Arfaoui, K., Baunbæk, L., Hanse, M.G., 2011. Denmark’s National Inventory Report 2011 - Emission inventories 1990-2009 - Submitted under the United Nations Framework Convention on Climate Change and the Kyoto Protocol. National Environmental Research Institute University of Aarhus - Denmark. Available at: http://www2.dmu.dk/pub/fr827.pdf [Accessed May 29, 2012].
Norby, R.J., Wullschleger, S.D., Gunderson, C.A., Johnson, D.W., Ceulemans, R., 1999. Tree respons-es to rising CO 2 in field experiments : implications for the future forest. Plant, Cell and Envi-ronment, 22, pp.683-714.
Nord-Larsen, T., Johannsen, V.K., Jørgensen, B.B., Bastrup-Birk, A., 2008. Skove og plantager 2006. Skov & Landskab, Hørsholm, p.185 s. ill.

References
Carbon stocks in Danish forest types 60
Nord-Larsen, T., Bastrup-Birken, A., Thomsen, I., Jørgensen, B.B., Johannsen, V.K., 2010. Skove og plantager 2009, Hørsholm.
Omogyi, Z.S. & Reudenschuss, A.F., 2010. Reporting soil carbon stock change information under the UNFCCC and its Kyoto Protocol - how to overcome difficulties ? In Greenhouse-gas budget of soils under changing cliate and land use (BurnOut) COST 639. Available at: http://bfw.ac.at/010/pdf/Act_639/Z-SOMOGYI.pdf [Accessed April 30, 2012].
Pan, Y., Birdsey, R., Jingyun, F., Houghton, R., Kauppi, P., Kurz, W., Phillips, O., Shvidenko, A., Lew-is, S., Cnadell, J., Ciais, P., Jackson, R., Pacala, S., McGuire, A., Piao, S., Rautiainen, A., Sitch, S., Hayes, D., 2011. A Large and Persistent Carbon Sink in the World’S Forests. Science, 333(6045).
Penne, C., Ahrends, B., Deurer, M., Böttcher, J., 2010. The impact of canopy structure on the spatial variability in forest floor carbon stocks. Geoderma, 158, pp.282-297.
Picon, C., Guehl, J.M. & Aussenac, G., 1996. Growth dynamics, transpiration and water-use efficien-cy in Quercus robur plants submitted to elevated CO2 and drought. Ann Sci For, 53, pp.431-446.
Quinn, G.P. & Keough, M.J., 2002. Experimental Design and Data Analysis for Biologists, United States of America: Cambridge University Press, New York.
Raich, J.W. & Nadelhoffer, K.J., 1989. Belowground carbon allocation in forest ecosystems: global trends. Ecology, 70(5), pp.1346-1354.
Rennenberg, H., Loreto, F., Polle, A., Brilli, F., Fares, S., Beniwal, R.S., Gessler, A., 2006. Physiologi-cal Responses of Forest Trees to Heat and Drought. Plant Biology, 8(5), pp.556-571.
Rodeghiero, M., Tonolli, S., Vescovo, L., Gianelle, D., Cescatti, A., Sottocornola, M., 2010. INFO-CARB: A regional scale forest carbon inventory (Provincia Autonoma di Trento, Southern Ital-ian Alps). Forest Ecology and Management, 259, pp.1093-1101.
SAS Institute Inc. a, SAS 9.2 software. @2002-2008
SAS Institute Inc., 2009b. SAS/STAT - User’s Guide, Second Edition. Cary, NC, USA. Available at: http://support.sas.com/documentation/cdl/en/statug/63033/PDF/default/statug.pdf [Accessed July 30, 2012].
SAS Institute Inc., The GLMSELECT procedure (Experimental), Available at: http://support.sas.com/rnd/app/papers/glmselect.pdf [Accessed July 29, 2012].
Sedjo, R. & Sohngen, B., 1998. Impacts of Climate Change on Forests. RFF Climate Issue Brief #9 Resources for the future. Washington, DC
Silver, W.L. & Miya, R.K., 2001. Global patterns in root decomposition : comparisons of climate and litter quality effects. Oecologia, 129, pp.407-419.
Stephens, B.B., Gurney, K., Tans, P., Sweeney, C., Peters, W., Bruhwiler, L., Ciais, P., Ramonet, M., Bousquet, P., Nakazawa, T., Aoki, S., Machida, T., Inoue, G., Vinnichenko, N., Llyod, J., Jordan, A., Heimann, M., Shibistova, O., Langenfelds, R., Steele, L., Francey, R., Scott, D., 2007. Weak Northern and Strong Tropical Land Carbon Uptake from Vertical Profiles of Atmospheric CO2. Science, 316(5832), pp.1732-1735.

References
Carbon stocks in Danish forest types 61
Steward, R. & Maini, J., 1996. Forests and global carbon management: a policy perspective. In Apps, M., Price, D. 1996. Forest Ecosystems, Forest Management and the Global Carbon Cycle. NATO ASI Series, Vol.I 40, Springer-Verlag Berlin Heidelberg.
Sverrild, K., Vesterdal, L., Møller, I.S., Heiser, K., 2009. Sample preparation procedures for the pro-ject ”Inventory of art. 3.4 forest soils”. (not published).
Thuiller, W., Lavorel, S., Sykes, M., Araújo, M., 2006. Using niche-based modelling to assess the impact of climate change on tree functional diversity in Europe. Diversity and Distributions, 12, pp.49-60.
Townsend, A. & Rastetter, E., 1996. Nutrient constrains on carbon storage in forested ecosystems. In Apps, M., Price, D. 1996. Forest Ecosystems, Forest Management and the Global Carbon Cy-cle. NATO ASI Series, Vol.I 40, Springer-Verlag Berlin Heidelberg.
Tyrrell, M.L., Ross, J. & Kelty, M., 2012. Carbon Dynamics in the Temperate Forest. In M. S. Ashton et al., eds. Ashton, M. Tyrrell, M. Spalding, D. Gentry, B. Managing Forest Carbon in a Changing Climate. Dordrecht: Springer Netherlands, p. 414. Available at: http://www.springerlink.com/index/10.1007/978-94-007-2232-3 [Accessed March 27, 2012].
U.S. Environmental Protection Agency, 2011. Inventory of U.S. Greenhouse Gas Emissions and Sinks: 1990-2009, Washington, DC (USA). Available at: http://www.epa.gov/climatechange/Downloads/ghgemissions/US-GHG-Inventory-2011-Complete_Report.pdf [Accessed August 2, 2012].
UNECE, Terms and definitions applied in the UN-ECE/FAO Temperate and Boreal Forest Re-source Assessment 2000. Available at: http://www.unece.org/forests/fra/definit.html#Forest [Accessed June 23, 2012].
UNEP, UNEMG & GRID-Arendal, 2008. Kick The Habit - A UN guide to climate neutrality [Kirby, Alex]. Available at: http://www.unep.org/publications/ebooks/kick-the-habit/pdfs/1-2.Foreword.pdf [Accessed August 1, 2012]
UNFCCC, Clean Development Mechanism. Available at: http://cdm.unfccc.int/about/index.html [Accessed May 15, 2012a].
UNFCCC, Feeling the Heat: Climate Science and the Basis of the Convention. UNFCCC. Available at: http://unfccc.int/essential_background/the_science/items/6064.php [Accessed May 21, 2012b].
UNFCCC, GHG data from UNFCCC. Available at: http://unfccc.int/ghg_data/ghg_data_unfccc/items/4146.php [Accessed May 10, 2012c].
UNFCCC, 2002a. Marrakesh Protocol - Part two. In UNFCCC, pp. 1-69.
UNFCCC, 2002b. UNITED AGREEMENT BETWEEN THE EUROPEAN COMMUNITY AND ITS MEMBER STATES. In Conference of the Parties. UNFCCC.
United Nations, 1998. KYOTO PROTOCOL TO THE UNITED NATIONS FRAMEWORK.
United Nations, Kyoto Protocol. UNFCCC. Available at: http://unfccc.int/kyoto_protocol/items/3145.php [Accessed May 21, 2012].
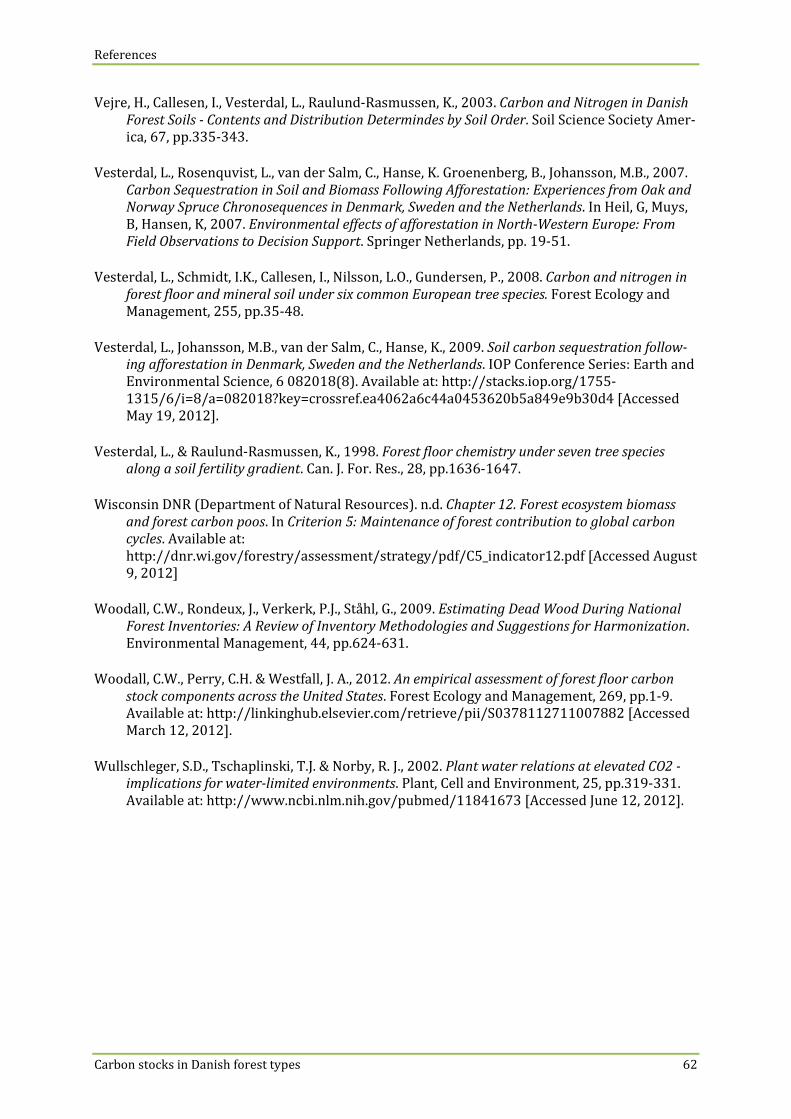
References
Carbon stocks in Danish forest types 62
Vejre, H., Callesen, I., Vesterdal, L., Raulund-Rasmussen, K., 2003. Carbon and Nitrogen in Danish Forest Soils - Contents and Distribution Determindes by Soil Order. Soil Science Society Amer-ica, 67, pp.335-343.
Vesterdal, L., Rosenquvist, L., van der Salm, C., Hanse, K. Groenenberg, B., Johansson, M.B., 2007. Carbon Sequestration in Soil and Biomass Following Afforestation: Experiences from Oak and Norway Spruce Chronosequences in Denmark, Sweden and the Netherlands. In Heil, G, Muys, B, Hansen, K, 2007. Environmental effects of afforestation in North-Western Europe: From Field Observations to Decision Support. Springer Netherlands, pp. 19-51.
Vesterdal, L., Schmidt, I.K., Callesen, I., Nilsson, L.O., Gundersen, P., 2008. Carbon and nitrogen in forest floor and mineral soil under six common European tree species. Forest Ecology and Management, 255, pp.35-48.
Vesterdal, L., Johansson, M.B., van der Salm, C., Hanse, K., 2009. Soil carbon sequestration follow-ing afforestation in Denmark, Sweden and the Netherlands. IOP Conference Series: Earth and Environmental Science, 6 082018(8). Available at: http://stacks.iop.org/1755-1315/6/i=8/a=082018?key=crossref.ea4062a6c44a0453620b5a849e9b30d4 [Accessed May 19, 2012].
Vesterdal, L., & Raulund-Rasmussen, K., 1998. Forest floor chemistry under seven tree species along a soil fertility gradient. Can. J. For. Res., 28, pp.1636-1647.
Wisconsin DNR (Department of Natural Resources). n.d. Chapter 12. Forest ecosystem biomass and forest carbon poos. In Criterion 5: Maintenance of forest contribution to global carbon cycles. Available at: http://dnr.wi.gov/forestry/assessment/strategy/pdf/C5_indicator12.pdf [Accessed August 9, 2012]
Woodall, C.W., Rondeux, J., Verkerk, P.J., Ståhl, G., 2009. Estimating Dead Wood During National Forest Inventories: A Review of Inventory Methodologies and Suggestions for Harmonization. Environmental Management, 44, pp.624-631.
Woodall, C.W., Perry, C.H. & Westfall, J. A., 2012. An empirical assessment of forest floor carbon stock components across the United States. Forest Ecology and Management, 269, pp.1-9. Available at: http://linkinghub.elsevier.com/retrieve/pii/S0378112711007882 [Accessed March 12, 2012].
Wullschleger, S.D., Tschaplinski, T.J. & Norby, R. J., 2002. Plant water relations at elevated CO2 - implications for water-limited environments. Plant, Cell and Environment, 25, pp.319-331. Available at: http://www.ncbi.nlm.nih.gov/pubmed/11841673 [Accessed June 12, 2012].

Appendix
Carbon stocks in Danish forest types 63
Appendix
Appendix I: List of Variables and Measurement Units
Tab. 25. List of variables (Variables, Abbreviation, Description, Unit)
Variable Description Unit
PSU 5000 primary sampling units located in a 2x2
km grid, out of which 277 sampling plots have
been randomly collected.
-
SSU A, C, E, G Secondary sampling plots, with a forest cover
of >50%.
-
TSU 1, 2, … SSU plot that has further been subdivided due
to different land uses or tree species.
-
Sampling Year 2007-2011 The year a plot was sampled. (year)
Total Carbon
Stock
Adding up biomass, dead wood, forest floor
and mineral soil carbon.
t ha-1
Biomass Carbon Amount of carbon above- and belowground. t ha-1
Dead Wood Car-
bon
Amount of carbon stored in dead wood. t ha-1
Forest Floor Car-
bon
Amount of carbon stored in forest floor. t ha-1
Mineral Soil Car-
bon
Amount of carbon stored in mineral soil. t ha-1
Soil category The type of soil. The description of the soil has
been made according to the GEUS_25 soil map.
As the GEUS_25 only has coverage of 85% of
Denmark’s land area, the GEUS_200 map has
been used for missing data.
(Category)
Loamy Soil types with the code:
• DL ML (GEUS_25); Marine deposits of sand and clay (→“Marint sand og ler”),
• Clayey till (→“Moræneler”), Glacioflu-vial deposits of clay (→“Smeltevandsler”) (GEUS_200).
Organic Soil types with the code:
• FP FT (GEUS_25); • Freshwater sediments
(→“Ferskvandsdannelser”) or Marsh

Appendix
Carbon stocks in Danish forest types 64
(→"Marsk") (GEUS_200).
Sandy Soil types with the code:
• ES HS TG TS TS-TG YS S DG DS MG MS (GEUS_25);
• Extra-marginal deposits (→”Extramarginale aflejringer"), Glaciofluvial deposits of sand and gravel (→"Smeltevandssand og -grus"), Sandy-gravelly till (→"Morænesand og grus"), Prequa-ternary (→"Prækvartær"), Older ma-rine sediments (→"Ældre hava-flejringer"), Drifting sand (→"Flyvesand") (GEUS_200).
Single Tree Spe-
cies
Dominant tree species in each sampling plot.
• Ash, Beech, Fir, Larch, Nordmann Fir,
Norway Spruce, Oak, Pine, Sitka spruce
(Category)
Tree Species Cat-
egory
Dominant tree category in each sampling plot. (Category)
Conifer Conifer forest if >75 % dominance.
Broadleaf Broadleaf forest if >75 % dominance.
Mixed Mixed broadleaf and conifer forest if <75 %
dominance.
Temporar-
ily un-
stocked
No trees, but still part of a forest or trees with
DBH < 1.3m.
PLU Previous land use (i.e. land use in 1990). (Category)
FRF Forest remaining forest.
AFF Afforestation since 1990.
Stand Age Average age of trees in each sampling plot. (year)
Crown cover Proportion of canopy in each sampling plot. %
Broadleaf frac-
tion
Proportion of deciduous trees in each sam-
pling plot.
%
Biodiversity Measurement of biological diversity, using the
Simpson index.
(Index)

Appendix
Carbon stocks in Danish forest types 65
Precipitation The annual mean precipitation (one value for
the years 2001 to 2010).
mm
Appendix II: Basic statistics for relative C stocks
Tab. 26. Basic statistics for relative carbon stocks.
Appendix III: Distribution of total C stock to single tree species
Tab. 27. Basic statistics of total carbon stocks distributed to single tree species
TOTAL C (t ha-1)
LSMean 95% confidence limit
Ash 317 242 414
Beech 284 246 329
Fir 308 248 381
Larch 279 225 348
Nordmann
fir 265 199 352
Norway
spruce 272 236 313
Oak 252 21 296
Pine 220 188 258
Sitka
spruce 279 235 331
RELATIVE CARBON
STOCK
Number of plots
Mean Std.Err.
95% confidence limits min. max.
Biomass 267 27.41 1.05 25.34 29.48 0 73.53
Dead wood 277 0.38 0.06 0.27 0.5 0 8.19
Forest floor 277 6.63 0.46 5.73 7.53 0.22 44.02
Soil 277 66.56 1.11 64.37 68.75 23.47 99.78
lower | upper
lower | upper

Appendix
Carbon stocks in Danish forest types 66
Appendix IV: Original model result for absolute dead wood C stock
Tab. 28. Model results for dead wood carbon stock: significant effects influencing dead wood carbon stock,
loge-transformed (n=87).
FINAL MODEL:
LOGe DEAD WOOD C p-value r² parameter es-
timate
I intercept 1.796979696
A crown cover 0.0422 0.047647 -0.014591626
a = observed value for crown cover
Appendix V: Residual plots for total C stock and each absolute C pool
• Total Carbon Stock
stand age
0 20 40 60 80 100 120 140 160 180
Car
bon
(t h
a-1)
0
200
400
600
800
1000
soil type
Loamy Organic Sandy
resi
sual
s
-1.5
-1.0
-0.5
0.0
0.5
1.0
1.5
crown cover
0 20 40 60 80 100
resi
dual
s
-1.5
-1.0
-0.5
0.0
0.5
1.0
1.5
stand age
0 20 40 60 80 100 120 140 160 180
resi
dual
s
-1
0
1
2
3
4
5
0-24% crown cover25-49% crown cover50-74% crown cover75-89% crown cover90-100% crown cover
2 1
DeadWoodCarbon�I�a∙A
3 4

Appendix
Carbon stocks in Danish forest types 67
Broadleaf Conifer Mixed temp.unst
resi
dual
s
-1.5
-1.0
-0.5
0.0
0.5
1.0
1.5
crown cover
0 20 40 60 80 100
resi
dual
s
-1.5
-1.0
-0.5
0.0
0.5
1.0
1.5
broadleafconifermixedtemp. unst.
stand age
0 20 40 60 80 100 120 140 160 180
resi
dual
s
-1.5
-1.0
-0.5
0.0
0.5
1.0
1.5loamyorganicsandy
Fig. 16. Influences of each significant variable on total carbon stock after the effects of the variables before
have been removed. Shows how much is explained by the added variable on the X-axis. 1. effect: stand
age. 2. effect: soil category (here: the median, the interval of 25% to 75% (box) and minimum and maxi-
mum values are shown). 3. effect: crown cover. 4. effect: stand age*crown cover (classes). 5. Effect: tree
species category. 6. effect: interaction of crown cover * tree species category. 7. effect: interaction of
stand age and soil category.
stand age
0 20 40 60 80 100 120 140 160 180
Car
bon
(t h
a-1)
0
200
400
600
800
1000 broadleafconifermixedtemp. unst.
5 6
1
7
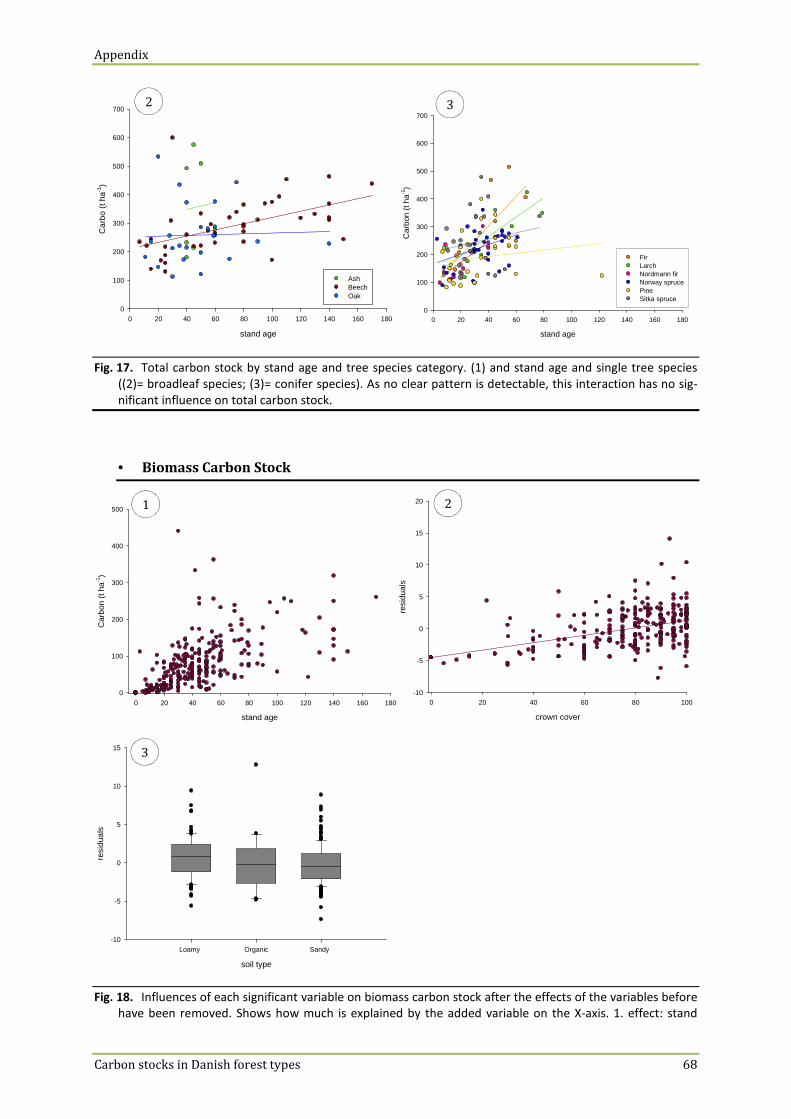
Appendix
Carbon stocks in Danish forest types 68
stand age
0 20 40 60 80 100 120 140 160 180
Car
bo (
t ha-1
)
0
100
200
300
400
500
600
700
AshBeechOak
stand age
0 20 40 60 80 100 120 140 160 180
Car
bon
(t h
a-1)
0
100
200
300
400
500
600
700
FirLarchNordmann firNorway sprucePineSitka spruce
Fig. 17. Total carbon stock by stand age and tree species category. (1) and stand age and single tree species
((2)= broadleaf species; (3)= conifer species). As no clear pattern is detectable, this interaction has no sig-
nificant influence on total carbon stock.
• Biomass Carbon Stock
stand age
0 20 40 60 80 100 120 140 160 180
Car
bon
(t h
a-1)
0
100
200
300
400
500
crown cover
0 20 40 60 80 100
resi
dual
s
-10
-5
0
5
10
15
20
soil type
Loamy Organic Sandy
resi
dual
s
-10
-5
0
5
10
15
Fig. 18. Influences of each significant variable on biomass carbon stock after the effects of the variables before
have been removed. Shows how much is explained by the added variable on the X-axis. 1. effect: stand
2 1
3
2 3

Appendix
Carbon stocks in Danish forest types 69
age. 2. effect: crown cover. 3. effect: soil category (here: the median, the interval of 25% to 75% (box) and
minimum and maximum values are shown).
• Forest Floor Carbon Stock
tree species category
Broadleaf Conifer Mixed temp.unst
Car
bon
(t h
a-1)
0
10
20
30
40
50
60
70
stand age
0 20 40 60 80 100 120 140 160 180
resi
dual
s
-5
-4
-3
-2
-1
0
1
2
3
precipitation
600 700 800 900 1000
resi
dual
s
-5
-4
-3
-2
-1
0
1
2
3
stand age
0 20 40 60 80 100 120 140 160 180
resi
dual
s
-4
-3
-2
-1
0
1
2
3
broadleafconifermixedtemp. unst.
plu
FRF AFF
resi
dual
s
-4
-3
-2
-1
0
1
2
3
Fig. 19. Influences of each significant variable on forest floor carbon stock after the effects of the variables
before have been removed. Shows how much is explained by the added variable on the X-axis. 1. effect:
tree species category. 2. effect: stand age. 3. effect: precipitation. 4. Effect: interaction of stand age * tree
1 2
3 4
5

Appendix
Carbon stocks in Danish forest types 70
species category. 5. effect: previous land use (here: the median, the interval of 25% to 75% (box) and min-
imum and maximum values are shown).
plu
FRF AFF
Car
bon
(t h
a-1)
0
20
40
60
80
Fig. 20. Distribution of forest floor carbon by previous land use (here: the median, the interval of 25% to 75%
(box) and minimum and maximum values are shown).
• Soil Carbon Stock
soil type
Loamy Organic Sandy
Car
bon
(t h
a-1)
0
100
200
300
400
500
600
700
800
tree species category
Broadleaf Conifer Mixed temp.unst
resi
dual
s
-2.0
-1.5
-1.0
-0.5
0.0
0.5
1.0
1.5
2.0
Fig. 21. Influences of each significant variable on soil carbon stock after the effects of the variables before
have been removed. Shows how much is explained by the added variable on the X-axis. 1. effect: soil cate-
gory. 2. effect: tree species category (here: the median, the interval of 25% to 75% (box) and minimum and
maximum values are shown).
1 2

Appendix
Carbon stocks in Danish forest types 71
soil type
Loamy Organic Sandy
Car
bon
(t h
a-1)
0
200
400
600
800
1000
Fig. 22. Distribution of total carbon by soil categories (bottom) (here: the median, the interval of 25% to 75%
(box) and minimum and maximum values are shown).
Appendix VI: Residual plots for each relative C pool
• Relative Biomass Carbon Stock
stand age
0 20 40 60 80 100 120 140 160 180
Rel
ativ
e C
arbo
n (%
)
0
20
40
60
80
crown cover
0 20 40 60 80 100
resi
dual
s
-6
-4
-2
0
2
4
6
Loamy Organic Sandy
resi
dual
s
-6
-4
-2
0
2
4
6
Broadleaf Conifer Mixed temp.unst
resi
dual
s
-4
-2
0
2
4
6
1 2
3 4

Appendix
Carbon stocks in Danish forest types 72
Fig. 23. Influences of each significant variable on relative biomass carbon stock after the effects of the varia-
bles before have been removed. Shows how much is explained by the added variable on the X-axis. 1. ef-
fect: stand age. 2. effect: crown cover. 3. effect: soil category (here: the median, the interval of 25% to 75%
(box) and minimum and maximum values are shown). 4. effect: tree species category.
• Relative Forest Floor Carbon Stock
Broadleaf Conifer Mixed temp.unst
Rel
ativ
e C
(%
)
0
10
20
30
40
50
precipitation
500 600 700 800 900 1000
resi
dual
s
-4
-3
-2
-1
0
1
2
3
4
stand age
0 20 40 60 80 100 120 140 160 180
resi
sdua
ls
-4
-3
-2
-1
0
1
2
3
FRF AFF
resi
dual
s
-4
-3
-2
-1
0
1
2
3
stand age
0 20 40 60 80 100 120 140 160 180
resi
dual
s
-4
-3
-2
-1
0
1
2
3
broadleafconifer mixed temp. unts.
Fig. 24. Influences of each significant variable on relative forest floor carbon stock after the effects of the vari-
ables before have been removed. Shows how much is explained by the added variable on the X-axis. 1. ef-
fect: tree species category (here: the median, the interval of 25% to 75% (box) and minimum and maxi-
1 2
3 4
5

Appendix
Carbon stocks in Danish forest types 73
mum values are shown). 2. effect: precipitation. 3. effect: stand age. 4. effect: PLU. 5. effect: stand
age*tree species category.
plu
FRF AFF
Rel
ativ
e C
arbo
n (%
)
0
10
20
30
40
50
Fig. 25. Distribution of relative forest floor carbon by previous land use (here: the median, the interval of 25%
to 75% (box) and minimum and maximum values are shown).
• Relative Soil Carbon Stock
stand age
0 20 40 60 80 100 120 140 160 180
Rel
ativ
e C
(%
)
0
20
40
60
80
100
crown cover
0 20 40 60 80 100
resi
dual
s
-4
-3
-2
-1
0
1
2
3
broadleaf fraction
0.0 0.2 0.4 0.6 0.8 1.0
resi
dual
s
-4
-3
-2
-1
0
1
2
3
Loamy Organic Sandy
resi
dual
s
-4
-3
-2
-1
0
1
2
3
1 2
3 4

Appendix
Carbon stocks in Danish forest types 74
biodiversity
1 2 3 4 5 6 7
resi
dual
s
-5
-4
-3
-2
-1
0
1
2
3
0-19 years 20-39 years 40-59 years60-79 years 80-99 years >= 100 years
Fig. 26. Influences of each significant variable on relative soil carbon stock after the effects of the variables
before have been removed. Shows how much is explained by the added variable on the X-axis. 1. effect:
stand age. 2. effect: crown cover. 3. effect: broadleaf fraction. 4. effect: soil category (here: the median,
the interval of 25% to 75% (box) and minimum and maximum values are shown). 5. effect: biodiversi-
ty*stand age (classes).
Appendix VII: Mean values for categorical variables for each carbon pool
Tab. 29. Basic statistics for total carbon stock; for each categorical variable.
TOTAL CARBON
STOCK (t ha-1)
Number of plots
Mean Std. Err.
95% confidence limits min. max.
Conifer 114 221 8.48 204 238 78.4 514
Broadleaf 110 344 16.3 311 376 103 941
Mixed 47 285 15.0 254 315 111 533
Temp. unst. 6 142 19.8 91.8 193 95.9 205
Loamy 82 288 16.0 256 320 98.1 942
Organic 23 482 28.7 422 541 293 728
Sandy 172 248 8.89 230 265 78.4 787
FRF
PLU
AFF
267 279 8.65 262 296 78.4 942
10 271 53.5 150 392 139 705
5
lower | upper

Appendix
Carbon stocks in Danish forest types 75
Tab. 30. Basic statistics for biomass carbon stock; for each categorical variable.
Tab. 31. Basic statistics for dead wood carbon stock; for each categorical variable.
BIOMASS CAR-
BON STOCK (t ha-1)
Number of plots
Mean Std. Err.
95% confidence limits min. max.
Conifer 109 65.9 5.86 54.2 77.5 0.48 362
Broadleaf 107 100 7.55 85.0 114 0.03 440
Mixed 45 84.6 8.34 67.8 101 1.89 222
Temp. unst. 6 0 0 - - 0 0
Loamy 80 104 8.26 88.0 121 0.03 362
Organic 22 81.9 19.5 41.3 122 3.41 440
Sandy 165 69.9 4.79 60.4 79.3 0 333
FRF
PLU
AFF
257 82.4 4.39 73.7 91.0 0 440
10 51.2 13.0 21.8 80.6 1.89 140
DEAD WOOD
CARBON STOCK (t ha-1)
Number of plots
Mean Std. Err.
95% confidence limits min. max.
Conifer 114 0.71 0.15 0.41 1.01 0 10.33
Broadleaf 110 1.55 0.39 0.77 2.32 0 22.7
Mixed 47 1.50 0.51 0.47 2.52 0 20.4
Temp. unst. 6 0 0 - - 0 0
Loamy 82 1.08 0.35 0.38 1.78 0 22.7
Organic 23 1.77 0.56 0.60 2.93 0 8.82
Sandy 172 1.12 0.24 0.64 1.60 0 21.1
FRF
PLU
AFF
267 1.17 0.20 0.79 1.56 0 22.7
10 0.81 0.44 0.19 1.80 0 4.32
lower | upper
lower | upper

Appendix
Carbon stocks in Danish forest types 76
Tab. 32. Basic statistics for forest floor carbon stock; for each categorical variable.
Tab. 33. Basic statistics for soil carbon stock; for each categorical variable.
FOREST FLOOR
CARBON STOCK (t ha-1)
Number of plots
Mean Std. Err.
95% confidence limits min. max.
Conifer 114 21.1 1.39 18.4 23.8 0.24 56.8
Broadleaf 110 8.34 0.89 6.56 10.1 1.16 54.4
Mixed 47 19.5 2.58 14,3 24.7 1.11 69.47
Temp. unst. 6 1.83 0.58 0.34 3.32 0.28 4.14
Loamy 82 8.26 0.86 6.54 9.98 1.11 34.9
Organic 23 12.3 2.29 7.59 17.1 1.75 36.40
Sandy 172 19.1 1.24 16.65 21.6 0.24 69.5
FRF
PLU
AFF
267 183 0.91 13.9 17.5 0.24 69.5
10 5.90 1.53 2.44 9.36 2.17 15.6
SOIL CARBON
STOCK (t ha-1)
Number of plots
Mean Std. Err.
95% confidence limits min. max.
Conifer 114 136 5.14 126 146 36.6 347
Broadleaf 110 237 15.9 206 268 74 698
Mixed 47 183 10.1 162 203 73.3 388
Temp. unst. 6 140 19.6 90.4 191 95.6 201
Loamy 82 177 13.0 151 203 96.7 698
Organic 23 390 35.4 316 463 145 675
Sandy 172 160 6.57 147 173 36.6 604
FRF
PLU
AFF
267 183 7.34 169 198 36.6 698
10 213 55.0 88.8 338 105 675
lower | upper
lower | upper

Appendix
Carbon stocks in Danish forest types 77
Appendix VIII: Soil types (GEUS_200 map and definition of soil type codes)
Fig. 27. Soil type classification in Denmark, according to the GEUS_200 map.
Tab. 34. Definition of Danish soil type codes.
Jord type Code Class DJF
Postglaciale aflejringer
Flyvesand ES
Sandy
Saltvandssand HS
Senglaciale aflejringer
Ferskvandsgrus TG Ferskvandssand TS Ferskvands snad og grus TS-TG
Saltvandssand YS
S Jordtype JB nr. Teksturdefinition
Glaciale aflejringer
Smeltevandsgrus DG 1 1 Grovsandet jord Smeltevandssand DS 2 2 Finsandet jord Morænegrus MG
3 3 Grov lerblandet sandjord
Morænesand MS 4 Fin lerblandet sandjord
Glaciale aflejringer
Loamy Soils
4 5 Grov sandblandet lerjord
Smeltevandsler DL 6 Fin sandblandet lerjord Moræneler ML 5 7 Lerjord

Appendix
Carbon stocks in Danish forest types 78
6 8 Svær lerjord 9 Meget svær lerjord
10 siltjord
Postglaciale aflejringer
Ferskvandsgytje FP Humic
7 11 Humus
Ferskvandstørv FT
Other 8 12 speciel jordtype