carbon isotope discrimination of c3 vegetation in central asian
TRANSCRIPT

Biogeosciences, 5, 913–924, 2008www.biogeosciences.net/5/913/2008/© Author(s) 2008. This work is distributed underthe Creative Commons Attribution 3.0 License.
Biogeosciences
Carbon isotope discrimination of C3 vegetation in Central Asiangrassland as related to long-term and short-term precipitationpatterns
M. H. O. M. Wittmer 1, K. Auerswald1, R. Tungalag2, Y. F. Bai3, R. Schaufele1, and H. Schnyder1
1Lehrstuhl fur Grunlandlehre, Technische Universitat Munchen, Am Hochanger 1, 85350 Freising-Weihenstephan, Germany2National University of Mongolia, Ikh surguulin gudalmj – 1, Baga toiruu, Sukhbataar district, Ulaanbaatar, Republic ofMongolia3Laboratory of Quantitative Vegetation Ecology, Institute of Botany, The Chinese Academy of Sciences, 20 Nanxincu,Xiangshan, Beijing, 100093, People’s Republic of China
Received: 18 January 2008 – Published in Biogeosciences Discuss.: 21 February 2008Revised: 9 May 2008 – Accepted: 21 May 2008 – Published: 11 June 2008
Abstract. The relationship between carbon isotope discrim-ination (131) of C3 vegetation and long-term (30 years) andshort-term (growing period) precipitation was investigated.Different species ofStipa, a dominant grass genus in the(semi-)arid Asian steppes, and other C3 species were col-lected along aridity gradients in Inner Mongolia in 2005 (11sites, 71 samples) and in the Republic of Mongolia in 2006(40 sites, 45 samples). The data set was expanded with pub-lished and unpublished data ofStipa and other C3 species(11 studies covering 8 years, including 64 observations ofStipa, and 103 observations of other C3 species) and C3community bulk-samples (11 samples). Weather data weregeostatistically interpolated for all sampling sites and years.131 of Stipafollowed different relationships for the individ-ual years when related to mean annual precipitation due tolarge anomalies between annual and long-term average pre-cipitation patterns. However, the131 response to rainfallconverged when the (long-term) mean annual precipitationwas replaced by year-specific mean daily precipitation dur-ing the growing period (P G). Remarkably, the131 -responseto (P G) for C3 species as a whole (including herbaceous di-cots, semi-shrubs and grasses) and also the C3 community-level response were virtually identical to that ofStipa. Therelation was also valid outside the geographical and climaticrange where it was developed, giving proof of its robustness.
Correspondence to:K. Auerswald([email protected])
1 Introduction
The Central Asian grassland is the largest continuous biomeof the world and includes the steppes of the Republic of Mon-golia (1.3 Mio km2 of a total land area of 1.6 Mio km2, Ker-ven et al., 1996) and of the Inner Mongolia autonomous re-gion (0.8 Mio km2 of a total land area of 1.2 Mio km2, Xiaoet al., 1995a and citations therein) of the People’s Republicof China. This region has a continental climate with mostof the rain falling from June to August. By far, the largestpart of this grassland is situated in arid and semiarid zones,and the amount and distribution of rainfall is a major fac-tor controlling vegetation composition, functioning and ser-vices, such as the quality and availability of herbage for graz-ing livestock (Xiao et al., 1995a and citations therein). TheCentral Asian grassland flora contains a large number of C4species (approx. 20% of the flora; mostly dicots; Pyankov etal., 2000), but the vegetation is generally dominated by C3species, mostly perennial grasses. In particular, species ofthe genusStipaare a frequent and often dominant compo-nent of most grassland types in the region.
The carbon isotope composition (δ13C) of C3 vegetationgenerally correlates negatively with water availability. Thisis primarily attributed to the leaf-level response of13C dis-crimination (131) to water availability in C3 plants (Far-quhar et al., 1989), which translates to community and higherscales (e.g., Kaplan et al., 2002; Randerson et al., 2002;Schnyder et al., 2006). The carbon isotope composition ofplants (δ13Cp) is related to131 as
δ13Cp=(δ13Ca−131)/(1+
131) (1)
Published by Copernicus Publications on behalf of the European Geosciences Union.

914 M. Wittmer et al.:13C discrimination anomalies of C3 plants in arid grasslands
Fig. 1. Mean annual precipitation (MAP, mm yr−1); normal period1961–1990; data from Climate Source Inc.), major towns and sam-pling sites (triangles denote the 2005 and squares the 2006 samplingcampaign).
where δ13Ca is the δ13C of atmospheric CO2 (Farquharet al., 1989). Rearranging Eq. (1) leads to131=(δ13Ca–δ13Cp)/(1+δ13Cp) and shows that131 can be calculated di-rectly fromδ13Cp if δ13Ca is also known.
Precipitation is highly variable in time and space in theMongolian grassland. Mean annual precipitation (MAP)varies from several hundred millimeters per year (mm yr−1;mainly in the northern and eastern part of the region) to lessthan one hundred millimeters per year in the Gobi desert(Fig. 1). But, at a given site, hydrological conditions maydiffer drastically between years. For example, MAP at Eren-hot is 158 mm yr−1, but exceeds 275 mm yr−1 or falls below45 mm yr−1 in every second year (NOAA NCDC ClimateData Online, 2007). These factors may exert strong influ-ences on the carbon isotope composition of grassland via(i) effects on the relative abundance of C3 and C4 species(which differ by about 10 to 18‰ in carbon isotope discrim-ination; O’Leary, 1981; Farquhar et al., 1989), and (ii) varia-tion of 131 in C3 plants.
The carbon isotope signal produced by grassland vege-tation is imprinted in ecosystem carbon pools (such as soilcarbon) and exchange fluxes (such as biosphere atmosphereCO2 exchange), and is therefore potentially highly useful forbiogeochemical studies and ecosystem reconstruction. How-ever, in C3:C4 mixed grassland, the separate effects of C3:C4abundance and variation of131 in C3 plants on commu-nity/ecosystem131 must be known, to allow interpretation ofecosystem or community carbon isotope signals. The presentwork concentrates on one aspect of this problem, namely the
effect of aridity on131 in C3 plants, and then discusses itsimplications for C3:C4 mixing models.
The effect of aridity on131 in C3 plants has generallybeen studied in aridity-transect studies where the131 ofspecies was related to mean annual precipitation at the sam-pling sites. The responses observed in theses studies werehighly variable (e.g., Stewart et al., 1995; Schulze et al.,1991, 1996; Wang et al., 2003; Liu et al., 2005; Zhengand Shangguan, 2007). Here, we test the hypothesis, thatthe variability of the131-response of C3 plants to MAPin (semi-)arid grasslands is related to interannual variationof weather conditions. To test this prediction, we analysedthe relationship between131 of C3 species and short-term(growing period) and long-term (climatic, 30 years) precipi-tation along aridity gradients in Inner Mongolia in 2005 andin the Republic of Mongolia in 2006. The data set was com-plemented with published and unpublished (partially own)data, thus expanding the temporal and geographic represen-tation.
2 Material and methods
2.1 Sampling area
Stipaspecies were sampled in the Republic of Mongolia in2006 (total transect length of approx. 1650 km) and in In-ner Mongolia, People’s Republic of China in 2005 (totaltransect length of approx. 400 km) passing three vegetationzones, forest steppe, typical steppe and desert steppe (Wal-lis de Vries et al., 1996), with MAP ranging from around280 mm yr−1 near Ulaanbaatar to 125 mm yr−1 and less inthe Gobi area near Sainshand and Erenhot and rising againto 280 mm yr−1 near Xilinhot (Fig. 1).
The mean temperature ranges from about−23◦C in winterin Ulaanbaatar to about 23◦ in summer in Zamyn-Uud. Thelocal precipitation is highly variable in space and time (Gonget al., 2004). Even closely vicinal climate stations show re-markable differences: although the distance between Zamyn-Uud (Republic of Mongolia) and Erenhot (Inner Mongolia)is only 10 km, the mean monthly precipitation in Augustis 0.52 mm day−1 for Zamyn-Uud and 1.29 mm day−1 forErenhot (mean for last normal period 1961–1990). Similarly,the MAP is 114 mm yr−1 for Zamyn-Uud and 158 mm yr−1
for Erenhot, while mean monthly temperatures are similarfor both locations (calculated from NOAA NCDC ClimateData Online, 2007).
2.2 Sampling method and the sampled species
Sampling stops were made about every 30 km. Leaves ofStipa(if present), and other C3 species were cut with scissorsfrom several plants within an area of about 50×50 m (some-times there were only one or two specimen of a species ata sampling site). The samples for each site were transferredto separate paper bags and dried behind the front window of
Biogeosciences, 5, 913–924, 2008 www.biogeosciences.net/5/913/2008/

M. Wittmer et al.:13C discrimination anomalies of C3 plants in arid grasslands 915
the car. The current position was measured with a mobileoutdoor global positioning system (Casio Satellite Navi 2 orGarmin GPS 12). In total 39Stipasamples were taken in theRepublic of Mongolia in 2006 and tenStipasamples weretaken in Inner Mongolia in 2005 (see Table A1 in supplemen-tary material for original data –http://www.biogeosciences.net/5/913/2008/bg-5-913-2008-supplement.pdf). In a fewcases specimens ofStipacould not be classified at the specieslevel. The following species were collected:Stipa krylovii,Stipa grandisandStipa glareosain Republic of Mongolia,and Stipa gobicaand Stipa grandisin Inner Mongolia. Inaddition, 61 samples of another 19 C3 species were collectedin 2005; and six samples of six C3 species in 2006.
For validation, the data set was expanded with two sam-ples ofStipaand 20 samples from 20 C3 species sampled in2003 in Inner Mongolia, three bulk C3 samples collected inMongolia in 2006 and eight C3 bulk samples collected in In-ner Mongolia in 2007. Sampling procedures were the sameas during the 2005 and 2006 sampling campaigns.
2.3 Inclusion of published data and normalization for alti-tude effect
Published data (Table 1) were included in the validation database with the primary aim of increasing the temporal (andsecondarily the geographic) representation. These data cov-ered a wide range of site conditions, with altitudes extendingabove 2000 m a.s.l. (especially Ivanov et al., 2007). As alti-tude affects theδ13C of C3 plants (Korner et al., 1988), alldata were normalized to an altitude of 1000 m a.s.l., which isclose to the average altitude of our sampling locations (mean:1160 m a.s.l; SD: 180 m). The altitude effect was correctedfor by 1.15‰ per 1000 m following Mannel et al. (2007)with a mean absolute correction to131 of 0.26‰. For publi-cations containing no altitude data, this information was ob-tained with Google Earth® using the coordinates of the sam-ple sites.
2.4 Isotope analysis
Samples were further dried in the laboratory (1 h at 95◦C and48 h at 60◦C), ground with a ball mill and then combustedin an elemental analyser (NA 1110; Carlo Erba, Milan) in-terfaced (ConFlo III; Finnigan MAT, Bremen) to an isotoperatio mass spectrometer (Delta Plus; Finnigan MAT). Car-bon isotope data are presented asδ13C relative to the inter-national VPDB standard:δ13C=(Rsample/Rstandard)−1; whereRsampleandRstandardare the ratios of13C/12C in the sampleand standard. All samples were measured against laboratoryworking standard gases, which were previously calibratedagainst IAEA secondary standards (IAEA CH6 for13C, ac-curacy of calibration±0.06‰ SD). Wheat flour (C/N 21:6)as solid internal laboratory standard (SILS) was calibratedagainst these references. One SILS was measured after ev-
ery tenth sample. The precision for sample repeats was betterthan 0.2‰ forδ13C.
C3 community-mean131 was calculated as the biomass-or ground cover-weighted average of all C3 species in thecommunity. The arithmetic (unweighted) mean131 was cal-culated if information on ground cover or biomass fractionwas missing. In this way C3 community-mean131 wasobtained from 35 data sets by Chen et al. (2005), Wang etal. (2005), Liu et al. (2005), Gong et al. (2008) and for 10data sets obtained by us in 2005. This was complementedby 11 C3 samples collected as bulk samples in our 2006 and2007 sampling trips.
2.5 Carbon isotope composition of atmospheric CO2
δ13Ca of sampling years was estimated with a third orderpolynomial that was fitted to measuredδ13Ca data of Keeling(1979), Friedli et al. (1986), Conway et al. (1994), Franceyet al. (1999), Gat et al. (2001), Allison et al. (2003) andthe NOAA data base (NOAA NCDC Climate Data Online,2007) for the stations Mauna Loa, Siple, Antarctica, UlanUul, Shetland Islands, Hegyhatsal and Ochsenkopf (n=62),as in Geist et al. (2005):
δ13Ca=m1 × yr3 + m2 × yr2 + m3 × yr + m4, (2)
where yr is the sampling year andm1, m2, m3 andm4 areconstants (11.70712×10⁻⁶; −69.78999×10⁻³; 138.640104and−91.785 valid from 1959 to 2006). The standard error ofthis regression was 0.09‰.δ13Ca decreased from−8.12‰in 1996 to−8.48‰ in 2007. The meanδ13Ca during thegrowing period was then estimated from the meanδ13Ca ofthe year (Eq. 2) by applying a correction for the seasonal de-parture from the annual meanδ13Ca. This correction wasobtained from air samples collected at Ulan Uul (Tans et al.,2005), which is a long-term measuring station located nearthe center of the sampling area (44◦27′ N, 111◦05′ E). Av-erageδ13Ca was less negative by 0.25‰ between April andAugust as compared to the annual average. Thus aδ13Caof −8.17‰ and−8.19‰ resulted for the growing periodsin 2005 and 2006 respectively. The meanδ13Ca during thegrowing period of other years was estimated accordingly.
2.6 Statistical methods
Linear and linearised regressions were used to evaluate thedatasets. The coefficient of determination was tested with atwo-sided test for significance of the regression. In additionthe 95%-confidence interval for the samples and the 95%-confidence interval for the regression were calculated to al-low for comparison between data sets. A pairwise compar-ison of means was used to test whether the species differedregarding MAP and1. These statistical procedures followedstandard protocols (Sachs and Hedderich, 2006).
Geostatistical analyses (for theory see Nielsen and Wen-droth, 2003; Webster and Oliver, 2004) were conducted
www.biogeosciences.net/5/913/2008/ Biogeosciences, 5, 913–924, 2008

916 M. Wittmer et al.:13C discrimination anomalies of C3 plants in arid grasslands
Table 1. Sampling year, region, mean annual precipitation (MAP) and species name of literature references and own data used for validation.Top: Stipadata, bottom: other C3 species.
Sampling Region MAP Altitude Number Species Referenceyear (mm yr−1) (m a.s.l.) of data
1996 Mongolia 250 750 1 Stipa krylovii Cerling and Harris (1999)1999 Northwest China 290 1730 3 Stipa breviflora Wang et al. (2005)2001 Inner Mongolia 325 1267 1 Stipa grandis Chen et al. (2005)2001 Mongolia 118 2170 2 Stipa glaeosa Ivanov et al. (2007)2002 Northwest China 240–670 498–2095 37 Stipa bungeana Liu et al. (2005)2003 Inner Mongolia 340 1180 2 Stipa krylovii, Stipaunidentified This study2003–2004 Inner Mongolia 250 1200 3 Stipa grandis, S. krylovii, Liu et al. (2004)
S. baicalensis2004 Inner Mongolia 321 1184 11 Stipa grandis Gao (2004)1
2004–2005 Inner Mongolia 323 1267 4 Stipa grandis Gong et al. (2008)1997 Mongolia 250 1750 4 Carex rhynchophysa, Cerling and Harris (1999)
Agrostis trinii,Leymus chinensis,Ptilogostis mongolica
1999 Northwest China 194 1730–1850 15 Allium polyrhizum, Wang et al. (2005)Reaumuria soongorica,Sympegma regelii,Ajania fruticolosaand others
2001 Mongolia 118 2170 5 Allium polyrhizum, Ivanov et al. (2007)Ephedra sinica
2002 Northwest China 240–670 498–2095 31 Lespedeza davurica, Liu et al. (2005)Heteropappus less
2003 Inner Mongolia 323 1180 20 20 different C3 species This study2003 Northwest China 50–350 395–1956 21 Reaumuria soongorica Ma et al. (2005)2004 Inner Mongolia 323 1267 4 Carex korshinskyi, Gong et al. (2008)
Leymus chinensis2005 Inner Mongolia 323 1267 3 Carex korshinskyi, Gong et al. (2008)
Leymus chinensis2005 Inner Mongolia 146–364 951–1204 61 Leymussp., This study
Caraganasp.,Agropyronsp. and others
2006 Mongolia 125–257 1253–1479 6 Caragana microphylla, This studyHedysarum pumilum,Astralagussp.,Salsola laricifolia
1 Gao, Y.: Yinzhi Gao, Institut fur Pflanzenernahrung, Christian-Albrechts Universitat zu Kiel, unpublished data, 2004.
with package geoR (Ribeiro and Diggle, 2001) of the soft-ware GNU R 2.6 (R Development Core Team, 2007). Thesemivariance of a parameter (e.g. precipitation) is definedas the half mean quadratic difference of the parameter val-ues of points which are separated by a certain distance(called lag). For calculation of the latter, the coordinatesof sampling points were transformed from geographic co-ordinates to UTM coordinates using the package PBSmap-ping (Schnute et al., 2007, UTM zone=50). Semivarianceswere then grouped by lag classes and semivariances and lagswithin a group were averaged yielding the empirical semi-variogram (x-axis: lag, y-axis: semivariance). A theoretical
semivariogram was fitted to minimize weighted least squares,with weights calculated from the ratio of pairs within a classto mean lag. This gives more weight to the classes, which arebased on many data pairs and which are more important forinterpolation. Maps were constructed by spatial interpola-tion, which was carried out for a rectangular grid by ordinarypoint kriging, based on the theoretical semivariogram. Thequality of the predictions from the resulting maps is given asthe krige standard deviation averaged for the sampling loca-tions.
Biogeosciences, 5, 913–924, 2008 www.biogeosciences.net/5/913/2008/

M. Wittmer et al.:13C discrimination anomalies of C3 plants in arid grasslands 917
2.7 Meteorological data
The growing period in the sampling area starts in April withonly one growth cycle (no regrowth after cutting or heavygrazing). Sampled plant material thus included biomassgrown in the period of April to mid of July (2005) or Aprilto end of July/beginning of August (2006). This periodis termed “growing period” in the following and indexedwith “G”. Most of the rain usually falls during this period.For 40 meteorological stations in and around the samplingarea, long-term mean precipitation from April to Septem-ber correlated closely with MAP (r2=0.98) and contributed74‰ to MAP. Normally only little growth occurs in Septem-ber, which receives only 10‰ of MAP in an average year.Hence, above-ground living biomass in ungrazed areas gen-erally peaks between late July and late August (Xiao et al.,1995b). The effective water availability for plants in differentyears and studies was estimated as the mean daily precipita-tion during the respective growing period (P G; mm day−1).This accounted for the fact that sampling did not occur onexactly the same dates in the different studies, but provideda common denominator for comparison of data gathered indifferent years.
Sampling sites, either own or from literature, were usuallynot located near meteorological stations. Two data sets wereused to estimate meteorological data for the sampling sites.(i) The long-term averages of the last normal period (1961–1990) of precipitation data (monthly and annual means) weretaken from high resolution maps obtained from The ClimateSource Inc., Corvallis, Oregon. These maps have a pixel res-olution of 0.02◦×0.02◦ (approximately 1.5×1.5 km2, Fig. 1),judged sufficient to locate the sampling sites. These datawere created using the PRISM method (parameter-elevationregressions on independent slopes model; Daly et al., 2002),which accounts for topography, rain shadows, lake effects,temperature inversions, and more. (ii) For year-specific datawe assumed that the principal causes underlying the PRISMmaps were also valid at the small scale but were modified bylarge-scale trends. Daily precipitation data at 40 climate sta-tions, provided by the NOAA Satellite and Information Ser-vice (NOAA NCDC Climate Data Online, 2007) was com-piled. These stations were situated inside or just outside thesampling area. The latter were included to improve the geo-statistical interpolation at the periphery of the sampling area.To calculateP G, the difference between the normal-periodmean daily precipitation during the growing period (MPG)and P G was calculated for each meteorological station toquantify the anomaly,P G. These anomalies were geosta-tistically interpolated for the whole sampling area and eachyear to represent the large-scale spatial pattern of the anoma-lies. This trend was then superimposed on high-resolutionnormal-period maps to obtain high-resolution maps for indi-vidual years; e.g. for the year 2005P G was given by:
P G05 = MGP + dP G05. (3)
Fig. 2. Isohyet maps for the annual precipitation in 2005 (top left)and 2006 (top right) and of the anomalies in mean daily precipi-tation during the growing period (dPG) in 2005 (bottom left) and2006 (bottom right). For details see text. Circles denote samplingsites; dashed lines are the border between the Republic of Mongo-lia and Inner Mongolia Autonomous Region of China. Mean krigestandard deviation is 46 mm yr−1 (top left), 52 mm yr−1 (top right),0.32 mm day−1 (bottom left) and 0.41 mm day−1 (bottom right) forthe locations of vegetation sampling.
While annual precipitation was similar in 2005 and 2006,P G05/06 differed considerably (Fig. 2). In some locationsanomalies inP G between the two years and between MGPandP G were as large as 0.6 mm day−1, which was more thanone third of the mean precipitation. The best geostatisti-cal interpolation was obtained by ordinary kriging interpo-lation with Gaussian models (Fig. 2). In both years there wasa trend in the anomaly, which decreased from northwest tosoutheast. In 2005 the trend differed somewhat in direction,strength, curvature and the position of the zero isohyet com-pared to 2006. In 2006 the zero isohyet was near the centerof the sampling area, the south-eastern part of the samplingarea being drier than average and the north-western part wet-ter. In 2005 the zero isohyet was near the northern borderof the sampling area, and most of the area received less pre-cipitation during the vegetation period than in a normal year(Fig. 2).
www.biogeosciences.net/5/913/2008/ Biogeosciences, 5, 913–924, 2008

918 M. Wittmer et al.:13C discrimination anomalies of C3 plants in arid grasslands
Fig. 3. Carbon isotope discrimination (131) of different Stipaspecies depending on mean annual precipitation (MAP) for sam-ples collected in 2005 (r2=0.385,P<0.1) and in 2006 (r2=0.296,P<0.001).
3 Results
3.1 Carbon isotope discrimination ofStipa as related tomean annual precipitation
The gradient of MAP covered by the sampling transects wassimilar in the two years, and ranged between approx. 130and 290 mm yr−1 (Fig. 3). 131 amongStipa increased withMAP in both years, although the increase was only signifi-cant in 2006 (P<0.01). The slope of this relationship (131
versus MAP) was very similar in both years (P>0.05), butthere was a significant offset between the years, so that131
at a particular MAP was 1.1‰ higher in 2006 than in 2005.In both years, there was no relationship between131 and theC/N ratio of samples suggesting that variation in photosyn-thetic capacity related to changed nitrogen concentration didnot cause the variation in131.
In both years, the effect of MAP on131 coincided at leastpartially with species replacement along the aridity gradient:S. gobicaandS. glareosawere only present in the most aridpart of the transects (MAP<200 mm yr−1) and had lowerthan average131 (Table 2). Conversely,S. grandisandS.krylovii had higher than average131 and mainly occurredwhere MAP was>210 mm yr−1. This was true except forone site with MAP=146 mm yr−1 whereS. kryloviiwas alsofound in 2006. It is not known ifS. kryloviihas a wider eco-
Fig. 4. 131 and mean daily precipitation during the growing period(dPG) for Stipa species sampled in 2005 (triangels) and in 2006(squares). Closed symbols:S. grandis. r2=0.352,P�0.001.
logical range with respect to MAP, or if a local hydrologicalpeculiarity, such as local groundwater or lateral water flow,accounted for its presence. The significant separation be-tween species regarding MAP and131 suggests that speciesdistribution in the area was (at least partially) determined byMAP, whereas species131 was strongly influenced by year-to-year variability in precipitation.
3.2 Carbon isotope discrimination ofStipaas related to ac-tual precipitation
Mean daily precipitation during the growing period rangedfrom 0.1 to 0.7 mm day−1 in 2005 and from 0.5 to1.8 mm day−1 in 2006. 131 of Stipa collected in 2005and 2006 followed the same relationship withP G, with131 (‰)=15.0+2.53 sqrt(P G) (Fig. 4). Thus, the differencebetween years (apparent when131 was regressed againstMAP) disappeared when131 was regressed against growingperiod precipitation. This suggested that interannual varia-tions in131 were related to interannual variations in precip-itation. The square root expression indicates that the effectwas strong whenP G was very low and decreased with in-creasing precipitation.
Species did not differ in the relationship between131 andP G (highlighted forS. grandisin Fig. 4). Thus, it seemedthat species-replacement was controlled by long-term pre-cipitation patterns, whereas the within-species response toshort-term precipitation patterns controlled131.
3.3 Comparison with publishedStipadata
There were eight data sets (six published and twounpublished; see Table 1) for which the relationship
Biogeosciences, 5, 913–924, 2008 www.biogeosciences.net/5/913/2008/

M. Wittmer et al.:13C discrimination anomalies of C3 plants in arid grasslands 919
Table 2. Mean annual precipitation (MAP) at sampling sites and carbon isotope discrimination (131) of different species ofStipa in the2005 and 2006 transect studies. Mean, minimum and maximum, standard deviation (SD), and significance of species separation atP<0.05.
Species MAP (mm yr−1) 13δ (%)
Mean Min. Max. SD Significance Mean Min. Max. SD Significance
2006
S. glareosa 160 130 197 27 A 17.5 16.9 18.7 0.81 BS. krylovii 232 146 269 40 B 18.1 16.9 19.3 0.66 BS. grandis 246 209 284 25 B 18.2 17.1 19.7 0.71 B
2005
S. gobica 164 146 177 16 A 16.0 15.5 16.8 0.68 AS. grandis 259 214 278 25 B 17.0 15.9 17.5 0.72 A
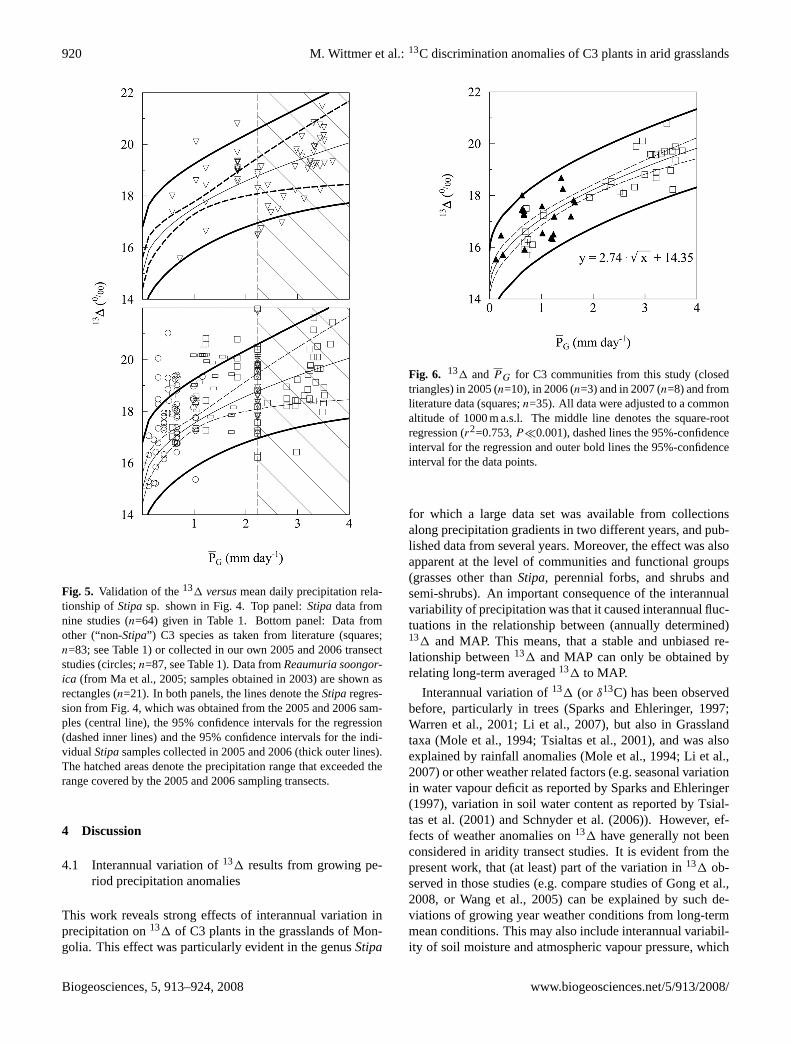
between 131 and actual precipitation could be calcu-lated and compared with the results from our tran-sects (see Table A2 in supplementary material for pre-cipitation data –http://www.biogeosciences.net/5/913/2008/bg-5-913-2008-supplement.pdf). These studies reported atotal of 62 data for different species ofStipa. The data cor-responded well with the relation derived from the 2005 and2006 samples (Fig. 5, top). Notably, this was also true forstudies in whichStipaexperienced higher precipitation thanthe maximum encountered in our transect studies (Fig. 5,hatched areas denoting (P G)>2.2 mm day−1). Inclusion ofdata of Liu et al. (2005) reporting131 of S. bungeanaalonga rainfall gradient in Northwest China further expanded therange of precipitation, and also agreed with the relationshipderived from the 2005 and 2006 collections ofStipa. Overall,these comparisons supported the notion that the relationshippresented in Fig. 4 provides a general and unbiased predic-tion of the131 of Stipain the grasslands of Mongolia.
The relation withP G even explained data obtained in 2001(Table 1), which was an extremely dry year in Inner Mongo-lia. In that year more than half of the numerous lakes of theprovince of Qinghai (in the west of Inner Mongolia) disap-peared (Reuters, 2001), and in the Republic of Mongolia theherders lost one quarter of their large-animal livestock suchas horses and cattle (Retzer, 2007).
3.4 Comparison with other C3 species
“Non-Stipa” C3 species included 170 data from a total of 55species, collected in eight different years (1996, 1999, 2001,2002, 2003, 2004, 2005 and 2006). Again, the comparisonindicated a fair agreement between the precipitation responseof 131 in Stipaand that of the other species, although thescatter was somewhat larger in the latter. Still, 80% (135out of 170) of all non-Stipadata fell inside the 95‰ confi-dence interval ofStipa (Fig. 5, bottom). Subdivison of thewhole data set in functional groups (monocotsn=163 anddicots n=118; grassesn=143, forbsn=50 and shrubs andsemi-shrubsn=68) also provided no evidence for a differ-
ent precipitation response at the level of functional groups.However, dicots deviated from monocots insofar as their131
was about 0.5‰ higher on average at a given precipitationlevel. In particular, leaves ofReaumuria soongorica, a short-statured woody shrub, had 1.8‰ higher131 thanStipaandother species at the same precipitation level. Yet, even inR.soongorica, the slope of the131 versusP G relationship didnot deviate from that ofStipaor that of the whole of otherspecies.
3.5 The131-response of C3 communities to growing pe-riod precipitation
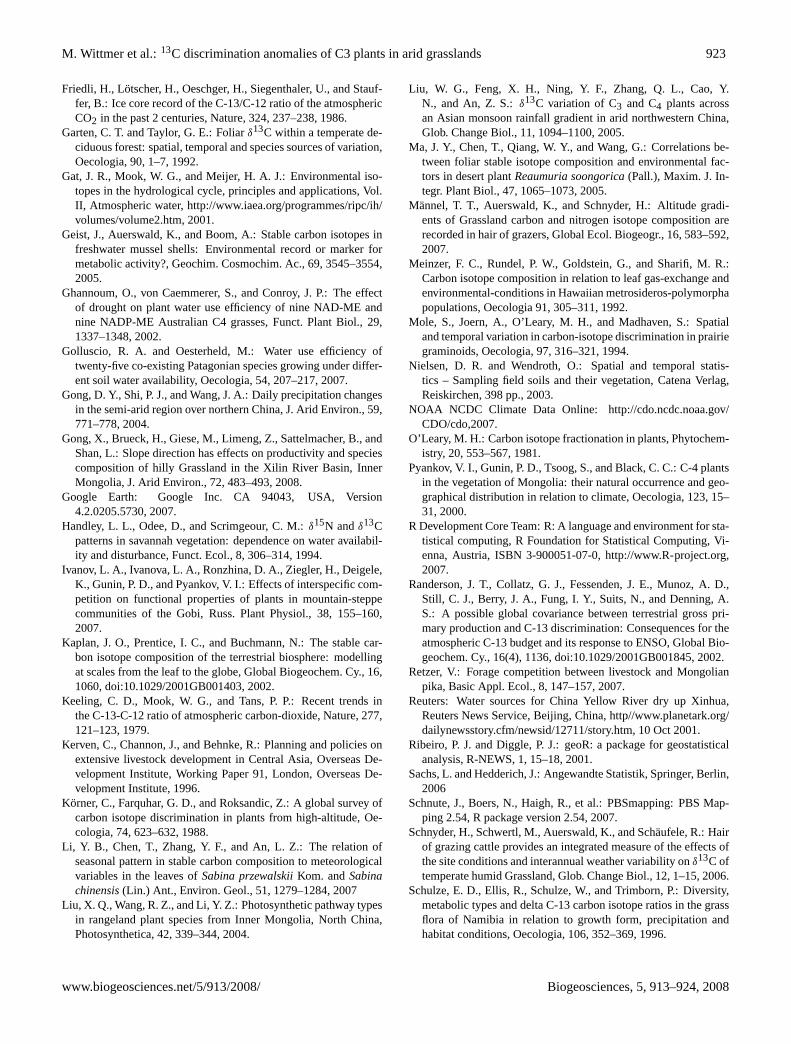
The C3 community-mean131 responded to mean dailygrowing period precipitation in the same way as131 of Stipa(Fig. 6; see Table A3 in supplementary material for mainspecies and biomass data –http://www.biogeosciences.net/5/913/2008/bg-5-913-2008-supplement.pdf) but with lessscatter due to an averaging effect, which compressed the95‰ confidence interval for the data points. The regressionfor the community data, calculated to obtain a robust relationover the entire range of precipitation, was virtually the samerelation as that forStipa, but the confidence interval of theregression remained narrow over the entire range due to thecontinuous support by data.
3.6 The relationship between precipitation anomalies and131 anomalies
The deviation of growing period precipitation from the long-term mean (precipitation anomaly) was directly related to thedeviation between actual131 and 131 predicted for meanconditions at the respective sites (131 anomaly). This effectwas manifested at the level of C3 communities (Fig. 7), andspecies (data not shown). The precipitation anomalies modi-fied the community-mean131 by ±1‰. The response at thecommunity level and the large spatial extension of precipita-tion anomalies imply that this response was also effective atlarger scales.
www.biogeosciences.net/5/913/2008/ Biogeosciences, 5, 913–924, 2008
920 M. Wittmer et al.:13C discrimination anomalies of C3 plants in arid grasslands
Fig. 5. Validation of the131 versusmean daily precipitation rela-tionship ofStipasp. shown in Fig. 4. Top panel:Stipadata fromnine studies (n=64) given in Table 1. Bottom panel: Data fromother (“non-Stipa”) C3 species as taken from literature (squares;n=83; see Table 1) or collected in our own 2005 and 2006 transectstudies (circles;n=87, see Table 1). Data fromReaumuria soongor-ica (from Ma et al., 2005; samples obtained in 2003) are shown asrectangles (n=21). In both panels, the lines denote theStiparegres-sion from Fig. 4, which was obtained from the 2005 and 2006 sam-ples (central line), the 95% confidence intervals for the regression(dashed inner lines) and the 95% confidence intervals for the indi-vidualStipasamples collected in 2005 and 2006 (thick outer lines).The hatched areas denote the precipitation range that exceeded therange covered by the 2005 and 2006 sampling transects.
4 Discussion
4.1 Interannual variation of131 results from growing pe-riod precipitation anomalies
This work reveals strong effects of interannual variation inprecipitation on131 of C3 plants in the grasslands of Mon-golia. This effect was particularly evident in the genusStipa
Fig. 6. 131 andPG for C3 communities from this study (closedtriangles) in 2005 (n=10), in 2006 (n=3) and in 2007 (n=8) and fromliterature data (squares;n=35). All data were adjusted to a commonaltitude of 1000 m a.s.l. The middle line denotes the square-rootregression (r2=0.753,P�0.001), dashed lines the 95%-confidenceinterval for the regression and outer bold lines the 95%-confidenceinterval for the data points.
for which a large data set was available from collectionsalong precipitation gradients in two different years, and pub-lished data from several years. Moreover, the effect was alsoapparent at the level of communities and functional groups(grasses other thanStipa, perennial forbs, and shrubs andsemi-shrubs). An important consequence of the interannualvariability of precipitation was that it caused interannual fluc-tuations in the relationship between (annually determined)131 and MAP. This means, that a stable and unbiased re-lationship between131 and MAP can only be obtained byrelating long-term averaged131 to MAP.
Interannual variation of131 (or δ13C) has been observedbefore, particularly in trees (Sparks and Ehleringer, 1997;Warren et al., 2001; Li et al., 2007), but also in Grasslandtaxa (Mole et al., 1994; Tsialtas et al., 2001), and was alsoexplained by rainfall anomalies (Mole et al., 1994; Li et al.,2007) or other weather related factors (e.g. seasonal variationin water vapour deficit as reported by Sparks and Ehleringer(1997), variation in soil water content as reported by Tsial-tas et al. (2001) and Schnyder et al. (2006)). However, ef-fects of weather anomalies on131 have generally not beenconsidered in aridity transect studies. It is evident from thepresent work, that (at least) part of the variation in131 ob-served in those studies (e.g. compare studies of Gong et al.,2008, or Wang et al., 2005) can be explained by such de-viations of growing year weather conditions from long-termmean conditions. This may also include interannual variabil-ity of soil moisture and atmospheric vapour pressure, which
Biogeosciences, 5, 913–924, 2008 www.biogeosciences.net/5/913/2008/

M. Wittmer et al.:13C discrimination anomalies of C3 plants in arid grasslands 921
exert direct effects on131 (Sparks and Ehleringer, 1997;Tsialtas et al., 2001). However, since these factors are usu-ally (but not always, see Schulze et al., 1996) correlated withprecipitation, their effect is (at least partially) included in therelationship of131 with year-specific growing period precip-itation.
4.2 Species, functional groups and communities share thesame precipitation response of131
The 131-response (that is the slope of the relationship be-tween131 andP G) of S. grandiswas the same as that ofthe other species ofStipa in the data base. It was also verysimilar to the “mean” species response, and the response ofC3 communities. Even inR. soongorica, which had a com-paratively high131 in all rainfall conditions, the slope ofthe relationship between131 and year-specific growing pe-riod precipitation was the same as that of the “mean” species.Although the relationship between131 and growing periodprecipitation has not been studied in any detail, the unifor-mity in the 131 responses of species’ or functional groupsto rainfall, as seen here, was not expected: inter-specificdifferences in the131-response to environmental parame-ters have been observed before (e.g. Handley et al., 1994),and the adaptive significance of different strategies of wateruse have been discussed and emphasized (e.g. Golluscio andOesterheld, 2007). Yet, it is acknowledged that, although thenumber of species in the data base was relatively large (55C3 species, including 7Stipaspecies), it was nevertheless asmall fraction of the total flora of the grasslands of Mongolia.Moreover, the data base was dominated by perennial grasses(over 50% of all data). But in this respect the data base re-flects the species composition of most Grassland communi-ties of Mongolia. For instance,Stipa accounted for morethan 40% and perennial grasses (includingStipa) for morethan 70% of total aboveground biomass in the communitiessampled in 2005. Perennial grasses from arid and semi-aridtemperate grasslands share great similarities in phenology,leaf structure, and root architecture and placement, whichmay explain the similarity in their water use (Golluscio andOesterheld, 2007). Thus, the similarity in the precipitationresponse of131 by C3 communities was related to the pre-dominance of perennial grasses (particularlyStipa) in thesecommunities and the similarity in water use strategies amonggrasses. These similarities might also explain, why species-replacement along the aridity gradient did not affect the pre-cipitation response of131 (Fig. 4).
Nevertheless, there was significant scatter in the overallrelationship between131 and growing period precipitation.Although there was no difference between functional groups,the scatter may partly be due to differences between specieswithin groups. Differences between species have been inter-preted in terms of differences in intrinsic water use efficiency(e.g. Condon et al., 1990; Ehleringer et al., 1992; Meinzeret al., 1992) and may be related to differences in phenol-
Fig. 7. Relation of the anomalies in C3 community mean131 andgrowing period precipitation (r2=0.556,P�0.001; same commu-nities as in Fig. 6). Both anomalies are expressed as the differencebetween the annual and the long-term value. The long-term averagediscrimination,131MP , was calculated from the equation shownin Fig. 6. Year-specific precipitation for the sites of other studieswas obtained by geostatistical interpolation analogously to our owndata.
ogy (e.g. Smedley et al., 1991), rooting pattern/depth (Gol-luscio and Oesterheld, 2007) and leaf anatomy (includingleaf thickness and nitrogen content) (Farquhar et al., 1989;Schulze et al., 2006). Mechanisms also include special adap-tations to arid conditions such as leaf shedding in response todrought as expressed inR. soongorica(Ma et al., 2005) andphreatophyte lifestyle. This also explains, why the precipi-tation response at the community level was associated withmuch less scatter than that at the species level (cf. Figs. 4 and6): communities include species with a range of functionalattributes which are related to differences in131.
Finally, there exists large short-term, small-scale variabil-ity in precipitation in the region, which is not represented en-tirely when interpolating precipitation at collection sites fromweather station data. For instance, the Erenhot and Zamyn-Uud weather stations are separated by approximately 10 kmbut differ by an average of 15 mm in the monthly precipita-tion during the growing period. Therefore, errors in precipi-tation estimates are probably substantial and explain some ofthe scatter in the131 versus precipitation relationship.
www.biogeosciences.net/5/913/2008/ Biogeosciences, 5, 913–924, 2008

922 M. Wittmer et al.:13C discrimination anomalies of C3 plants in arid grasslands
4.3 A stable and unbiased relationship between131 andprecipitation for use in C3:C4 mixing models
The findings of this work are useful for estimation of therelative abundance of C3 and C4 vegetation in communitybiomass from community131 (131community), which re-quires knowledge of the131 of the C3 (1313) and C4 (1314)
members in a two-component mixing model (e.g. Still etal., 2003). Evidently, errors in the assessment of1313 and1314 cause errors in the estimation of C3:C4 abundance. Ingeneral, neglect of variation of1313 or 1314 overestimatesthe true variation of the fraction of C3 (and C4) vegetationin communities, because all variation of131community is at-tributed to variation in the relative abundances of C3 and C4plants. If variation of1313 (or 1314) is systematic, then ne-glect of this variation provokes a biased variation of the rel-ative abundances of C3 and C4 plants. For instance, neglectof the effect of aridity on131 of C3 plants would underesti-mate the relative abundance of C3 plants in the dry section ofthe transect. As shown above the potential variation of1313is large in semi-arid and arid Grassland, creating opportuni-ties for large errors in estimation of the relative abundanceof C3 and C4 plants from131community. In the present studyaridity caused a variation of1313 of up to ∼5‰ (Fig. 6).This is about one third to one half of the difference in131
between C3 and C4 plants in arid and semiarid Grassland(Schulze et al., 1996; Wang et al., 2005). Accordingly, theshift from the wet to the dry end of the aridity gradient hasthe same effect on131community, as a 33–50% replacementby C4 plants. A possible systematic variation of1313 mustalso be considered when interpreting long-term records suchas soil organic matter or sediments in terms of the C3:C4abundance. Variation of1314 would have a similar effect,although, variation in1314 is generally smaller (e.g. Liu etal., 2005; Wang et al., 2005) than that of C3 plants and com-munities as observed here, and1314 responds much less todrought (Schulze et al., 1996; Ghannoum et al., 2002). Yet,systematic differences in131 between C4 metabolic typesexist (e.g. Schulze et al., 1996; Ghannoum et al., 2002) andthe relative abundance of metabolic types may change witharidity (Schulze et al., 1996).
5 Conclusions
This work demonstrates that rainfall anomalies cause largevariations of the131 versus MAP relationship, which aregreatly reduced when131 is related to actual rainfall duringthe growing period. Significantly, the131-response to grow-ing period rainfall was stable across years, and it was verysimilar for dominant taxa (Stipamembers), functional groups(including herbaceous dicots, semi-shrubs and grasses), andC3 communities. Moreover, the relation was also valid out-side the geographical and climatic range where it was devel-oped, giving proof of its robustness. Because of its generality
and stability, the relationship between131 and growing pe-riod rainfall allows an unbiased estimation of131 of the C3member for use in C3:C4 mixing models based on commu-nity C isotope composition.
Acknowledgements.This research was funded by the DFG withinthe Research Group 563 MAGIM. We thank Monika Breitsameterand Anja Schmidt for assistance with sample preparation for iso-tope analysis, and Weiguo Liu (Institute of Earth and Environment,The Chinese Academy of Sciences) and Yinzhi Gao (Institut furPflanzenernahrung, Christian-Albrechts Universitat zu Kiel) forproviding data. Chun Hua Bai is thanked for assistance duringsampling trips.
Edited by: D. Hammarlund
References
Allison, C. E., Francey, R. J., and Krummel, P. B.:δ13C inCO2 from sites in the CSIRO Atmospheric Research GASLABair sampling network, Trends: A Compendium of Data onGlobal Change, Carbon Dioxide Information Analysis Center,Oak Ridge National Laboratory, US Department of Energy, OakRidge, TN, USA, 2003.
Cerling, T. E. and Harris, J. M.: Carbon isotope fractionation be-tween diet and bioapatite in ungulate mammals and implica-tion for ecological and paleoecological studies, Oecologica, 120,347–363, 1999.
Chen, S. P., Bai, Y. F., and Han, X. G.: Variation of Water-UseEfficiency of Leymus chinensisand Cleistogenes squarrosaindifferent plant communities in Xilin River Basin, Nei Mongol,Acta Bot. Sin., 44, 1484–1490, 2002.
Chen, S. P., Bai, Y. F., Guanghui, L., and Han, X. G.: Variationsin life-form composition and foliar carbon isotope discrimina-tion among eight plant communities under different soil moistureconditions in the Xilin River Basin, Inner Mongolia, China, Ecol.Res., 20, 167–176, 2005.
Condon, A. G., Farquhar, G. D., and Richards, R. A.: Genotypicvariation in carbon isotope discrimination and transpiration ef-ficiency in wheat – leaf gas-exchange and whole plant studies,Aust. J. Plant Physiol., 17, 9–22, 1990.
Conway, T. J., Tans, P. P., and Waterman, L. S.: Atmospheric CO2records from sites in the NOAA/CMDL air sampling network,Trends ’93: A Compendium of Data on Global Change, CarbonDioxide Information Analysis Center, Oak Ridge National Lab-oratory, US Department of Energy, Oak Ridge, TN, USA, 1994.
Daly, C., Gibson, W. P., Taylor, G. H., Johnson, G. L., and Pasteris,P.: A knowledge-based approach to the statistical mapping ofclimate, Climate Res., 22, 99–113, 2002.
Ehleringer, J. R., Phillips, S. L., and Comstock, J. P.: Seasonal vari-ation in the carbon isotopic composition of desert plants, Funct.Ecol., 6, 396–404, 1992.
Farquhar, G. D., Ehleringer, J. R., and Hubick, K. T.: Carbon iso-tope discrimination and photosynthesis, Annu. Rev. Plant Phys.,40, 503–537, 1989.
Francey, R. J., Allison, C. E., Etheridge, D. M., Trudinger, C. M.,Enting, I. G., Leuenberger, M., Langenfelds, R. L., Michel, E.,and Steele, L. P.: A 1000-year high precision record ofδ13C inatmospheric CO2, Tellus B, 51, 170–193, 1999.
Biogeosciences, 5, 913–924, 2008 www.biogeosciences.net/5/913/2008/
M. Wittmer et al.:13C discrimination anomalies of C3 plants in arid grasslands 923
Friedli, H., Lotscher, H., Oeschger, H., Siegenthaler, U., and Stauf-fer, B.: Ice core record of the C-13/C-12 ratio of the atmosphericCO2 in the past 2 centuries, Nature, 324, 237–238, 1986.
Garten, C. T. and Taylor, G. E.: Foliarδ13C within a temperate de-ciduous forest: spatial, temporal and species sources of variation,Oecologia, 90, 1–7, 1992.
Gat, J. R., Mook, W. G., and Meijer, H. A. J.: Environmental iso-topes in the hydrological cycle, principles and applications, Vol.II, Atmospheric water,http://www.iaea.org/programmes/ripc/ih/volumes/volume2.htm, 2001.
Geist, J., Auerswald, K., and Boom, A.: Stable carbon isotopes infreshwater mussel shells: Environmental record or marker formetabolic activity?, Geochim. Cosmochim. Ac., 69, 3545–3554,2005.
Ghannoum, O., von Caemmerer, S., and Conroy, J. P.: The effectof drought on plant water use efficiency of nine NAD-ME andnine NADP-ME Australian C4 grasses, Funct. Plant Biol., 29,1337–1348, 2002.
Golluscio, R. A. and Oesterheld, M.: Water use efficiency oftwenty-five co-existing Patagonian species growing under differ-ent soil water availability, Oecologia, 54, 207–217, 2007.
Gong, D. Y., Shi, P. J., and Wang, J. A.: Daily precipitation changesin the semi-arid region over northern China, J. Arid Environ., 59,771–778, 2004.
Gong, X., Brueck, H., Giese, M., Limeng, Z., Sattelmacher, B., andShan, L.: Slope direction has effects on productivity and speciescomposition of hilly Grassland in the Xilin River Basin, InnerMongolia, J. Arid Environ., 72, 483–493, 2008.
Google Earth: Google Inc. CA 94043, USA, Version4.2.0205.5730, 2007.
Handley, L. L., Odee, D., and Scrimgeour, C. M.:δ15N andδ13Cpatterns in savannah vegetation: dependence on water availabil-ity and disturbance, Funct. Ecol., 8, 306–314, 1994.
Ivanov, L. A., Ivanova, L. A., Ronzhina, D. A., Ziegler, H., Deigele,K., Gunin, P. D., and Pyankov, V. I.: Effects of interspecific com-petition on functional properties of plants in mountain-steppecommunities of the Gobi, Russ. Plant Physiol., 38, 155–160,2007.
Kaplan, J. O., Prentice, I. C., and Buchmann, N.: The stable car-bon isotope composition of the terrestrial biosphere: modellingat scales from the leaf to the globe, Global Biogeochem. Cy., 16,1060, doi:10.1029/2001GB001403, 2002.
Keeling, C. D., Mook, W. G., and Tans, P. P.: Recent trends inthe C-13-C-12 ratio of atmospheric carbon-dioxide, Nature, 277,121–123, 1979.
Kerven, C., Channon, J., and Behnke, R.: Planning and policies onextensive livestock development in Central Asia, Overseas De-velopment Institute, Working Paper 91, London, Overseas De-velopment Institute, 1996.
Korner, C., Farquhar, G. D., and Roksandic, Z.: A global survey ofcarbon isotope discrimination in plants from high-altitude, Oe-cologia, 74, 623–632, 1988.
Li, Y. B., Chen, T., Zhang, Y. F., and An, L. Z.: The relation ofseasonal pattern in stable carbon composition to meteorologicalvariables in the leaves ofSabina przewalskiiKom. andSabinachinensis(Lin.) Ant., Environ. Geol., 51, 1279–1284, 2007
Liu, X. Q., Wang, R. Z., and Li, Y. Z.: Photosynthetic pathway typesin rangeland plant species from Inner Mongolia, North China,Photosynthetica, 42, 339–344, 2004.
Liu, W. G., Feng, X. H., Ning, Y. F., Zhang, Q. L., Cao, Y.N., and An, Z. S.:δ13C variation of C3 and C4 plants acrossan Asian monsoon rainfall gradient in arid northwestern China,Glob. Change Biol., 11, 1094–1100, 2005.
Ma, J. Y., Chen, T., Qiang, W. Y., and Wang, G.: Correlations be-tween foliar stable isotope composition and environmental fac-tors in desert plantReaumuria soongorica(Pall.), Maxim. J. In-tegr. Plant Biol., 47, 1065–1073, 2005.
Mannel, T. T., Auerswald, K., and Schnyder, H.: Altitude gradi-ents of Grassland carbon and nitrogen isotope composition arerecorded in hair of grazers, Global Ecol. Biogeogr., 16, 583–592,2007.
Meinzer, F. C., Rundel, P. W., Goldstein, G., and Sharifi, M. R.:Carbon isotope composition in relation to leaf gas-exchange andenvironmental-conditions in Hawaiian metrosideros-polymorphapopulations, Oecologia 91, 305–311, 1992.
Mole, S., Joern, A., O’Leary, M. H., and Madhaven, S.: Spatialand temporal variation in carbon-isotope discrimination in prairiegraminoids, Oecologia, 97, 316–321, 1994.
Nielsen, D. R. and Wendroth, O.: Spatial and temporal statis-tics – Sampling field soils and their vegetation, Catena Verlag,Reiskirchen, 398 pp., 2003.
NOAA NCDC Climate Data Online: http://cdo.ncdc.noaa.gov/CDO/cdo,2007.
O’Leary, M. H.: Carbon isotope fractionation in plants, Phytochem-istry, 20, 553–567, 1981.
Pyankov, V. I., Gunin, P. D., Tsoog, S., and Black, C. C.: C-4 plantsin the vegetation of Mongolia: their natural occurrence and geo-graphical distribution in relation to climate, Oecologia, 123, 15–31, 2000.
R Development Core Team: R: A language and environment for sta-tistical computing, R Foundation for Statistical Computing, Vi-enna, Austria, ISBN 3-900051-07-0,http://www.R-project.org,2007.
Randerson, J. T., Collatz, G. J., Fessenden, J. E., Munoz, A. D.,Still, C. J., Berry, J. A., Fung, I. Y., Suits, N., and Denning, A.S.: A possible global covariance between terrestrial gross pri-mary production and C-13 discrimination: Consequences for theatmospheric C-13 budget and its response to ENSO, Global Bio-geochem. Cy., 16(4), 1136, doi:10.1029/2001GB001845, 2002.
Retzer, V.: Forage competition between livestock and Mongolianpika, Basic Appl. Ecol., 8, 147–157, 2007.
Reuters: Water sources for China Yellow River dry up Xinhua,Reuters News Service, Beijing, China,http//www.planetark.org/dailynewsstory.cfm/newsid/12711/story.htm, 10 Oct 2001.
Ribeiro, P. J. and Diggle, P. J.: geoR: a package for geostatisticalanalysis, R-NEWS, 1, 15–18, 2001.
Sachs, L. and Hedderich, J.: Angewandte Statistik, Springer, Berlin,2006
Schnute, J., Boers, N., Haigh, R., et al.: PBSmapping: PBS Map-ping 2.54, R package version 2.54, 2007.
Schnyder, H., Schwertl, M., Auerswald, K., and Schaufele, R.: Hairof grazing cattle provides an integrated measure of the effects ofthe site conditions and interannual weather variability onδ13C oftemperate humid Grassland, Glob. Change Biol., 12, 1–15, 2006.
Schulze, E. D., Ellis, R., Schulze, W., and Trimborn, P.: Diversity,metabolic types and delta C-13 carbon isotope ratios in the grassflora of Namibia in relation to growth form, precipitation andhabitat conditions, Oecologia, 106, 352–369, 1996.
www.biogeosciences.net/5/913/2008/ Biogeosciences, 5, 913–924, 2008

924 M. Wittmer et al.:13C discrimination anomalies of C3 plants in arid grasslands
Schulze, E. D., Turner, N. C., Nicolle, D., and Schumacher, J.:Species differences in carbon isotope ratios, specific leaf areaand nitrogen concentrations in leaves of Eucalyptus growing in acommon garden compared with along an aridity gradient, Phys-iol. Plantarum, 127, 434–444, 2006.
Smedley, M. P., Dawson, T. E., Comstock, J. P., Donovan, L. A.,Sherrill, D. E., Cook, C. S., and Ehleringer, J. R.: Seasonal car-bon isotope discrimination in a Grassland community, Oecologia85, 314–320, 1991.
Sparks, J. P. and Ehleringer, J. R.: Leaf carbon isotope discrimi-nation and nitrogen content for riparian trees along elevationaltransects, Oecologia, 109, 362–367, 1997.
Still, C. J., Berry, J. A., Ribas-Carbo, M., and Helliker, B. R.: Thecontribution of C3 and C4 plants to the carbon cycle of a tallgrassprairie: an isotopic approach, Oecologia, 136, 347–359, 2003.
Tans, P. P. and Conway, T. J.: Monthly atmospheric CO2 mixingratios from the NOAA CMDL Carbon Cycle Cooperative GlobalAir Sampling Network, 1968–2002. A Compendium of Data onGlobal Change, Carbon Dioxide Information Analysis Center,Oak Ridge National Laboratory, US Department of Energy, OakRidge, TN, USA, 2005.
The Climate Source LLC: Corvallis, OR, USA, PRISM spatial cli-mate datasets for Mongolia and Inner Mongolia, 2002.
Tsialtas, J. T., Handley, L. L., Kassioumi, M. T., Veresoglou, D. S.,and Gagianas, A. A.: Interspecific variation in potential water-use efficiency and its relation to plant species abundance in awater-limited Grassland, Funct. Ecol., 15, 605–614, 2001.
Wallis de Vries, M. F., Manibazar, N., and Dugerlham, S.: The veg-etation of the forest-steppe region of Hustain Nuruu, Mongolia.Plant Ecol., 122, 11–127, 1996.
Wang, G., Han, J. M., and Liu, D.: The carbon isotope compositionof C3 herbaceous plants in loess area of Northern China, Sci.Chin. Ser. D, 46, 1069–1076, 2003.
Wang, G. A., Han, J. M., Zhou, L. P., Xiong, X. G., and Wu, Z.:Carbon isotope ratios of plants and occurrences of C4 speciesunder different soil moisture regimes in arid region of NorthwestChina, Physiol. Plantarum, 125, 74–81, 2005.
Warren, C. R., McGrath, J. F., and Adams, M. A.: Water availabilityand carbon isotope discrimination in conifers, Oecologia, 127,476–486, 2001.
Webster, R. and Oliver, M.: Geostatistics for environmental sci-entists, Statistics in Practice, Wiley & Sons, Chichester, ISBN0-471-96553-7, 2004.
Xiao, X., Ojima, D. S., Parton, W. J., Chen, Z., and Chen, D.: Sen-sitivity of Inner Mongolian Grasslands to climate change, J. Bio-geogr., 22, 643–648, 1995a.
Xiao, X., Wang, Y. F., Jiang, S., Ojima, D. S., and Bonham, C. D.:Interannual variation in the Climate and aboveground biomassof Leymus chinenseSteppe andStipa grandissteppe in the XilinRiver Basin, Inner-Mongolia, China, J. Arid Environ., 31, 283–299, 1995b.
Zheng, S. X. and Shangguan, Z. P.: Foliarδ13C values of nine dom-inant species in the Loess Plateau of China, Photosynthetica, 45,110–119, 2007.
Biogeosciences, 5, 913–924, 2008 www.biogeosciences.net/5/913/2008/