carbon changes in the interior ocean -...
TRANSCRIPT

Paris Sept 14, 2011Paris Sept 14, 2011
Carbon Changes in the Carbon Changes in the Interior OceanInterior Ocean
Toste TanhuaToste TanhuaSamar KhatiwalaSamar Khatiwala
Christopher L. SabineChristopher L. Sabine
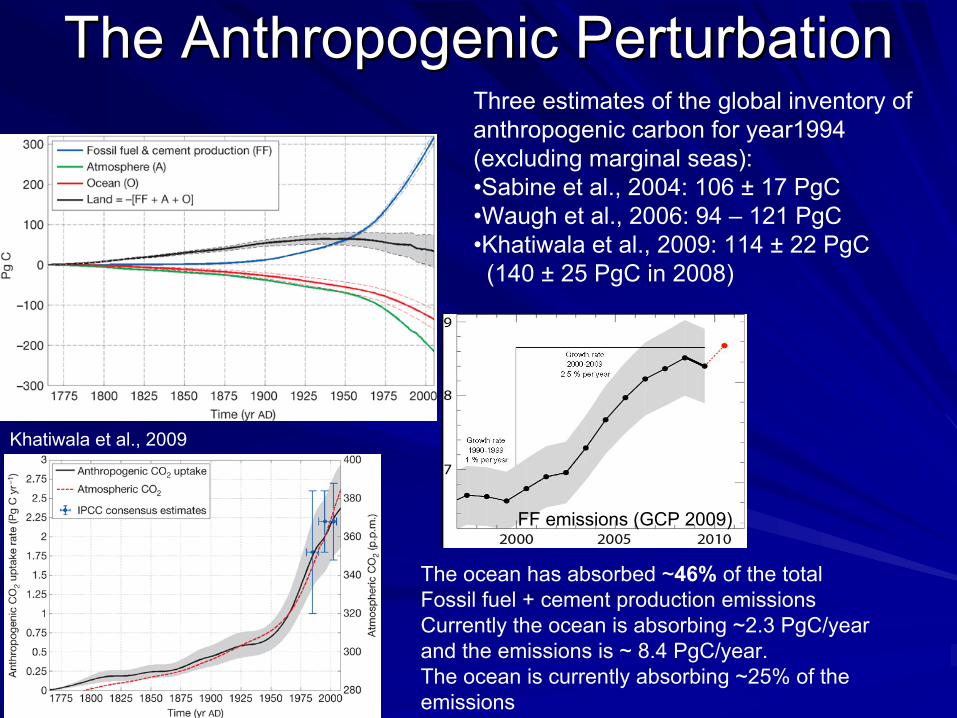
The Anthropogenic PerturbationThe Anthropogenic Perturbation
Khatiwala et al., 2009
The ocean has absorbed ~46% of the total Fossil fuel + cement production emissionsCurrently the ocean is absorbing ~2.3 PgC/yearand the emissions is ~ 8.4 PgC/year.The ocean is currently absorbing ~25% of the emissions
FF emissions (GCP 2009)
Three estimates of the global inventory of anthropogenic carbon for year1994(excluding marginal seas):•Sabine et al., 2004: 106 ± 17 PgC•Waugh et al., 2006: 94 – 121 PgC•Khatiwala et al., 2009: 114 ± 22 PgC(140 ± 25 PgC in 2008)

Interior ocean anthropogenic carbonInterior ocean anthropogenic carbon
The different estimates are all within the uncertainties. Differences are in the details.
114 ± 22
94 – 121(134)
106 ± 17
ΔC* - Green
Waugh et al., 20006
TTD - ΔC*
Green
TTD
ΔC*
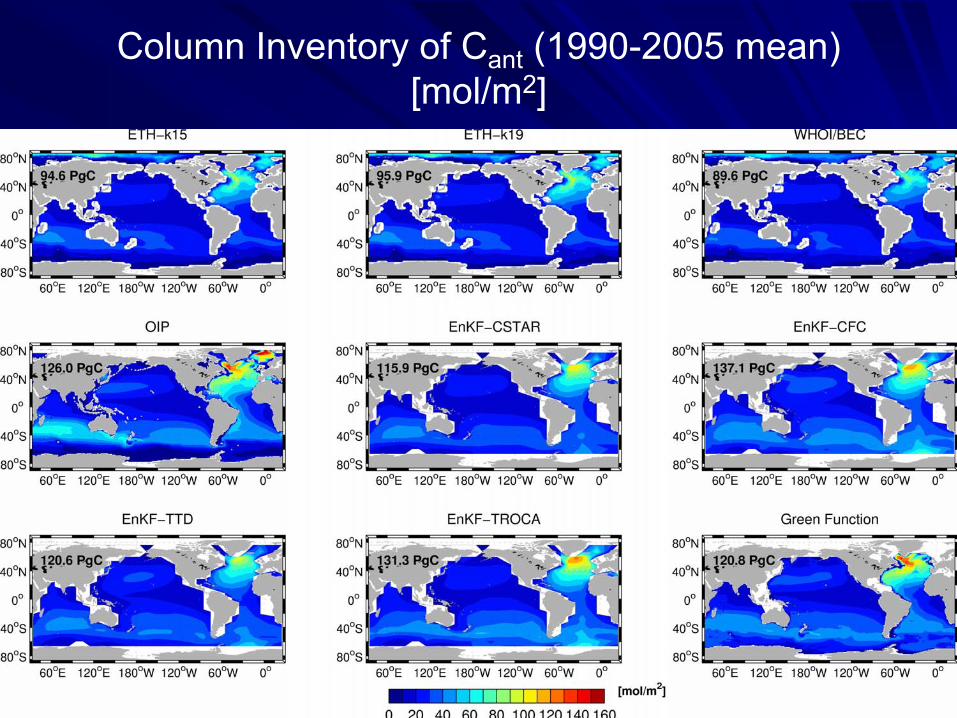
Column Inventory of Cant (1990-2005 mean) [mol/m2]
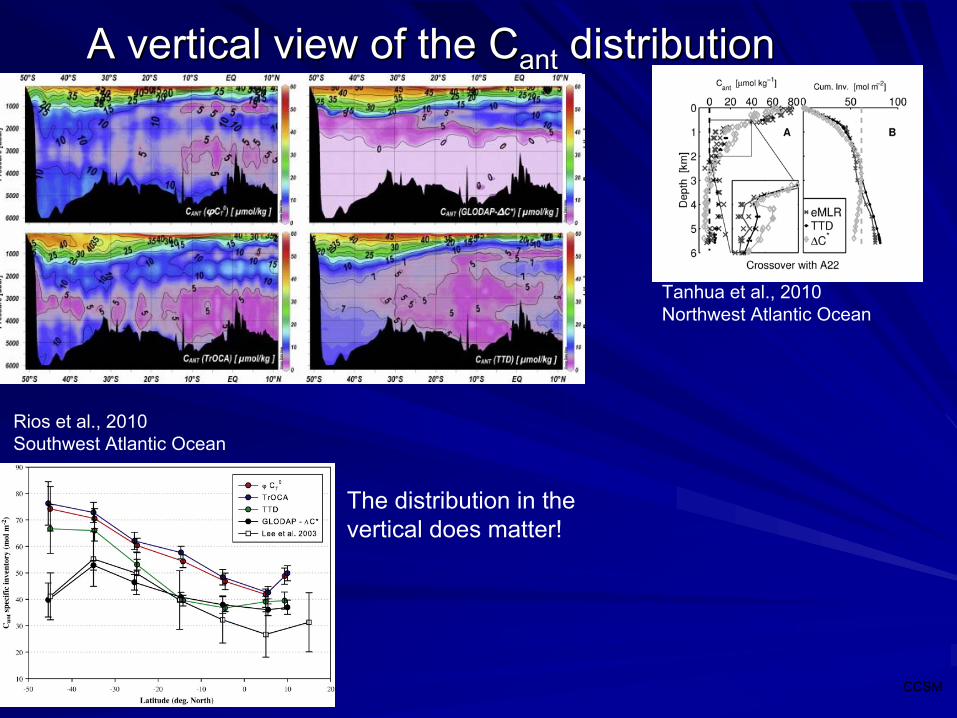
A vertical view of the CA vertical view of the Cantant distributiondistribution
Rios et al., 2010Southwest Atlantic Ocean
The distribution in the vertical does matter!
Tanhua et al., 2010Northwest Atlantic Ocean
CCSM
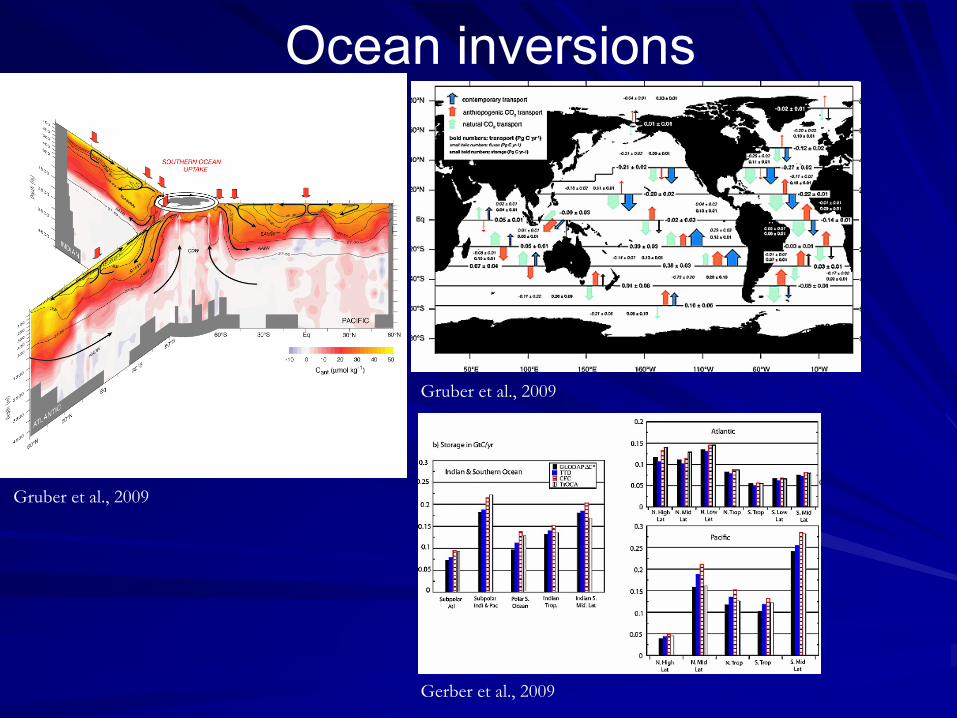
Gruber et al., 2009
Gruber et al., 2009
Ocean inversions
Gerber et al., 2009
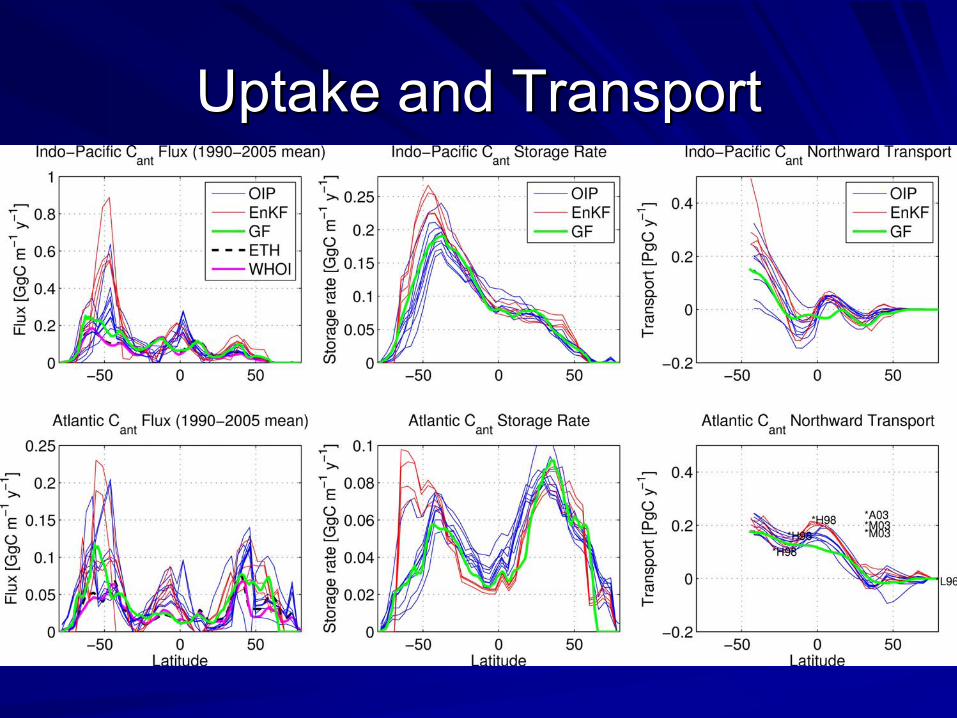
Uptake and TransportUptake and Transport
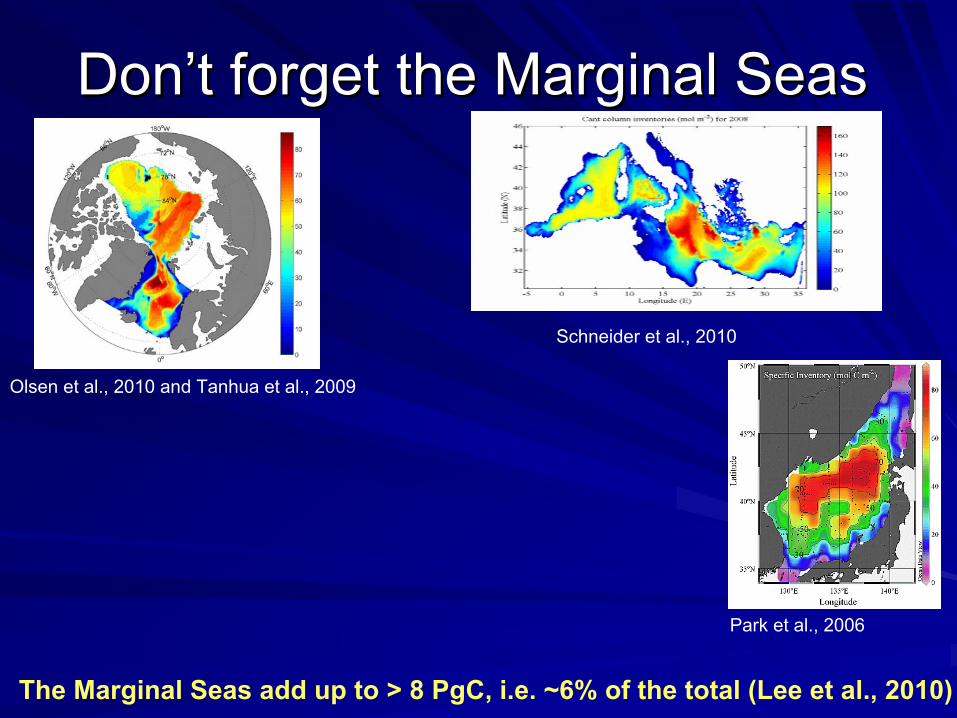
Don’t forget the Marginal SeasDon’t forget the Marginal Seas
Olsen et al., 2010 and Tanhua et al., 2009
Schneider et al., 2010
Park et al., 2006
The Marginal Seas add up to > 8 PgC, i.e. ~6% of the total (Lee et al., 2010)
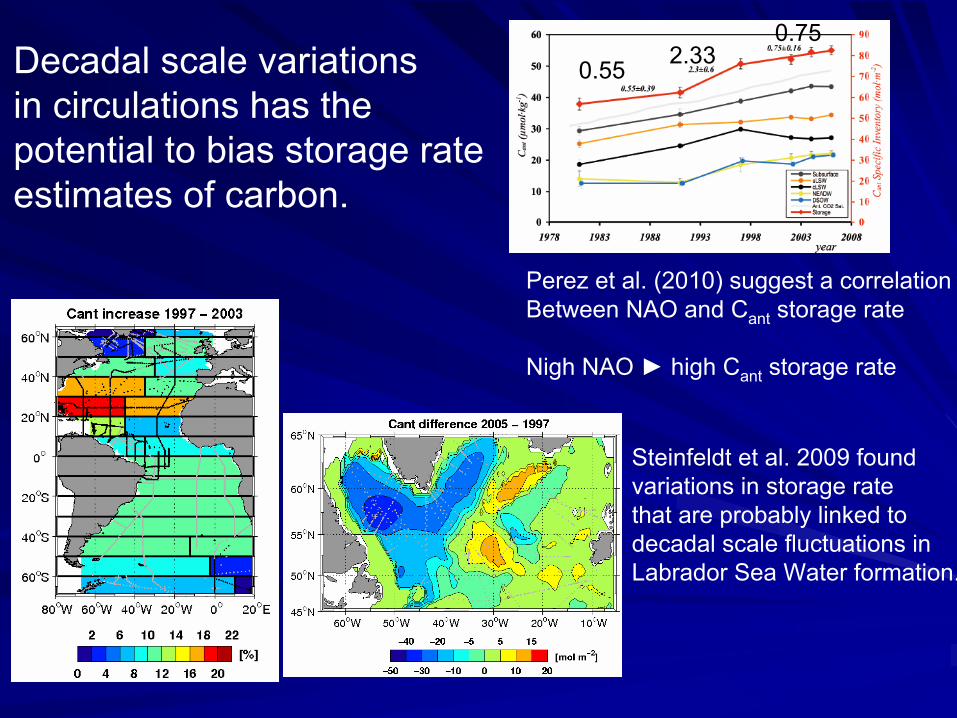
Perez et al. (2010) suggest a correlationBetween NAO and Cant storage rate
Nigh NAO high Cant storage rate
0.550.75
2.33
Steinfeldt et al. 2009 foundvariations in storage ratethat are probably linked todecadal scale fluctuations inLabrador Sea Water formation.
Decadal scale variationsin circulations has the potential to bias storage rate estimates of carbon.

Decreased Buffer Capacity
Warmer Ocean
CO2 Outgassing
DIC increase
Carbon Over-ConsumptionIncreased Carbon Export
Acidification
Reduced CalcificationLess CO2 Released During Calcification
Increased Stratification
Favored conditions for CoccolitophoresOver Diatoms
Increased Southern Ocean Winds
Increased Overturning ? ?
Denitrification Decreased Carbon Particle ExportNitrogen Fixation Increased Carbon Particle Export
Reduced Particle BallastLess Particle Flux
Extended Oxygen Minimum Zones
Increased Dissolution of Calcium Carbonate
Reduced MOCReduced Transport of Cant to the Deep Ocean
Reduced upwelling
Adapted from Sabine
Carbon feedbacks
Enhanced recycling of OM
Less nutrients available for PP

ChallengesChallengesThe current scientific paradigm is that anthropogenic CO2 is
entering the ocean as a passive thermodynamic response to rising atmospheric CO2. The current challenge for the scientific community is to determine whether these feedbacks are occurring and how they will modify the ability of the ocean to store Cant over the next few decades.
Sabine and Tanhua 2009
Sabine and Tanhua 2009
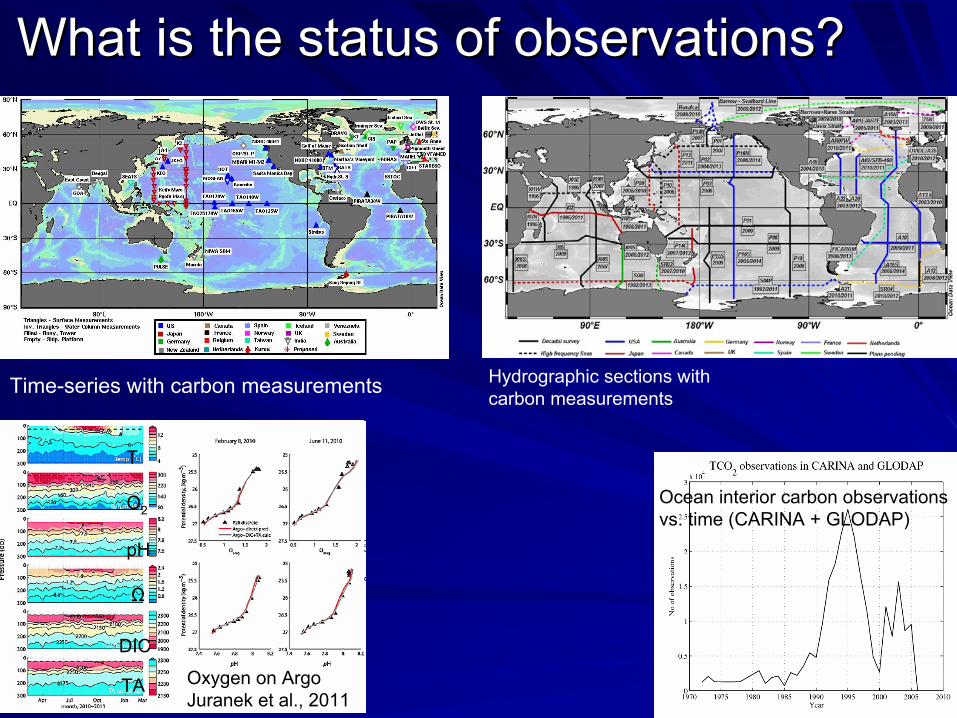
What is the status of observations?What is the status of observations?
Time-series with carbon measurements Hydrographic sections withcarbon measurements
Ocean interior carbon observationsvs. time (CARINA + GLODAP)
Oxygen on ArgoJuranek et al., 2011
T
O2
pH
Ω
DIC
TA

Interior carbon observationsInterior carbon observationsOcean interior observations remain the best mechanism for verifyOcean interior observations remain the best mechanism for verifying ing
the changes in ocean the changes in ocean CantCant inventory. It is extremely difficult to inventory. It is extremely difficult to predict how the many possible carbon cycle feedbacks will affectpredict how the many possible carbon cycle feedbacks will affectocean carbon storage; modeling and proxy techniques are limited ocean carbon storage; modeling and proxy techniques are limited by by our current understanding of the ocean carbon cycle. It is critiour current understanding of the ocean carbon cycle. It is critically cally important that we understand how important that we understand how CantCant is accumulating in the ocean is accumulating in the ocean on time scales relevant to human civilization (years to decades)on time scales relevant to human civilization (years to decades). . COCO22 emissions are growing at an ever increasing rate and the emissions are growing at an ever increasing rate and the momentum of the carbon and climate system is such that decisionsmomentum of the carbon and climate system is such that decisionsmade today will still impact the climate for hundreds to thousanmade today will still impact the climate for hundreds to thousands of ds of years from now. years from now.
The best way to improve our understanding is to continue using aThe best way to improve our understanding is to continue using abroad suite of approaches with both observations and models to broad suite of approaches with both observations and models to examine both ocean carbon uptake and ocean carbon storage over examine both ocean carbon uptake and ocean carbon storage over a range of time scales.a range of time scales.
Sabine and Tanhua 2009Sabine and Tanhua 2009