carbon and nitrogen trade-offs in biomass energy production
TRANSCRIPT
ORIGINAL PAPER
Carbon and nitrogen trade-offs in biomass energy production
Lidija Cucek • Jirı Jaromır Klemes •
Zdravko Kravanja
Received: 31 August 2011 / Accepted: 17 January 2012 / Published online: 28 February 2012
� Springer-Verlag 2012
Abstract This contribution provides an overview of
carbon (CFs) and nitrogen footprints (NFs) concerning
their measures and impacts on the ecosystem and human
health. The adversarial relationship between them is illus-
trated by the three biomass energy production applications,
which substitute fossil energy production applications:
(i) domestic wood combustion where different fossil
energy sources (natural gas, coal, and fuel oil) are sup-
plemented, (ii) bioethanol production from corn grain via
the dry-grind process, where petrol is supplemented, and
(iii) rape methyl ester production from rape seed oil via
catalytic trans-esterification, where diesel is supplemented.
The life cycle assessment is applied to assess the CFs and
NFs resulting from different energy production applica-
tions from ‘cradle-to-grave’ span. The results highlighted
that all biomass-derived energy generations have lower
CFs and higher NFs whilst, on the other hand, fossil
energies have higher CFs and lower NFs.
Keywords Carbon footprint � Nitrogen footprint � LCA �Biomass combustion � Bioethanol � Rape methyl ester
Abbreviations
C Carbon
CF Carbon footprint
DDGS Distiller’s dried grains with soluble
FP Footprint
GHG Greenhouse gas
GWP Global warming potential
HCFC Hydrochlorofluorocarbon
HFC Hydrofluorocarbon
HHV Higher heating value
LCA Life cycle assessment
Nr Reactive nitrogen
N Nitrogen
NF Nitrogen footprint
RME Rape methyl ester
US United States of America
Introduction
Insecure energy supply, high energy prices, emissions, and
ever-increasing energy demand are topics of increasing
importance in today’s society (Brandi et al. 2011; Toth
et al. 2011). It is anticipated that global energy consump-
tion will continue to rise by using predominantly fossil
fuels. In 2010, the total world energy consumption was
502.5 EJ (12 Gtoe). World primary energy consumption
grew by 5.6% in 2010. Oil remained the world’s leading
fuel. It represents 33.6% of global energy consumption,
coal accounted for 29.6%, natural gas for 23.8%, nuclear
energy for 5.2% and renewables just for 7.8% of global
energy consumption (BP 2011).
The mankind is rapidly exhausting fossil fuels, as a
consequence of which, in the future, people are going to
depend on non-fossil energy sources. The timing of a
global peak regarding oil production is less certain,
although there is a growing view that maximum production
will occur within the next decade (Curtis 2009). The global
L. Cucek (&) � J. J. Klemes
Centre for Process Integration and Intensification (CPI2),
Research Institute of Chemical and Process Engineering, Faculty
of Information Technology, University of Pannonia, Egyetem u.
10, 8200 Veszprem, Hungary
e-mail: [email protected]
Z. Kravanja
Faculty of Chemistry and Chemical Engineering, University
of Maribor, Smetanova ul 17, 2000 Maribor, Slovenia
123
Clean Techn Environ Policy (2012) 14:389–397
DOI 10.1007/s10098-012-0468-3

peak for coal extraction from the existing coalfields has
been predicted by Patzek and Croft (2010), to occur around
year 2011. Natural gas is performing slightly better, with
the world’s natural gas production peak being predicted
between 2025 and 2066 (Mohr and Evans 2011). Energy
crises, unusual climatic conditions, environmental deteri-
oration, etc., are urgent challenges being handled since the
turn of the twenty-first century (ZTE 2011). Green solu-
tions and environmental protection are becoming the
common issues of this century, and energy saving is
becoming the unavoidable responsibility of industries and
enterprises. However, developing clean and renewable
energy resources ranks as one of the greatest challenges
facing mankind in the medium to long term (Mata et al.
2011). No single energy technology or combination of
technologies exists that can address all challenges descri-
bed above in sustainable manner (Ma et al. 2011).
Also, the human-induced climate change and global
warming are recognised by many as the greatest environ-
mental threats for the twenty-first century (Abbott 2008;
Carter 2007). The main greenhouse gases (GHGs), the
concentrations of which are rising, are carbon dioxide
(CO2), methane (CH4), nitrous oxide (N2O), hydrochloro-
fluorocarbons (HCFCs), hydrofluorocarbons (HFCs) and
ozone (O3) in the lower atmosphere (WMO 2011). CO2 is
the single most important human-emitted GHG in the
atmosphere, contributing approximately 63.5% to the
overall global radiative forcing not considering water
vapour which is continuously within the Earth’s climatic
circulation (WMO 2009). Global dependence on fossil
fuels has led to the release of over 1,100 Gt of CO2 into the
atmosphere since the mid-nineteenth century. Energy-
related GHG emissions, mainly from fossil fuel combus-
tion for heat supply, electricity generation and transport
accounts for around 70% of total emissions, including CO2,
CH4 and some traces of nitrous oxide (N2O) (Sims et al.
2007). Other causes of global warming and climate change
are the clearing of forests, and agricultural activities.
The CO2 global average concentration in the Earth’s
atmosphere was about 388.54 ppm in 2010 (ESRL 2011).
Since the beginning of the industrial revolution in 1750, the
atmospheric concentration of CO2 has increased by
38.76%. The global average concentrations of CH4 and
N2O had reached 1,797 ppb and 321.8 ppb in 2008. They
were higher than those of pre-industrial times by 157 and
19%, respectively (WMO 2009).
Furthermore, the nitrogen (N) deposition represents a
serious threat to biodiversity as claimed by many
researchers, e.g. Hicks et al. (2011), and to the global
environment (Hartmann et al. 2007). N plays a beneficial
and key role in helping to feed the growing population, but
much anthropogenic N is lost into the air, water, and soil
and has a destructive effect on the ecosystem and human
health (Galloway et al. 2008). N emissions into the atmo-
sphere increased substantially over the twentieth century,
mainly in the form of ammonia (NH3) from agriculture and
nitrogen oxides (NOx) from industry (Hicks et al. 2011).
The amount of human-caused reactive or biologically
available reactive nitrogen (Nr) (all N species except N2)
within the global environment has increased by a factor of
12.5 (187 Mt N/y in 2005) since the nineteenth century (15
Mt N/y in 1860) and by a factor of 3.7 since the 1960s (50
Mt N/y), in association with the increased use of fertilizers
(Galloway et al. 2008; UCS 2009). Agriculture is respon-
sible for about 80% of the Nr produced worldwide (UCS
2009). More than half of the synthetic N fertilizer ever used
on the planet has been used since 1985 (Millennium Eco-
system Assessment 2005). Nr is also created by the burning
of fossil fuel and biomass, by manure run-off and by the
planting of legumes.
Several research studies have analysed the carbon
footprint (CF), its impact, minimisation, mitigation, and
even sequestration (Klemes et al. 2006). In ScienceDirect
1,647 articles can be found, most of them in the last
3–4 years (96%). On the other hand, only two studies can
be found on nitrogen footprint (NF), one from 2010 and
one from 2011. In Scopus 1,371 articles on CF can be
found (94% from 2008) and four for NF, two from 2010
and two from 2011. Only two studies have dealt with both,
CF and NF. Cucek et al. (2011) reviewed various footprints
(FPs) with special focus on adversarial relationship
between CF and NF, using a biomass combustion case
study. Xue and Landis (2010) studied nutrient flows during
food production, processing, packaging, and distribution
stages for different food types, then compared the CFs and
NFs for these food crops, and provided some solutions for
reducing N output.
However, some of the research studies performed have
not yet been covered by ScienceDirect and/or Scopus.
Bakshi (2011) and Bakshi and Singh (2011) reviewed the
carbon (C) and N cycles and FPs in industrial products and
investigated CF and NF for biofuels and the US economic
sector. They stressed that corn ethanol, switchgrass and
corn stover have high NF and low CF whilst, on the other
hand, petrol and diesel have low NF and high CF. Singh
and Bakshi (2011) proposed improved C and N metrics,
and compared the old and new CF and NF measures. These
authors studied CF/NF relationships during a bio-fuels case
study. Williams et al. (2006) quantified the resource use
and environmental burdens arising from the productions of
10 commodities. They also quantified a CF/NF for agri-
culture. In agriculture production, NF dominates. They
concluded that CF inadequately describes agriculture, since
it has CF/NF.
Biomass and bioenergy are widely considered as con-
tributors to sustainability (Thornkey et al. 2009; Ladanai
390 L. Cucek et al.
123
and Vinterback 2009). However some questions about their
sustainability have risen over recent years—from among
several works let us select at least a few (e.g. Johnson
2007; Zamboni et al. 2011; Sheehan 2009; Cherubini and
Strømman 2011). In ScienceDirect 37,047 articles can be
found containing the words ‘sustainab*’ and ‘biomass’,
23,520 articles of them also deal with C, 18,101 with N,
416 with CF, but no articles with NF. Often only one FP
(e.g. carbon) is considered (e.g. Manninen 2010; Yuttitham
et al. 2011; Lam et al. 2010a, b), which can lead to
incomplete decisions for sustainable deployment policies.
Several research studies have indicated that lower C
emissions can be achieved by utilizing biomass compared
with energy generated from fossil sources, but higher
amounts of N are emitted into the air and water (e.g.
Cherubini and Strømman 2011; Bauer 2008; Bakshi and
Singh 2011).
This paper starts with an overview of NF and CF defi-
nitions and measures, and is followed by an assessment of
those problems, and even threats, from growing CFs and
NFs. The adversarial relationships between them are pre-
sented on three biomass energy production applications
and suitable substituted fossil energy production applica-
tions: (i) wood logs when burned for heating purposes,
where natural gas, oil or coal are supplemented; (ii) bio-
ethanol, and (iii) biodiesel produced for fuels in passenger
cars, where petrol and diesel are supplemented. All three
case studies demonstrate lower CFs and higher NFs for
biomass energy, and, on the other hand, fossil energy
showed higher CFs and lower NFs.
Carbon and nitrogen footprints
Carbon footprint
CF has become the most covered environmental protection
indicator over the recent years by politicians, media and
consequently researchers (Wiedmann and Minx 2008; Lam
et al. 2010a). CF causes an imbalance within the C cycle. It
usually stands for the amount of CO2 and other GHGs
emitted over the full life cycle of a process or product (UK
POST 2006). The CF is quantified using indicators such as
the global warming potential—GWP (EC 2007), which
stands for the quantities of GHGs that contribute to global
warming and climate change, by considering a specific
time horizon, usually 100 years (IPPC 2009). The land-
based definition of CF stands for the land area required for
the sequestration of atmospheric fossils’ CO2 emissions
through afforestation (De Benedetto and Klemes 2009).
Wiedmann and Minx (2008) proposed that CF is a measure
of exclusive direct and indirect CO2 emissions over a life
cycle.
The following questions should be clarified (Wiedmann
and Minx 2008) because of the various and different def-
initions of CF:
(i) Should only C present in gas emissions be consid-
ered in CF?
(ii) Should the CF consider CO2 only, the most abundant
and potent GHG?
(iii) Should the CF be restricted to C-based gases?
(iv) Can the CF include substances molecules of which
do not contain C (e.g. NOx)?
(v) How the CF should be measured whether, in mass
units of CO2 equivalent, in mass units of CO2, in
mass units of C, per unit of mass, energy, or exergy,
per unit of area, or possibly per unit of time?
The three C gases—carbon monoxide (CO), CH4 and
CO2—are important atmospheric constituents affecting air
quality and the climate (Buchwitz et al. 2006).
CO2 is the most important anthropogenic GHG (IPPC
2007). Increases in CO2 are the single largest climate factor
in forcing contribution to global warming (The National
Academies 2008). CH4 is a GHG with a GWP of 25
(Forster et al. 2007). CH4 emissions have risen due to
agriculture and the usage of fossil fuels. CO is formed
when C in the fuels is not burned completely, and it is
highly toxic. It is a very important air pollutant affecting
local air quality. It can cause harmful health effects by
reducing oxygen delivery to the body’s organs and tissues
(US EPA 2011).
The term global warming considers the continuing rise
in the average temperature of the Earth’s atmosphere and
oceans. Many researchers assume that it is caused by the
increased concentrations of GHGs in the atmosphere
resulting, most likely, from human activities, such as
deforestation, other land use changes and the burning of
fossil fuels. The burning of fossil fuels releases additional
(not released by natural processes) CO2 into the atmo-
sphere. About half of this excess CO2 is absorbed by the
land and oceans, but the remainder accumulates within the
atmosphere and enhances the natural greenhouse effect
(Dilling et al. 2003).
It has been declared that the global average near-surface
atmospheric temperature had already risen by 0.78�C
during the twentieth century, with much of this warming
(0.61�C) occurring over the last 30 years (The National
Academies 2008). Temperatures are predicted to rise by at
least an additional 1.1–6.4�C over the next 100 years. This
warming would cause significant changes in sea level (an
increase of 0.18–0.59 m), ecosystems, the melting of gla-
ciers, the extent of ice and snow, precipitation, water
availability and the probable expansions of subtropical
deserts. Other consequences would include higher maxi-
mum temperatures, fewer colder days, changes in
Carbon and nitrogen trade-offs 391
123
agricultural yields, and an increase in infectious diseases.
Global warming and climate change may also be associated
with deterioration in humans’ health, more intense hurri-
canes, tropical cyclone activity, flooding, drought, wild-
fires, the insect populations, ocean acidification, etc. (The
National Academies 2008; IPPC 2007).
There are various ways of reducing CF (The National
Academies 2008; Levy 2010), such as through
(i) technological developments,
(ii) carbon capture and storage (CSS),
(iii) carbon offsetting,
(iv) reduced energy consumption,
(v) improved energy efficiency, etc.
Nitrogen footprint
N is essential for life. It is the most common element in the
Earth’s atmosphere and a primary component of crucial
biological molecules, including proteins and nucleic acids
such as DNA and RNA. Smil (2001) estimated that in the
mid-1990s, 40% of the global population were dependent
on crops fertilized with Nr. Since 1970 the world’s popu-
lation has increased by 78% and Nr production by 120%
(Galloway et al. 2008). Crops need large amounts of N to
grow, but only Nr can be readily used by most organisms,
including crops.
NF causes an imbalance within the N cycle. The total
NF is calculated as the amount of Nr released into the
environment as a result of human activities (N-Print 2011).
The primary N emission sources are transportation, agri-
culture, power plants and industry.
As a consequence of the growing demand for N and the
inefficiencies in N when used in agriculture, a large share
of the N applied in agriculture is lost to the environment
(UNESCO and SCOPE 2007; Galloway et al. 2003) as
N2O, nitric oxide (NO), NH3 or N2 into the atmosphere, or
to aquatic ecosystems as NO3- (Lal et al. 2011; Galloway
et al. 2003). NOx are produced during the combustion of
biomass or fossil fuels (Galloway et al. 2003).
N2O concentrations have risen primarily because of
agricultural activities and changes in land usage. It is the
largest ozone-depleting substance emitted because of
human activities (NOAA 2009); in the atmosphere, it is a
GHG with a GWP of 298 (Forster et al. 2007) and affects
humans’ health.
NOx emissions have increased by nearly 4 Mt/y. They
play an important role in those atmospheric reactions that
create harmful particulate matter, ground-level ozone
(smog), acid rain, and haze air pollution. They also con-
tribute to eutrophication, degradation in water quality,
causing to fish harm and affecting humans’ health (EDF
2002).
NH3 emissions are increasing rapidly in many parts of
the world as the result of human activities. They contribute
to high concentrations of fine particulate matter and affect
humans’ health, atmospheric visibility, and global radiative
balance. They have direct toxic effects on vegetation, and
atmospheric N deposition, leading to the eutrophication
and acidification of sensitive ecosystems (Sutton et al.
2009).
NO3- is one of the main contaminants causing serious
concern. It seeps into drinking water, where it can become
a health risk. It has been discovered that NO3- causes blue-
baby syndrome or methemoglobinemia and increases the
acidity of water (US EPA 2002). Excess NO3- concen-
trations in aquatic systems lead to eutrophication and algae
blooms (Bhatnagar and Sillanpaa 2011).
Excess N within ecosystems causes eutrophication, an
enhanced greenhouse effect, biodiversity loss, acidificat-
ion, etc. A unique feature is that Nr molecules released into
the environment can cause multiple effects within ecosys-
tems, and on humans’ health. An Nr atom that starts out as
part of NH3 in the Haber–Bosch process is used to produce
fertilizer. Nr is then partly incorporated within the crops
and then partly released as NH3, NO, N2O, N2 or NO3-.
The Nr species can rapidly be interconverted from one Nr
form to another (Galloway et al. 2003).
There are certain methods of reducing NF, through
(N-Print 2011; UCS 2009)
(i) reducing energy consumption,
(ii) changing diets to more sustainably prepared food
and fish,
(iii) consuming less meat,
(iv) reducing food-waste,
(v) crop genetic engineering,
(vi) traditional or enhanced breeding techniques,
(vii) precision farming, and
(viii) cover crops.
Case studies on biomass energy applications
Biomass is a renewable resource that is increasingly being
used to provide low carbon energy. It has potential to be
raw material for production of heat, electricity and trans-
port fuel (Thornkey et al. 2009). However, a review of
scientific studies reporting on biomass potentials showed
that maximum available potential of biomass for energy
purposes in next decades will be capable of around
10–50% fossil fuel substitution (Wenzel 2009). Three case
studies were performed on biomass energy when compared
to fossil energy. Wood is burned to produce heat; corn is
used for bioethanol production and rape seed oil for rape
methyl ester (RME) production. Life cycle assessment
392 L. Cucek et al.
123
(LCA) is used to assess those CFs and NFs associated with
all the stages of energy life cycles from ‘cradle-to-grave’.
The LCA covers the following C and N emissions: CO2,
CO, CH4, NOx, N2O, NO3- and NH3.
Domestic biomass combustion
Fossil-fuelled heat and electricity production are among the
major anthropogenic sources of CO2 emissions today, and
are responsible for the on-going climatic changes to a great
extent (Bauer 2008). Biomass as a fuel has advantages over
CF and GHG emissions, as the CO2 emitted during bio-
mass combustion is absorbed during the biomass growth.
However, heat from burning biomass (wood) produces the
highest NOx emissions.
The CF in this study is composed only of direct and
indirect CO2 emissions, as proposed by Wiedmann and
Minx (2008). NF accounts for NOx which represent the
majority of N emissions (NH3, NOx, N2O). CFs and NFs
from the combustion of wood, natural gas, fuel oil and coal
are presented in Table 1. Both the CFs and NFs were
mostly obtained using the LCA software package GaBi�
(PE, LBP 2011) and the Ecoinvent database (Frischknecht
et al. 2007).
CF and NF from biomass- and fossil-fuelled appliances
differ depending on the emission control at the power
plants, the origins of the fossil fuels, the transportation
mode and the distance of the wood to the user (Bauer
2008). NOx emissions vary significantly among combustion
facilities depending on their design and control. CF from
domestic wood combustion is almost carbon neutral, and
coal has the highest CO2 emissions. Concerning NOx
emissions, natural gas shows the best performance of all
fuel alternatives. Oil and coal burnings cause relatively low
direct NOx emissions. Wood fuel has higher NOx emissions
due to their high N content.
First generation biofuel’s production
The transportation sector relies almost exclusively on
petroleum-based fuels, and about 30% of the world’s fossil
fuel consumption is related to transport. The reduction of
fossil energy reserves and the associated environmental
impact are the two main reasons that lead to considering
the use of alternative fuels within the transportation sector
(Jungbluth et al. 2007). The most used feedstocks for the
current first generation bio-fuel’s production are corn,
wheat, and sugarcane for bioethanol, and soybean, rape
seed and sunflower for biodiesel production. The major
problem is that these feedstocks are also used for food and
feed production. This has been pointed out by Sikdar
(2007) and later by others, e.g. Ajanovic (2011), Kravanja
et al. (2011). The production of fuel from food crops
threatens the safety of food supply and increases the prices
of food, while it only insignificantly increases the share of
biofuels in the world’s total fuel consumption (Winterton
2011). An increase of cultivated fields may lead to biodi-
versity loss, due to the conversion of land not currently in
crop production, such as forest and grassland (Mata et al.
2011). There are also other issues, such as the lower energy
content of biomass per unit of volume compared with oil,
limitations of water availability, and the need to migrate
from the cities to countryside (Winterton 2011).
CFs and NFs from the first generation biofuel chains are
caused throughout all stages of the bio-fuels supply chains.
A petrol- and diesel-fuelled vehicle operation is also
included in the system’s boundary to estimate the differ-
ences in environmental impacts between bioethanol-fuelled
and petrol-fuelled vehicle operations and between RME-
fuelled and diesel-fuelled vehicle operations.
The amounts of biofuels and petroleum-based fuels
substituted by biofuels were evaluated according to the
ratio of their higher heating values (HHVs). The functional
unit of the product systems is 1 GJ of the produced energy.
This study was performed mostly using the LCA soft-
ware package GaBi� (PE, LBP 2011) and Ecoinvent
database (Frischknecht et al. 2007; Jungbluth et al. 2007;
Nemecek and Kagi 2007; Spielmann et al. 2007).
Bioethanol production from corn grain
The most widely used biofuel for transportation worldwide
is bioethanol (IEA 2007). Global bioethanol production
reached 87.1 GL in 2010 (RFA 2011). Approximately 60%
of bioethanol production came from the US. Most ethanol
fuels in the US are made from corn in dry-mill plants
(Wang 2005; Aden 2007).
This case study of bioethanol production from corn
grain was applied to the US conditions. The corn grain is
mainly composed of starch which is milled, slurred with
water, and then hydrolysed into sugars by liquefaction and
saccharification. The sugars are fermented into ethanol
using yeast. The solids are separated from the liquid phase
(mainly ethanol and water), dried, and the co-product dis-
tiller’s dried grains with soluble (DDGS) is obtained. This
can be used as livestock feed. Ethanol recovery is done by
Table 1 Emissions of CO2 and NOx into the air for different types of
fuel (kg/GJ)
CO2 NOx
Wood logs 1.4–4.2 0.21–0.24
Natural gas 61–78 0.028–0.069
Fuel oil 83–97 0.069–0.097
Coal 111–139 0.125–0.167
Carbon and nitrogen trade-offs 393
123

distillation column systems, and through the adsorption of
water on corn grits and/or molecular sieves (Karuppiah
et al. 2008).
The system’s boundary includes corn cultivation,
transportation of corn grain and chemicals, the dry-grind
process, the distribution of bioethanol, plus the bioethanol-
fuelled vehicle operation.
The purity of ethanol fuel (E100), as used in passenger
cars, the so-called flex-vehicles (Brandi et al. 2011), was
assumed to be a fair comparison with petrol. Since no data
were available for E100 passenger car emissions, the
exhaust emissions from the ethanol-fuelled cars were
assumed to be the same as those emissions from the bio-
mass-derived methanol-fuelled cars.
Rape methyl ester production from rape seed oil
Global biodiesel production in 2009 amounted to 17.9 GL,
whilst within the European Union (EU), the biodiesel
production reached 10.2 GL (57%) (Biofuels Platform
2011). Most biodiesels in Europe are made from rape seed
oil (Gupta and Demirbas 2010; Ajanovic 2011).
This case study for RME production from rape seed oil
was applied to European conditions. The rape seed oil is
extracted from rape seed using a solvent (usually hexane).
Solid by-product rape seed meal is mostly used as animal
feed. Most of the biodiesel produced today is made via the
base-catalysed trans-esterification (Gupta and Demirbas
2010). The oil reacts with an alcohol (usually methanol) in
the presence of a catalyst (usually potassium or sodium
hydroxide) to form mono-alkyl esters (biodiesel) and crude
glycerol. Biodiesel and glycerol form two separate layers
allowing the glycerol to be drawn off from the bottom of
the settling vessel. The excess alcohol is removed using a
flash evaporation process or by distillation. The product
from the rape seed oil and methanol is RME.
The system’s scope includes rape seed cultivation,
transportation of rape seed to oil mill, extraction and
refinement of the rape seed oil within the oil mill, the trans-
esterification process, distribution of RME, and also the
RME-fuelled vehicle operations.
The purity of the RME (B100), as used in passenger
cars, was assumed to be a fair comparison with diesel.
Since no data were available for the B100 passenger car
emissions, the exhaust emissions from the RME-fuelled
cars were assumed to be the same as the exhaust emissions
from a RME-fuelled 28-t lorry. Only NOx emissions were
adjusted with an increase of 15% compared with diesel-
fuelled passenger cars (Roy 2011).
Comparisons of footprints for biofuels and fossil fuels
Bioethanol is used as a substitute for petrol, and RME for
diesel fuel which would otherwise be used in the same
engine. Table 2 presents HHVs and those C and N emis-
sions that originated from the whole life cycles of RME,
corn-based ethanol, diesel and petrol. In Fig. 1, the C and
N emissions are presented on a relative scale.
CFs and NFs from biofuels are different depending on
the biomass yield, its moisture and starch or oil content,
nitrogen fertilizer types and levels, harvesting, distances of
biomass to bio-refinery, biofuel to service station, type of
passenger car, conversion rates in biofuel production, etc.
From Table 2 and Fig. 1, it can be seen that CO2
emissions are lower for biofuels compared with fossil fuels
by approximately 41%. Also emissions of CO are lower,
especially CO emissions from ethanol-fuelled passenger
cars, and are 84% lower than those of petrol-fuelled cars.
CH4 emissions are slightly lower for fossil fuels, by
10–15%. NOx emissions are the highest for RME and the
Table 2 HHVs and C and N emissions for transportation fuels
MJ/kg kg CO2/GJ kg CO/GJ kg CH4/GJ kg NOx/GJ kg N2O/GJ kg NO3-/GJ kg NH3/GJ
RME 40.2 56.44 0.128 0.097 0.485 0.1158 1.468 0.128
Ethanol 29.8 57.74 0.1097 0.1105 0.232 0.068 2.929 0.129
Diesel 45.9 95.79 0.157 0.087 0.332 0.0033 0.0013 0.00309
Petrol 46.7 97.78 0.689 0.094 0.248 0.0049 0.0013 0.0112
0
0.2
0.4
0.6
0.8
1
CO
RME
Ethanol
Diesel
Petrol
CO2
CH4
NOx
NH3
NO3-
N2O
Fig. 1 Graphical representation of C and N emissions for transpor-
tation fuels
394 L. Cucek et al.
123
lowest for ethanol (52% lower). All other N emissions,
N2O, NO3- and NH3 are much lower for diesel and petrol
compared with biofuels, by at least 93, 99.9 and 97.6%,
respectively.
Because of more than one C and N emissions, the CFs
and NFs from transportation fuels are also presented in
mass units of C and N per GJ, where NOx is expressed as
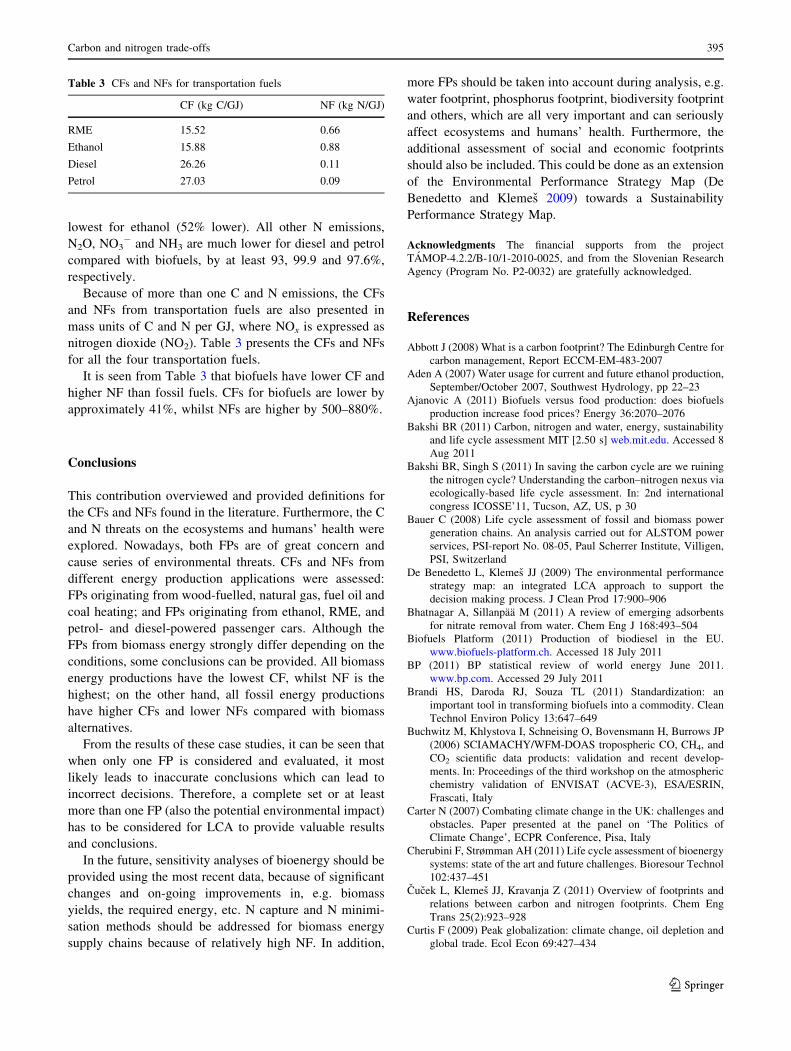
nitrogen dioxide (NO2). Table 3 presents the CFs and NFs
for all the four transportation fuels.
It is seen from Table 3 that biofuels have lower CF and
higher NF than fossil fuels. CFs for biofuels are lower by
approximately 41%, whilst NFs are higher by 500–880%.
Conclusions
This contribution overviewed and provided definitions for
the CFs and NFs found in the literature. Furthermore, the C
and N threats on the ecosystems and humans’ health were
explored. Nowadays, both FPs are of great concern and
cause series of environmental threats. CFs and NFs from
different energy production applications were assessed:
FPs originating from wood-fuelled, natural gas, fuel oil and
coal heating; and FPs originating from ethanol, RME, and
petrol- and diesel-powered passenger cars. Although the
FPs from biomass energy strongly differ depending on the
conditions, some conclusions can be provided. All biomass
energy productions have the lowest CF, whilst NF is the
highest; on the other hand, all fossil energy productions
have higher CFs and lower NFs compared with biomass
alternatives.
From the results of these case studies, it can be seen that
when only one FP is considered and evaluated, it most
likely leads to inaccurate conclusions which can lead to
incorrect decisions. Therefore, a complete set or at least
more than one FP (also the potential environmental impact)
has to be considered for LCA to provide valuable results
and conclusions.
In the future, sensitivity analyses of bioenergy should be
provided using the most recent data, because of significant
changes and on-going improvements in, e.g. biomass
yields, the required energy, etc. N capture and N minimi-
sation methods should be addressed for biomass energy
supply chains because of relatively high NF. In addition,
more FPs should be taken into account during analysis, e.g.
water footprint, phosphorus footprint, biodiversity footprint
and others, which are all very important and can seriously
affect ecosystems and humans’ health. Furthermore, the
additional assessment of social and economic footprints
should also be included. This could be done as an extension
of the Environmental Performance Strategy Map (De
Benedetto and Klemes 2009) towards a Sustainability
Performance Strategy Map.
Acknowledgments The financial supports from the project
TAMOP-4.2.2/B-10/1-2010-0025, and from the Slovenian Research
Agency (Program No. P2-0032) are gratefully acknowledged.
References
Abbott J (2008) What is a carbon footprint? The Edinburgh Centre for
carbon management, Report ECCM-EM-483-2007
Aden A (2007) Water usage for current and future ethanol production,
September/October 2007, Southwest Hydrology, pp 22–23
Ajanovic A (2011) Biofuels versus food production: does biofuels
production increase food prices? Energy 36:2070–2076
Bakshi BR (2011) Carbon, nitrogen and water, energy, sustainability
and life cycle assessment MIT [2.50 s] web.mit.edu. Accessed 8
Aug 2011
Bakshi BR, Singh S (2011) In saving the carbon cycle are we ruining
the nitrogen cycle? Understanding the carbon–nitrogen nexus via
ecologically-based life cycle assessment. In: 2nd international
congress ICOSSE’11, Tucson, AZ, US, p 30
Bauer C (2008) Life cycle assessment of fossil and biomass power
generation chains. An analysis carried out for ALSTOM power
services, PSI-report No. 08-05, Paul Scherrer Institute, Villigen,
PSI, Switzerland
De Benedetto L, Klemes JJ (2009) The environmental performance
strategy map: an integrated LCA approach to support the
decision making process. J Clean Prod 17:900–906
Bhatnagar A, Sillanpaa M (2011) A review of emerging adsorbents
for nitrate removal from water. Chem Eng J 168:493–504
Biofuels Platform (2011) Production of biodiesel in the EU.
www.biofuels-platform.ch. Accessed 18 July 2011
BP (2011) BP statistical review of world energy June 2011.
www.bp.com. Accessed 29 July 2011
Brandi HS, Daroda RJ, Souza TL (2011) Standardization: an
important tool in transforming biofuels into a commodity. Clean
Technol Environ Policy 13:647–649
Buchwitz M, Khlystova I, Schneising O, Bovensmann H, Burrows JP
(2006) SCIAMACHY/WFM-DOAS tropospheric CO, CH4, and
CO2 scientific data products: validation and recent develop-
ments. In: Proceedings of the third workshop on the atmospheric
chemistry validation of ENVISAT (ACVE-3), ESA/ESRIN,
Frascati, Italy
Carter N (2007) Combating climate change in the UK: challenges and
obstacles. Paper presented at the panel on ‘The Politics of
Climate Change’, ECPR Conference, Pisa, Italy
Cherubini F, Strømman AH (2011) Life cycle assessment of bioenergy
systems: state of the art and future challenges. Bioresour Technol
102:437–451
Cucek L, Klemes JJ, Kravanja Z (2011) Overview of footprints and
relations between carbon and nitrogen footprints. Chem Eng
Trans 25(2):923–928
Curtis F (2009) Peak globalization: climate change, oil depletion and
global trade. Ecol Econ 69:427–434
Table 3 CFs and NFs for transportation fuels
CF (kg C/GJ) NF (kg N/GJ)
RME 15.52 0.66
Ethanol 15.88 0.88
Diesel 26.26 0.11
Petrol 27.03 0.09
Carbon and nitrogen trade-offs 395
123

Dilling L, Doney SC, Edmonds J, Gurney KR, Harriss R, Schimel D,
Stephens B, Stokes G (2003) The role of carbon cycle
observations and knowledge in carbon management. Annu Rev
Environ Resour 28:521–558
EC (European Commission) (2007) Carbon footprint—what it is and
how to measure it. lca.jrc.ec.europa.eu. Accessed 11 Feb 2011
EDF (Environmental Defense Fund) (2002) Nitrogen oxides: how
NOx emissions affect human health and the environment.
apps.edf.org. Accessed 8 Aug 2011
ESRL (Earth System Research Laboratory, Global Monitoring
Division) (2011) Trends in atmospheric carbon dioxide.
www.esrl.noaa.gov. Accessed 30 Aug 2011
Forster P, Ramaswamy V, Artaxo P, Berntsen T, Betts R, Fahey DW,
Haywood J, Lean J, Lowe DC, Myhre G, Nganga J, Prinn R,
Raga G, Schulz M, Van Dorland R (2007) Changes in
atmospheric constituents and in radiative forcing. In: Solomon
S, Qin D, Manning M, Chen Z, Marquis M, Averyt KB, Tignor
M, Miller HL (eds) Climate change 2007: the physical science
basis. Contribution of Working Group I to the Fourth Assess-
ment Report of the Intergovernmental Panel on Climate Change.
Cambridge University Press, Cambridge, United Kingdom and
New York, US
Frischknecht R, Jungbluth N, Althaus HJ, Doka G, Heck T, Hellweg
S, Hischier R, Nemecek T, Rebitzer G, Spielmann M, Wernet G
(2007) Overview and methodology, ecoinvent report no. 1, Swiss
Centre for life cycle inventories, Dubendorf, Switzerland
Galloway JN, Aber JD, Erisman JW, Seitzinger SP, Howarth RW,
Cowling EB, Cosby BJ (2003) The nitrogen cascade. Bioscience
53(4):341–356
Galloway JN, Townsend AR, Erisman JW, Bekunda M, Cai Z, Freney
JR, Martinelli LA, Seitzinger SP, Sutton MA (2008) Transfor-
mation of the nitrogen cycle: recent trends, questions, and
potential solutions. Science 320:889–892
Gupta RB, Demirbas A (2010) Gasoline diesel and ethanol biofuels
from grasses and plants. Cambridge University Press, New York
Hartmann M, Hediger W, Peter S (2007) Reducing nitrogen losses
from agricultural systems—an integrated economic assessment.
In: 47th annual conference of the GEWISOLA (German
Association of Agricultural Economists) and the 17th annual
conference of the OGA (Austrian Association of Agricultural
Economists), ‘Changing Agricultural and Food Sector’, Freising/
Weihenstephan, Germany
Hicks WK, Whitfield CP, Bealey WJ, Sutton MA (eds) (2011)
Nitrogen deposition and natura 2000: science & practice in
determining environmental impacts. COST729/Nine/ESF/CCW/
JNCC/SEI Workshop Proceedings, published by COST.
cost729.ceh.ac.uk/n2kworkshop. Accessed 8 Aug 2011
IEA (International Energy Agency) (2007) Biofuel production.
www.iea.org. Accessed 9 Aug 2011
IPPC (Intergovernmental Panel on Climate Change) (2007) Climate
change 2007: synthesis report. www.ipcc.ch. Accessed 8 Aug 2011
IPPC (Intergovernmental Panel on Climate Change) (2009) IPCC
expert meeting on the science of alternative metrics, Meeting
report, Oslo, Norway
Johnson FX (2007) Bioenergy and the sustainability transition: from
local resource to global commodity, prepared for the World
Energy Congress (WEC), Rome, Italy. www.fao.org. Accessed 8
Aug 2011
Jungbluth N, Chudacoff M, Dauriat A, Dinkel F, Doka G, Faist
Emmenegger M, Gnansounou E, Kljun N, Schleiss K, Spielmann
M, Stettler C, Sutter J (2007) Life cycle inventories of bioenergy,
ecoinvent report no. 17, Swiss Centre for life cycle inventories,
Dubendorf, Switzerland
Karuppiah R, Peschel A, Grossmann IE, Martın M, Martinson W,
Zullo L (2008) Energy optimization for the design of corn-based
ethanol plants. AIChE J 54(6):1499–1525
Klemes JJ, Cockerill T, Bulatov I, Shackley S, Gought C (2006)
Engineering feasibility of carbon dioxide capture and storage,
Chapter In: Cough C, Shackley S (eds) Carbon capture and its
storage: an integrated assessment, Ashgate Publishing Ltd,
Aldershot, pp 43–82
Kravanja P, Konighofer K, Canella L, Jungmeier G, Friedl A (2011)
Perspectives for the production of bioethanol from wood and
straw in Austria: technical, economic, and ecological aspects,
Clean Technologies and Environmental Policy. doi:10.1007/
s10098-011-0438-1
Ladanai S, Vinterback J (2009) Global potential of sustainable
biomass for energy. Swedish university of Agricultural Sciences,
Department of Energy and Technology, Uppsala, Sweden
Lal R, Delgado JA, Groffman PM, Millar N, Dell C, Rotz A (2011)
Management to mitigate and adapt to climate change. J Soil
Water Conserv 66(4):276–285
Lam HL, Varbanov P, Klemes JJ (2010a) Minimising carbon
footprint of regional biomass supply chains. Resour Conserv
Recycl 54:303–309
Lam HL, Varbanov P, Klemes JJ (2010b) Optimisation of regional
energy supply chains utilising renewables: P-graph approach.
Comput Chem Eng 34:782–792
Levy C (2010) A 2020 low carbon economy, a knowledge economy
programme report, The Work Foundation, London, UK
Ma L, Liu P, Li Z, Ni W (2011) Integrated energy strategy for the
sustainable development in China. Energy 36:1143–1154
Manninen K (2010) Effect of forest-based biofuels production on
carbon footprint, case: integrated LWC paper mill, MSc
Dissertation, Lappeenranta University of Technology, Helsinki,
Finland
Mata TM, Martins AA, Sikdar SK, Costa CAV (2011) Sustainability
considerations of biodiesel based on supply chain analysis. Clean
Technol Environ Policy 13:655–671
Millennium Ecosystem Assessment (2005) Ecosystems and human
well-being: synthesis. Island Press, Washington, DC, USA
Mohr SH, Evans GM (2011) Long term forecasting of natural gas
production. Energy Policy 33(9):5550–5560
Nemecek T, Kagi T (2007) Life cycle inventories of Swiss and
European agricultural production systems, final report ecoinvent
V2.0 No. 15a, Swiss Centre for life cycle inventories, Zurich and
Dubendorf, Switzerland
NOAA (National Oceanic and Atmospheric Administration) (2009)
NOAA Study Shows Nitrous Oxide Now Top Ozone-Depleting
Emission. www.noaanews.noaa.gov. Accessed 8 Aug 2011
N-Print (2011) www.n-print.org. Accessed 12 Feb 2011
Patzek TW, Croft GD (2010) A global coal production forecast with
multi-Hubbert cycle analysis. Energy 35:3109–3122
PE, LBP (2011) GaBi 4, software-system and databases for life cycle
engineering, Stuttgart, Echterdingen, Germany, 1992–2008.
www.gabi-software.com
RFA (Renewable Fuels Association) (2011) World fuel ethanol
production. www.ethanolrfa.org. Accessed 1 Aug 2011
Roy MM (2011) Performance and emissions of a diesel engine fueled
by diesel-biodiesel blends with special attention to exhaust odor.
Can J Mech Sci Eng 2(1):1–10
Sheehan JJ (2009) Biofuels and the conundrum of sustainability. Curr
Opin Biotechnol 20:318–324
Sikdar SK (2007) Sustainability perspective and chemistry-based
technologies. Ind Eng Chem Res 46:4727–4733
Sims REH, Schock RN, Adegbululgbe A, Fenhann J, Konstantina-
viciute I, Moomaw W, Nimir HB, Schlamadinger B, Torres-
Martınez J, Turner C, Uchiyama Y, Vuori SJV, Wamukonya N,
Zhang X (2007) Energy supply. In: Metz B, Davidson OR,
Bosch PR, Dave R, Meyer LA (eds) Climate Change 2007:
mitigation, contribution of working group III to the fourth
assessment report of the intergovernmental panel on climate
396 L. Cucek et al.
123

change. Cambridge University Press, Cambridge, United King-
dom and New York, NY, US
Singh S, Bakshi RB (2011) Towards improved C and N footprints and
understanding their nexus, 2011 AIChE Annual Meeting, p. 211
D, Minneapolis, MN, US
Smil V (2001) Enriching the Earth: Fritz Haber, Carl Bosch and the
Transformation of World Food Production, MIT Press, Cam-
bridge, Massachusetts, US
Spielmann M, Bauer C, Dones R, Tuchschmid M (2007) Transport
services, ecoinvent report No. 14, Swiss Centre for life cycle
inventories, Dubendorf, Switzerland
Sutton MA, Reis S, Baker SMH (2009) Atmospheric ammonia,
detecting emission changes and environmental impacts, Results
of an expert workshop under the convention on long-range
transboundary air pollution, Springer Science ? Business Media
BV
The National Academies (2008) Understanding and responding to
climate change, Highlights of National Academies Reports, 2008
Edition. americasclimatechoices.org. Accessed 8 Aug 2011
Thornkey P, Upham P, Tomei J (2009) Sustainability constraints on
UK bioenergy development. Energy Policy 37(12):5623–5635
Toth C, Baladincz P, Kovacs S, Hancsok J (2011) Producing clean
diesel fuel by co-hydrogenation of vegetable oil with gas oil.
Clean Technol Environ Policy 13:581–585
UCS (Union of Concerned Scientists) (2009) NO SURE FIX,
Prospects for reducing nitrogen fertilizer pollution through
genetic engineering. www.ucsusa.org. Accessed 7 Aug 2011
UK POST (Parliamentary Office of Science and Technology) (2006)
Carbon footprint of electricity generation, No 268
UNESCO and SCOPE (2007) Human alteration of the nitrogen cycle:
threats, benefits and opportunities, April 2007, No. 4, UNESCO-
SCOPE, Paris, France
US EPA (Environmental Protection Agency) (2002) Nitrogen:
multiple and regional impacts. www.epa.gov. Accessed 7 Aug
2011
US EPA (Environmental Protection Agency) (2011) Health effects of
pollution. www.epa.gov. Accessed 29 July 2011
Wang M (2005) Updated energy and greenhouse gas emission results
of fuel ethanol. In: Proceedings of the 15th international
symposium on alcohol fuels. September 26–28, 2005, San Diego,
CA, US
Wenzel H (2009) Biofuels: the good, the bad, the ugly—and the
unwise policy. Clean Technol Environ Policy 11:143–145
Wiedmann T, Minx J (2008) A definition of ‘carbon footprint’. In:
Pertsova CC (ed) Ecological economics research trends: Ch 1,
1-11, Nova Science Publisher, Hauppauge, NY, US
Williams AG, Audsley E, Sandars DL (2006) Determining the
environmental burdens and resource use in the production of
agricultural and horticultural commodities, Main Report, Defra
Research Project IS0205, Bedford: Cranfield University and
Defra, UK
Winterton N (2011) Scalability and scientific due diligence. Clean
Technol Environ Policy 13:643–646
WMO (World Meteorological Organization) (2009) Greenhouse Gas
Bulletin, The state of greenhouse gases in the atmosphere using
global observations through 2008. http://www.wmo.int. Acces-
sed 8 Aug 2011
WMO (World Meteorological Organization) (2011) GAW green-
house gas research. http://www.wmo.int. Accessed 8 Aug 2011
Xue X, Landis AE (2010) Eutrophication potential of food consump-
tion patterns. Environ Sci Technol 44(16):6450–6456
Yuttitham M, Gheewala SH, Chidthaisong A (2011) Carbon footprint
of sugar produced from sugarcane in eastern Thailand. J Clean
Prod. doi:10.1016/j.jclepro.2011.07.017
Zamboni A, Murphy RJ, Woods J, Bezzo F, Shah N (2011) Biofuels
carbon footprints: whole-systems optimisation for GHG emis-
sions reduction. Bioresour Technol 102:7457–7465
ZTE (2011) ZTE Green technology Innovations White Paper
wwwen.zte.com.cn/en/. Accessed 26 Dec 2011
Carbon and nitrogen trade-offs 397
123