carbachol-activated calcium entry into ht-29 cells is regulated by
TRANSCRIPT

Proc. Nati. Acad. Sci. USAVol. 89, pp. 1438-1442, February 1992Physiology
Carbachol-activated calcium entry into HT-29 cells is regulated byboth membrane potential and cell volume
(secretory epithelium/colon carcinoma cells/ftra-2 imaging)
HORST FISCHER*t, BEATE ILLEK*, PAUL A. NEGULESCU*, WOLFGANG CLAUSSt, AND TERRY E. MACHEN**Department of Molecular and Cell Biology, Division of Cell and Developmental Biology, 231 Life Science Addition, University of California, Berkeley, CA94720; and tInstitut fur Veterinarphysiologie, Freie Universitut Berlin, Koserstrasse 20, 1000 Berlin 33, Federal Republic of Germany
Communicated by Jared M. Diamond, November 1, 1991
ABSTRACT Intracellular Ca2+ ([Ca2+fj) was measured insingle Cl1-secretory HT-29/B6 colonic carcinoma cells withthe Ca2+ probe fura-2 and digital imaging microscopy. Resting[C:a2i was 63 ± 3 nM (a = 62). During treatment with themuscarinc agonist carbachol, [Ca2+J rapidly increased to 901± 119 nM and subsequently reached a stable level of 309 :± 23OM, which depended on Ca2+ entry into the cells from theextracellular solution. The goal of this study was to characterizethe Ca+ entry pathway across the cell membrane with respectto its dependence on membrane potential and cell volume.Under resting conditions [Ca2i+] showed no apparent depen-dence on either potential or cell volume. After stimulating Ca2+entry with carbachol (100 jEM), [Ca2J1 increased with hyper-polarization (low-K+ or valinomycin treatment) and decreasedwith depolarization (high-V+ or gamlcdin treatment) of thecell, as expected from changes w driving force for Ca2+ entry.In stimulated cells, hypotonic solutions caused LCa2+1 toIncrease, whereas hypertonic solutions blocked Ca2+ entry.The shrinkage-induced decreases-in [Ca2+1 were only slightlyaffected when the membrane potential was increased withvalinomycin, suggesting that shnkage directly affects thecarbachol-activated Caz+ conductance. In contrast, the swell-ing-induced increase in [Ca2 was significantly reduced invalinomycin-treated cells, suggesting an indirect dependenceon a swelling-activated K+ conductance. Thus, carbachol-stimulated Ca2+ entry is under the dual control of membranepotential and cell volume. This mechanism may serve as aregulatory influence that determines the extent of Ca2+ influxduring cholinergic stimulation.
Many nonexcitable cells, including epithelial cells, respondto stimulation by muscarinic agonists with a biphasic eleva-tion of intracellular Ca2+ concentration ([Ca2+]j). The initialtransient phase (peak) is due to release of intracellular Ca2+stores, whereas a secondary, sustained elevation of [Ca2 ]i(plateau) is maintained by Ca2+ entry from the extracellularspace into the cytosol (1, 2). Ca channels responsible for Ca2+entry into epithelial cells are, in contrast to their relatives inexcitable cells, characterized by their insensitivity to voltageand- the organic dihydropyridine blockers (3). In epithelialcells, Ca2+ increases mediated by these channels can regulatesecretory responses (e.g., refs. 1 and 4). Thus, regulation ofthis Ca2+ entry pathway is important in controlling secretion.We investigated the effects of membrane potential and cell
volume on Ca2+ entry because these parameters are knownto change with the activation of secretion. For example,epithelial cell potential is dominated by a K+ conductance,which is regulated to accommodate transcellular ion trans-port while maintaining the intracellular ionic milieu (5). InCl--secreting cells, [Ca2+]J directly activates both K+ andCl- conductance's (6), and carbachol induces a transient
The publication costs of this article were defrayed in part by page chargepayment. This article must therefore be hereby marked "advertisement"in accordance with 18 U.S.C. §1734 solely to indicate this fact.
depolarization in Cl--secreting HT-29 cells (7). Becausechanging the membrane potential would affect the drivingforce for Ca2l entry (8), the possibility of a regulatoryfeedback between [Ca2+]j and ionic conductances exists.With regard to cell volume, the activation of ion channels
for K+ and Cl- could lead to cell shrinkage due to the loss ofK+, Cl-, and osmotically obliged water. Indeed, it hasrecently been shown that carbachol-stimulation of salivaryepithelial cells with carbachol decreases cell volume by10-20o (9). Volume can affect K+ and Cl- conductances incultured (10) and intact (11) colonic epithelia, and there is avolume-sensitive, Ca2+-permeable channel in the epithelia ofthe kidney and choroid plexus (12, 13). These findingssuggest that the membrane conductances to K+, Cl-, andCa2+, cell potential, and cell volume are tightly interrelatedand could provide a regulatory circle to control Ca2+ entryand, thus, the level of [Ca2+]i during stimulus. The purposeof our work was to characterize these relationships in theCl--secretory epithelial cell line HT-29/B6.
MATERIALS AND METHODSCell Culture. The B6 subclone (14) of the colon carcinoma
cell line HT-29 was advantageous due to its homogeneity inhormonal responses. Cells were grown on glass coverslips inDulbecco's minimal essential medium, supplemented with10%o fetal calf serum, 4 mM glutamine, penicillin at 100units/ml, and streptomycin at 0.1 mg/ml. Experiments weredone on cells from passages 17 to 26 at the second to seventhdays after seeding, when cells were still in a subconfluentstate. Cell [Ca2.]i responses were qualitatively independentof growth state, but single cells or cells in clumps showedamplified [Ca2+l responses after stimulation compared withcells grown to confluent monolayers.Measurement of [Ca2+J1. Cytoplasmic [Ca2+]i was mea-
sured according to the procedures described by Negulescuand Machen (15) and Tsien and Poenie (16). Briefly, cellswere loaded with 5 gM of the acetoxymethylester of theCa2+-sensitive dye fura-2 (Molecular Probes) at room tem-perature for 30 min. Then the coverslips were mounted in aperfusion chamber at 370C on the stage of a microscope.Because the cells were subconfluent, 'perfusion solutionsbathe both apical and basolateral sides of the cells simulta-neously. Single cells or cells in small islands were alternatelyexcited at 350 and 385 nm through a40x objective (Nikon, 1.3NA), and fluorescence was measured with a TV camera(SIT-66DX, Dage-MTI, Michigan City, IN); the signal wasprocessed (Gould FD5000 and DEC clone computer), and350/385 fluorescence ratios were collected and averagedfrom 16 to 20 single cells every 4 to 12 sec. Every trace shownin the figures is one experiment from at least three similar
Abbreviations: [Ca2+]i, intracellular Ca2+ concentration; [K+]0,extracellular K+ concentration.tTo whom reprint requests should be addressed.
1438
Proc. Natl. Acad. Sci. USA 89 (1992) 1439
repetitions. [Ca2+], was calculated from the fluorescenceratios according to Grynkiewicz et al. (17). Maximum andminimum ratios were obtained from fura-2-loaded cells byeither Ca2' depletion (no added Ca2+, 2 mM EGTA) for 30min or by addition of the Ca2+ ionophore ionomycin (5 AM)with 10 mM CaCl2 added to the solutions. A Kd of thefura-2-Ca2+ complex of 300 nM was assumed, based on thevalue measured in intact gastric epithelial cells (18). Allvalues are given as mean ± SEM. Number of experimentscorresponds to separate runs with 16-20 cells each.
Solutions. Standard solution was 141 mM NaCl/4 mMKCl/1 mM KH2PO4/0.9 mM MgSO4/1.7 mM CaCl2/10 mMHepes/25 mM glucose, titrated to pH 7.4 with -5 mMNaOH. In Ca2+-free solution CaCl2 was substituted by 0.1mM EGTA. In solutions of high or low K+ concentrations,Na+ and K+ replaced each other equimolarily to yield finalK+ concentrations of 0.5-151 mM. Carbachol was used at100 ,uM in all experiments shown. All chemicals and the cellculture reagents were from Sigma.
RESULTS AND DISCUSSIONEffects of Carbachol on [Ca21]1. In resting HT-29/B6 cells
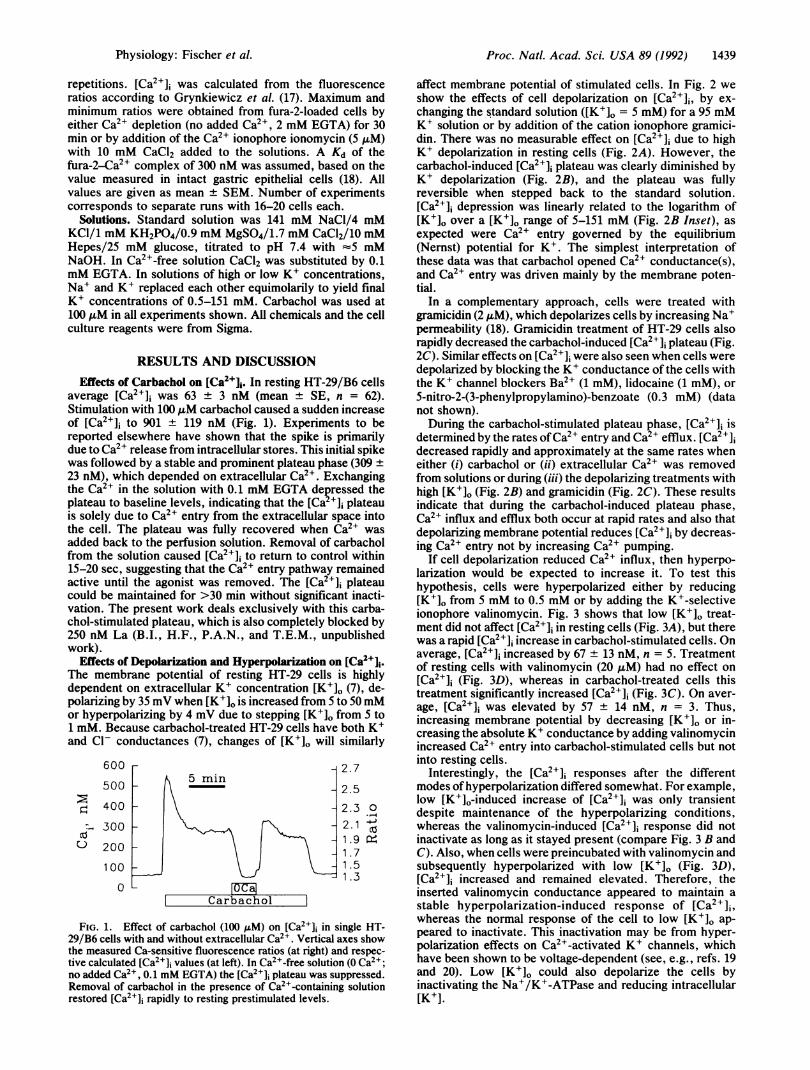
average [Ca2+]i was 63 + 3 nM (mean + SE, n = 62).Stimulation with 100 ,uM carbachol caused a sudden increaseof [Ca2+]i to 901 + 119 nM (Fig. 1). Experiments to bereported elsewhere have shown that the spike is primarilydue to Ca2+ release from intracellular stores. This initial spikewas followed by a stable and prominent plateau phase (309 +23 nM), which depended on extracellular Ca2+. Exchangingthe Ca2+ in the solution with 0.1 mM EGTA depressed theplateau to baseline levels, indicating that the [Ca2+]i plateauis solely due to Ca2+ entry from the extracellular space intothe cell. The plateau was fully recovered when Ca2+ wasadded back to the perfusion solution. Removal of carbacholfrom the solution caused [Ca2+]1i to return to control within15-20 sec, suggesting that the Ca2+ entry pathway remainedactive until the agonist was removed. The [Ca2+]i plateaucould be maintained for >30 min without significant inacti-vation. The present work deals exclusively with this carba-chol-stimulated plateau, which is also completely blocked by250 nM La (B.I., H.F., P.A.N., and T.E.M., unpublishedwork).
Effects of Depolarization and Hyperpolarization on [Ca2+]1.The membrane potential of resting HT-29 cells is highlydependent on extracellular K+ concentration [K+]0 (7), de-polarizing by 35 mV when [K+]o is increased from 5 to 50mMor hyperpolarizing by 4 mV due to stepping [K+]o from 5 to1 mM. Because carbachol-treated HT-29 cells have both K+and Cl- conductances (7), changes of [K+]h will similarly
600
500
>400
-_300U 200
100
0
2.7
2.3 02.1 4
W1.7
1.5
EZCarbachol
FIG. 1. Effect of carbachol (100 AuM) on [Ca2+]j in single HT-29/B6 cells with and without extracellular Ca2'. Vertical axes showthe measured Ca-sensitive fluorescence ratios (at right) and respec-tive calculated [Ca2+]i values (at left). In Ca2+-free solution (O Ca2+;no added Ca2+, 0.1 mM EGTA) the [Ca2+]j plateau was suppressed.Removal of carbachol in the presence of Ca2+-containing solutionrestored [Ca2+]i rapidly to resting prestimulated levels.
affect membrane potential of stimulated cells. In Fig. 2 weshow the effects of cell depolarization on [Ca2']i, by ex-changing the standard solution ([K+]. = 5 mM) for a 95 mMK+ solution or by addition of the cation ionophore gramici-din. There was no measurable effect on [Ca2+]i due to highK+ depolarization in resting cells (Fig. 2A). However, thecarbachol-induced [Ca2+], plateau was clearly diminished byK+ depolarization (Fig. 2B), and the plateau was fullyreversible when stepped back to the standard solution.[Ca2+] depression was linearly related to the logarithm of[K+]o over a [K+]0 range of 5-151 mM (Fig. 2B Inset), asexpected were Ca2+ entry governed by the equilibrium(Nernst) potential for K+. The simplest interpretation ofthese data was that carbachol opened Ca2+ conductance(s),and Ca2+ entry was driven mainly by the membrane poten-tial.
In a complementary approach, cells were treated withgramicidin (2 MM), which depolarizes cells by increasing Na'permeability (18). Gramicidin treatment of HT-29 cells alsorapidly decreased the carbachol-induced [Ca2+], plateau (Fig.2C). Similar effects on [Ca2W] were also seen when cells weredepolarized by blocking the K+ conductance of the cells withthe K+ channel blockers Ba2+ (1 mM), lidocaine (1 mM), or5-nitro-2-(3-phenylpropylamino)-benzoate (0.3 mM) (datanot shown).During the carbachol-stimulated plateau phase, [Ca2+]i is
determined by the rates ofCa2+ entry and Ca2+ efflux. [Ca2+]jdecreased rapidly and approximately at the same rates wheneither (i) carbachol or (ii) extracellular Ca2+ was removedfrom solutions or during (iii) the depolarizing treatments withhigh [K+]o (Fig. 2B) and gramicidin (Fig. 2C). These resultsindicate that during the carbachol-induced plateau phase,Ca2+ influx and efflux both occur at rapid rates and also thatdepolarizing membrane potential reduces [Ca2+]i by decreas-ing Ca2+ entry not by increasing Ca2+ pumping.
If cell depolarization reduced Ca2+ influx, then hyperpo-larization would be expected to increase it. To test thishypothesis, cells were hyperpolarized either by reducing[K+]o from 5 mM to 0.5 mM or by adding the K+-selectiveionophore valinomycin. Fig. 3 shows that low [K+]o treat-ment did not affect [Ca2+], in resting cells (Fig. 3A), but therewas a rapid [Ca2+]i increase in carbachol-stimulated cells. Onaverage, [Ca2+] increased by 67 + 13 nM, n = 5. Treatmentof resting cells with valinomycin (20 AM) had no effect on[Ca2+], (Fig. 3D), whereas in carbachol-treated cells thistreatment significantly increased [Ca2+], (Fig. 3C). On aver-age, [Ca2+]i was elevated by 57 + 14 nM, n = 3. Thus,increasing membrane potential by decreasing [K+]. or in-creasing the absolute K+ conductance by adding valinomycinincreased Ca2+ entry into carbachol-stimulated cells but notinto resting cells.
Interestingly, the [Ca2+] responses after the differentmodes of hyperpolarization differed somewhat. For example,low [K+]O-induced increase of [Ca2+], was only transientdespite maintenance of the hyperpolarizing conditions,whereas the valinomycin-induced [Ca2+]i response did notinactivate as long as it stayed present (compare Fig. 3 B andC). Also, when cells were preincubated with valinomycin andsubsequently hyperpolarized with low [K+]0 (Fig. 3D),[Ca2+], increased and remained elevated. Therefore, theinserted valinomycin conductance appeared to maintain astable hyperpolarization-induced response of [Ca2+],whereas the normal response of the cell to low [K+]o ap-peared to inactivate. This inactivation may be from hyper-polarization effects on Ca2+-activated K+ channels, whichhave been shown to be voltage-dependent (see, e.g., refs. 19and 20). Low [K+]0 could also depolarize the cells byinactivating the Na+/K+-ATPase and reducing intracellular[K+].
Physiology: Fischer et al.

Proc. Natl. Acad. Sci. USA 89 (1992)
C
10 100Ko, mm
1 95 K ICarbachol
ramicid-inCarbachol
FiG. 2. Effects of depolarization on [Ca2+]i. Depolarization of resting cells (A) and carbachol-stimulated cells (B) with a solution containing95 mM K+. (Inset) Dose-dependency of K+ depolarization of 11 separate experiments; numbers ofexperiments at each concentration are given.Vertical axis is normalized to plateau level [[Ca2+]j(plateau) - [Ca2+]j(base1ine) is defined as 100%]. (C) Addition ofgramicidin (2 ,uM) in presenceof carbachol.
Effects ofCell Volume Changes on [Ca2+f1. Because changesof [Kk]o and treatment with valinomycin may affect cellvolume (21), we addressed the question whether the changesof [Ca2+]i were due to changes in membrane potential, in cellvolume, or in both.
Cell swelling was elicited by diluting the solutions withwater (hypotonic = 0.8x isotonic, decreasing osmolalityfrom 310 to 242 mosm/kg), and cell shrinkage was elicited byadding sucrose (10-500 mM) to the standard solutions (there-by increasing osmolality to 817 mosm/kg). Fig. 4 summarizesthe effects of changes in extracellular osmolarity on [Ca2+]i.In resting cells (Fig. 4A) treatment with the hypotonic solu-tion had no significant effect on [Ca2W]i. Also, when cellswere treated with an isosmotic solution containing 80% oftheions of the standard solution (osmolarity balanced withsucrose), there were no effects on [Ca2W]i in either resting orcarbachol-stimulated cells (data not shown). However, whenresting cells were shrunken by adding 500 mM sucrose (butnot during addition of <250 mM sucrose, data not shown) tothe solution, [Ca2+]i increased, probably due to both theconcentrating effect on [Ca2+]1j (caused by decreased cellvolume) and perhaps also the release of Ca2+ from internalstores.
In contrast to resting cells, cell volume changes had largeeffects on [Ca2+]J in carbachol-treated cells. Fig. 4B showsthe effect of hypotonic treatment. [Ca2+]i first rapidly in-creased and then decreased back to plateau level. Similarresults came from experiments in which hypotonicity was
1000
800
7.
V-
600
400
200
0
A B
min
0.5K I
C
obtained by removing sucrose from an isotonic solution (inwhich sucrose replaced an equivalent amount of NaCl). Theshape of the swelling-activated transient was not affected byvalinomycin treatment (data not shown), indicating that thedecrease in [Ca2W]i during hypotonic treatment is not afeature of a K+ channel inactivation with time but rather aninactivation of the Ca2+ entry itself.Hyperosmolarity caused [Ca2+]J to decrease rapidly (Fig.
4C), indicating that Ca2+ entry into carbachol-stimulatedcells is rapidly reduced by hypertonicity. This effect wasdose-dependent and completely reversible (Fig. 5). Addingincreased amounts of sucrose decreased the plateau step-wise. On average, addition of 34.8 mM sucrose (correspond-ing to 343 mosm/kg) reduced plateau [Ca2+]i by 50%o. Thus,assuming the cells behave like perfect osmometers, a rela-tively small shrinkage (=10-15%), which can be expectedunder physiological conditions (9), reduced plateau Ca2+]iby 50%o. This change indicates an exquisite sensitivity ofCa2+entry to shrinkage. Maximal effects were seen with 250 mMsucrose (equals 565 mosm/kg). In preshrunken cells (solu-tions containing 250 mM sucrose) carbachol caused charac-teristic peaks of [Ca2]i,, but the plateau was absent, indicat-ing that the carbachol receptor and release of the internalstore were not altered by hypertonicity (data not shown) butthe entry of Ca2+ from outside was blocked. Additionalhypertonicity increased [Ca2+]i, which might be from anoverlap of the shrinkage-induced decrease in Ca2+ entry andan increase of ICa2eli due to the concentrating effect ofdecreased cell volume.
D
IK.h I-Val II Carbachol 1 | CarbachoF
1 0.5KCarbachol
_ Valinomycin IFIG. 3. Effects of hyperpolarization on [Ca2+]i. K+ concentration of standard solution was 5 mM. Hyperpolarization was achieved by
reducing [K+] to 0.5 mM (A, B, and D) or by addition of valinomycin (Val; 20 IzM; C and D). Note that valinomycin did not affect the initiallarge rise in [Ca2+]i due to Ca2+ release from internal stores.
A700
600
500
B10 min
400 1-
100
80% 60
40
20
07._
Vou-
300
200
100
0 95 K
1440 Physiology: Fischer et al.
I

Proc. Natl. Acad. Sci. USA 89 (1992) 1441
800 A B C
600 - 5 min
-400-
200 -
0 swell shrl
FIG. 4. Effects of volume changes on [Ca2+]i. Swelling (swell)(0.8x isotonic solution) and shrinkage (shr) (addition of 500 mMsucrose) of resting cells (A) and carbachol-stimulated cells (B and C)are shown.
Distinguishing Effects of Volume and Potential on [Ca2+]J.Because volume changes might affect membrane potentialthrough volume-dependent K+ and Cl- conductances, wetested for independent effects of potential and volume onCa2+ entry. We clamped K+ conductance by adding valino-mycin and then tested the effects of altered osmolarity.Under these conditions changes in [Ca2+]j are likely to resultfrom effects on Ca2+ conductance rather than from influenceson membrane potential. Valinomycin itself seemed to haveno untoward effects on Ca2+ metabolism because [Ca2+4] wasunaffected by the drug in resting cells (Fig. 3D).
Fig. 6A summarizes experiments testing the effects ofsucrose-dependent shrinkage of carbachol-stimulated cellsunder control and valinomycin-pretreated conditions (com-pare with Fig. 5). Under both conditions [Ca2+]i decreasedwith increased sucrose concentrations. The presence ofvalinomycin (to maintain high K+ conductance) reducedshrinkage effects somewhat compared with control. There-fore, we concluded that carbachol-activated Ca2+ entry wasdirectly inhibited by hyperosmolarity. A possible shrinkage-induced inhibition of K+ channels and subsequent depolar-ization of the membrane potential may have an additionalseparate inhibitory effect, as seen from the difference be-tween the valinomycin-treated and control cells.
Swelling effects on [Ca24], in stimulated cells with andwithout valinomycin treatment are shown in Fig. 6B. Con-trols with standard 5 mM [K4]O (compare with Fig. 4B)showed pronounced increases of [Ca2+]i during hypotonicchallenge, and these increases in [Ca24]1 were diminishedwhen the cells were perfused with increased [K+]0. Inexperiments using valinomycin-pretreated cells, swellingevoked much smaller [Ca24]i responses that were indepen-dent of [K+]0 depolarization and coincided at high [K+]o withthe control swelling responses. It should be noted thatswelling effects on [Ca24], were nearly abolished (within 10%)by maneuvers that would be expected to reduce changes ofmembrane potential due to changes of K4 conductance (i.e.,
1 600
1 400
1 200
r 1 000
^- 800v 600
400
200
0
1 0 min
1050
Sucrose, mMCarbachol l
FIG. 5. Dose-dependent depression of carbachol-induced [Ca24],plateau with increased sucrose concentration and reversibility ofhypertonic effects.
A0 100
: 80
Q) 60co- 40
- 20
0o
B
o control2 ° valino4
4 3
0 100 200 500Sucrose, mM
0 180170
D 160c 150
--'- 140- 1300
120c 110u 100
o controlo valino
0 20 40 60 80 100
K., mM
FIG. 6. Volume and potential effects on [Ca24]i. (A) Shrinkageeffects on [Ca2+]i depend only slightly on potential. Dose-dependentdepression of carbachol-stimulated [Ca24]i plateau with increasedsucrose concentrations. o, control; n, cells in presence of 20 /AMvalinomycin (valino). y axes give the normalized [Ca24]i levels[[Ca2+]i(plateau) - [Ca24]i(basal) defined as 100%]. Six independentexperiments were done for each group; numbers at each concentra-tion are given. (B) Swelling effects on [Ca2+]i are potential depen-dent. [Ca24]i increase induced by swelling (hypotonic = 0.8x iso-tonic) vs. [K+]. in carbachol + valinomycin (20 ,uM)-treated cells.Ten independent control and three valinomycin experiments wereconducted.
high [K4]0 or valinomycin treatment). Also, pronouncedswelling-induced increases in [Ca2+] were seen only underconditions where the potential could be controlled by thecellular K+ conductance. Thus, the effects of swelling on[Ca2+], in carbachol-treated cells were mainly due to swellingactivation of a K+ conductance, which, in turn, hyperpolar-ized the cell and increased Ca2+ entry due to the increaseddriving force. The small (<10%) increases in [Ca2+], thatoccurred at high [K+]0 or in valinomycin-treated cells wereprobably due to a swelling activation of an apparent Ca2+conductance.Although we have not measured cell volume or potential
directly, the results from this study suggest that cell volume,membrane potential, K+ conductance, and [Ca2+], are allintimately interrelated (see Fig. 7). During carbachol treat-ment a Ca2+ conductance in the cell membrane is activated,allowing Ca2+ entry into the cell from the extracellular space.In the resting state Ca2+ conductance appeared relativelysmall because [Ca2+], was unaffected by our treatments. Incarbachol-stimulated cells, Ca2+ entry and, thus, [Ca2+], aredirectly or indirectly under the control ofmembrane potentialand cell volume as follows.
Let us first consider the feedback relationship among[Ca2+]j, K+ conductance, and membrane potential. Carba-
Carbachol
2+ +shrink - Ca entryswell + +
Cell Cellvolume Ca. potential
shrink
swell + K conductance
FIG. 7. Model showing relations among cell volume, cell poten-tial, and [Ca2+], in secretory epithelia. Positive coupling (+) ornegative coupling (-) signs appear between connected variables.Volume effects were exerted by hypoosmolar (swell) or hyperosmo-lar (shrink) solutions. Different letter sizes depict the influence of thisvariable with respect to [Ca2+] .
Physiology: Fischer et al.

Proc. Natl. Acad. Sci. USA 89 (1992)
chol-induced increases in [Ca2+]i activate a K+ conductance(5) and the cell hyperpolarizes, which, in turn, increases Ca2lentry due to the increased driving force (see also ref. 22). Thispositive feedback among [Ca2+]j, K+ conductance, and po-tential would be limited by a number of factors not shown inthe figure: (i) the presence of a Ca2'-activated Cl- conduc-tance (6), (ii) the magnitude of the maximal K+ equilibriumpotential, and (iii) effects of voltage on the K+ conductance(see e.g., refs. 19 and 20).
In addition to effects on membrane potential and Ca2'entry, increases in K+ conductance will also lead to cellshrinkage, which directly inhibits Ca2" entry (see also Fig.6A). In this way, activation of the K+ conductance controlsboth positive (cell potential) and negative (cell shrinkage)influences on Ca2+ entry. Carbachol stimulation of salivaryepithelial cells decreases cell volume by 10-20% (9). Becausethe carbachol-activated Ca2+ entry into HT-29 cells washighly sensitive to shrinkage exactly in this volume range(Fig. 6A), shrinkage-induced decreases in Ca2" entry may actas an important physiological regulator during carbachol-stimulation. (As shown in the results of Fig. 6A, a smallportion of the hyperosmotic effect on Ca2` entry is due toshrinkage-induced reduction of K+ conductance and cellpotential.) Other interactions between volume and Ca2'entry may be mediated through volume effects on the K+ andCa2+ conductances. For example, when carbachol-treatedcells are exposed to hypotonic solutions, the volume-sensitive K+ channels open, and Ca2+ entry increases. [Cellswelling in the presence of carbachol caused small potential-independent increases in Ca2+ entry (Fig. 6B), indicating thatswelling has a small direct effect on Ca2' conductance.]
In summary, during carbachol stimulation Ca2+ entry isdetermined by interactions among K+, Cl-, and Ca2+ chan-nels and, thus, the membrane potential, cell volume, and[Ca2+]i itself. The membrane potential will be determinedprimarily by the K+ and C1- conductances and the trans-membrane gradients for these ions. The magnitude of the K+equilibrium potential will be the physical limit as far as theeffect of the membrane potential on Ca2+ entry. The Ca2+conductance appears very sensitive to cell shrinkage in thephysiological range, so Ca2+ entry and [Ca2W]i decrease whenthe K+ and Cl- channels of the cell have been activated andthe cell shrinks. Thus, during carbachol stimulation, [Ca2+]iregulates secretion through effects on K+ and Cl- conduc-
tances, which feed back on Ca2l entry through their effectson membrane potential and cell volume.
We gratefully thank Prof. Dr. U. Hegel and Dr. K.-M. Kreusel(Berlin) for providing the HT-29 cell clone. This work was supportedby Deutsche Forschungsgemeinschaft Grant Fi 414/2-1 to H.F., theDeutsche Akademische Austauschdienst (B.I.), National Institutesof Health Grants DK 08238 to P.A.N. and DK 19520 to T.E.M., andthe Cystic Fibrosis Foundation.
1. Parod, R. J. & Putney, J. W. (1978) J. Physiol. (London) 281,371-381.
2. Merritt, J. E. & Rink, T. J. (1987) J. Biol. Chem. 262, 17362-17369.
3. Hosey, M. M. & Lazdunski, M. (1988) J. Membr. Biol. 104,81-105.
4. Yada, T., Oiki, S., Ueda, S. & Okada, Y. (1989) J. Membr. Biol.112, 159-167.
5. Dawson, D. C. & Richards, N. W. (1990) Am. J. Physiol. 259,C181-C195.
6. Cliff, W. H. & Frizzell, R. A. (1990) Proc. Natl. Acad. Sci.USA 87, 4956-4960.
7. Ziss, W. & Hegel, U. (1988) Pflugers Arch. 411, R81 (abstr.).8. Penner, R., Matthews, G. & Neher, E. (1988) Nature (London)
334, 499-504.9. Foskett, J. K. & Melvin, J. E. (1989) Science 244, 1582-1585.
10. Worrell, R. T., Butt, A. G., Cliff, W. H. & Frizzell, R. A.(1989) Am. J. Physiol. 256, C1111-C1119.
11. Germann, W. J., Ernst, S. A. & Dawson, D. C. (1986) J. Gen.Physiol. 88, 253-274.
12. Christensen, 0. (1987) Nature (London) 330, 66-68.13. Taniguchi, J. & Guggino, W. B. (1989) Am. J. Physiol. 257,
F347-F352.14. Kreusel, K.-M., Fromm, M., Schulzke, J.-D. & Hegel, U.
(1991) Am. J. Physiol. 261, C574-C582.15. Negulescu, P. A. & Machen, T. E. (1988) Am. J. Physiol. 254,
C130-C140.16. Tsien, R. Y. & Poenie, G. M. (1986) Trends Biochem. Sci. 11,
450-455.17. Grynkiewicz, G., Poenie, M. & Tsien, R. Y. (1985) J. Biol.
Chem. 260, 3440-3450.18. Lewis, S. A. & Wills, N. K. (1989) Methods Enzymol. 171,
715-736.19. Christensen, 0. & Zeuthen, T. (1987) Pflugers Arch. 408,
249-259.20. Bolivar, J. J. & Cereijido, M. (1987) J. Membr. Biol. 97, 43-51.21. Lewis, S. A. & Donaldson, P. (1990) News Physiol. Sci. 5,
112-119.22. Matthews, G., Neher, E. & Penner, R. (1989) J. Physiol.
(London) 418, 105-130.
1442 Physiology: Fischer et al.