capturing the emissions reduction benefits of energy efficiency
TRANSCRIPT

The Regulatory Assistance Project 50 State Street, Suite 3Montpelier, VT 05602
Phone: 802-223-8199web: www.raponline.org
Capturing the Emissions Reduction Benefits of Energy Efficiency
Presented by John Shenot
March 25, 2013
2013 ACEEE National Symposium on Market Transformation
What’s the Big Deal?
2

3
77
Sources: SO2 and NOx - NEI Trends Data and NEI 2005 Version 2 (2009) and CAMD Data & Maps (2010); PM10 - NEI Trends Data (2009); Hg - NEI 2005 Version 2 (2009); CO2 - Inventory of U.S. GHG Emissions and Sinks: 1990-2008 (2010) and 1990-2007; “Other” sources include transportation, other mobile sources, and industrial sources
Other Sectors
Nitrogen Oxides (NOx), 200915.3 Million Tons
Particulate Matter (PM10), 200514.8 Million Tons
Mercury (Hg), 2005114 Tons
Other Sectors
13.3 Million Tons87%
2.0 Million Tons13%
Electric Power
Other Sectors
14.3 Million Tons96%
Electric Power
Other Sectors
Electric Power
2.6 Billion Tons40%
62 Tons54%
52 Tons46%
Sulfur Dioxide (SO2), 20099.5 Million Tons
3.8 Million Tons40%
5.7 Million Tons60%
Electric Power
Carbon Dioxide (CO2), 20086.5 Billion Tons
3.9 Billion Tons60%
0.5 Million Tons4%
Other Sectors
Electric Power
Power Sector: A Major Share of US Air Emissions
Coal 85%
Coal 97%
Coal 83%
Coal >99%
Coal-fired power plants: vast majority of power sector air emissions
Coal 95%

Synergistic Effects of Multi-pollutant Planning Have Economic Benefits

What are National Ambient Air Quality Standards (NAAQS)?
• Health-based standards established by EPA for certain air pollutants
• All areas of the country required to eventually attain the standards
• Reviewed every 5 years
5

6

2008 Ozone NAAQS
7

What if the Ozone NAAQS is Tightened?
8

Consequences of Nonattainment
9

10

Other Electricity SectorEnvironmental Regulations
• Mercury and Air Toxics Standard
• NSPS for GHG Emissions
• PM2.5 NAAQS Revisions
• Coal Combustion Residuals (Ash) Rule
• SO2 NAAQS Revisions
• Effluent Limitation Guidelines
• 316(b) Cooling Water Rule
11
EE as an Air Quality Strategy: Increasing Need,
but also Increasing Opportunity
12
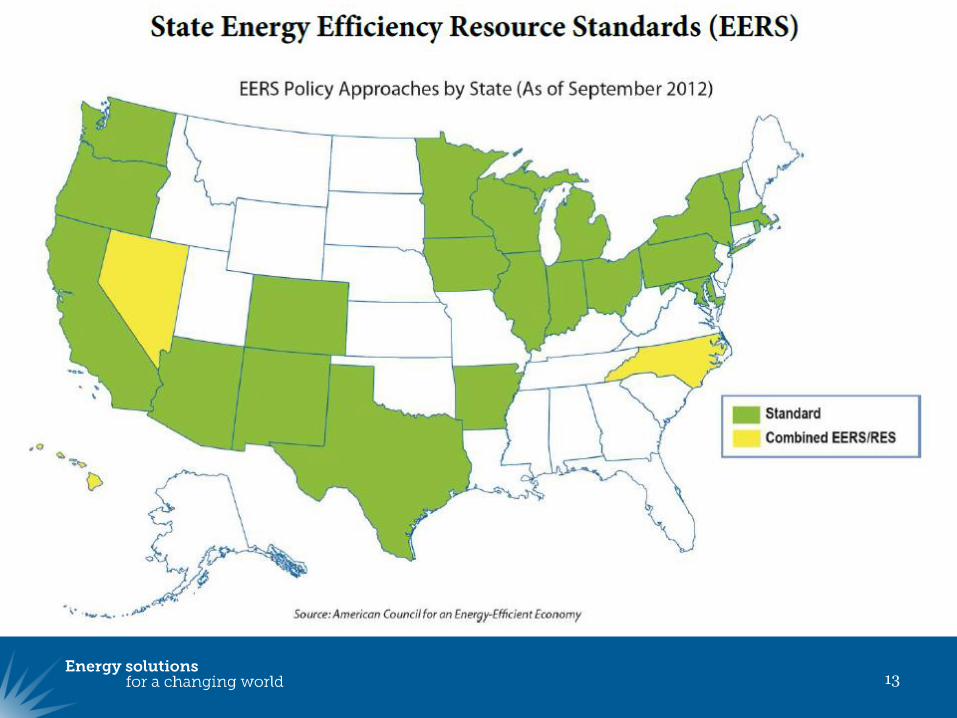
13

14
EPA’s EE/RE Roadmap “Pathways”
Baseline PathwayControl
Technology Pathway
Emerging/Voluntary
Measures Pathway
Weight-Of-Evidence Pathway
Types of ProjectsFor “on the book”
policies; Best on a state-wide or regional basis
For “on the way” policies
For locally-based activities; Can be
bundledAny
SIP Credit Limit None None6% of total required emission reductions
No credit taken but do get emissions benefits
EnforcementState enforceable but
not Federally enforceable
Federally enforceable against the
responsible party
Not enforceable against the
responsible partyNone
What happens if SIP reductions do not Materialize?
CAA SIP Call; Air agency required to make up for the emissions shortfall
Responsible party required to comply
State responsible for reductions
-
Level of Documentation
Required
Significant analysis to show reductions are in
place for planningperiod, quantify
impacts, and ensure no double counting
Significant analysis to show reductions are
permanent, enforceable,
quantifiable and surplus
ModerateCan range depending
on level of analysis

Overview: Quantifying Avoided Emissions from EE Policies and Programs
Four basic steps for quantifying EE impacts for air pollution regulatory purposes:
1. Develop a baseline forecast of energy consumption and associated emissions.
2. Determine which EE policies and programs are already embedded in the baseline energy forecast, if any, and which are incremental to the forecast, if any.
3. Quantify the expected energy savings from incremental EE.
4. Quantify the expected avoided emissions from incremental EE.
15
Warning: This Won’t Be Easy
16
Challenges with Using EE as an Air Quality Strategy
• It’s difficult enough to estimate avoided emissions from past EE programs:
– Usual EM&V challenges, plus…
– Timing and location of energy savings affect amount and location(s) of avoided emissions in complicated ways
• Methods for quantifying avoided emissions from future EE programs are still relatively new and evolving
17

Another Challenge
• Air regulators have very demanding data quality and accountability requirements, particularly for large “point sources” like power plants
• EE as an air quality strategy ultimately reduces emissions at these “point sources” but is better suited for regulation as an “area source”
18

Your Role
• Many air regulators are just beginning to understand the need and opportunities for EE as an air quality strategy
• Most are not experts on energy or EE data
– They need your help; work with them!
• This isn’t charity work: air regulators could become champions for bigger and better EE programs and EM&V that benefits you
19

Key Resources
• U.S. EPA (2012), Roadmap for Incorporating Energy Efficiency/Renewable Energy Policies and Programs into State and Tribal Implementation Plans– http://epa.gov/airquality/eere/manual.html
– Note Appendix I, Methods for Quantifying Energy Efficiency and Renewable Energy Emission Reductions
• State and Local Energy Efficiency Action Network (2012), Energy Efficiency Program Impact Evaluation Guide– http://www1.eere.energy.gov/seeaction/pdfs/emv_ee_program_impact_guide.pdf
– Note Chapter 6, Calculating Avoided Air Emissions
• U.S. EPA (2010), Assessing the Multiple Benefits of Clean Energy: A Resource for States– http://www.epa.gov/statelocalclimate/documents/pdf/epa_assessing_benefits.pdf
• RAP (soon to be published), Data Sources and Methods for Quantifying the Air Quality Impacts of Energy Efficiency Policies and Programs
20

Integrated, Multi-pollutant Planning for Energy and Air Quality (IMPEAQ)
About RAP
The Regulatory Assistance Project (RAP) is a global, non-profit team of experts that focuses on the long-term economic and environmental sustainability of the power and natural gas sectors. RAP has deep expertise in regulatory and market policies that:
Promote economic efficiency Protect the environment Ensure system reliability Allocate system benefits fairly among all consumers
Learn more about RAP at www.raponline.org
John Shenot: [email protected]
802-498-0728