dpti review of emissions reduction opportunities
TRANSCRIPT

Report for Department of Planning, Transport and Infrastructure
Review of Emissions Reduction Opportunities
January 2019

Project Delivered for:
Jennifer Slocombe - Principal Sustainability Advisor
Department of Planning, Transport and Infrastructure
77 Grenfell Street, Adelaide SA 5000, AUSTRALIA
(08) 8343 2398 - [email protected]
Project Delivered by:
Maisie Auld - Senior Consultant
Edge Environment
Level 5, 39 East Esplanade, Manly, NSW 2095, AUSTRALIA
+61 479 009 997 - [email protected]
Revision Revision Details Author Approved by Date Approved
V1 Draft report for review Charlotte Wang
Maisie Auld
Ken Lunty 06/12/2018
Rev1 Final report for review Charlotte Wang
Maisie Auld
Ken Lunty 11/01/2019
Rev2 Revised Final report Charlotte Wang Maisie Auld 22/01/2019

Contents
1 Introduction ........................................................................................................ 1
Objectives .............................................................................................................. 1
2 Methodology ....................................................................................................... 2
Hotspot Analysis ................................................................................................... 2
2.1.1 Tunnel .............................................................................................................. 2
2.1.2 Rail ................................................................................................................... 3
2.1.3 Road ................................................................................................................ 4
Desktop Review ..................................................................................................... 4
Baseline Development ........................................................................................... 5
2.3.1 Key assumptions .............................................................................................. 5
Carbon Reduction Estimation ............................................................................... 6
Marginal Abatement Cost Curve analysis ............................................................ 6
3 Results ................................................................................................................ 7
Tunnel ..................................................................................................................... 7
Rail ........................................................................................................................ 14
Road ..................................................................................................................... 20
Initiatives excluded from final list ....................................................................... 28
4 Discussion and Next Steps ............................................................................. 29
Appendix A: List of baseline GHG emissions ...................................................... 33
Appendix B: List of GHG emissions reductions .................................................. 35

Review of Emissions Reduction Opportunities – January 2019
Page 1
1 Introduction Infrastructure is responsible for a significant proportion of Australia’s carbon emissions, with transport and mining alone accounting for as much as 20% of the total. As such it is no surprise that considerable efforts are being made, both in Australia and internationally, to drive improved sustainability outcomes in the infrastructure sector. Initiatives such as the Infrastructure Sustainability Council of Australia’s (ISCA) Infrastructure Sustainability (IS) Tool and its UK equivalent CEEQUAL have been widely recognised as drivers of best practice, and catalysts for significant emissions reductions.
In South Australia, there is a commitment under the Climate Change Act 2007 to reduce emissions by at least 60% against a 1990 baseline as part of the national response to climate change. To hit this target, there is no question that infrastructure – in planning, design, construction and operation – will have to play a significant role. It is vital to understand what the mitigation potential could be in the sector, and the role the Department of Planning, Transport and Infrastructure (DPTI) has in driving those emissions reductions.
DPTI has diverse responsibilities for transport systems and services, infrastructure planning and provision and strategic land use within South Australia. The department ensures that South Australia’s needs for the movement of people and freight and the delivery of services across the transport and infrastructure sectors are met in a safe, efficient, cost effective and sustainable manner.
The Technical Services team is responsible for managing standards, technical requirements and specifications resulting in whole of life functional, sustainable outcomes and benefits across department activities. Technical Services is responsible for enabling innovation and facilitating engagement with the private sector to ensure a high quality of services and fit-for-purpose products.
The Master Specification is a suite of documents used by the department as the basis of specifications for the design, construction and / or maintenance of road, rail and marine infrastructure. A need has been identified for improved evidence on which the department can base greenhouse gas (GHG) emissions reduction targets and appropriate specification of sustainability requirements.
The aim of this project is to support DPTI as it develops a case for further intervention in the market. This includes an assessment of the emissions reductions achieved through sustainability initiatives implemented on a range of infrastructure project types both in Australia and overseas, and a review of the current draft of DPTI’s sustainability requirements for infrastructure projects.
Objectives
The objective of this project is to identify emission reductions initiatives that could be implemented across a range of infrastructure projects and estimate their emission reduction potential on a per unit basis to enable easy calculation of a project’s emission reduction target.
Following a desktop review, a total of 34 emission reduction initiatives were assessed to estimate their potential for emission reduction in rail, road and tunnel infrastructure projects across the whole life cycle (design, construction, operation, maintenance and end of life). To further inform decision-making and allow for comparison across measures, a Marginal Abatement Cost Curve (MACC) analysis was developed for each project type. Recommendations for specification are based on the results of the MACC through prioritisation of the most cost-effective measures.

Review of Emissions Reduction Opportunities – January 2019
Page 2
2 Methodology A flow chart of the applied methodology is presented in Figure 1.
Figure 1 | Methodology
Hotspot Analysis
As a basis for the desktop review and later modelling, DPTI provided three infrastructure case studies to be examined for their emissions abatement potential:
• Rail: Flinders Link Project;
• Tunnel: hypothetical 5km-long, 2-lane tunnel, based on the O-Bahn City Access Project; and
• Road: Pym to Regency motorway.
Edge undertook a hotspot analysis of three recent infrastructure projects from Edge’s library of completed projects with a similar profile to the provided case studies. As the infrastructure projects were based in NSW, Scope 2 emissions were recalculated using the South Australia grid factor to improve the relevance of the data. Furthermore, the hotspot analysis considered current practice in South Australia to ensure that the identified initiatives were relevant to the case studies. The hotspot analysis provided an overview of the source and comparative magnitude of GHG emissions for each of the three infrastructure types.
2.1.1 Tunnel
Life cycle resource use projections for a current practice nine kilometre, four-lane tunnel in NSW was used to undertake a hotspot analysis of the major sources of emissions from representative tunnel infrastructure projects. Note that, in line with the O-Bahn City Access Project’s specifications, the tunnel hotspot analysis assumes that variable speed drives and jet fans for ventilation systems are current practice. A 100-year operational life was assumed.
The largest overall source of emissions was from Scope 3 emission sources (Figure 2). The scope 3 emissions relate primarily to embodied emissions from materials used in both construction and maintenance. Scope 1 emissions, relating to fuel used during construction, are minimal over the infrastructure life cycle, when compared to the Scope 2 and Scope 3 emissions.
The top 4 sources of emissions were from ventilation operation (Scope 2, 35%), coatings and finishes (Scope 3, 25%), ready-mixed concrete (Scope 3, 18%) and tunnel LED lighting operation (Scope 2, 8%) (Figure 3).
Hotspot Analysis
Desktop Review
Baseline Development
Carbon Reduction Estimation
Marginal Abatement Cost Curve
Analysis
Results
0.0
0.5
1.0
1.5
2.0
2.5
3.0
3.5
GH
G e
mis
sio
ns
(M
t C
O2-e
)
Scope 3
Scope 2
Scope 1
Figure 2 | Breakdown of Scope 1, 2 and 3 emissions for a current practice tunnel project (SA grid)

Review of Emissions Reduction Opportunities – January 2019
Page 3
Figure 3 | Life cycle emissions (100 years operation) of a 9 km, 4-lane tunnel (current practice initiatives and SA grid factor) – major emissions sources labelled
2.1.2 Rail
Life cycle resource use projections for a representative, 23-kilometre rail line in NSW was used to undertake a hotspot analysis of the major sources of emissions from current metropolitan rail infrastructure projects1. A 50-year operational life was assumed.
The largest overall source of emissions was from Scope 2 emission sources (Figure 4). Scope 2 emission sources relate primarily to purchased grid electricity for traction power in operation.
Due to lack of granularity in data, further breakdown of emissions types is not available.
1 Note: the data presented only covers the rail track and does not include stations, viaducts or other associated civil infrastructure.
Operations centre lighting
1%Tunnel LED lighting
8%
Ventilation35%
Roadheaders2%
Tunnelling activities -fuel1%
Ready-mixed concrete
18%
Steel5%
Plastic sheet and film1%
Piping1%
Paint & zinc immersion coating
25%
0.00
0.02
0.04
0.06
0.08
0.10
0.12
0.14
0.16
GH
G e
mis
sio
ns
(M
t C
O2-e
)
Scope 3
Scope 2
Scope 1
Figure 4 | Breakdown of Scope 1, 2 and 3 emissions for a current practice rail project (SA grid)

Review of Emissions Reduction Opportunities – January 2019
Page 4
2.1.3 Road
Life cycle resource use projections for a representative 12-kilometre, two-lane motorway in NSW was used to undertake a hotspot analysis of the major sources of emissions from current motorway infrastructure projects. A 50-year operational life was assumed. Energy use from the operation of tolls was removed to reflect the South Australia context.
The largest source of overall emissions was from Scope 3 emissions sources. Scope 3 emissions relate primarily to embodied emissions from materials used in both construction and maintenance (Figure 5).
The top four sources of emissions were from ready mixed concrete (Scope 3, 18%), intelligent transport systems (Scope 2, 17%) (e.g. variable message signage), asphalt (Scope 3, 17%) and steel (Scope 3, 13%) (Figure 6). The distribution of GHG emissions in the road hotspot were relatively diverse, including various materials and energy sources during construction and operation.
Figure 6 | Life cycle emissions (50 years operation) of a 12-kilometre, two-lane motorway (current practice initiatives and SA grid factor) – major emissions sources labelled
Desktop Review
A desktop review was undertaken to identify initiatives that can reduce the GHG emissions of infrastructure projects in South Australia.
The desktop review identified and prioritised current best practice initiatives from Australia and overseas that targeted the major sources of life cycle GHG emissions identified from the hotspot analysis for each infrastructure type. In addition, the review explored emerging technologies and trends internationally.
The desktop review included the following sources (in order of priority):
1. Anonymised and high-level infrastructure project data from Infrastructure Sustainability Council of Australia (ISCA);
Electricity1%
Fuel13%
Street lighting11%
Intelligent transport system
17%
Asphalt maintenance
1%
Ready Mixed Concrete
18%
Precast Concrete7%
Asphalt17%
Steel13%
Aluminium1%
Figure 5 | Breakdown of Scope 1, 2 and 3 emissions for a current practice rail project (SA grid)
0.00
0.01
0.02
0.03
0.04
0.05
0.06
0.07
0.08
0.09
0.10
GH
G e
mis
sio
ns
(M
t C
O2-e
)
Scope 3
Scope 2
Scope 1
Review of Emissions Reduction Opportunities – January 2019
Page 5
2. Edge’s database of infrastructure projects with Infrastructure Sustainability (IS) ratings;
3. Peer-reviewed scientific journal articles (Australian or international);
4. Government or government agency reports (Australian or international);
5. Product specifications and webpages (Australian or international); and
6. High circulation trade magazines (Australian or international).
An initial list of initiatives were presented to DPTI. Refinements to initiatives were made based on the South Australian context and DPTI’s strategic direction.
Baseline Development
Baseline development is an important step in analysing carbon abatement potential to create an accurate and representative measure of the benefit of various initiatives. The baseline development step ensures that the carbon reduction potential of the identified initiatives presented in this report are specific to the South Australia infrastructure context.
The carbon accounting methodology of the GHG Protocol Corporate Accounting and Reporting Standard provided an overall framework for the quantification of the baseline GHG emissions and reductions. This methodology aligns to Australian best practice carbon accounting methodologies (e.g. NGERS).
The baseline development stage involved the identification of a baseline emissions source and scope for each initiative. The baseline emissions source refers to the typical source of emissions which each initiative will target, either through an efficiency improvement or replacement of technology or materials.
The hotspot analysis data was used to quantify the typical resource use associated with the identified baseline emissions source. Where information was not available from the hotspot analysis, data was sourced from the desktop review, per the hierarchy listed in Section 2.2.
To quantify the GHG emissions associated with the baseline emissions source, the South Australia grid electricity GHG factor2 and GHG data from the Australian Life Cycle Inventory (AusLCI) database were used. All values were then converted to a per unit metric (e.g. per kilometre).
Scope 3 emissions associated with fuel and grid electricity have been included in the analysis.
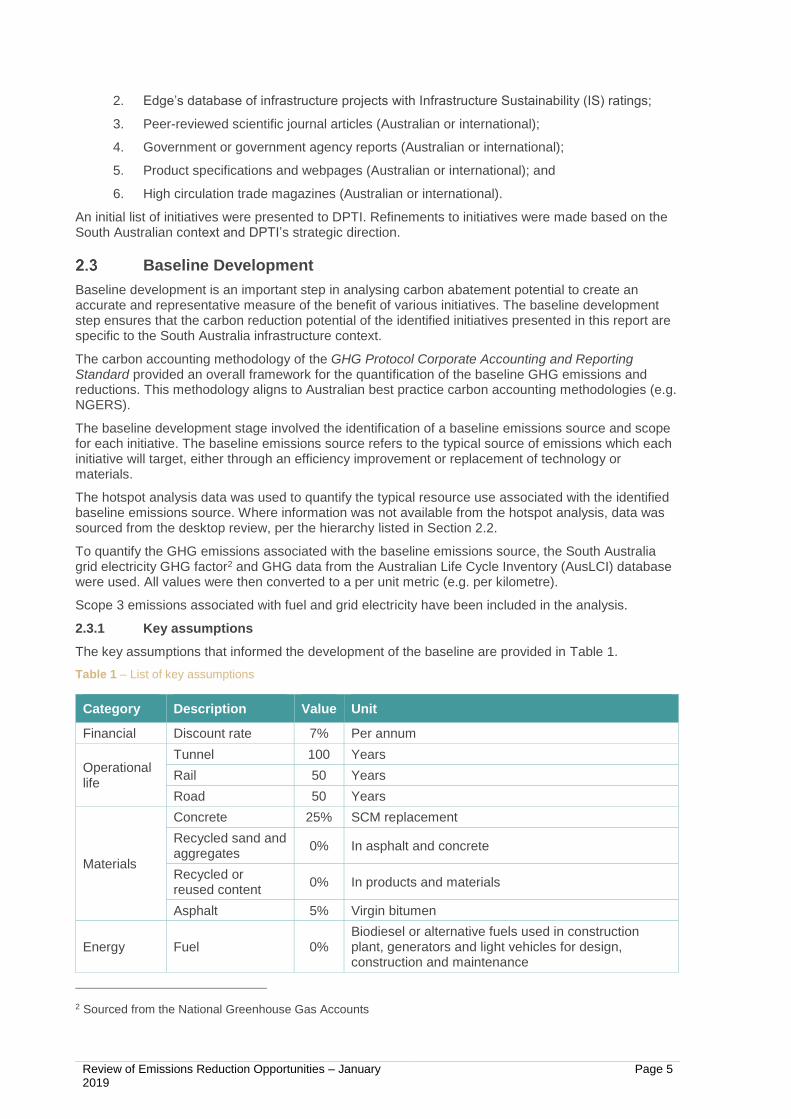
2.3.1 Key assumptions
The key assumptions that informed the development of the baseline are provided in Table 1.
Table 1 – List of key assumptions
Category Description Value Unit
Financial Discount rate 7% Per annum
Operational life
Tunnel 100 Years
Rail 50 Years
Road 50 Years
Materials
Concrete 25% SCM replacement
Recycled sand and aggregates
0% In asphalt and concrete
Recycled or reused content
0% In products and materials
Asphalt 5% Virgin bitumen
Energy Fuel 0% Biodiesel or alternative fuels used in construction plant, generators and light vehicles for design, construction and maintenance
2 Sourced from the National Greenhouse Gas Accounts

Review of Emissions Reduction Opportunities – January 2019
Page 6
Category Description Value Unit
Electricity 100% South Australian grid supplied electricity for construction and operation
Greenpower 0% Provision of greenpower for purchased electricity
LED lighting Yes Luminaires installed on lighting fixtures
Carbon Reduction Estimation
The carbon reduction potential of each initiative was estimated as the percent reduction from the baseline emissions. The percent reduction in carbon emissions for each initiative was sourced either from the desktop review or modelled by Edge in the SimaPro LCA software. A list of the carbon reductions in comparable units (i.e. per km) along with their respective information source is provided in Appendix B.
Marginal Abatement Cost Curve analysis
A Marginal Abatement Cost Curve (MACC) analysis was undertaken to assess the cost-effectiveness and emissions reduction potential of the proposed mitigation initiatives. MACC analysis can be a useful decision-making and engagement tool to enable an easy comparison across initiatives.
The carbon abatement potential of an action is represented on the x-axis, where the width of each column represents tCO2-e abated per year. The cost of carbon abatement is represented by the y-axis per tCO2-e abated. MACC costs are defined as the Net Present Value of the marginal costs over the lifetime of the investment. All costs are estimated in comparison to the baseline, business as usual scenario. Negative costs represent a profitable investment over the life of the investment. Actions with positive costs may still be considered if there are other benefits to society or if costs are linked to potential future policy change or technological breakthroughs.
The MACCs presented in this report are representative of the current policy environment, technology development and cost estimates. To ensure accuracy over time, the MACC should be reviewed and updated regularly to incorporate any changes in technology, pricing and policy if it is used as a decision-making tool into the future.

Review of Emissions Reduction Opportunities – January 2019
Page 7
3 Results A total of 34 initiatives were assessed across the three types of infrastructure: rail, road and tunnel. DPTI also manages marine infrastructure; however, this type of infrastructure was excluded from the study as DPTI-managed marine infrastructure projects are minimal and / or infrequent compared to projects for the other types of infrastructure.
Tunnel
The abatement initiatives examined in this study for tunnel infrastructure projects span a range of GHG emissions sources at various life cycle stages, including the tunnel control room, material use, drainage and lighting.
While emissions from ventilation represented 35% of life cycle emissions in the hotspot analysis for tunnels, current best practice (i.e. variable speed drives and jet fans) is already being implemented in the SA context and is thus considered business as usual. As such, mitigation initiatives targeting energy efficient ventilation were not examined in this analysis. The same reasoning applies to tunnel lighting, where LED lighting is currently required in DPTI’s specifications. A watching brief on new ventilation and energy efficient lighting solutions should be established for future projects.
The final list of tunnel initiatives examined in this study are presented in Table 2.

Review of Emissions Reduction Opportunities – January 2019 Page 8
Table 2– List of carbon mitigation initiatives for tunnels
Ref Initiative Description Life cycle Type Scope
T1 Solar hot water Using renewable energy to heat water for tunnel operations centre(s). A flat plate collector system was assumed for the analysis. Hot water is used for showers and laundry services.
Operation Renewable energy
2
T2 Electric tunnelling equipment Replacing diesel roadheaders with electric roadheaders as tunnelling equipment. This initiative assumes that SA grid electricity will be used to power the electric roadheaders.
Construction Electrification 1
T3 Set points and control bands
Reset the space temperature set point and increase the control band (the temperature range wherein heating and cooling is not activated) in tunnel operations centre(s) such that the energy consumption of the HVAC system is optimised while maintaining occupant comfort.
Operation Energy efficiency
2
T4 Pump epoxy coating Apply a surface treatment (or coat) to the surface of pumps and pipes in the tunnel drainage system to increase the energy efficiency of the stormwater pump(s).
Operation Energy efficiency
2
T5 Geopolymer concrete
Replace typical concrete mixes (average 25% supplementary cementitious material replacement) with geopolymer concrete, a broad category of concrete that has its cement content 100% replaced by supplementary cementitious material (SCM) and alkali activators.
Design Materials 3
T6 Portland Limestone Cement (PLC)
Replace the Ordinary Portland Cement (OPC) in typical concrete mixes with Portland Limestone Cement (PLC), a variant that contains a higher proportion of (uncalcinated) limestone compared to OPC. PLC is allowed under North American concrete standards (AASHTO) as a replacement for OPC.
Design Materials 3
T7 50% Supplementary Cementitious Materials (SCM) replacement (Indonesia)
Replace typical concrete mixes (average 25% SCM replacement) with concrete containing 50% supplementary cementitious materials (SCM) replacement. The SCM modelled for this initiative was fly ash sourced from Indonesia.
Design Materials 3
T8 50% Supplementary Cementitious Materials (SCM) replacement (Japan)
Replace typical concrete mixes (average 25% SCM replacement) with concrete containing 50% supplementary cementitious materials (SCM) replacement. The SCM modelled for this initiative was slag sourced from Japan.
Design Materials 3
T9 Polymer concrete reinforcement
Replace steel mesh concrete reinforcement with a polymer-based mesh. Design Materials 3

Review of Emissions Reduction Opportunities – January 2019
Page 9
The tunnel infrastructure initiatives relate to a range of baseline emissions sources, from concrete and steel reinforcing mesh to various operational practices and construction and operations equipment.
The estimated baseline emissions metrics for the tunnel infrastructure initiatives are presented in Table 3.
Table 3 – Baseline emissions for tunnel infrastructure initiatives
Ref Initiative Baseline emissions source
Baseline GHG emissions
Unit Scope
T1 Solar hot water Conventional hot water heater
506 tCO2-e / unit 2
T2 Electric tunnelling equipment
Diesel roadheader 11,424 tCO2-e / km / lane 1
T3 Set points and control bands
HVAC - user controlled temperature
5,011 tCO2-e / facility 2
T4 Pump epoxy coating Unlined drainage pipes and pumps
31 tCO2-e / m2 of pipe 2
T5 Geopolymer concrete
Concrete (25% SCM, cradle to use3)
0.37 tCO2-e / m3 concrete 3
T6 PLC Concrete (25% SCM, cradle to gate4)
0.35 tCO2-e / m3 concrete 3
T7 50% SCM (Indonesia)
Concrete (25% SCM, cradle to gate)
0.34 tCO2-e / m3 concrete 3
T8 50% SCM (Japan) Concrete (25% SCM, cradle to gate)
0.37 tCO2-e / m3 concrete 3
T9 Polymer concrete reinforcement
Steel reinforcing mesh 2 tCO2-e / t steel 3
Figure 7 presents the baseline GHG emissions on a per kilometre basis. As per Figure 7, the largest sources of baseline emissions are the concrete-related baseline emissions sources (T5-T8). Other baseline sources had much lower overall GHG emissions on a per kilometre basis due to the quantity of concrete required in the project. Therefore, non-concrete emissions sources have a comparatively minor impact over the life cycle of tunnel infrastructure projects.
3 ‘Cradle to use’ refers to the scope of the footprint assessment. The relevant stages included in a ‘cradle to use’ assessment include: raw material extraction, transport to manufacturing site, manufacturing, transport to construction site and installation. The use stage is assessed for only those initiatives in which the use stage of the material differs between the baseline and proposed initiative, otherwise the scope of the footprint assessment is ‘cradle to gate.’
4 ‘Cradle to gate’ refers to the scope of the footprint assessment. The relevant stages included in a ‘cradle to gate’
assessment include: raw material extraction, transport to manufacturing site and manufacturing.

Review of Emissions Reduction Opportunities – January 2019
Page 10
Figure 7 | Baseline GHG emissions for tunnel initiatives (compared per km per lane)5
Figure 7 presents baseline GHG emissions for a subset of tunnel categories. As discussed earlier, current best practice in tunnel ventilation is already being implemented and is considered business as usual. As such, mitigation initiatives targeting energy efficient ventilation were not examined in this analysis. The same reasoning applies to tunnel lighting, where LED lighting is currently required in DPTI’s specifications. Thus, the difference between the baseline GHG emissions presented in Figure 7 is a reflection of the concentration of emissions in the top four categories (ventilation, coatings and finishes, concrete and lighting) and of these only concrete being represented in Figure 7 along with the other, less emissions-intensive categories.
The tunnel initiatives with the largest potential percentage reduction on baseline emissions were: polymer reinforcement concrete (90%), electric tunnelling equipment (80%), and solar hot water (43%) (Table 4).
Table 4 - GHG reductions for tunnel initiatives5
Ref Initiative Reduction on baseline emissions source (%)
Reduction – GHG emissions
Unit Scope
T9 Polymer concrete reinforcement
90% 1.46 tCO2-e / t steel 3
T2 Electric tunnelling equipment
80% 592 tCO2-e / km / lane 1
T1 Solar hot water 43% 218 tCO2-e / unit 2
T3 Set points and control bands
20% 1,002 tCO2-e / facility 2
T7 50% SCM (Indonesia)
23% 0.08 tCO2-e / m3 concrete 3
T4 Pump epoxy coating
10% 3 tCO2-e / m2 of pipe 2
T6 PLC 8% 0.03 tCO2-e / m3 concrete 3
5 A list of the GHG reductions in comparable units (i.e. per km) is provided in Appendix A.
-
2,000
4,000
6,000
8,000
10,000
12,000
Concrete(cradle to
use)
Operationscentre
Fuel use inconstruction
HVAC - usercontrolled
temperature
Unlineddrainagepipes and
pumps
Concrete(cradle to
gate)
Steelreinforcing
mesh
t C
O2-e
/ k
m /
lan
e

Review of Emissions Reduction Opportunities – January 2019
Page 11
Ref Initiative Reduction on baseline emissions source (%)
Reduction – GHG emissions
Unit Scope
T8 50% SCM (Japan) 12% 0.04 tCO2-e / m3 concrete 3
T5 Geopolymer concrete
14% 0.05 tCO2-e / m3 concrete 3
Geopolymer concrete is commonly reported to achieve a 40-80% reduction on greenhouse gas emissions compared to Ordinary Portland Cement (OPC) concrete with 0% supplementary cementitious materials (SCM) replacement. As such, it is often considered a better option in comparison to high (e.g. 50%) SCM concrete, However, such studies typically do not include pertinent differences in the manufacturing and installation life cycle stages, and therefore do not represent a full comparison of geopolymer concrete and OPC concrete. Specifically, the manufacturing of alkaline reagents and the longer curing time required should be included in the analysis6. To capture these downstream and upstream impacts in the material manufacturing and installation stages, a ‘cradle-to-use’ scope was specifically applied to the consideration of geopolymer concrete. A 2013 study6 that incorporates a ‘cradle-to-use’ scope reported a 9% reduction in carbon emissions compared to OPC concrete with 0% SCM. The result from the 2013 study was adapted for this report to reflect the SA context and established baseline (i.e. 25% SCM concrete, with fly ash or slag sourced from overseas). Table 4 presents the initiatives ranked by percent potential carbon reduction. However, this metric should not be considered discretely as decision making should also include comparison across a similar unit (e.g. per kilometre tunnel rather than m3 concrete) and consideration of cost implications.
As such, Table 5 ranks the initiatives by carbon reduction per kilometre. The initiatives which offer the largest abatement potential per kilometre of tunnel relate to OPC replacement: 50% SCM (Indonesia); geopolymer concrete; 50% SCM (Japan) and PLC (Table 5).
Table 5 – Rank of initiatives for implementation in tunnels by carbon reduction per kilometre
Rank Ref Initiative $/tCO2-e tCO2-e reduced/km/lane
1 T7 50% SCM (Indonesia) $163 2,345
2 T8 Geopolymer concrete $1,088 1,472
3 T6 50% SCM (Japan) $326 1,171
4 T5 PLC $472 807
5 T2 Electric tunnelling equipment $1,235 592
6 T9 Polymer concrete reinforcement $0 253
7 T3 Set points and control bands -$11,916 70
8 T4 Pump epoxy coating -$10,418 31
9 T1 Solar hot water -$198 6
It is also important to consider the cost of carbon reduction when considering the implementation of an initiative. Table 6 presents the results of the marginal abatement cost analysis. Those initiatives that have a negative or neutral cost of abatement should be given priority. A negative or neutral cost of abatement signifies an initiative that will result in cost savings or zero net cost over the life of the initiative (e.g. through reduced purchased electricity). Through the implementation of negative or neutral cost initiatives followed by the least cost initiatives, carbon can be reduced in the most cost-effective manner.
Those initiatives with the greatest carbon reduction per dollar spent (or saved) are: set points and control bands, pump epoxy coating, solar hot water and polymer reinforcement (Figure 8). However, the abatement potential of these initiatives is comparatively small in terms of tCO2-e abated per
6 Turner, L., & Collins, F. (2013). Carbon dioxide equivalent (CO2-e) emissions: A comparison between geopolymer and OPC cement concrete. Construction And Building Materials, 43(C), 125-130.

Review of Emissions Reduction Opportunities – January 2019
Page 12
kilometre. As mentioned previously, it is important to consider the carbon reduction in conjunction with the associated cost of the initiative.
Table 6 – Rank of initiatives for implementation in tunnels by cost
Rank Ref Initiative $/tCO2-e tCO2-e reduced/km/lane
1 T3 Set points and control bands - $11,916 70
2 T4 Pump epoxy coating - $10,418 31
3 T1 Solar hot water - $198 6
4 T6 Polymer concrete reinforcement - $0 253
5 T7 50% SCM (Indonesia) $163 2,345
6 T8 50% SCM (Japan) $326 1,171
7 T9 PLC $472 807
8 T5 Geopolymer concrete $1,088 1,472
9 T2 Electric tunnelling equipment $1,235 592
A limitation of the MACC analysis for tunnels relates to the assumption that contractors generally lease construction equipment and there is a 10% price premium for the lease of electrical (versus diesel) tunnelling equipment. However, due to data limitations we were unable to estimate the baseline cost for all diesel construction equipment used on site during construction. The carbon reduction for the electrical tunnelling equipment is based on the assumption that 30% of diesel equipment could be replaced with electric and / or hybrid equipment.
Negative or neutral cost of abatement

Review of Emissions Reduction Opportunities – January 2019 Page 13
Figure 8 | Marginal Abatement Cost Curve – Tunnel
Se
t poin
ts a
nd
co
ntro
l ban
ds
Pu
mp
epo
xy c
oatin
gS
ola
r hot w
ate
r
Po
lym
er c
oncre
te re
info
rce
me
nt
50%
SC
M (In
do
ne
sia
)
50%
SC
M (J
apa
n)
PL
C
Ge
op
oly
me
r co
ncre
te
Ele
ctric
tunn
ellin
g e
qu
ipm
en
t
-$14,000
-$12,000
-$10,000
-$8,000
-$6,000
-$4,000
-$2,000
$0
$2,000
0 1,000 2,000 3,000 4,000 5,000 6,000 7,000
Co
st
of
ab
ate
me
nt
(t/C
O2-e
)
Cumulative abatement (tCO2-e/km/lane)

Review of Emissions Reduction Opportunities – January 2019
Page 14
Rail
The mitigation initiatives examined in this study for rail infrastructure projects span a range of energy sources at various life cycle stages, including HVAC, construction equipment and energy and traction power. In addition, the material initiatives include emerging technologies and products such as the use of recycled plastic sleepers.
Emissions from purchased electricity in operations constituted the majority of life cycle emissions in the hotspot analysis for rail projects and are reflected in initiatives A1 and A4-A7 (Table 7).
The final list of rail initiatives examined in this study are presented in Table 7.

Review of Emissions Reduction Opportunities – January 2019 Page 15
Table 7 – List of GHG mitigation initiatives for rail
Ref Initiative Description Life cycle
Type Scope
A1 HVAC improvement Installation of latest HVAC technology in existing station upgrades (e.g. sensors, monitoring systems and efficient operational management)
Operation Energy efficiency
2
A2 Equipment electrification Electrification of 30% of construction equipment along with the use of solar battery for charging to provide maximum carbon reduction benefit
Construction Renewable energy
1
A3 Greenpower Use of 20% greenpower for construction electricity Construction Renewable energy
2
A4 Single-axle bogies Implementation of single-axle bogies (as opposed to dual-axle bogies) to reduce traction energy
Design Energy efficiency
2
A5 Energy-efficient train control strategies Implementation of computer-aided driver advisory systems to assist drivers in optimising energy efficiency
Operation Energy efficiency
2
A6 Energy-efficient driving strategies Provision of energy-efficient driving training course to all drivers Operation Energy efficiency
2
A7 Carpark lighting sensors Occupancy and perimeter lighting sensors installed in station carparks
Operation Energy efficiency
2
A8 Recycled plastic sleepers Use of recycled plastic sleepers (produced through extrusion7) Design Materials 3
A9 Recycled steel Use of 76% recycled content steel in construction Design Materials 3
7 The use of recycled plastic sleepers produced through injection moulding was also modelled; however, this initiative was excluded as it results in an overall increase in tCO2-e. As such, it is important to source recycled plastic sleepers that are extruded rather than injection moulded to ensure a carbon reduction.

Review of Emissions Reduction Opportunities – January 2019
Page 16
The rail infrastructure initiatives span the construction and operation of rail infrastructure, targeting construction electricity and fuel use, operational traction power, concrete and steel.
The baseline emissions for the rail infrastructure initiatives are presented in Table 8.
Table 8 - Baseline emissions for rail infrastructure initiatives
Ref Initiative Baseline emissions source Baseline GHG emissions
Unit Scope
A1 HVAC improvement BCA Section J compliant HVAC system
48,412 tCO2-e / station
2
A2 Equipment electrification
Diesel equipment 1,504 tCO2-e / km 1
A3 Greenpower 0% Greenpower 313 tCO2-e / km 2
A4 Single-axle bogies Business as usual traction power (e.g. dual-axle bogies, no traction optimisation or driving strategies)
86,567 tCO2-e / km 2
A5 Energy-efficient train control strategies
Business as usual traction power (e.g. dual-axle bogies, no traction optimisation or driving strategies)
86,567 tCO2-e / km 2
A6 Energy-efficient driving strategies
Business as usual traction power (e.g. dual-axle bogies, no traction optimisation or driving strategies)
86,567 tCO2-e / km 2
A7 Carpark lighting sensors
LED lighting with no sensors 497 tCO2-e / m2 of carpark
2
A8 Recycled plastic sleepers
Precast concrete sleepers 0.06 tCO2-e / sleeper
3
A9 Recycled steel 0% recycled content steel 2 tCO2-e / tonne steel
3
The largest sources of baseline emissions for rail were operational traction power and the HVAC system for the train stabling and administration facility (Figure 9). Other baseline sources had significantly lower GHG emissions, including diesel equipment in construction, steel and LED lighting in carparks.
Figure 9 | Baseline GHG emissions for rail initiatives (compared per km)8 *NB: The HVAC metric is provided per station rather than per kilometre and the LED lighting metric is provided per m2 of carpark
8 A list of the GHG reductions in comparable units (i.e. per km) is provided in Appendix A.
-
10,000
20,000
30,000
40,000
50,000
60,000
70,000
80,000
90,000
BCA SectionJ compliant
HVACsystem
Dieselequipment
Constructionelectricity -
0%Greenpower
Tractionpower
LED lighting- no sensors
Precastconcretesleepers
0% recycledcontent steelB
as
eli
ne
em
iss
ion
s (
t C
O2-e
/km
*)

Review of Emissions Reduction Opportunities – January 2019
Page 17
The rail initiatives with the largest percent reduction on baseline emissions are: recycled plastic sleepers (39%), lighting sensors for carparks (37%), construction equipment electrification (30%) and HVAC improvement for the train station (27%) (Table 9).
Table 9 - GHG reductions for rail initiatives5
Ref Initiative
Reduction on baseline emissions source (%)
Reduction – GHG emissions
Unit Scope
A8 Recycled plastic sleepers
39% 0.02 tCO2-e / sleeper
3
A7 Carpark lighting sensors
37% 184 tCO2-e / m2 of carpark
2
A2 Equipment electrification
30% 451 tCO2-e / km 1
A1 HVAC improvement 27% 13,071 tCO2-e / station
2
A3 Greenpower 20% 63 tCO2-e / km 2
A5 Energy-efficient train control strategies
20% 17,313 tCO2-e / km 2
A9 Recycled steel 17% 0.28 tCO2-e / tonne steel
3
A4 Single-axle bogies 5% 4,328 tCO2-e / km 2
A6 Energy-efficient driving strategies
2% 1,731 tCO2-e / km 2
Table 9 presents the initiatives ranked by percent potential carbon reduction. However, this metric should not be considered discretely as decision making should also include comparison across a similar unit (e.g. per kilometre rail rather than m3 concrete) and consideration of cost implications.
As such, Table 10 ranks the initiatives by carbon reduction per kilometre.
Table 10 – Rank of initiatives for implementation on rail by carbon reduction per kilometre
Rank Ref Initiative $/tCO2-e tCO2-e reduced/km
1 A5 Energy-efficient train control strategies - 17,313
2 A1 HVAC improvement $35 13,071**
3 A4 Single-axle bogies - 4,328
4 A6 Energy-efficient driving strategies -$1,325 1,731
5 A9 Recycled steel $81 1,077
6 A2 Equipment electrification -$544 451
7 A7 Carpark lighting sensors $0 184*
8 A3 Greenpower $5 63
9 A8 Recycled plastic sleepers $1,861 40
*NB: The lighting sensors metric is provided per m2 of carpark rather than per kilometre. **NB: The HVAC metric is provided per station rather than per kilometre.
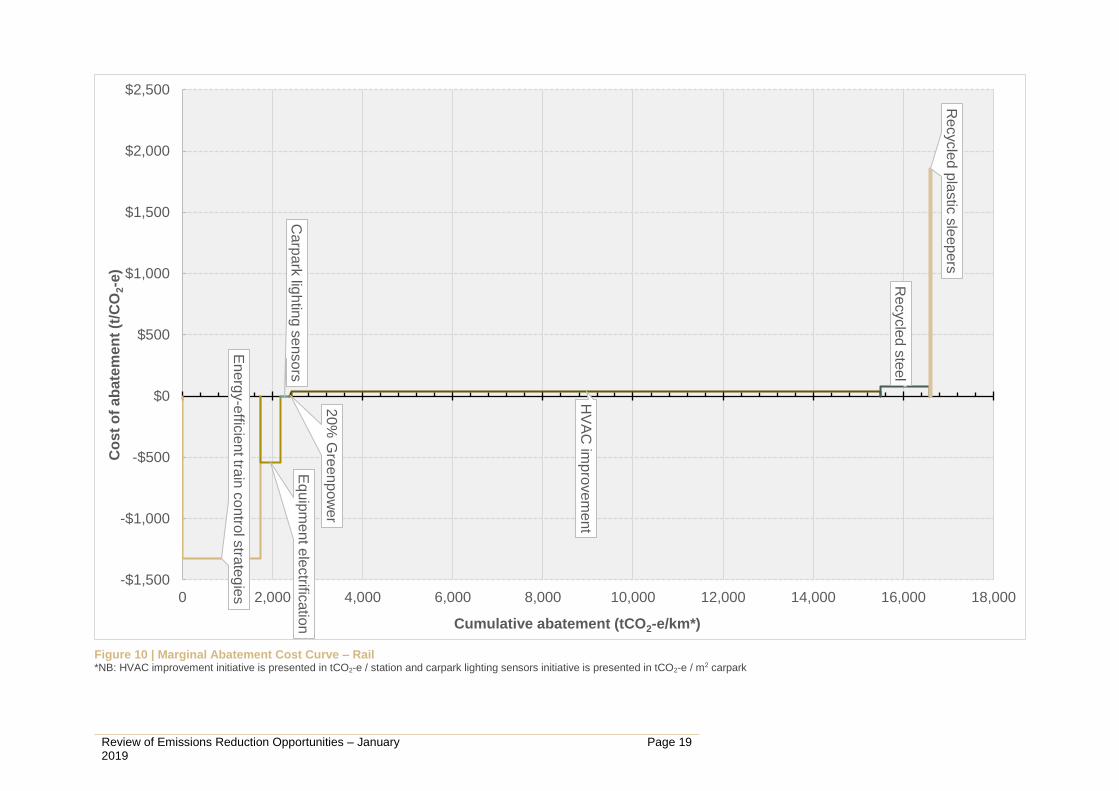
Table 11 presents the results of the marginal abatement cost analysis. Those initiatives with the greatest carbon reduction per dollar spent (or saved) are: energy-efficient driving strategies; equipment electrification and carpark lighting sensors (Figure 10).
Note, the abatement potential of these initiatives is relatively low compared to the abatement potential of energy-efficient train control strategies and station HVAC improvements in terms of tCO2-e abated

Review of Emissions Reduction Opportunities – January 2019
Page 18
per kilometre (Table 10). As mentioned previously, it is important to consider both the associated carbon reduction and the cost of the initiative.
Table 11 – Rank of initiatives for implementation on rail by cost
Rank Ref Initiative $/tCO2-e tCO2-e reduced/km
1 A6 Energy-efficient driving strategies -$1,325 1,731
2 A2 Equipment electrification -$544 451
3 A7 Carpark lighting sensors -$0 184*
4 A3 Greenpower $5 63
5 A1 HVAC improvement $35 13,071**
6 A9 Recycled steel $81 1,077
7 A8 Recycled plastic sleepers $1,861 40
- A4 Single-axle bogies - 4,328
- A5 Energy-efficient train control strategies - 17,313
*NB: The lighting sensors metric is provided per m2 of carpark rather than per kilometre. **NB: The HVAC metric is provided per station rather than per kilometre.
Limitations of the MACC for rail include:
• It is assumed contractors generally lease construction equipment and there is negligible price premium for the lease of electrical (versus diesel) equipment.
• Due to data and time limitations, it was not possible to estimate the cost difference associated with uptake of single-axel bogies compared to business as usual9. As such, this initiative has not been included in the MACC. The 5% energy saving translates to a cost saving of approximately $47,700 per year, or NPV saving of approximately $658,296 over the lifetime of the asset.
• There are numerous technologies that can be implemented to reduce traction energy. Due to data and time limitations and the wide range of technology available, it was not possible to cost this initiative. As such, it is currently excluded from the MACC. However, the potential cost effectiveness of this initiative should be recognised. Implementation of technology to improve energy efficiency can result in an approximate savings of 20%. This energy savings equates to approximately 34,627 tCO2-e over the lifetime of the asset. This carbon reduction translates to a NPV saving of $2.6 million over the life of the asset, or approximately $190,800 per year (excluding any associated capital costs). As such, the capital investment could be substantial and the initiative would still prove cost-effective.
9Any detailed cost-benefit analysis for this initiative should consider whole of life costs (e.g. wheel wear, rail wear,
additional components to install / maintain etc.).
Negative or neutral cost of abatement
Review of Emissions Reduction Opportunities – January 2019
Page 19
Figure 10 | Marginal Abatement Cost Curve – Rail *NB: HVAC improvement initiative is presented in tCO2-e / station and carpark lighting sensors initiative is presented in tCO2-e / m2 carpark
En
erg
y-e
fficie
nt tra
in c
ontro
l stra
teg
ies
Eq
uip
me
nt e
lectrific
atio
nC
arp
ark
ligh
ting
se
nso
rs
20%
Gre
en
po
we
r
HV
AC
imp
rove
me
nt
Re
cycle
d s
teel
Re
cycle
d p
lastic
sle
ep
ers
-$1,500
-$1,000
-$500
$0
$500
$1,000
$1,500
$2,000
$2,500
0 2,000 4,000 6,000 8,000 10,000 12,000 14,000 16,000 18,000
Co
st
of
ab
ate
me
nt
(t/C
O2-e
)
Cumulative abatement (tCO2-e/km*)

Review of Emissions Reduction Opportunities – January 2019
Page 20
Road
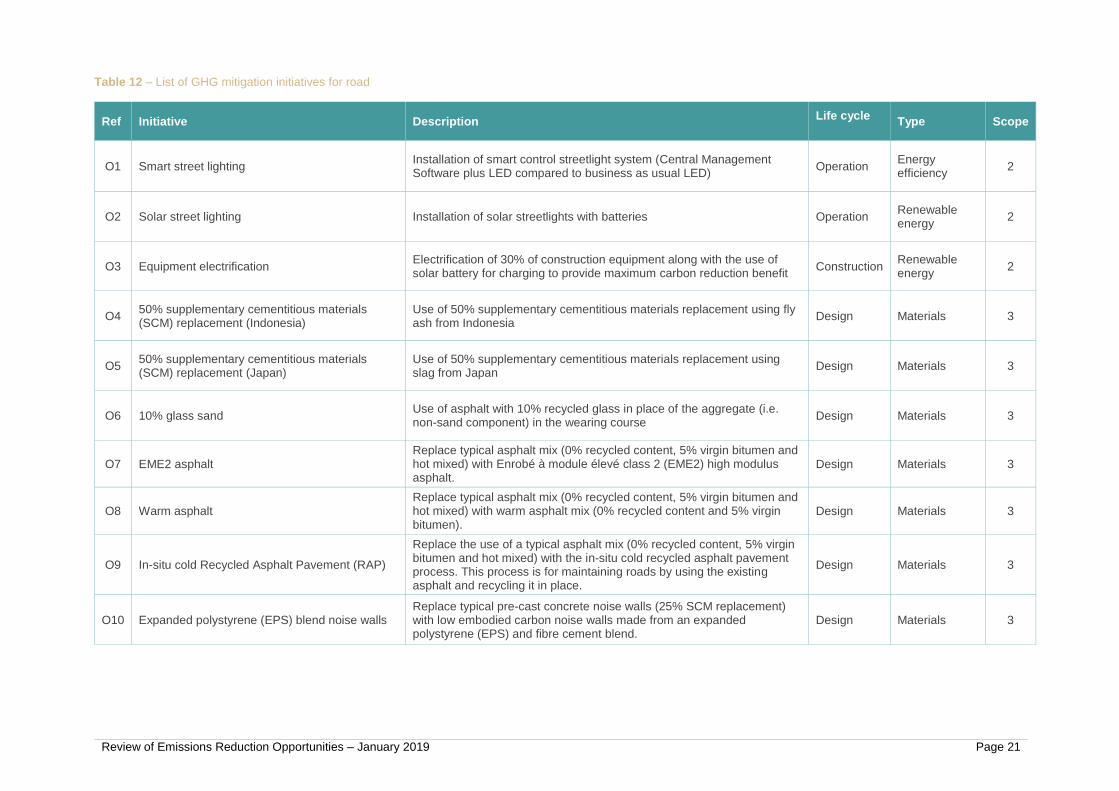
The abatement initiatives examined in this study for road infrastructure projects span a range of GHG sources at various life cycle stages, including lighting, use of materials and road users. The hotspot analysis for road projects indicated that material use (concrete, asphalt and steel) are among the top three contributors to the life cycle GHG impact of roads. Initiatives to address these sources of emissions have been included in the list.
The final list of road initiatives examined in this study are presented in Table 12.
Review of Emissions Reduction Opportunities – January 2019 Page 21
Table 12 – List of GHG mitigation initiatives for road
Ref Initiative Description Life cycle
Type Scope
O1 Smart street lighting Installation of smart control streetlight system (Central Management Software plus LED compared to business as usual LED)
Operation Energy efficiency
2
O2 Solar street lighting Installation of solar streetlights with batteries Operation Renewable energy
2
O3 Equipment electrification Electrification of 30% of construction equipment along with the use of solar battery for charging to provide maximum carbon reduction benefit
Construction Renewable energy
2
O4 50% supplementary cementitious materials (SCM) replacement (Indonesia)
Use of 50% supplementary cementitious materials replacement using fly ash from Indonesia
Design Materials 3
O5 50% supplementary cementitious materials (SCM) replacement (Japan)
Use of 50% supplementary cementitious materials replacement using slag from Japan
Design Materials 3
O6 10% glass sand Use of asphalt with 10% recycled glass in place of the aggregate (i.e. non-sand component) in the wearing course
Design Materials 3
O7 EME2 asphalt Replace typical asphalt mix (0% recycled content, 5% virgin bitumen and hot mixed) with Enrobé à module élevé class 2 (EME2) high modulus asphalt.
Design Materials 3
O8 Warm asphalt Replace typical asphalt mix (0% recycled content, 5% virgin bitumen and hot mixed) with warm asphalt mix (0% recycled content and 5% virgin bitumen).
Design Materials 3
O9 In-situ cold Recycled Asphalt Pavement (RAP)
Replace the use of a typical asphalt mix (0% recycled content, 5% virgin bitumen and hot mixed) with the in-situ cold recycled asphalt pavement process. This process is for maintaining roads by using the existing asphalt and recycling it in place.
Design Materials 3
O10 Expanded polystyrene (EPS) blend noise walls Replace typical pre-cast concrete noise walls (25% SCM replacement) with low embodied carbon noise walls made from an expanded polystyrene (EPS) and fibre cement blend.
Design Materials 3

Review of Emissions Reduction Opportunities – January 2019 Page 22
Ref Initiative Description Life cycle
Type Scope
O11 Intelligent Transport System (ITS) - signs and on-ramps
Introduce an intelligent transport system (ITS), specifically: variable speed signs for dynamically changing the speed limit on motorways and signalised on ramps for controlling the rate and timing of vehicles entering a motorway.
Operation Fuel use 3
O12 Intelligent Transport System (ITS) - congestion pricing
Introduce an intelligent transport system (ITS), specifically: road congestion pricing, charging road users for using motorways during congested periods and thus applying a financial disincentive for congestion.
Operation Fuel use 3
Review of Emissions Reduction Opportunities – January 2019
Page 23
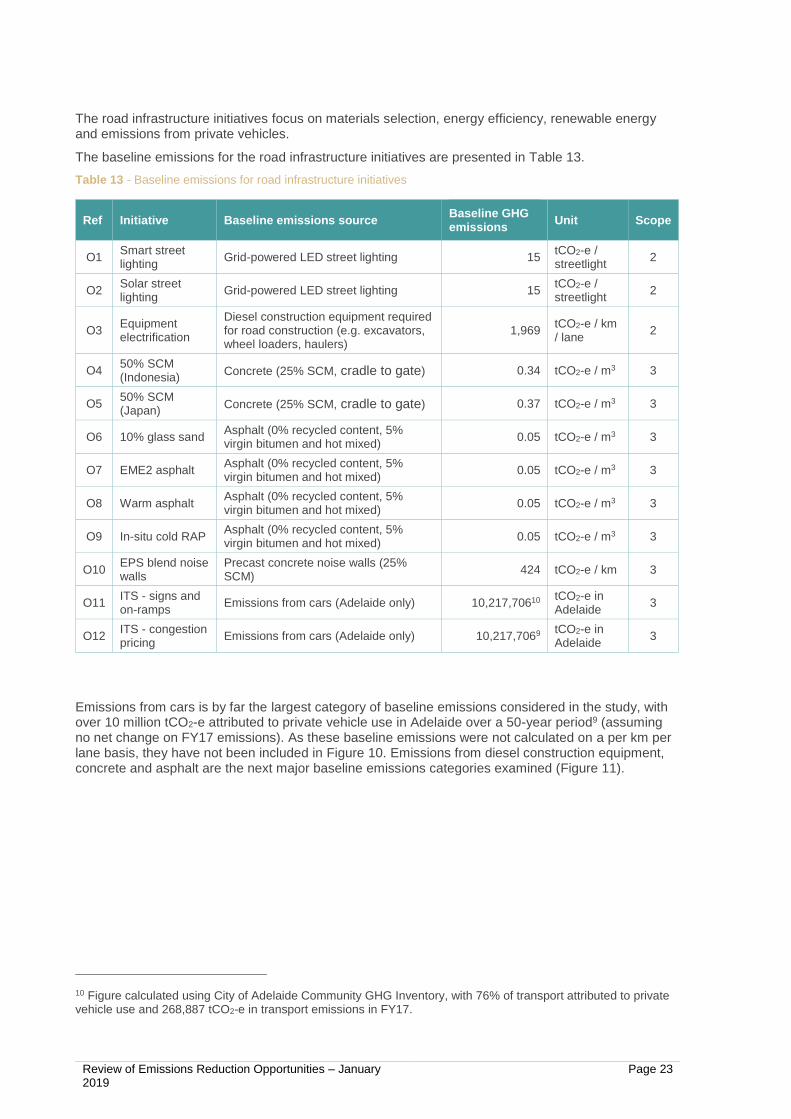
The road infrastructure initiatives focus on materials selection, energy efficiency, renewable energy and emissions from private vehicles.
The baseline emissions for the road infrastructure initiatives are presented in Table 13.
Table 13 - Baseline emissions for road infrastructure initiatives
Ref Initiative Baseline emissions source Baseline GHG emissions
Unit Scope
O1 Smart street lighting
Grid-powered LED street lighting 15 tCO2-e / streetlight
2
O2 Solar street lighting
Grid-powered LED street lighting 15 tCO2-e / streetlight
2
O3 Equipment electrification
Diesel construction equipment required for road construction (e.g. excavators, wheel loaders, haulers)
1,969 tCO2-e / km / lane
2
O4 50% SCM (Indonesia)
Concrete (25% SCM, cradle to gate) 0.34 tCO2-e / m3 3
O5 50% SCM (Japan)
Concrete (25% SCM, cradle to gate) 0.37 tCO2-e / m3 3
O6 10% glass sand Asphalt (0% recycled content, 5% virgin bitumen and hot mixed)
0.05 tCO2-e / m3 3
O7 EME2 asphalt Asphalt (0% recycled content, 5% virgin bitumen and hot mixed)
0.05 tCO2-e / m3 3
O8 Warm asphalt Asphalt (0% recycled content, 5% virgin bitumen and hot mixed)
0.05 tCO2-e / m3 3
O9 In-situ cold RAP Asphalt (0% recycled content, 5% virgin bitumen and hot mixed)
0.05 tCO2-e / m3 3
O10 EPS blend noise walls
Precast concrete noise walls (25% SCM)
424 tCO2-e / km 3
O11 ITS - signs and on-ramps
Emissions from cars (Adelaide only) 10,217,70610 tCO2-e in Adelaide
3
O12 ITS - congestion pricing
Emissions from cars (Adelaide only) 10,217,7069 tCO2-e in Adelaide
3
Emissions from cars is by far the largest category of baseline emissions considered in the study, with over 10 million tCO2-e attributed to private vehicle use in Adelaide over a 50-year period9 (assuming no net change on FY17 emissions). As these baseline emissions were not calculated on a per km per lane basis, they have not been included in Figure 10. Emissions from diesel construction equipment, concrete and asphalt are the next major baseline emissions categories examined (Figure 11).
10 Figure calculated using City of Adelaide Community GHG Inventory, with 76% of transport attributed to private vehicle use and 268,887 tCO2-e in transport emissions in FY17.

Review of Emissions Reduction Opportunities – January 2019
Page 24
Figure 11 | Baseline GHG emissions for road initiatives (compared per km per lane)11 – excludes emissions from cars * NB: the LED street lighting metric is provided per kilometre rather than per kilometre per lane.
The road initiatives with the largest percent reduction on baseline emissions were: solar street lighting (100%), EPS blend noise walls (71%) and in-situ cold recycled asphalt pavement (50%) (Table 14).
Table 14 - GHG reductions for road initiatives5
Ref Initiative Reduction on baseline emissions source (%)
Reduction – GHG emissions
Unit Scope
O2 Solar street lighting 100% 15 tCO2-e / streetlight 2
O10 EPS blend noise walls 71% 299 tCO2-e / km 3
O9 In-situ cold RAP 50% 0.0238 tCO2-e / m3 asphalt 3
O3 Equipment electrification 30% 591 tCO2-e / km / lane 2
O4 50% SCM (Indonesia) 23% 0.08 tCO2-e / m3 concrete 3
O12 ITS - congestion pricing 18% 1,839,187 tCO2-e in Adelaide 3
O1 Smart street lighting 15% 2 tCO2-e / streetlight 2
O8 Warm asphalt 13% 0.0062 tCO2-e / m3 asphalt 3
O11 ITS - signs and on-ramps 11% 1,123,948 tCO2-e in Adelaide 3
O5 50% SCM (Japan) 12% 0.04 tCO2-e / m3 concrete 3
O7 EME2 asphalt 5% 0.0025 tCO2-e / m3 asphalt 3
O6 10% glass sand 1% 0.0003 tCO2-e / m3 asphalt 3
Table 14 presents the initiatives ranked by percent potential carbon reduction. However, this metric should not be considered discretely as decision making should also include comparison across a similar unit (e.g. per kilometre road rather than m3 concrete) and consideration of cost implications.
As such, Table 15 ranks the initiatives by carbon reduction per kilometre.
11 A list of the GHG reductions in comparable units (i.e. per km) is provided in Appendix A.
-
500
1,000
1,500
2,000
2,500
LED street lighting Diesel equipment Concrete (25%SCM)
Asphalt Precast concretenoise walls
Ba
se
lin
e e
mis
sio
ns
(t
CO
2-e
/km
/la
ne
*)

Review of Emissions Reduction Opportunities – January 2019
Page 25
Table 15 – Rank of initiatives for implementation on roads by carbon reduction per kilometre
Rank Ref Initiative $/tCO2-e tCO2-e reduced/km/lane
1 O3 Equipment electrification -$510 591
2 O2 Solar street lighting -$3,792 492*
3 O4 50% SCM (Indonesia) $102 423
4 O9 In-situ cold RAP -$1 384
5 O7 EME2 asphalt -$1,406 299
6 O5 50% SCM (Japan) $161 268
7 O8 Warm asphalt $1,196 100
8 O1 Smart street lighting -$4,863 74*
9 O10 EPS blend noise walls -$2,994 41
10 O6 10% glass sand -$17,133** 5
N/A O11 ITS - signs and on-ramps N/A N/A^
N/A O12 ITS - congestion pricing N/A N/A^^
* NB: the smart street lighting and solar street lighting metrics are provided per kilometre rather than per kilometre per lane. ** NB: the cost calculation assumes locally produced glass sand, or glass sand with minimal procurement costs. ^ NB: the effect of implementing variable speed signs and signalised on ramps has been measured for the motorway length and cannot be meaningfully reduced to a per km and per lane metric. Overall, the associated reduction of implementing ITS – signs and on-ramps is approximately 1.1M tCO2-e. ^^ NB: the congestion pricing initiative applies to an area-wide reduction in emissions, with Adelaide city modelled in this analysis. Data on the km of roads and number of lanes in Adelaide city are required for determining this figure. Overall, the associated reduction of implementing ITS – congestion pricing is approximately 1.8M tCO2-e.
Table 16 presents the results of the marginal abatement cost analysis. Those initiatives with the greatest carbon reduction per dollar spent (or saved) are: 10% glass sand, smart street lighting, solar street lighting, EPS blend noise walls, EME2 asphalt, equipment electrification and in-situ cold RAP (Figure 12).
Table 16 – Rank of initiatives for implementation on roads by cost
Rank Ref Initiative $/tCO2-e tCO2-e reduced/km/lane
1 O6 10% glass sand -$17,133** 5
2 O1 Smart street lighting -$4,863 74*
3 O2 Solar street lighting -$3,792 492*
4 O7 EME2 asphalt -$2,994 41
5 O10 EPS blend noise walls -$1,406 299
6 O3 Equipment electrification -$510 591
7 O9 In-situ cold RAP -$1 384
8 O4 50% SCM (Indonesia) $102 423
9 O5 50% SCM (Japan) $163 268
10 O8 Warm asphalt $1,196 100
N/A O11 ITS - signs and on-ramps N/A N/A^
N/A O12 ITS - congestion pricing N/A N/A^^
*NB: the smart street lighting and solar street lighting metrics are provided per kilometre rather than per kilometre per lane. **NB: the cost calculation assumes locally produced glass sand, or glass sand with minimal procurement costs. ^NB: the effect of implementing variable speed signs and signalised on ramps has been measured for the motorway length and cannot be meaningfully reduced to a per km and per lane metric. Overall, the associated reduction of implementing ITS – signs and on-ramps is approximately 1.1M tCO2-e.
Negative or neutral cost of abatement

Review of Emissions Reduction Opportunities – January 2019
Page 26
^^NB: the congestion pricing initiative applies to an area-wide reduction in emissions, with Adelaide city modelled in this analysis. Data on the km of roads and number of lanes in Adelaide city are required for determining this figure. Overall, the associated reduction of implementing ITS – congestion pricing is approximately 1.8M tCO2-e.
Limitations of the MACC for road include:
• It is assumed contractors generally lease construction equipment and there is negligible price premium for the lease of electrical (versus diesel) equipment.
• The net present value of EME2 asphalt can be calculated in two ways:
1. A net reduction in upfront capex costs due to the reduced thickness of the base layer; or
2. A net increase in capex costs due to the use of the harder EME2 binder at the same base layer thickness as a conventional road, with operational savings due to reduced maintenance costs.
The first option was modelled in this study to reflect current practice in Australia, with EME2 asphalt being used to reduce pavement thickness in technology transfer projects in Queensland12.
• Asphalt with recycled plastic replacement was modelled; however, this initiative was excluded from the analysis as it results in no net reduction in carbon. At the time of reporting, research was being conducted to better understand the maintenance requirements and lifespan associated with this material. It is recommended that DPTI continue to investigate this material, as carbon reductions would be realised if research concludes that asphalt with recycled plastic has reduced maintenance requirements and a longer lifespan than baseline asphalt.
• It is assumed 50% supplementary cementitious materials replacement using fly ash from Indonesia and slag from Japan have the same price premium (5%) compared to baseline concrete with 25% supplementary cementitious materials. The cost for both materials is estimated at $0.13 per kilogram. However, Table 16 presents cost on a per tCO2-e reduced. 50% supplementary cementitious materials replacement using fly ash from Indonesia has a lower carbon footprint and therefore reduces more carbon per dollar spent compared to the use of slag from Japan.
• Due to data and time limitations, it was not possible to estimate the cost savings associated with the Intelligent Transport System (ITS) initiatives within the SA context (O11 and O12). As such, these initiatives have not been included in the MACC. Both initiatives have been found to have a positive Benefit Cost Ratio (BCR), with variable speed limits found to have a BCR range of 5-1013, ramp metering a BCR of greater than 1013 and congestion pricing a BCR range of 1.5-214.
12 http://www.aapaq.org/q/projects/EME/docs/QTMR_ET_EME-long_lasting_structural_asphalt_Distin-Vos-final.pdf
13 Bureau of Infrastructure, Transport and Regional Economics (BITRE), 2017, Costs and benefits of emerging road transport technologies, Report 146, BITRE, Canberra ACT
14 Murray, Peter (2012), Congestion pricing for roads: An overview of current best practice, and the economic and transport benefits for government, Public Infrastructure Bulletin, 1, Issue 8, Article 8. and André De Palma, Robin Lindsey, 2009, Traffic Congestion Pricing Methods and Technologies, Ecole Polytechnique

Review of Emissions Reduction Opportunities – January 2019 Page 27
Figure 12 | Marginal Abatement Cost Curve – Road *NB: Solar street lighting and smart street lighting initiatives are presented in tCO2-e/km
10%
gla
ss s
and
Sm
art s
treet lig
htin
g
So
lar s
treet lig
htin
g
EM
E2
asph
alt
EP
S b
lend
no
ise
wa
lls
Eq
uip
me
nt e
lectrific
atio
n
In-s
itu c
old
RA
P
50%
SC
M (In
do
ne
sia
)
50%
SC
M (J
apa
n)
Wa
rm a
sph
alt
-$20,000
-$15,000
-$10,000
-$5,000
$0
$5,000
0 500 1,000 1,500 2,000 2,500 3,000
Co
st
of
ab
ate
me
nt
(t/C
O2-e
)
Cumulative abatement (tCO2-e/km/lane*)
Review of Emissions Reduction Opportunities – January 2019 Page 28
Initiatives excluded from final list
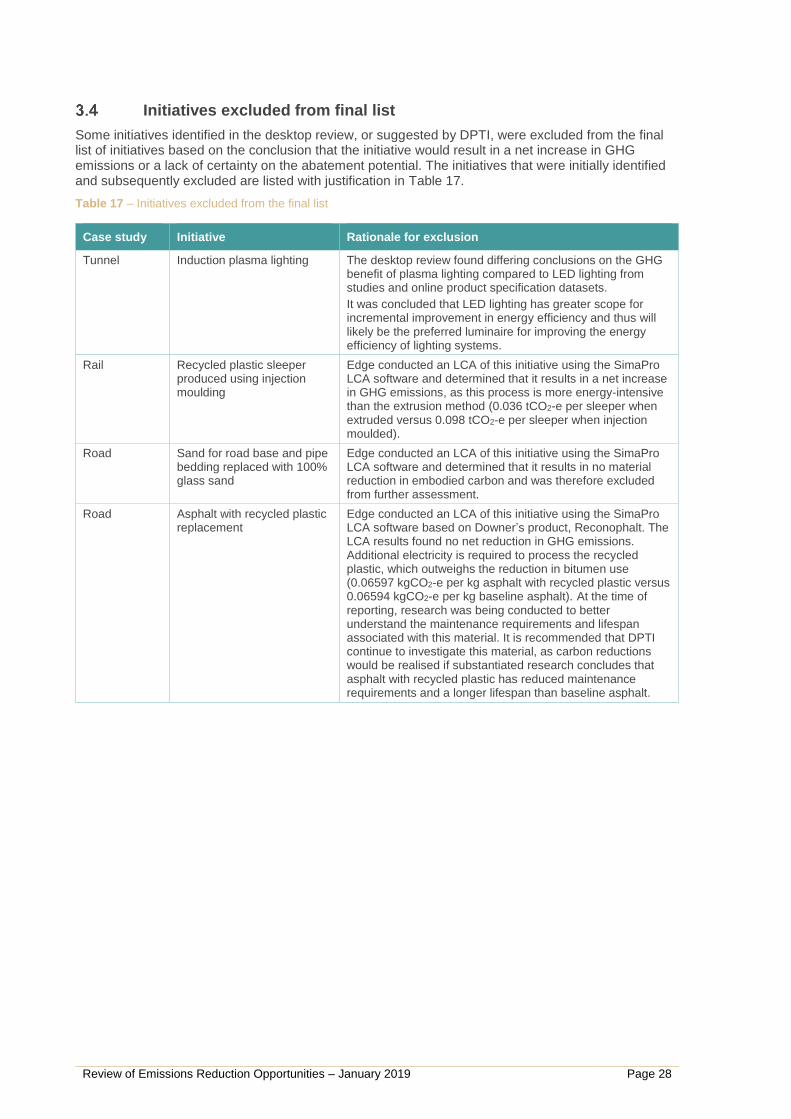
Some initiatives identified in the desktop review, or suggested by DPTI, were excluded from the final list of initiatives based on the conclusion that the initiative would result in a net increase in GHG emissions or a lack of certainty on the abatement potential. The initiatives that were initially identified and subsequently excluded are listed with justification in Table 17.
Table 17 – Initiatives excluded from the final list
Case study Initiative Rationale for exclusion
Tunnel Induction plasma lighting The desktop review found differing conclusions on the GHG benefit of plasma lighting compared to LED lighting from studies and online product specification datasets.
It was concluded that LED lighting has greater scope for incremental improvement in energy efficiency and thus will likely be the preferred luminaire for improving the energy efficiency of lighting systems.
Rail Recycled plastic sleeper produced using injection moulding
Edge conducted an LCA of this initiative using the SimaPro LCA software and determined that it results in a net increase in GHG emissions, as this process is more energy-intensive than the extrusion method (0.036 tCO2-e per sleeper when extruded versus 0.098 tCO2-e per sleeper when injection moulded).
Road Sand for road base and pipe bedding replaced with 100% glass sand
Edge conducted an LCA of this initiative using the SimaPro LCA software and determined that it results in no material reduction in embodied carbon and was therefore excluded from further assessment.
Road Asphalt with recycled plastic replacement
Edge conducted an LCA of this initiative using the SimaPro LCA software based on Downer’s product, Reconophalt. The LCA results found no net reduction in GHG emissions. Additional electricity is required to process the recycled plastic, which outweighs the reduction in bitumen use (0.06597 kgCO2-e per kg asphalt with recycled plastic versus 0.06594 kgCO2-e per kg baseline asphalt). At the time of reporting, research was being conducted to better understand the maintenance requirements and lifespan associated with this material. It is recommended that DPTI continue to investigate this material, as carbon reductions would be realised if substantiated research concludes that asphalt with recycled plastic has reduced maintenance requirements and a longer lifespan than baseline asphalt.

Review of Emissions Reduction Opportunities – January 2019 Page 29
4 Next Steps A summary of the analysis results is provided in Tables 18, 19 and 20 for each type of infrastructure.
If DPTI specified all negative or neutral cost of abatement initiatives, the following potential savings could be realised:
• 360 tCO2-e per kilometre per lane of tunnel, or an approximate savings of 0.1% compared to baseline;
• 1,840 tCO2-e per kilometre per lane of road, or an approximate savings of 48% compared to baseline; and
• 2,367 tCO2-e per kilometre of rail, or an approximate savings of 3% compared to baseline.
In the instance of existing interdependencies, the initiative with the greatest carbon reduction potential was included in the overall estimated savings and any related interdependent initiatives were then excluded (Tables 4, 5 and 6).
If all initiatives were specified (accounting for interdependencies), the following savings could be realised:
• 4,104 tCO2-e per kilometre per lane of tunnel, or an approximate savings of 1% compared to baseline;
• 2,263 tCO2-e per kilometre per lane of road, or an approximate savings of 59% compared to baseline; and
• 38,196 tCO2-e per kilometre of rail, or an approximate savings of 49% compared to baseline.
It is recommended that DPTI compare the proposed initiatives and consider the uptake of, at a minimum, those initiatives that have been found to have a negative or neutral cost of abatement (i.e. the return on investment is greater than any required increase in capital or operational expenditure). Furthermore, many additional initiatives could be implemented at relatively low cost per tCO2-e reduced. It is therefore recommended that DPTI undertake more detailed and project-specific feasibility studies or trials of the most effective initiatives as the next step in considering initiatives for requirement in the specification based on DPTI’s desired carbon reduction target.
Lastly, it is important to note the proposed initiatives have been assessed solely from a carbon perspective. Some initiatives may provide environmental and sustainability benefits beyond carbon, such as the use of recycled glass sand in place of sand for road piping and bedding or recycled plastic in place of bitumen. Initiatives such as these, which result in minimal to no net reduction in carbon but have a positive benefit to society through waste reduction and material reuse, could also be considered for requirement as part of a broader sustainability focus.

Review of Emissions Reduction Opportunities – January 2019 Page 30
Table 18 – Tunnel Initiatives
Rank Ref Initiative % carbon reduction
$/tCO2-e tCO2-e reduced / km / lane
Interdependency
1 T3 Set points and control bands 0.02% -$11,916 70 n/a
2 T4 Pump epoxy coating 0.01% -$10,418 31 n/a
3 T1 Solar hot water 0.00% -$198 6 n/a
4 T6 Polymer concrete reinforcement 0.07% $0 253 n/a
5 T7 50% SCM (Indonesia) 0.6% $163 2,345 Cannot be used in addition to 50% SCM (Japan), but could be used in combination.
6 T8 50% SCM (Japan) 0.3% $326 1,171 Cannot be used in addition to 50% SCM (Indonesia), but could be used in combination.
7 T9 PLC 0.2% $472 807 n/a
8 T5 Geopolymer concrete 0.4% $1,088 1,472 Cannot be used in combination with 50% SCM (Japan) or 50% SCM (Indonesia).
9 T2 Electric Tunnelling equipment 0.16% $1,235 592 n/a
Table 19 – Road Initiatives
Rank Ref Initiative % carbon reduction
$/tCO2-e tCO2-e reduced / km
/ lane
Interdependency
1 O6 10% glass sand 0.1% -$17,133 5 Further investigation required to determine capability with warm asphalt, in-situ cold RAP and EME2 asphalt.
2 O1 Smart street lighting 1.9% -$4,863 74 Can be implemented in combination with solar street lighting for increased emission reductions.
3 O2 Solar street lighting 12.8% -$3,792 492 Can be implemented in combination with smart street lighting for increased emission reductions.
4 O7 EME2 asphalt 1.1% -$2,994 41 Cannot be used in combination with in-situ cold RAP. Further investigation required to determine capability with 10% glass sand asphalt.
5 O10 EPS blend noise walls 7.8% -$1,406 299 n/a
6 O3 Equipment electrification 15.3% -$510 591 n/a

Review of Emissions Reduction Opportunities – January 2019 Page 31
Rank Ref Initiative % carbon reduction
$/tCO2-e tCO2-e reduced / km
/ lane
Interdependency
7 O9 In-situ cold RAP 10.0% -$1 384 Cannot be used with EME2 asphalt and warm asphalt. Further investigation required to determine capability with 10% glass sand asphalt.
8 O4 50% SCM (Indonesia) 11.0% $102 423 Cannot be used in addition to 50% SCM (Japan), but could be used in combination.
9 O5 50% SCM (Japan) 7.0% $161 268 Cannot be used in addition to 50% SCM (Indonesia), but could be used in combination.
10 O8 Warm asphalt 2.6% $1,196 100 Cannot be used in combination with in-situ cold RAP. Further investigation required to determine capability with 10% glass sand asphalt.
* NB: the smart street lighting and solar street lighting metrics are provided per kilometre rather than per kilometre per lane.
Table 20 – Rail Initiatives
Rank Ref Initiative % carbon reduction
$/tCO2-e tCO2-e reduced/km
Interdependency
1 A6 Energy-efficient driving strategies
2.2% -$1,325 1,731 If greenpower is implemented in operation, the carbon reduction potential of this scenarios will reduce. This initiative can be implemented in combination with EE train control strategies for increased emission reductions.
2 A2 Equipment electrification 0.6% -$544 451 If greenpower is implemented in construction, the carbon reduction potential of this scenarios will reduce.
3 A7 Carpark lighting sensors 0.2% -$0 184* If greenpower is implemented in operation, the carbon reduction potential of this scenarios will reduce.
4 A3 Greenpower 0.1% $5 63 If greenpower is implemented, the carbon reduction potential of energy efficiency scenarios will reduce.
5 A1 HVAC improvement 16.9% $35 13,071** If greenpower is implemented in operation, the carbon reduction potential of this scenarios will reduce.
6 A9 Recycled steel 1.4% $81 1,077 n/a
7 A8 Recycled plastic sleepers 0.1% $1,861 40 n/a
n/a A4 Single-axle bogies 5.6% n/a 4,328 n/a
n/a A5 Energy-efficient train control strategies
22.4% n/a 17,313 If greenpower is implemented in operation, the carbon reduction potential of this scenarios will reduce. This initiative can be implemented in combination with EE train control strategies for increased emission reductions.
*NB: The lighting sensors metric is provided per m2 of carpark rather than per kilometre. **NB: The HVAC metric is provided per station rather than per kilometre.

Review of Emissions Reduction Opportunities – January 2019 Page 32

Review of Emissions Reduction Opportunities – January 2019 Page 33
Appendix A: List of baseline GHG emissions
Ref Initiative Phase Scope Baseline emissions source
Baseline GHG emissions
Unit
Tunnel (100 years)
T1 Solar hot water Operation 2 Conventional hot water heater
14 tCO2-e / km / lane
T2 Electric tunnelling equipment
Construction 1 Diesel roadheader 743 tCO2-e / km / lane
T3 Set points and control bands
Operation 2 HVAC - user controlled temperature
348 tCO2-e / km / lane
T4 Pump epoxy coating Operation 2 Unlined drainage pipes and pumps
313 tCO2-e / km / lane
T5 Geopolymer concrete Design 3 Concrete (25% SCM, cradle to use)
10,617 tCO2-e / km / lane
T6 PLC Design 3 Concrete (25% SCM, cradle to gate)
10,103 tCO2-e / km / lane
T7 50% SCM (Indonesia) Design 3 Concrete (25% SCM, cradle to gate)
10,103 tCO2-e / km / lane
T8 50% SCM (Japan) Design
3 Concrete (25% SCM, cradle to gate)
10,103 tCO2-e / km / lane
T9 Polymer concrete reinforcement
Design 3 Steel reinforcing mesh 281 tCO2-e / km / lane
Rail (50 years)
A1 HVAC improvement Operation 2 BCA Section J compliant HVAC system
48,412 tCO2-e / station
A2 Equipment electrification Construction 1 Diesel equipment 1,504 tCO2-e / km
A3 Greenpower Construction 2 0% Greenpower 313 tCO2-e / km
A4 Single-axle bogies Operation 2 Traction power - dual axle bogies
86,567 tCO2-e / km
A5 Energy-efficient train control strategies
Operation 2 Traction power - no traction optimisation
86,567 tCO2-e / km

Review of Emissions Reduction Opportunities – January 2019 Page 34
Ref Initiative Phase Scope Baseline emissions source
Baseline GHG emissions
Unit
A6 Energy-efficient driving strategies
Operation 2 Traction power - no driving strategies
86,567 tCO2-e / km
A7 Carpark lighting sensors Operation 2 LED lighting - no sensors 497 tCO2-e / m2 carpark
A8 Recycled plastic sleepers Design 3 Precast concrete sleepers
103 tCO2-e / km
A9 Recycled steel Design 3 0% recycled content steel
1,077 tCO2-e / km
Road (50 years)
O1 Smart street lighting Operation 2 LED street lighting 492 tCO2-e / km
O2 Solar street lighting Operation 2 LED street lighting 492 tCO2-e / km
O3 Equipment electrification Construction 2 Diesel equipment 1,969 tCO2-e / km / lane
O4 50% SCM (Indonesia) Design 3 Concrete (25% SCM, cradle to gate)
1,821 tCO2-e / km / lane
O5 50% SCM (Japan) Design 3 Concrete (25% SCM, cradle to gate)
2,315 tCO2-e / km / lane
O6 10% glass sand Design 3 Asphalt 768 tCO2-e / km / lane
O7 EME2 asphalt Design 3 Asphalt 768 tCO2-e / km / lane
O8 Warm asphalt Design 3 Asphalt 768 tCO2-e / km / lane
O9 In-situ cold RAP Design 3 Asphalt 768 tCO2-e / km / lane
O10 EPS blend noise walls Design 3 Precast concrete noise walls
424 tCO2-e / km / lane
O11 ITS - signs and on-ramps Operation 3 Emissions from private cars (Adelaide only)
10,217,706 tCO2-e in Adelaide
O12 ITS - congestion pricing Operation 3 Emissions from private cars (Adelaide only)
10,217,706 tCO2-e in Adelaide

Review of Emissions Reduction Opportunities – January 2019 Page 35
Appendix B: List of GHG emissions reductions
Ref Initiative Scope GHG emissions reduction
Unit Source
Tunnel (100 years)
T1 Solar hot water 2 6 tCO2-e / km / lane Edge database of infrastructure projects.
T2 Electric tunnelling equipment
1 592 tCO2-e / km / lane Calculation based on energy density conversion and reduction of associated diesel use.
T3 Set points and control bands
2 70 tCO2-e / km / lane Westconnex M5 and NSW Office of Environment and Heritage, 2015, I am your optimisation guide: heating, ventilation and air conditioning systems.
T4 Pump epoxy coating 2 31 tCO2-e / km / lane Peeling et al., 2016, Energy efficient tunnel solutions, Transportation Research Procedia - https://www.sciencedirect.com/science/article/pii/S235214651630223X
T5 Geopolymer concrete 3 1,472 tCO2-e / km / lane Turner, L., & Collins, F. (2013). Carbon dioxide equivalent (CO2-e) emissions: A comparison between geopolymer and OPC cement concrete. Construction and Building Materials, 43(C), 125-130.
T6 PLC 3 807 tCO2-e / km / lane
Thomas, M., Cail, K., Blair, B., Delagrave, A., Masson, P., & Kazanis. (2010). Use of low-CO 2 Portland limestone cement for pavement construction in Canada. International Journal of Pavement Research and Technology, 3(5), 228-233.
T7 50% SCM (Indonesia) 3 2,345 tCO2-e / km / lane Edge database of infrastructure projects. Carbon reductions estimated using SimaPro.
T8 50% SCM (Japan) 3 1,171 tCO2-e / km / lane Edge database of infrastructure projects. Carbon reductions estimated using SimaPro.
T9 Polymer concrete reinforcement
3
253 tCO2-e / km / lane
Emesh by Fibercon EPD - https://epd-australasia.com/wp-content/uploads/2018/04/epd864.pdf
Yin, S., Tuladhar, R., Sheehan, M., Combe, M., Lister, T., & Collister, S. (2016). A life cycle assessment of recycled polypropylene fibre in concrete footpaths. Journal of Cleaner Production, 112(P4), 2231-2242."
Rail (50 years)
A1 HVAC improvement 2 13,701 tCO2-e / station Edge database of infrastructure projects.
A2 Equipment electrification 1 451 tCO2-e / km Edge database of infrastructure projects.

Review of Emissions Reduction Opportunities – January 2019 Page 36
Ref Initiative Scope GHG emissions reduction
Unit Source
A3 Greenpower 2 63 tCO2-e / km Edge database of infrastructure projects. Reduction based on a per % conversion from SA grid electricity to greenpower.
A4 Single-axle bogies 2 4,328 tCO2-e / km
Nolte, R. (2003). Evaluation of Energy Efficiency Technologies for Rolling Stock and Train Operation of Railways. Commissioned by the International Union of Railways. https://www.izt.de/pdfs/IZT_EVENT_Final_Report.pdf
Lenhard, D. (2000). Der LIREX-Technologieträger für den Nahverkehr. ETR 10/00, p. 657. As presented on the International Union of Railways Energy Efficiency Technologies for Railways. http://www.railway-energy.org/static/Single_axle_bogies_11.php
A5 Energy-efficient train control strategies
2 17,313 tCO2-e / km
Yang, L, et. al. (2013). Achieving energy-efficiency and on-time performance with Driver Advisory Systems. 2013 IEEE Int’l Conference on Intelligent Rail Transportation (ICIRT), p. 13-18.
Su, S. et. al. (2014). Energy-efficient train control in urban rail transit systems. Journal of Rail and Rapid Transit 2015. 229(4): 446 – 454.
Luijt, R. et. al. (2017). 5 years of Dutch eco-driving: Managing behavioural change. Transport Research Part A. 98(2017): 46 – 63.
Su, S. et. al. (2015). Evaluation of strategies to reducing traction energy consumption of metro systems using an optimal train control simulation model. Energies 2016
More information:
http://www.railway-energy.org/tfee/index.php?ID=220&TECHNOLOGYID=4&SEL=210&SEKTION=Sec1_opened#a_General%20information
http://www.irse.org/knowledge/publicdocuments/A3_ExperienceofC-DASinSweden.pdf
A6 Energy-efficient driving strategies
2 1,731 tCO2-e / km
ISCA database of infrastructure projects.
Luijt, R. et. al. (2017). 5 years of Dutch eco-driving: Managing behavioural change. Transport Research Part A. 98(2017): 46 – 63.
More information: http://www.railway-energy.org/tfee/index.php?ID=220&TECHNOLOGYID=74&SEL=210&SEKTION=Sec1_closed#a_General%20information
A7 Carpark lighting sensors 2 184 tCO2-e / m2 carpark Edge database of infrastructure projects.
A8 Recycled plastic sleepers 3 40 tCO2-e / km Carbon reductions estimated using SimaPro.
A9 Recycled steel 3 186 tCO2-e / km Edge database of infrastructure projects. Carbon reductions estimated using SimaPro.

Review of Emissions Reduction Opportunities – January 2019 Page 37
Ref Initiative Scope GHG emissions reduction
Unit Source
Road (100 years)
O1 Smart street lighting 2 74 tCO2-e / km
IPWEA (2017). Roadmap: Streetlighting and smart controls programme 2016/17.
ARUP (2017). Public Lighting Group. Smart Lighting Feasibility Study.
Lighting Council Australia (2016). Discussion Paper: Smart street lighting in Australia.
Echelon (2018). Outdoor Street Lighting: Making outdoor lighting more efficient, safe and affordable with open-standard control networking technology.
O2 Solar street lighting 2 492 tCO2-e / km Edge database of infrastructure projects
IPWEA (2017). Roadmap: Streetlighting and smart controls programme 2016/17
O3 Equipment electrification 2 591 tCO2-e / km / lane Edge database of infrastructure project.
O4 50% SCM (Indonesia) 3 423 tCO2-e / km / lane Edge database of infrastructure projects. Carbon reductions estimated using SimaPro
O5 50% SCM (Japan) 3 268 tCO2-e / km / lane Edge database of infrastructure projects. Carbon reductions estimated using SimaPro
O6 10% glass sand 3 5 tCO2-e / km / lane Edge database of infrastructure projects. Carbon reductions estimated using SimaPro
O7 EME2 asphalt 3 41 tCO2-e / km / lane ISCA database of infrastructure projects.
O8 Warm asphalt 3 100 tCO2-e / km / lane Austroads, 2010, Future Asset Management Issues No. 1: Impacts of Greenhouse Gas Emissions on Asset Management, https://www.onlinepublications.austroads.com.au/items/AP-R356-10
O9 In-situ cold RAP 3 384 tCO2-e / km / lane
Baillie, M & Bertaud, M 2008, ‘Cold recycling processes for bitumen emulsion: technical appraisal of in situ performance and advantages on environmental impacts,’ 4th Eurasphalt and Eurobitume Congress, Copenhagen, Denmark, Eurasphalt and Eurobitume Congress Secretariat, Brussels, Belgium, paper no. 403-021, 11 pp.
O10 EPS blend noise walls 3 299 tCO2-e / km / lane ModularWalls - https://modularwalls.com.au/blog/enduromax-noise-wall-technology/
O11 ITS - signs and on-ramps 3 1,123,948 tCO2-e in Adelaide Victorian Auditor General, 2014, Using ITC to Improve Traffic Management (https://www.parliament.vic.gov.au/file_uploads/20140611-ICT-Improve-Traffic_kGCHsMzk.pdf)
O12 ITS - congestion pricing 3 1,839,187 tCO2-e in Adelaide Litman, T 2006, London congestion pricing: implications for other cities, Victoria Transport Policy Institute, Victoria, BC, Canada.