capital structure: non-tax determinants of corporate leverage professor xxxxx course name / number
TRANSCRIPT

Capital Structure: Non-Tax Determinants Of Corporate
Leverage
Professor XXXXXCourse Name / Number

2
Total firm value
100% equity 100% debt
In perfect markets, capital structure is irrelevant.
If markets are perfect except for corporate taxes, then the optimal capital structure is
100% debt.
Most firms do not use anything close
to 100% debt. Why?
Optimal Capital Structure

3
Optimal Capital Structure
There are costs of debt that we’ve missed. At some point, those costs must outweigh debt’s tax
benefits:
– Personal taxes on debt, bankruptcy costs, agency costs, and asymmetric information
Total firm value
100% equity 100% debt
The optimal capital
structure, the one that
maximizes the value of the
firm, is in between the extremes.
Optimal capital structure

4
Bankruptcy Cost
It is not the event of going bankrupt that matters, it is the costs of going bankrupt that matter.
If ownership of the firm’s assets was transferred costlessly to its creditors in the event of bankruptcy,
The optimal capital structure would still be 100% debt.
When the firm incurs costs in bankruptcy that it would otherwise avoid, bankruptcy costs become a deterrent to
using leverage.
5
Example
Firm 1 Firm 2
Market value of assets $100,000,000 $100,000,000
Debt $0 $50,000,000
Equity $100,000,000 $50,000,000
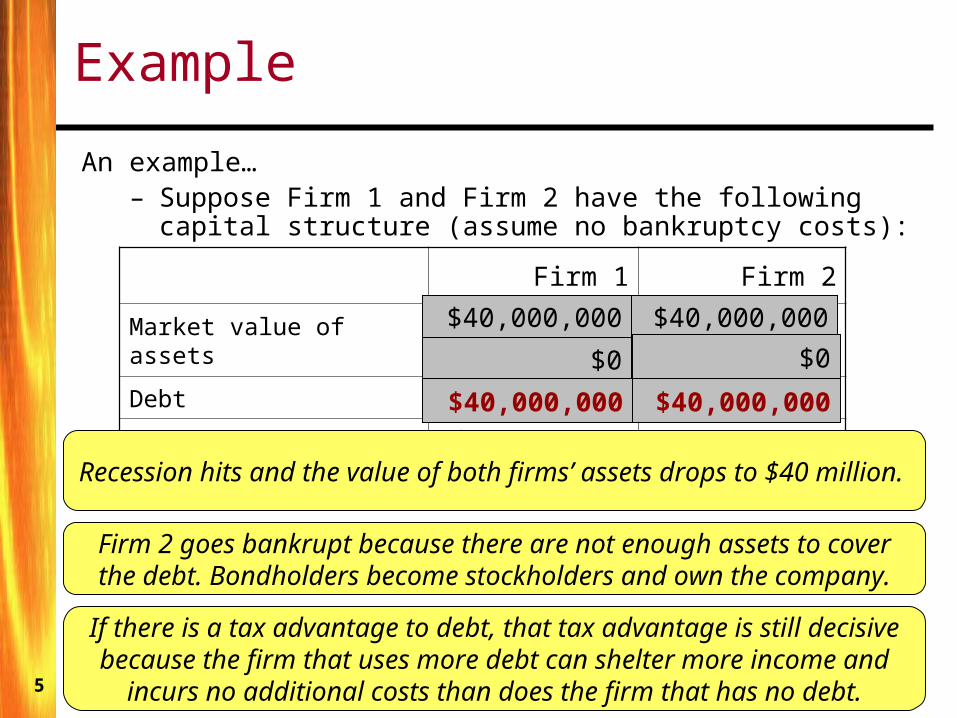
An example…– Suppose Firm 1 and Firm 2 have the following capital
structure (assume no bankruptcy costs):
$50,000,000$0
$40,000,000$40,000,000
If there is a tax advantage to debt, that tax advantage is still decisive because the firm that uses more debt can shelter more income and incurs no additional costs than does the
firm that has no debt.
Recession hits and the value of both firms’ assets drops to $40 million.
Firm 2 goes bankrupt because there are not enough assets to cover the debt. Bondholders become stockholders and own the company.
$40,000,000$40,000,000
$0

6
Example
Firm 1 Firm 2
Market value of assets $100,000,000 $100,000,000
Debt $0 $50,000,000
Equity $100,000,000 $50,000,000
– Assume if firm goes bankrupt, $10 million in assets are lost in the process of transferring ownership from stockholders to bondholders:
$30,000,000$40,000,000
$0$0
$30,000,000$40,000,000
Firm 2 will calculate the tax advantage of debt and weigh that against the cost of bankruptcy times the probability of
bankruptcy at each debt level.
When the recession hits, Firm 1 has $40 million in assets, but Firm 2 has $30 million in assets.
We are now looking not at bankruptcy costs per se, but at expected bankruptcy costs.
7
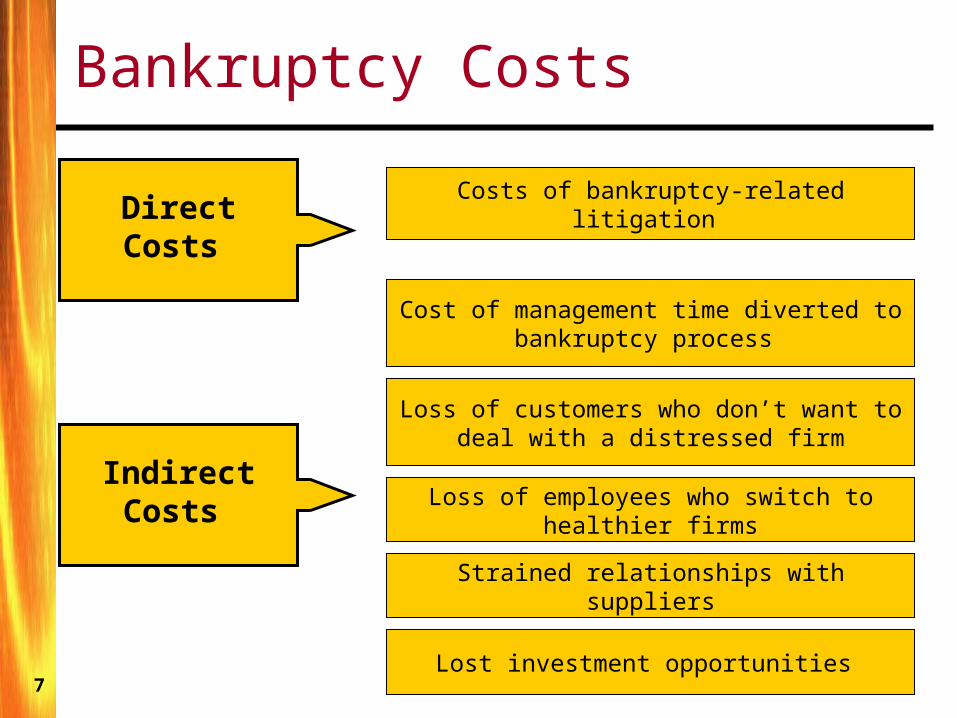
Bankruptcy Costs
Direct Costs
Costs of bankruptcy-related litigation
Indirect Costs
Cost of management time diverted to bankruptcy process
Loss of customers who don’t want to deal with a distressed firm
Loss of employees who switch to healthier firms
Strained relationships with suppliers
Lost investment opportunities

8
Indirect costs are likely to be much larger, and are likely to vary a great deal depending on the type of
firm in distress.
Indirect costs may be high:
When the firm’s product requires that the firm stay in business (e.g., when warranties or service are
important)
When the firm must make additional investments in product quality to maintain customers
For example, think of customers worrying that a bankrupt airline might try to save $ by cutting
spending on safety.
Bankruptcy Costs

9
Direct costs of
bankruptcy
Legal, auditing and administrative costs (include court costs)
Large in absolute amount, but only 1-2% of large firm value
Financial distress also gives managers adverse incentives.
– Asset substitution problem: Incentive to take large risks– Under-investment problem: shareholders refuse to contribute funds
Costs Bankruptcy PV - ShieldsTax PV + V = V UL
Trade-off model of corporate capital structure:
Bankruptcy Costs

10
U.S. Bankruptcy Practices And Costs
Bankruptcy governed by Federal law and filings are made in Federal bankruptcy courts
Chapter 7 (Liquidation)Chapter 11
(Reorganization)
Two types of bankruptcy filings in US for corporations:
In liquidation, a trustee is usually appointed to liquidate firm’s assets.
In reorganization, firm’s management continues to operate firm, can propose reorganization plan.
11
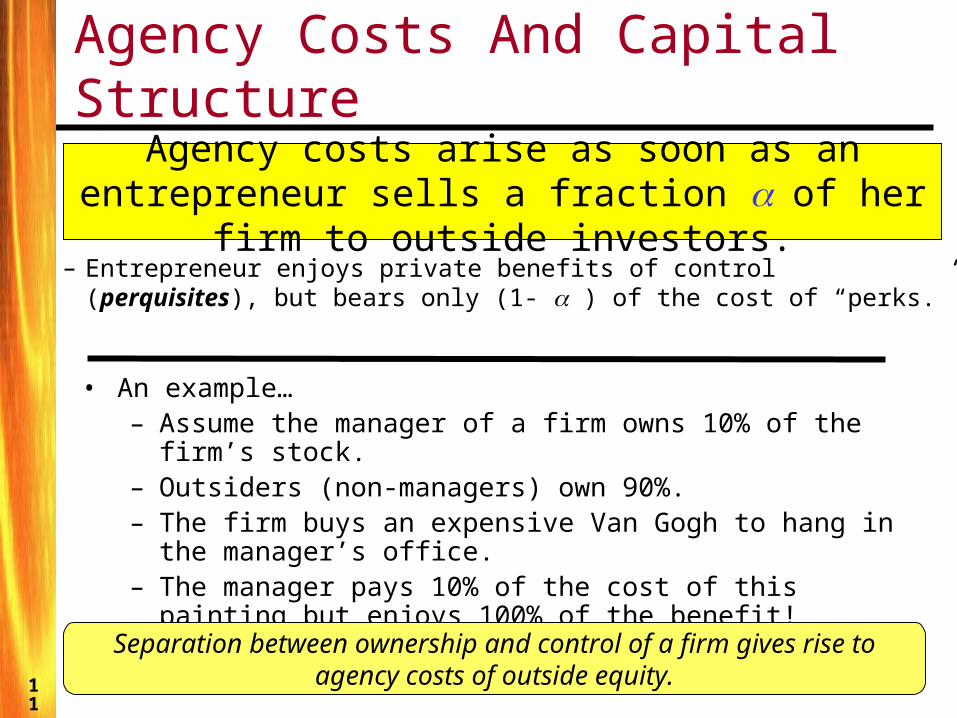
Agency Costs And Capital Structure
Agency costs arise as soon as an entrepreneur sells a fraction of her firm to
outside investors.– Entrepreneur enjoys private benefits of control
(perquisites), but bears only (1- ) of the cost of “perks.”
• An example…– Assume the manager of a firm owns 10% of the firm’s
stock.– Outsiders (non-managers) own 90%.– The firm buys an expensive Van Gogh to hang in the
manager’s office.– The manager pays 10% of the cost of this painting but
enjoys 100% of the benefit!Separation between ownership and control of a firm gives rise
to agency costs of outside equity.
12
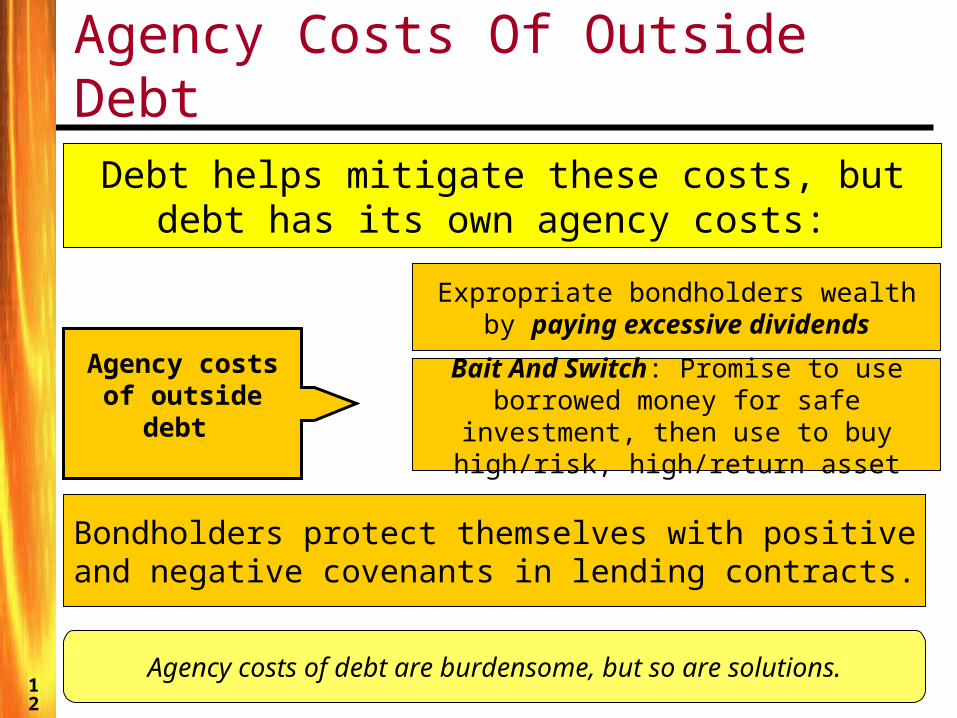
Agency Costs Of Outside DebtDebt helps mitigate these costs, but debt has
its own agency costs:
Agency costs of outside
debt
Expropriate bondholders wealth by paying excessive dividends
Bait And Switch: Promise to use borrowed money for safe investment, then use to buy high/risk, high/return
asset
Bondholders protect themselves with positive and negative covenants in lending contracts.
Agency costs of debt are burdensome, but so are solutions.

13
The Agency Cost / Tax Shield Trade-Off Model Of Corporate LeverageCompanies trade off tax and agency cost benefits of
debt against the costs of bankruptcy and agency costs of debt.
debt outside of costsagency equity outside of costsagency
costs bankruptcyshieldstax
PV - PV +
PV - PV + V = V UL
Firm V maximized at a unique optimal debt level:
Empirical research offers support for the model, but the model is far from perfect in its predictions.
Weaknesses lead to development of Pecking Order Theory.

14
The Pecking Order Theory Of Corporate Capital Structure
Trade-off theory cannot explain three empirical capital structure facts:
Most profitable firms in an industry use least debt.
Stock market responds to leverage-increasing events strongly positive; negative reaction to
leverage-decreasing events.
Firms issue debt frequently, but rarely issue equity.
Myers (1984), Myers & Majluf (1984) propose pecking order theory of corporate leverage.

15
The Pecking Order Theory Of Corporate Capital Structure
Assumptions
Manager acts in best interests of existing shareholders.
Information asymmetry between managers and investors.
Two key predictions about managerial behavior
Firms hold financial slack so they don’t have to issue securities.
Firms follow pecking order when issuing securities: sell low-risk debt first, equity only as last resort.

16
Signaling And Other Asymmetric Information Models• Third group of models, based on asymmetric information
between managers and investors, predict managers will use a costly signal:– A simple statement of high firm value not credible– Must take action that is too costly for weak firm to mimic– Crude signal: burn $100 bills; only wealthy can afford
• If signaling can differentiate between strong and weak firms based on signal, a signaling equilibrium results.– Investors identify stronger firms, assign higher market
value • If signaling cannot differentiate between strong and weak
firms, a pooling equilibrium results.– Investors assign low average value to all firms.
• Models predict high value firms use high leverage as signal.– Makes sense, but empirics show the opposite—most
profitable & highest market/book firms use least leverage.

17
A Checklist for Capital Structure Decision-Making
PositiveAsset tangibility
PositiveFirm size
PositiveRegulation (regulated industry?)
PositiveEffective (marginal) corp tax rate
NegativeNon-debt tax shields
NegativeEarnings volatility
NegativeMarket-to-book ratio
NegativeProfitability
Documented relationship between variable and leverageVariable

18
A Checklist for Capital Structure Decision-Making
PositiveState ownership
NegativePersonal tax rate, debt income
PositivePersonal tax rate, equity income
PositiveCorporate income tax rate
NegativeCreditor power in bankruptcy
NegativeManagerial entrenchment
AmbiguousInsider share ownership
AmbiguousGrowth rate of firm’s assets
Documented relationship between variable and leverageVariable
Personal taxes on debt, bankruptcy costs, agency costs, and asymmetric information influence level of debt the firm chooses to
have.
Agency costs arise between corporate managers and outside investors and
creditors.
Trade-off theory, pecking order theory, signaling theory try to explain corporate
leverage levels.
Non-Tax Determinants Of Corporate Leverage