the impact of capital structure determinants on smes leverage
TRANSCRIPT
1
The Impact of Capital Structure
Determinants on Small and Medium
size Enterprise Leverage
An Empirical Study of Iranian SMEs
Södertörn University | Institution for Social Science
Master Thesis 30 hp | Economics | Spring Semester 2013
By: Roshanak Hashemi
2
Abstract
Finding the suitable capital structure for small and medium size enterprises, SMEs, is vital. A
suitable capital structure helps SMEs to stay alive in the competitive market and has a positive
effect on the national economy. Wealth maximization is the first objective of the firms, and
capital structure proposition shows how a firm plans to finance its projects to meet its first
objective. The purpose of this thesis is to investigate the impact of the capital structure
determinants on the SMEs borrowing behavior. SMEs in this research are defined as the small
independent privately held firm with less than 250 employees.
In order to reach the purpose of this thesis, I have consulted the relevant theories of capital
structure. By the support of the earlier studies, as well as the related theories, I have
developed the testable hypotheses to examine the impact of capital structure determinants on
the decomposed leverage level. To conduct this thesis, I have used the deductive approach,
which is a similar approach suggested by the key reference of this study, Michaels et al
(1999). Size, age, profitability, growth, operating risk, and asset structure are selected as the
determinant of capital structure. With the unique set of data gathered from 201 SMEs in Iran
over the period of 2006 to 2010, the statistic panel data regression is used to analyze the
empirical data. To investigate the borrowing behavior of the SMEs comprehensively, the
observed SMEs were picked up from different manufacturing industries in Iran.
The result of this research reveals that the impacts of capital structure determinants on SMEs
leverage levels are different in terms of both magnitude and direction. The result indicates that
profitability has a strong impact on SMEs borrowing decisions. Besides profitability, size and
asset structure appear to have an impact on leverage level in compare with other determinants.
This thesis finding shed lights on the necessity of using the maturity structure of debt (short-
term debt and long-term debt) as dependent variables. Firms are more willing to finance their
projects with short term debt, rather than long term debt. Long term debt is costly, and the
probability of bankruptcy is higher with long term debt. Although long term debt is riskier for
SMEs, but it shows the management confident in the firm’s future since it obliges the firm’s
management to make legally binding future payments of interest. However, the empirical
result of this study shows that all the determinants have an effect on the level of leverage in
SMEs.
Key words: Capital structure, Small and medium size enterprises, internal and external
financing.

3
Acknowledgements
I would like to express my gratitude to all those who gave me the possibility to complete this
thesis. I would like to thank the Department of economics in Södertörn Högskolan for giving
me the opportunity of studying and researching in my favorite scientific fields. I’m greatly
thankful to all those, individuals and friends, who have made it possible for me to complete
this thesis; with their support, skillful guidance and patients.
4
Contents Abstract ........................................................................................................................................................2
Acknowledgements ...................................................................................................................................3
Chapter1. Introduction .............................................................................................................................7
1.1 SMEs Definition .........................................................................................................................8
1.2 Importance of SMEs to Iran’s Economy .....................................................................................9
1.3 Problem Discussion ...................................................................................................................9
1.4 Problem Formulation and Purpose .......................................................................................... 10
1.5 Thesis Outline ......................................................................................................................... 11
Chapter2. Theory of Capital Structure .............................................................................................. 13
2.1 Modigliani and Miller (MM) ..................................................................................................... 14
2.2 Static Trade-off Theory ............................................................................................................ 15
2.3 Pecking Order Theory .............................................................................................................. 18
2.4 Agency Cost ............................................................................................................................ 20
2.5 Asymmetric Information Cost .................................................................................................. 21
Chapter3. Determinants of Capital Structure and Hypothesis ................................................... 23
3.1 Firm Size and Short Term and Long Term Debt ........................................................................ 24
3.2 Firm Growth and Short Term and Long Term Debt .................................................................. 25
3.3 Firm Profitability and Short Term and Long Term Debt ............................................................ 26
3.4 Firm Age and Short Term and Long Term Debt ........................................................................ 27
3.5 Firm Risk and Short Term and Long Term Debt ........................................................................ 27
3.6 Firm Asset Structure and Short Term and Long Term Debt ...................................................... 28
Chapter4. Methodology ......................................................................................................................... 30
4.1 Methodology; Qualitative and Quantitative............................................................................. 30
4.2 Research Methodology in the Present Study ........................................................................... 31
4.3 Sampling and Data Collection .................................................................................................. 31
4.4 Selection of the Variables ........................................................................................................ 32
4.4.1 Independent Variables...................................................................................................... 33
4.4.2 Dependent Variables ........................................................................................................ 33
4.5 Panel Data Analysis ................................................................................................................. 34
4.6 Proposed Regression Model .................................................................................................... 35
Chapter5. Empirical Findings and Analysis ..................................................................................... 36
5.1 Descriptive Data ...................................................................................................................... 36
5.2 Regression Results Description for Short-term and Long-term Debt ........................................ 36

5
5.2 H1/H2 Size and Leverage ......................................................................................................... 38
5.2H3/H4 Growth and Leverage .................................................................................................... 39
5.3H5/H6 Profitability and Leverage .............................................................................................. 39
5.4H7/H8 Age and Leverage .......................................................................................................... 40
5.5H9/H10 Operational Risk and Leverage .................................................................................... 40
5.6 H11/H12 Asset Structure and Leverage ................................................................................... 41
Conclusion ................................................................................................................................................. 42
Limitations and Improvement ............................................................................................................ 43
References ................................................................................................................................................ 44
6
List of Figures Figure 1 Firms Categories (EU, 2011) ...................................................................................................8
Figure 2 Thesis Outline ...................................................................................................................... 12
Figure 3 Capital Structure.................................................................................................................. 13
Figure 4 value of the levered and unlevered firm under MM theorem .............................................. 15
Figure 5 value of the levered and unlevered firm under the trade off theory .................................... 16
Figure 6 An amplification of the firm value line (Hillier et al. 2010) .................................................... 17
Figure 7 A firm optimal capital structure ........................................................................................... 18
Figure 8 Source of Fund for U.S Corporation Under Pecking Order Theory ........................................ 20
Figure 9 Previous Empirical Works .................................................................................................... 23
Figure 10 Description of Tested Hypotheses...................................................................................... 29
Figure 11 Comparison between Quantitative and Qualitative Method ............................................. 31
Figur 12 Explanatory Variables Proxy ................................................................................................ 33
Figure 13 Descriptive Statistic for Variables ...................................................................................... 36
Figure 14 Short term Debt Financing Regression Result ..................................................................... 37
Figure 15 Long term Debt Financing Regression Results .................................................................... 38
7
Chapter1. Introduction
Small and medium size enterprises or SMEs are getting recognized due to their contribution
to the national economy. The significant role of SMEs has evolved over a time. A shift has
been occurred from the view point of SMEs as a contribution to society and political stability
to more on an economic ground. The development and success of the SMEs may help smooth
transition of the economy to market base one. However, SMEs have some characteristics,
which confine them to enjoy the same access to capital market as the large firms do.
There are large numbers of papers with the focus of SMEs and its role in innovation, poverty,
globalization and GDP growth. However, I found that there are a limited number of
researches with the focus on SME and its capital structure. In January 2002, Central Bank of
Iran assigned Tehran University Business School to carry out the Iran Survey of SME
Finances for the first time in Iran. The research was the first representative survey of SMEs in
Iran to provide analysis of the SMEs capital structure, and the ways of access to external
finance.
Capital structure and its compositions are one of the most prominent topics in the corporate
finance theories, which have reflected in Modigliani and Miller theorem (1958). The main
proposition of Modigliani and Miller theorem, under certain assumptions, is that the market
value of the firm is independent of its capital structure composition. Numerous financial
economist introduced leverage relevance theories to explain the different composit ion of debt
ratios across the firms, after Modigliani and Miller proposition in 1958. In some theories
introduced by DeAngelo and Masulis (1980), the existence of bankruptcy cost and taxes make
debt relevant. In other theories, debt is relevant due to the existence of information asymmetry
(Myers, 1984; Ross, 1977). A third debt relevant theory is called agency theory, which is
introduced by Jensen and Meckling (1976). Agency theory is about the conflict among
managers and outside shareholders and bondholders.
Various capital structure researches have come to the conclusion that the combination of
leverage related cost and tax advantage of the debt, results in an optimal capital structure. This
optimal capital structure is below 100% debt since the tax advantage is traded against the
probability of bankruptcy cost. However, the question arises here is if different gearing related
cost and advantage are economical serious enough to affect an optimal capital structure.
Various empirical studies have been conducted to answer this question. The empirical result
indicates that the capital structure is related to the firm’s characteristics. Such characteristics
as firm size, profitability, growth rate, firm risk, and industry characteristics are recognized by
many authors (e.g. Marsh, 1982; Bradley et al., 1984; Kester, 1986; Titman and Wessels,
1988). It is believed that each of the above characteristics play a different role in large firms
and SMEs capital structure.
The key reference of this thesis is a research paper done by Michaels et al (1999). They
research is focused on the SMEs characteristics, which influence the capital structure.
Michaels et al (1999) pointed out, “...that the capital structure of the firm is related to the
8
monetary behaviour of the firm such as firm size, age, and profitability, and growth rate,
industry feature level of risk, asset structure...”
This thesis uses two theoretical models in order to be able to explain how the SMEs capital
structure determinants influence their borrowing behavior. The two theoretical models are the
static trade-off theory and the pecking order theory, introduced by Myers (1984) and Myers
and Majluf (1984) accordingly. This paper also uses a decomposed leverage level by dividing
the total debt to the short-term and long-term debt. For this purpose, I use the Iranian
nationwide panel data covering a period 2006-2010.
1.1 SMEs Definition
One definition of a small and medium-size enterprise (SMEs) is a business with less than 250
employees. In the UK, SME accounts for fifty eight percent of the private sector jobs and fifty
two percent of the private sector revenue (Source: SME Statistics for the UK). Between years
1999 and 2003, employment in the private sector SMEs increased by 4.7 percent while large
firms in the private sector experience a four percent decreased in employment. Numerous
studies have indicated enterprise as an element to a higher rate of growth, productivity and
innovation (Geroski and Pomeroy, 1990; Cosh, Hughes and Wood, 1999).
An extremely essential element for start-ups and growing businesses to achieve is the
availability of capital (HMT/SBS, 2002). Capital market is imperfection like any other
markets. There are always obstacles for smaller businesses to raise sufficient external finance
to meet their needs (Bolton, 1971; Wilson, 1979; Graham, 2004). In the Iran, these obstacles
have caused to substantial government interventions in both equity and debt markets.
Government introduced two schemes; one is Small Firms Loan Guarantee and, the other is
Regional Venture Capital Funds.
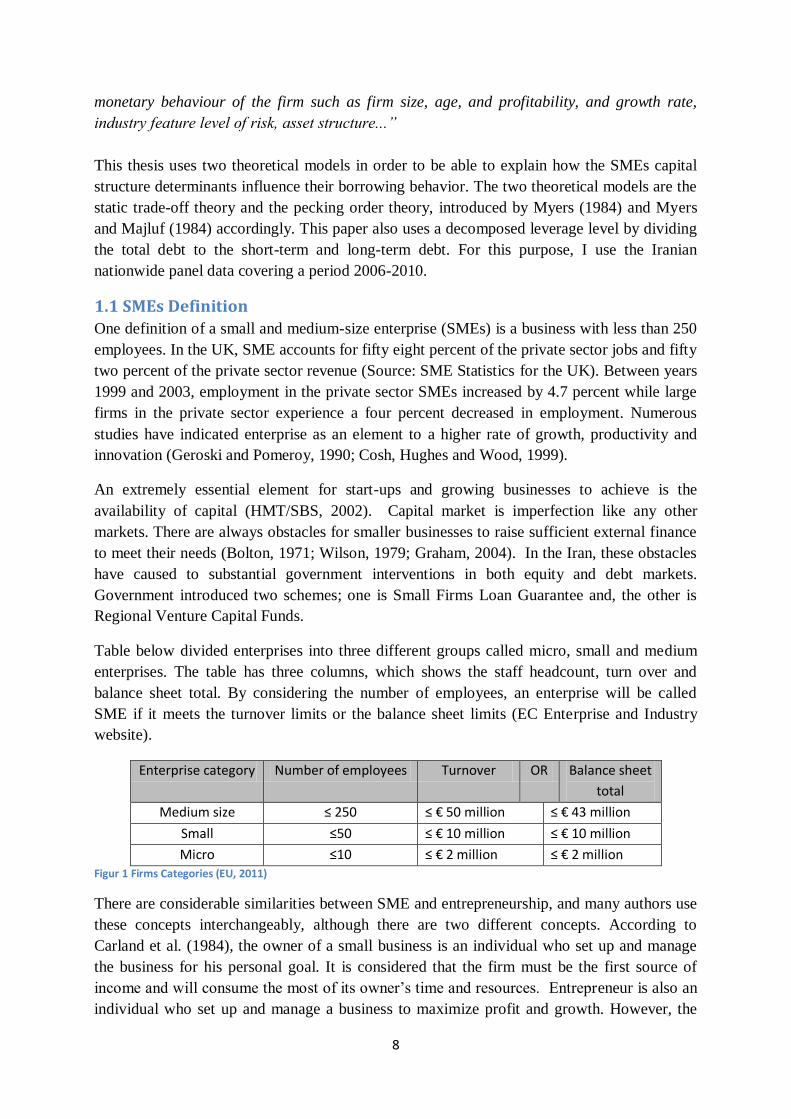
Table below divided enterprises into three different groups called micro, small and medium
enterprises. The table has three columns, which shows the staff headcount, turn over and
balance sheet total. By considering the number of employees, an enterprise will be called
SME if it meets the turnover limits or the balance sheet limits (EC Enterprise and Industry
website).
Enterprise category Number of employees Turnover OR Balance sheet
total
Medium size ≤ 250 ≤ € 50 million ≤ € 43 million
Small ≤50 ≤ € 10 million ≤ € 10 million
Micro ≤10 ≤ € 2 million ≤ € 2 million Figur 1 Firms Categories (EU, 2011)
There are considerable similarities between SME and entrepreneurship, and many authors use
these concepts interchangeably, although there are two different concepts. According to
Carland et al. (1984), the owner of a small business is an individual who set up and manage
the business for his personal goal. It is considered that the firm must be the first source of
income and will consume the most of its owner’s time and resources. Entrepreneur is also an
individual who set up and manage a business to maximize profit and growth. However, the
9
entrepreneur is characterized by innovative behavior, and in many cases they will employ
strategic management in the business.
1.2 Importance of SMEs to Iran’s Economy
According to A. Romano et al (2000) SMEs in each country has the utmost influence on
economy development, through invention of employment, productivity and innovation. Porter
(2006) stressed out that, in the recent two decades, the impotence of SMEs has increased
enormously because governments have accepted the role of the SMEs role in the economy.
SMEs are a significant part of the Iran economy, and its contribution is vital to the future
economic growth. SMEs activities help to reduce unemployment and create jobs. A dynamic
and growing SME sector play a crucial role is raising productivity growth in the Iran economy
by stimulating innovation, competition and encouraging the process called as “productive
churn”. According to the ministry of labor and social affairs in Iran, in early 2010, there were
nearly one million SMEs operating in Iran. SMEs accounts for more than half of the private
sector employment and approximately half of all private sector revenue (Fraser, 2004)
Having access to external finance is one of the important issues for SMEs. SMEs need finance
to fund their business investment, reach their growth potential and for facilitating new start-
ups businesses. Hussain et al. (2006) believed, once the SMEs internal source of finance
found to be insufficient to meet the business’s objective, these companies were looking to an
external source of finance. Lack of ability to raise finance can limit the cash flow and block
the business survival. In Iran, government has started a plan from 2006 with the aim to ease
up the process of raising external fund for SMEs. Donckels (2000) explains how essential it
is for SMEs to use external finance in their capital structure. Donckels found in his researches
that most of the SMEs fund their company by long term fund offered by banks and financial
institutions.
External finance facilitates the economic churn. The important part of market mechanism
within the economy for resource allocation is external finance. External finance resources
enable new businesses to come up with innovative products or efficient production process.
All these positive changes in the business will contribute in productivity improvement, and it
helps enterprises to start using the underutilized resources within the economy.
1.3 Problem Discussion
Review on the relevant literatures regarding the capital structure issues, shows that the focus
of the most capital structure studies is on the listed firms, and the small business’s capital
structure is highly overlooked. Various empirical researches on capital structure gathered data
from the firms, which are classified as large businesses (Van der Wijst and Thurik, 1991;
Chittenden et al., 1996a; Jordan et al., 1988). Researches on the SMEs capital structure clearly
show that there is a massive difference between SMEs financing behavior and their large
counterparts.
10
According to Agn (1992), small businesses are not engaged in the problems, as well as
opportunities, of large firms. However, small firms face different complexities, such as the
presence of estate tax, shorter expected life than large firms, intergenerational transfer
problems, and prevalence of implicit contracts. Moreover, Pettit and Singer (1985) argued that
standard problems like asymmetric information and agency cost is more severe in small firms
than large firms. According to Cassar and Holmes (2003), lack of management skills, and the
limited separation of business decisions from personal purpose is another problem in SMEs.
Only limited amount or researches have focused on SMEs and the factors that have an impact
on the borrowing decisions of them. SMEs are notable because the financial policy and capital
structure of these firms play a key role in a country economical and political condition.
Studies on the failure of the SMEs reveal that financial leverage is a main cause of decline
(Keasey and Watson, 1987; Storey et al., 1988; Lowe et al., 1991). SMEs borrowing decisions
are different form large companies, due to the borrowing constraints they face. Therefore, the
problem is to find out how capital structure determinants affect the borrowing behavior of the
SMEs. It is useful to know whether all the determinants have a same level of significant on
the firm’s leverage or not.
1.4 Problem Formulation and Purpose
The above discussion leads to the following research question:
Research Question: What are the impacts of capital structure determinants on the borrowing
behavior of the Iranian SMEs?
Numerous literatures have investigated about the determinants of capital structure, and their
impact on the listed companies. Nevertheless, number of research with the focus on the SMEs
capital structure and SMEs borrowing behavior are limited in general. In the case of Iran
specifically, I believe that there is a gap in the literature regarding the influence of capital
structure determinants on Iranian SMEs borrowing behavior. The purpose of this thesis is to
test empirically the impact of capital structure determinants on the Iranian SMEs borrowing
behavior. In fact, this thesis aims to test the static trade off theory and the pecking order
theory on Iranian SMEs, and examine if the selected factors have an impact on the firm’s
capital structure.
This thesis adapted a theoretical model from a work of Michaelas et al. (1999), and tested the
hypothesis in the context of 201 SMEs in Iran, over the period of 2006 to 2010. The
framework of this study comprised of eight variables, two dependent variables and six
independent variables. Six independent variables are size, age, growth, risk, asset structure,
and profitability. The two dependent variables are short term debt and long term debt. Each
factor has been selected in accordance with (Michaelas et al., 1999) theoretical model.
11
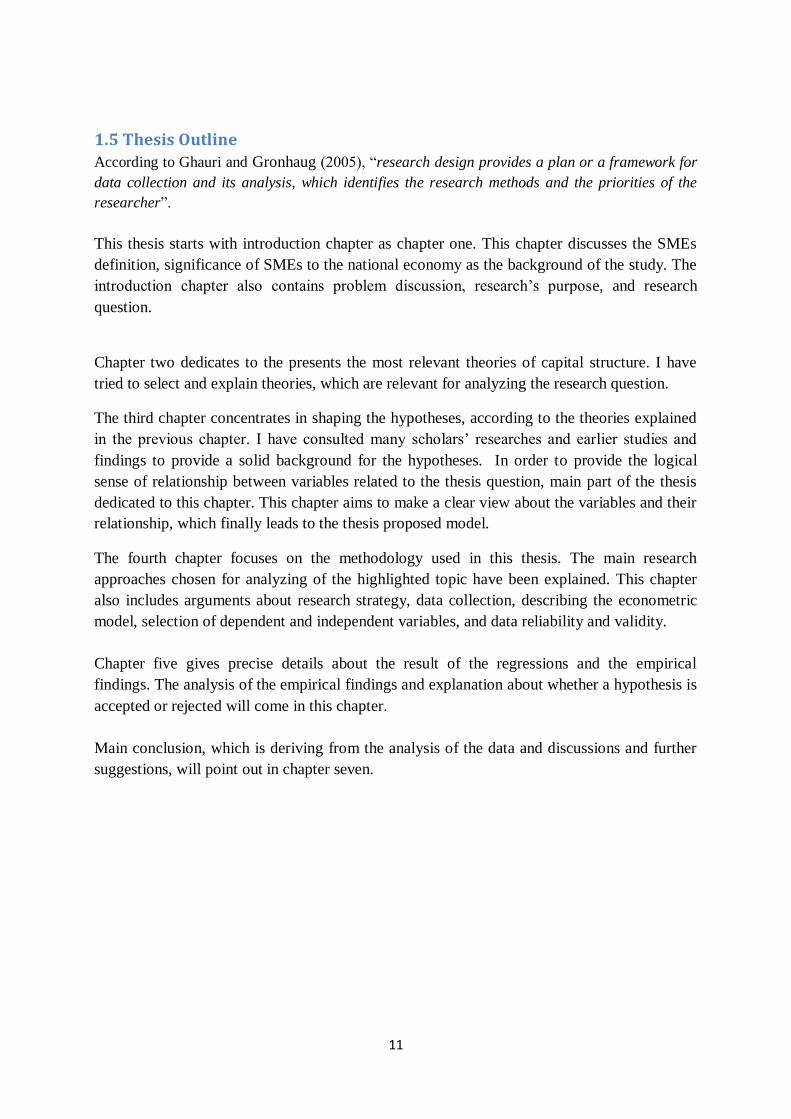
1.5 Thesis Outline
According to Ghauri and Gronhaug (2005), “research design provides a plan or a framework for
data collection and its analysis, which identifies the research methods and the priorities of the
researcher”.
This thesis starts with introduction chapter as chapter one. This chapter discusses the SMEs
definition, significance of SMEs to the national economy as the background of the study. The
introduction chapter also contains problem discussion, research’s purpose, and research
question.
Chapter two dedicates to the presents the most relevant theories of capital structure. I have
tried to select and explain theories, which are relevant for analyzing the research question.
The third chapter concentrates in shaping the hypotheses, according to the theories explained
in the previous chapter. I have consulted many scholars’ researches and earlier studies and
findings to provide a solid background for the hypotheses. In order to provide the logical
sense of relationship between variables related to the thesis question, main part of the thesis
dedicated to this chapter. This chapter aims to make a clear view about the variables and their
relationship, which finally leads to the thesis proposed model.
The fourth chapter focuses on the methodology used in this thesis. The main research
approaches chosen for analyzing of the highlighted topic have been explained. This chapter
also includes arguments about research strategy, data collection, describing the econometric
model, selection of dependent and independent variables, and data reliability and validity.
Chapter five gives precise details about the result of the regressions and the empirical
findings. The analysis of the empirical findings and explanation about whether a hypothesis is
accepted or rejected will come in this chapter.
Main conclusion, which is deriving from the analysis of the data and discussions and further
suggestions, will point out in chapter seven.
12
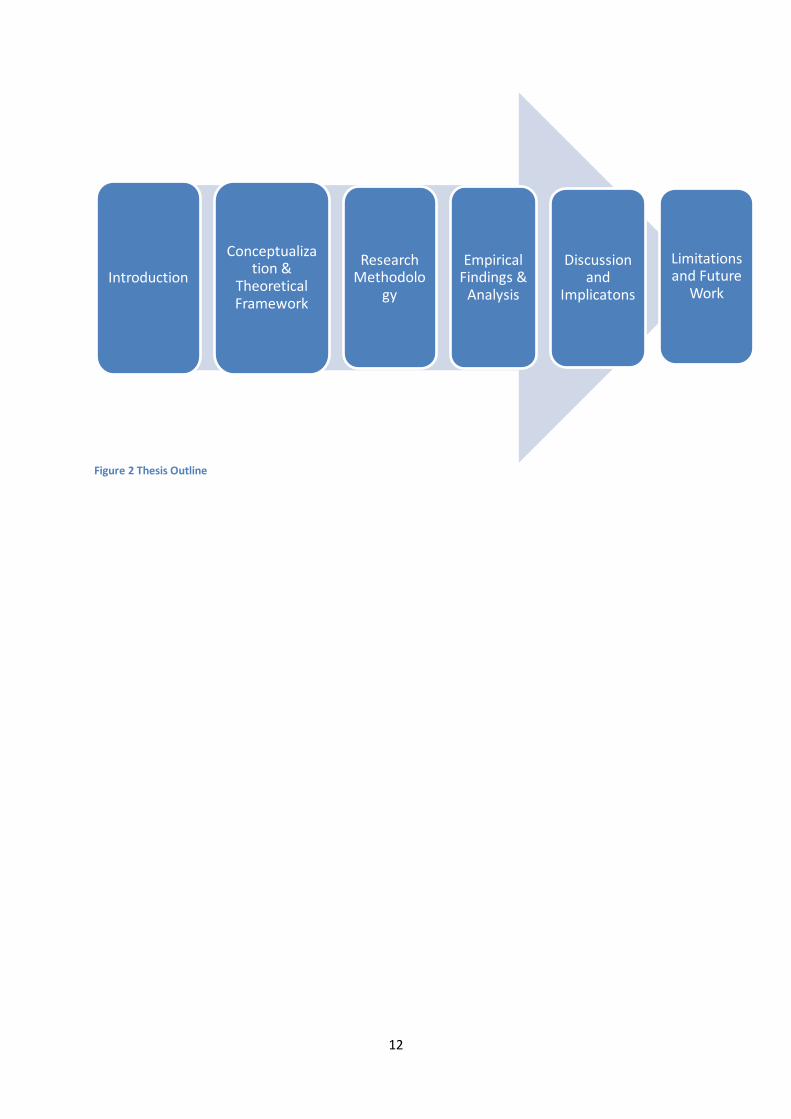
Figure 2 Thesis Outline
Introduction
Conceptualization &
Theoretical Framework
Research Methodolo
gy
Empirical Findings &
Analysis
Discussion and
Implicatons
Limitations and Future
Work
13
Chapter2. Theory of Capital Structure
Since Modigliani and Miller theorem forty years ago, number of leverage relevance theories
has been advanced by amendment of the perfect capital market assumptions of the original
MM theorem. The theory of capital structure can be classified into three groups: tax based
theories; agency cost theories; asymmetric information and signaling theories (Michaelas et
al., 1999). This part aims to give a brief explanation about the capital structure, and then
present the capital structure theories, which is related to this field of research.
The firm value can be seen as the discounted stream of expected cash flows generated by its
assets. Investors finance the firm’s assets, and they hold various sorts of claims on the firm's
cash flows. Debt holders’ claim on the firm’s stream of cash flows is safe due to the
contractual guarantees of a fixed schedule of payments. The claim of equity holders on the
residual stream of cash flows is more risky, since there is no payment guarantee on equity.
The combination of debt funds and equity funds (leverage) raise by the firm defines its capital
structure. By considering various constraints within the firm, each firm tries to issue the
particular combination of debt and equity to maximize its overall market value.
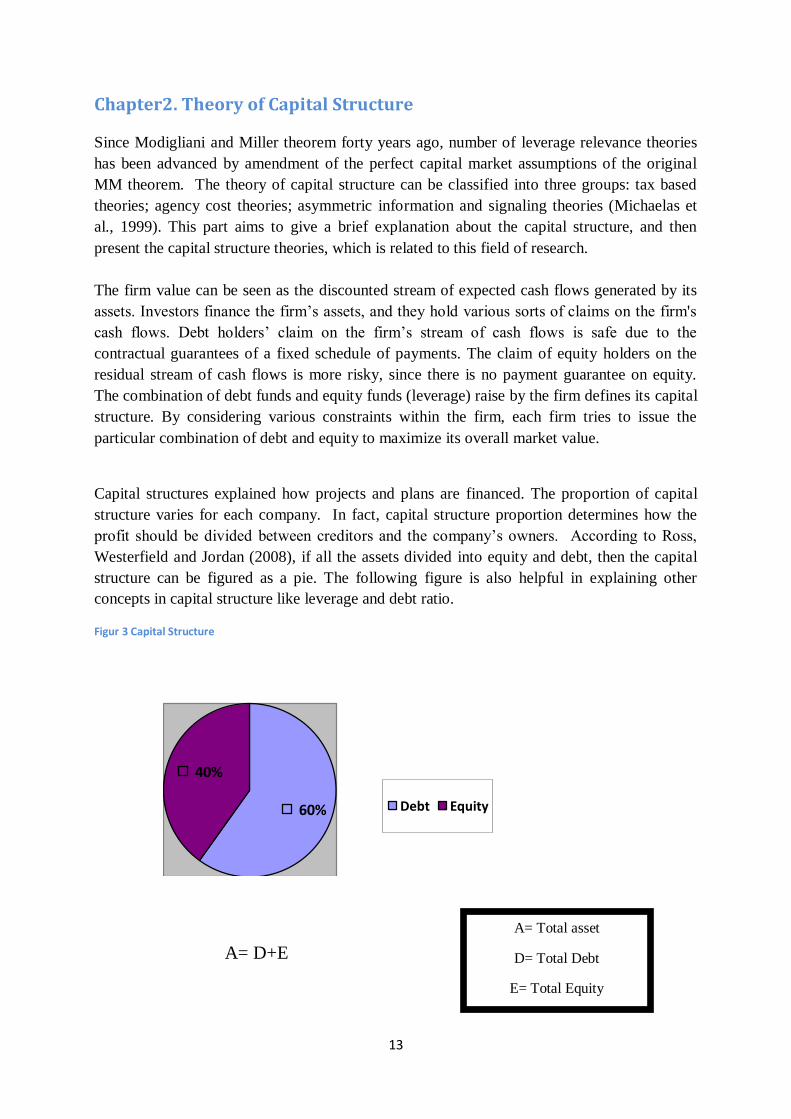
Capital structures explained how projects and plans are financed. The proportion of capital
structure varies for each company. In fact, capital structure proportion determines how the
profit should be divided between creditors and the company’s owners. According to Ross,
Westerfield and Jordan (2008), if all the assets divided into equity and debt, then the capital
structure can be figured as a pie. The following figure is also helpful in explaining other
concepts in capital structure like leverage and debt ratio.
Figur 3 Capital Structure
A= D+E
60%
40%
Debt Equity
A= Total asset
D= Total Debt
E= Total Equity
14
The ratio below shows the proportion of a firm’s assets which are financed through debt. The
ratio is called debt ratio, and if it becomes less than one then most of the firm’s assets are
financed by equity. If the debt ratio becomes greater than one, then most of the firm's assets
are financed by debt. “Highly leveraged” term is given to the firms with the high debt/asset
ratio.
Debt Ratio=
A firm’s financial leverage is calculated by dividing total debt by total equity. A high
debt/equity ratio means that a firm is aggressive in financing its growth with debt. Highly
levered firms are more vulnerable to downturns in their business cycles, due to their legally
binding payments.
Leverage =
Deciding about the proportion of capital structure is one of the major concerns for company’s
director, since it is a tradeoff between risks and costs (Ross et al. 2008). Issuing equity is
expensive in compare to debt which is less expensive; however, debt generates higher risk
than equity. Therefore, the principal issue in capital structure composition is to find the best
proportion between debt and equity (Modigliani & Miller, 1958).
The best combination of equity and debt is the one that minimize the cost of capital, and in
return maximize the value of the firms. This combination of debt and equity is called optimal
capital structure. According to Modigliani and Miller (1963), enhancement in leverage would
generate the interest tax shield, which increases the value for the company. However, an
increase in debt level will increase the financial distress cost, and the result is a decrease in
the value of the company. According to Bradley, Jarrell and Kim (1984), the optimal capital
structure is the level of leverage, which gives the best balance between the tax benefit and
distress cost.
2.1 Modigliani and Miller (MM)
The modern theory of capital structure primarily was developed by Modigliani and Miller
(1958), with an article in The American Economic Review. According to Hillier et al. (2010),
Modigliani and Miller theorem is: “…generally considered the beginning point of modern
corporate finance...” Their irrelevance theorem argued that the firm’s capital structure does
not have any impact on its value. They believed that the firm value is determined based on the
active side of the balance sheet. Value is generated by the earning power and risk of the
underlying asset. In other words, obtaining capital from restrictive payout ratio, issuance of
new equity or borrowing has the same impact on the firm’s value.
The MM theorem introduced two propositions under five assumptions as following:
1. No taxes, no transaction costs, no costs of bankruptcy, no asymmetric information.
2. Homogeneous expectations.
15
3. All investors are price-takers.
4. The firm’s investment program is fixed and known.
5. The firm’s financing is fixed.
The first proposition is about the capital structure, and the second one concerns the cost of
capital. The first proposition says that the value of levered firm is equal to the value of the un-
levered firm. The second proposition goes hand in hand with the first proposition. The second
proposition explains that the cost of equity is a linear function of the firm debt/equity ratio
(Modigliani and Miller, 1958).
Modigliani and Miller (1958) developed their theorem further because there is no such an
economy with the perfect capital market. In the economy with the transaction costs and taxes,
capital structure composition is a significant matter. In most of the countries, taxes are
deductible; hence the value of the levered firm exceeds the value of the un-levered firm. The
effect of leverage generates the tax shield with the same value of the deductible interest of the
debt. The conclusion is that if a firm wants to maximize its value then it should be financed by
debt only. Therefore, the propositions were extended to contain tax shield, which affect the
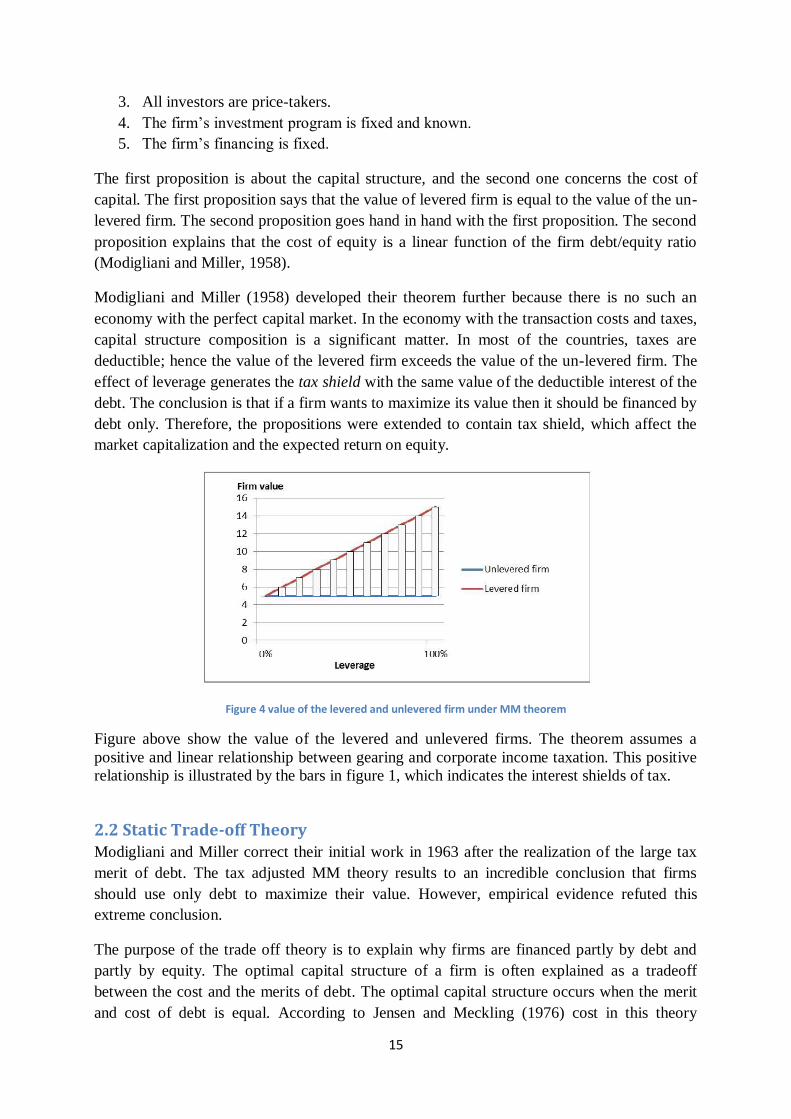
market capitalization and the expected return on equity.
Figure 4 value of the levered and unlevered firm under MM theorem
Figure above show the value of the levered and unlevered firms. The theorem assumes a
positive and linear relationship between gearing and corporate income taxation. This positive
relationship is illustrated by the bars in figure 1, which indicates the interest shields of tax.
2.2 Static Trade-off Theory Modigliani and Miller correct their initial work in 1963 after the realization of the large tax
merit of debt. The tax adjusted MM theory results to an incredible conclusion that firms
should use only debt to maximize their value. However, empirical evidence refuted this
extreme conclusion.
The purpose of the trade off theory is to explain why firms are financed partly by debt and
partly by equity. The optimal capital structure of a firm is often explained as a tradeoff
between the cost and the merits of debt. The optimal capital structure occurs when the merit
and cost of debt is equal. According to Jensen and Meckling (1976) cost in this theory
16
represented by the agency cost arising among creditors and owners and the cost of financial
distress. Merit is measurable by the tax shield of debt (Myers, 1984). However, the optimal
point differs from one firm to another due to the characteristics of each firm.
As mentioned above, the optimized capital structure exists when the marginal cost of debt is
equal to the marginal benefit of debt. If an unlevered firm starts to adjust its capital structure
to small level of leverage, this act will create a high benefit from interest tax shield without
any huge increase in the distress cost. If the company increases its leverage more, the benefit
would still be considerable but not as high as before. The cost of financial distress would also
be high. If the rise in leverage increases, the cost of financial distress would exceed the tax
shield benefit. As a result, the firm value line with regard to debt holds a hump shape curve
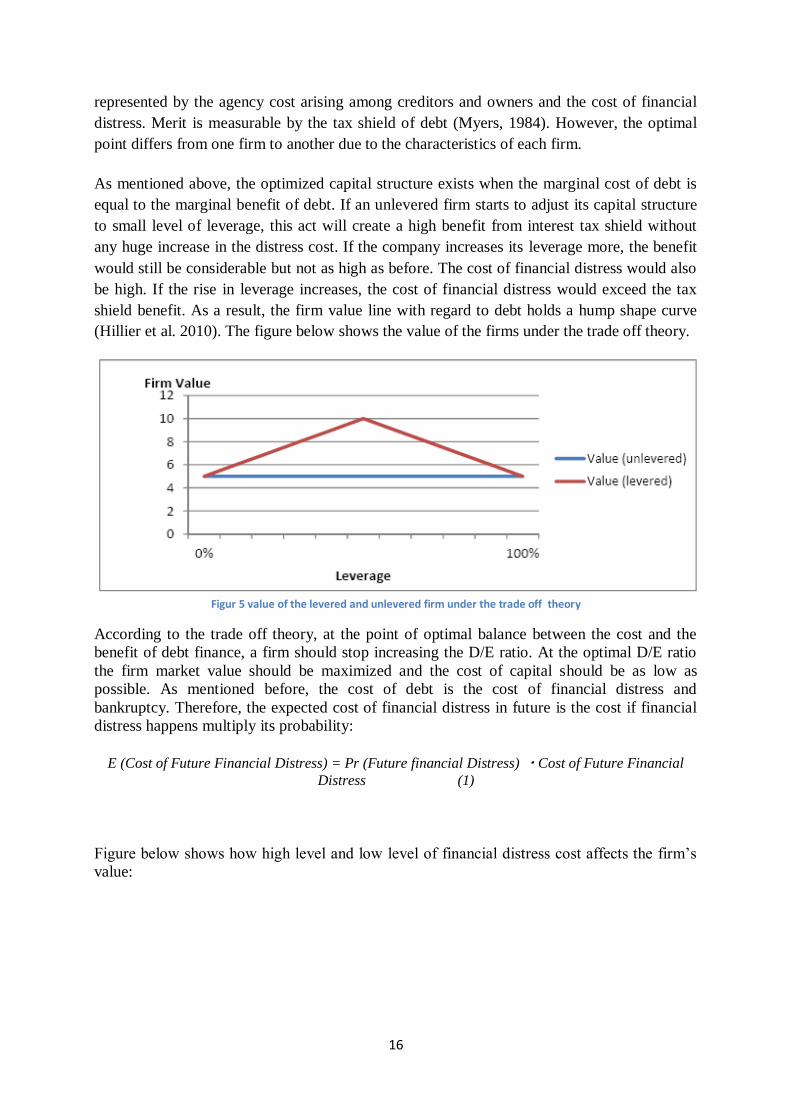
(Hillier et al. 2010). The figure below shows the value of the firms under the trade off theory.
Figur 5 value of the levered and unlevered firm under the trade off theory
According to the trade off theory, at the point of optimal balance between the cost and the
benefit of debt finance, a firm should stop increasing the D/E ratio. At the optimal D/E ratio
the firm market value should be maximized and the cost of capital should be as low as
possible. As mentioned before, the cost of debt is the cost of financial distress and
bankruptcy. Therefore, the expected cost of financial distress in future is the cost if financial
distress happens multiply its probability:
E (Cost of Future Financial Distress) = Pr (Future financial Distress) ・Cost of Future Financial
Distress (1)
Figure below shows how high level and low level of financial distress cost affects the firm’s
value:

17
Figure 6 An amplification of the firm value line (Hillier et al. 2010)
The optimized capital structure point for each firm is related to the level of financial distress
cost. The following figure shows two curves that represent the optimal capital structure. One
curve is for the firm with the higher financial distress cost, and the other curve is for the firm
with the lower distress cost. The financial distress cost increase when the risk of default
increases and a firm would borrow less when it is in a risky condition (Myers, 1984).
Financial distress can happen at any time in future, but for simplicity it is assumed that if it
happens it will be in year T. The present value of the financial distress cost is then:
PV (E (CFFD)) =E (CFFD)/ (1 + rcfd) T PV (Financial Distress Cost) (2)
The likelihood of financial distress cannot be zero, even for the unlevered firm. Both types of
firms can run out of cash under any circumstances. However, financial distress probability
will increase with the level of debt, since debt payments are periodic fixed payment. A firm
has to pay fix interest payments if the level of debt is constant, which will shorten the period
until time T. therefore, the present value of the expected cost of financial distress will increase
with the firm’s debt burden.
The present value of the tax shield of debt can be written as:
τ. KD .D/KD= τ.D PV (Tax shield of debt) (3)
Where τ is corporate tax rate and KD is required rate of return on debt.
The value of a levered firm can now be calculated as:
VL = V
U + PV (tax shield of debt) − PV (cost of financial distress) (4)
The value of unlevered firm is:
VU=
Firm Total Value- Value of Equity Financing (5)
18
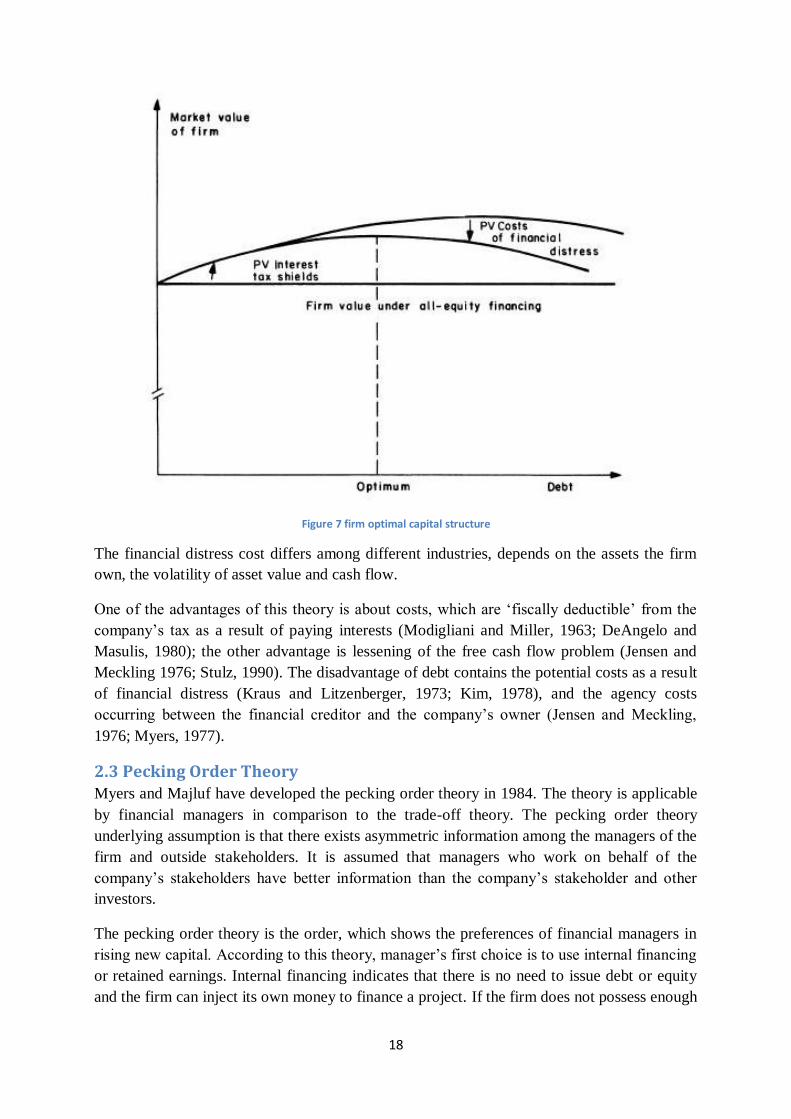
Figure 7 firm optimal capital structure
The financial distress cost differs among different industries, depends on the assets the firm
own, the volatility of asset value and cash flow.
One of the advantages of this theory is about costs, which are ‘fiscally deductible’ from the
company’s tax as a result of paying interests (Modigliani and Miller, 1963; DeAngelo and
Masulis, 1980); the other advantage is lessening of the free cash flow problem (Jensen and
Meckling 1976; Stulz, 1990). The disadvantage of debt contains the potential costs as a result
of financial distress (Kraus and Litzenberger, 1973; Kim, 1978), and the agency costs
occurring between the financial creditor and the company’s owner (Jensen and Meckling,
1976; Myers, 1977).
2.3 Pecking Order Theory Myers and Majluf have developed the pecking order theory in 1984. The theory is applicable
by financial managers in comparison to the trade-off theory. The pecking order theory
underlying assumption is that there exists asymmetric information among the managers of the
firm and outside stakeholders. It is assumed that managers who work on behalf of the
company’s stakeholders have better information than the company’s stakeholder and other
investors.
The pecking order theory is the order, which shows the preferences of financial managers in
rising new capital. According to this theory, manager’s first choice is to use internal financing
or retained earnings. Internal financing indicates that there is no need to issue debt or equity
and the firm can inject its own money to finance a project. If the firm does not possess enough
19
internal resources, the second option will be external financing. The external financing is
divided into issuing debt and equity, and there is a preference with the issuance of debt and
equity. The first choice in external finance is issuing debt. Debt is a safer security and less
risky than equity. The pecking order allows issuing equity when the capacity of debt is fully
used (Myers and Majluf, 1984).
The consequence of issuing risky new securities as a source of external finance is under
priced problem. This means that the new security might be priced under its real value. If there
is too severe under pricing, the new investor will get more than the net present value (NPV) of
the project, and the project will be rejected even with the positive NPV. Therefore, managers
prefer to raise less risky sources of capital; for example use retained earnings before debt and
debt before equity (Myers and Majluf, 1984)
According to Sunder and Myers (1994), One of the simplest forms of pecking order theory, by
considering the below definitions is as following:
Ct= operating cash flows after interest and taxes
DIVt= dividend payments
Xt= capital expenditures
∆Wt= net increase in working capital
Rt= current portion of the long term debt at the start of the period
Dt= long term debt out standing
At= net book assets
Dt= Dt/At the book debt ratio
The funds flow deficit is:
DEFt= DIVt+ Xt+∆Wt+ Rt - Ct (1)
All the components of the deficit are exogenous in the strict pecking order model, as long as
safe debt can be issued. Therefore, there is no motivation to move down the pecking order
model and issue equity.
The testable pecking order hypothesis is:
∆Dit= a+ bPODEFit+ eit (2)
In the above equation, ∆Dit is the amount of issued debt or retired. In this theory a=0 and
bPO=1, and the pecking order coefficient is bPO.
The second equation is not an accounting identity, since DEFt does not contain equity issues.
The simple pecking order argues that issuing or retiring equity is the last resort of finance.
The figure below shows how pecking order theory has been followed by the U.S Corporation
among 1995 to 2008.
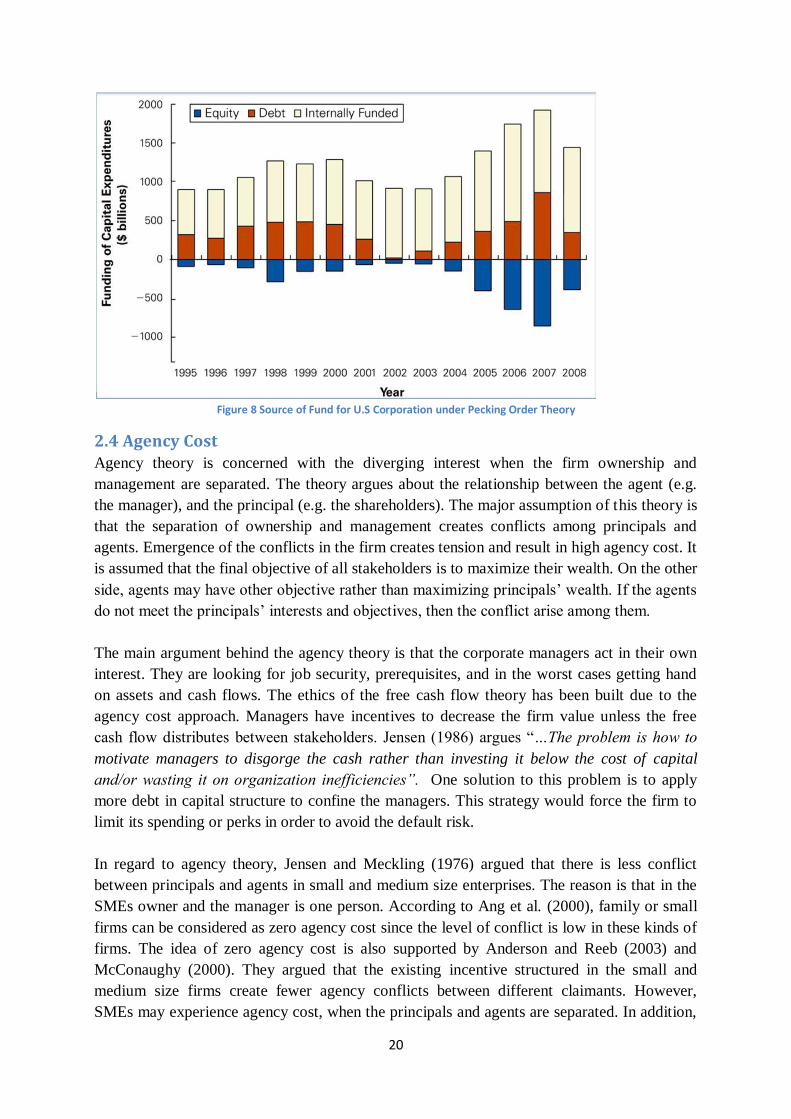
20
Figure 8 Source of Fund for U.S Corporation under Pecking Order Theory
2.4 Agency Cost Agency theory is concerned with the diverging interest when the firm ownership and
management are separated. The theory argues about the relationship between the agent (e.g.
the manager), and the principal (e.g. the shareholders). The major assumption of this theory is
that the separation of ownership and management creates conflicts among principals and
agents. Emergence of the conflicts in the firm creates tension and result in high agency cost. It
is assumed that the final objective of all stakeholders is to maximize their wealth. On the other
side, agents may have other objective rather than maximizing principals’ wealth. If the agents
do not meet the principals’ interests and objectives, then the conflict arise among them.
The main argument behind the agency theory is that the corporate managers act in their own
interest. They are looking for job security, prerequisites, and in the worst cases getting hand
on assets and cash flows. The ethics of the free cash flow theory has been built due to the
agency cost approach. Managers have incentives to decrease the firm value unless the free
cash flow distributes between stakeholders. Jensen (1986) argues “…The problem is how to
motivate managers to disgorge the cash rather than investing it below the cost of capital
and/or wasting it on organization inefficiencies”. One solution to this problem is to apply
more debt in capital structure to confine the managers. This strategy would force the firm to
limit its spending or perks in order to avoid the default risk.
In regard to agency theory, Jensen and Meckling (1976) argued that there is less conflict
between principals and agents in small and medium size enterprises. The reason is that in the
SMEs owner and the manager is one person. According to Ang et al. (2000), family or small
firms can be considered as zero agency cost since the level of conflict is low in these kinds of
firms. The idea of zero agency cost is also supported by Anderson and Reeb (2003) and
McConaughy (2000). They argued that the existing incentive structured in the small and
medium size firms create fewer agency conflicts between different claimants. However,
SMEs may experience agency cost, when the principals and agents are separated. In addition,

21
problems like entrenched ownership and asymmetric altruism within the SMEs may create
difficulties (Gomez-Meija et al., 2001; Schulze et al., 2001). In fact, SMEs have agency cost
problem when they decide to separate mangers form stakeholders.
The agency cost problem is also tense in SMEs because they do not have to disclose their
financial information and financial statement. Daskalakis and psillaki (2008) argued that the
problem of agency cost will increase, when a firm has a high level of asymmetric
information. Therefore, it is expected that small businesses experience a greater agency cost
since the manager of the business gives the first priority to his own interest. On the other side,
solutions for agency cost problem in SMEs are more expensive than in large listed
companies. Monitoring process in SMEs is harder than listed firm. Moreover, rules and
regulations force large companies to be transparent about their financial activities while
SMEs are free from any financial disclosure.
It is tempting to conclude that SMEs have fewer conflicts; hence they are able to minimize the
agency costs. However, contrasting views have suggested that SMES are experiencing
conflicts which make them vulnerable. In fact, existence of conflicts may paralyze SMEs to
make a decision and threaten the firm survival (Schulze et al., 2003). SMEs may raise more
debt in order to control the self- interests of the agents, and to limit the negative consequences
of altruism within the firm. According to Schulze et al. (2003) altruism results in the problem
of free ride.
Schulze et al. (2003) argued that the phenomenon of altruism shows how the agency problem
becomes more apparent in SMEs if they do not allocate the resources properly. Therefore, the
level of the agency conflict becomes a decisive factor that affects the capital structure of the
SMEs. The idea of higher level of agency cost in SMEs is also supported by Gomez-Mejia,
Nunez-Nickel and Gutierrez (2001).
2.5 Asymmetric Information Cost Various approaches explain the capital structure combination due to the existence of private
information. In theories, it is assumed that the insider or the firm managers have information
about the firm’s return stream. One set of approaches explains that choice of the firm’s capital
structure is like a signal to outside stakeholders. This signal conveys information form
insiders to outside investors. This set of research started by the work of Ross (1977) and
Leland and Pyle (1977). The other set of approach is that capital structure is shaped to
decrease the inefficiencies in the firm’s investment decisions. Myers (1984) believed that
inefficiencies in investment decisions happen due to the information asymmetry among
insiders (managers) and outsiders (creditors and investors).
An asymmetric information phenomenon provides a highly destructive situation because the
well informed group has the power to take advantage of situation (Harris and Raviv 1991).
Problems associated with asymmetric information are as following:
1. Adverse selection, which is happened before transaction
22
2. Moral Hazard, which is happened after transaction
Barnea et al. (1980) argues that small companies are more likely to deal with asymmetric
information. SMEs face the information asymmetry cost more often than listed companies.
Having a higher level of asymmetric information cost in SMEs relates to the rules of
publishing financial statements. Outsider investors prefer to have an audited financial
statement. However, there is no obligation for having a published audited financial statement
for SMEs. Some SMEs may provide financial statement, but its quality could not be the same
as the large companies. Therefore, managers in SMEs have a right not to be transparent about
their companies’ financial facts, which increase the information asymmetry cost.
The significant conclusion from the asymmetric information theories is the pecking order
hypothesis (Michaelas et al. 1999)
23
Chapter3. Determinants of Capital Structure and Hypothesis
In the previous chapter, I discussed the theories which are related in shaping the hypothesis
between the firm’s characteristics and its capital stricter. The following chapter explains the
firm’s characteristics, which, according to literature, is believed to have an impact on the
firm’s capital structure decisions.
According to Michaelas et al (1999), the key reference of this thesis, the main determinants
that have the effect on both short term and long term debt in the SMEs are size, age,
profitability, growth and future growth opportunities, asset structure net debaters, stock
turnover and operating risk. Moreover, they suggested that the industry where the SMEs
operates in and time have an impact on maturity structure of debt in SMEs. Economic
condition has also impact on the level of debt. For instance, the average short term debt ratio
in small and medium size company happen to be increasing while the economy is in
recession, and it will decrease when economic condition improved.
To be able to analyze the impact of the determinants on capital structure, according to the
work of Michaelas et al. (1999), two independent variables were selected. The independent
variables are short-term debt to total assets and long-term debt to total assets. The main reason
for not choosing total debt to total asset ratio is the work of Van der Wijst and Thurik (1993)
and Chittenden et al. (1996). They have shown in their papers that the impact of the
explanatory variables on total debt is a net effect of the opposite effect on both long and short
term debt. Therefore, it would not possible to analyze the impact of a determinant (dependent
variables) on a decomposed leverage level. The determinants are presented in the following
order: size, growth, profitability, age, risk, and asset structure.
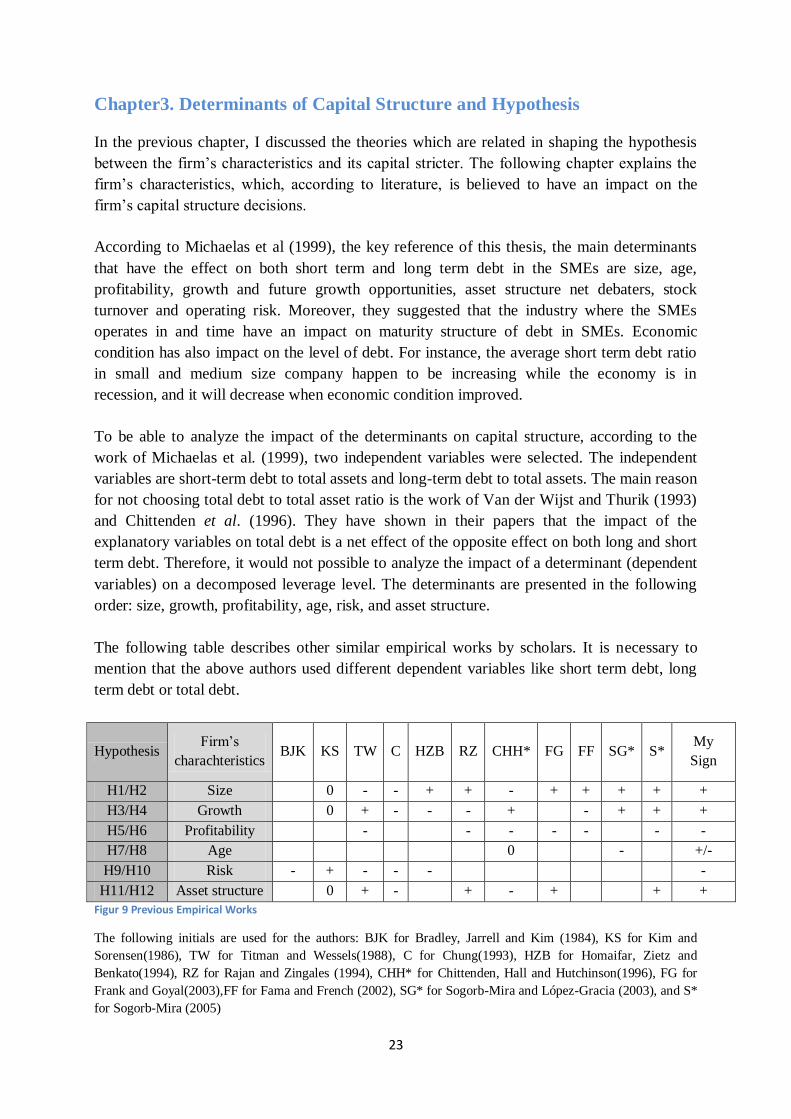
The following table describes other similar empirical works by scholars. It is necessary to
mention that the above authors used different dependent variables like short term debt, long
term debt or total debt.
Hypothesis Firm’s
charachteristics BJK KS TW C HZB RZ CHH* FG FF SG*
S*
My
Sign
H1/H2 Size 0 - - + + - + + + + +
H3/H4 Growth 0 + - - - + - + + +
H5/H6 Profitability - - - - - - -
H7/H8 Age 0 - +/-
H9/H10 Risk - + - - - -
H11/H12 Asset structure 0 + - + - + + +
Figur 9 Previous Empirical Works
The following initials are used for the authors: BJK for Bradley, Jarrell and Kim (1984), KS for Kim and
Sorensen(1986), TW for Titman and Wessels(1988), C for Chung(1993), HZB for Homaifar, Zietz and
Benkato(1994), RZ for Rajan and Zingales (1994), CHH* for Chittenden, Hall and Hutchinson(1996), FG for
Frank and Goyal(2003),FF for Fama and French (2002), SG* for Sogorb-Mira and López-Gracia (2003), and S*
for Sogorb-Mira (2005)
24
3.1 Firm Size and Short Term and Long Term Debt There exist different points of view about the relationship between the level of debt and the
firm size. Modigliani and Miller (1958) suggested that there is no relationship between size
and level of debt, keep in mind that this result is reliable with the market efficiency
hypothesis. However, numbers of authors arguing that the negative or positive relationship
among the two concepts is vast.
According to Heshmati (2001), listed companies have easier access to the equity market, in
compare with the smaller companies, because of low fixed costs. Therefore, there should be a
negative relationship between the firm size and the debt level. Fama and Jensen (1983)
argued that transaction cost and asymmetric information problem are lesser in large firms in
compare with small firms. Therefore, it is expected that large firms prefer to raise fund from
equity rather than debt. Small firms often find costly to disperse asymmetric information.
Financiers are not willing to offer small firms capital, or the price of the offered capital is too
high for small firms (Ferri and Jones, 1979). Another reason, which makes small firms
reluctant to use outside financing, is the market access limitations. In many cases, the
minimum volume of capital is required in order to raise external fund (Cassar and Holmes,
2003). This idea is supported by empirical evidence that concludes small firms often forced to
use internal source, and then short-term debt contracts due to the limited access to the long
term financing (Osteryoung et al., 1992; Chittenden et al., 1996; Michaelas et al., 1999).
Many authors have suggested a positive relationship between a firm leverage and its size
(Fama and French, 2002). Warner (1977) and Ang et al. (1982) stressed out, that when the
value of the firm increases; the ratio of direct bankruptcy costs to the firm value would
decrease. The effect of these expected bankruptcy costs might be little on large firms’
borrowing decisions, which empower them to take on more leverage (Rajan and Zingales,
1995). On the other side, smaller firms face a different reality in raising the long term debt.
Asymmetric information is not the main reason, but the reason is the significant negative
correlation between firm size and the probability of bankruptcy (Berryman, 1982; Hall et al.,
2004). One explanation could be that relatively large firms tend to be more diversified;
therefore, they are less prone to insolvency (Titman and Wessels, 1988). Chittenden et al.
(1996) believed in the large companies the cost of monitoring is much lower than small firms.
They argued that moral hazard and adverse selection problems are decreased reasonably in
large companies, subsequently using debt as an external funding is much better in listed
companies than SMEs. Hence there is a positive relationship between the level of debt and the
firm’s size.
Clara Cardone-Riportella et al (2001) stressed out that there is a positive relationship between
borrowing and size of the firm. Later on Daskalakis and Psollaki (2008) found three reasons
to confirm the positive relationship between level of debt and the firm size. Firstly, they found
that there is a strong relationship between the size of the firms and the risk of bankruptcy.
This means a large company has a lower risk of default than small firms. Secondly, listed
companies might be able to incur lower transaction costs associated with debt. Thirdly, they
found out that due to transparency and accuracy in a large company the cost of information
25
asymmetry is lower than in SMEs.
In the static trade-off theory, the cost of financial distress represents the cost of debt, and
finally the probability of bankruptcy. It is assumed that large firms are less likely to default
because they are more diversified than smaller firms; therefore, large firms should have a
greater debt capacity (Titman and Wessels, 1988).
To be able to test how a firm size influences the debt level, the following hypotheses are
proposed:
H1: There is a positive relationship between size and Long-term Debt
H2: There is a positive relationship between size and Short-term Debt
3.2 Firm Growth and Short Term and Long Term Debt
According to Jensen and Meckling (1976) and Myers (1977), an argument is going on form
the traditional tax bankruptcy cost towards regarding the agency cost as the main determinants
of the firm gearing. Agency cost is significant because it arises from the conflict between
shareholders and bondholders. The signal of the agency model is that conflicts make
incentives for shareholders take action to benefit them. However, these actions are at the
expense of bondholders, and it might not always maximize the firm value. On the other hand,
debt holders, in order to protect themselves, use different types of protective covenants and
monitoring devices. According to Myers (1977), conflict exists in many firms, but it becomes
significant for assets that provide a firm with the growth opportunities in the future. The firm
would be financed with less debt if the firm investment concentrated on such assets.
Therefore, there should be a negative relationship between growth opportunities and level of
debt. Myers (1997) stressed out that the agency problem would be decreased if the firms
issued short term debt instead of long term debt. Therefore, short term debt ratios could be
positively correlated to the growth rate if the firm applies short term financing for long term
financing. Myers (1977) propositions are also suitable in the context of SMEs.
Hall et al. (2000) argued that there is a positive relationship between gearing and growth since
it makes incentive for companies to borrowing extra fund to expand their investment.
According to Jordan et al. (1998) the positive correlation between growth and capital structure
is acceptable. Moreover, Michaelas et al. (1999) stressed out that there is a positive
correlation between level of debt and future growth especially with short term debt.
Therefore, the agency and bankruptcy cost may decrease if the firm has short term debt more
than long term debt.
Myers and Majluf (1984) believed that there is a positive relationship between growth and the
debt financing, due to the assumptions of pecking order theory, and existence of information
asymmetric. They argued, that new issued securities might be under priced, which give the
new investors a value more than the NPV. Therefore, the project will be rejected, even with
the positive NPV. They conclude that managers prefer to use less risky source of finance, to
fund their expansionary investment projects.
26
Based on these facts the following hypotheses are proposed:
H3: There is a positive relationship between Growth and Short-term Debt
H4: There is a positive relationship between Growth and Long-term Debt
3.3 Firm Profitability and Short Term and Long Term Debt
Pecking order theory is totally consistent with SMEs behaviour in terms of composition of
their capital structure. SMEs are more willing to use their internal fund rather than looking for
external funds. As Myers (1984) explained, firms with the ability to generate acceptable
amount of profit and earnings are tend to use their own internal source of funds to finance
their project. Therefore, it can be concluded that there is a negative relationship between the
firm profitability and the level of leverage. This conclusion is compatible with pecking order
theory and other relevant studies like Cassar and Holmes (2003).
However, there some established theories believed that a positive relationship exists between
profitability and leverage. For instance, Prasad et al. (2001) argued that the market is not
willing to finance companies with low level of profit. Tong and Green (2005) pointed out, that
first of all there is a considerable negative relationship between profitability and gearing.
Secondly, they understand that there is a positive relationship between past dividend and
current debt level. Their findings are hugely consistent with pecking order theory. Finally, due
to their findings, there is a weak negative correlation between past dividends and growth of
investment.
Pettit and Singer (1985) argued that the agency cost and the problem of information
asymmetry have influence on the availability and the cost of credit for SMEs. They believed
that small firms have a higher level of information asymmetry than large firms, due to the
quality of their financial statement. SMEs find the price of audited financial statement
expensive, and they are reluctant to provide formal financial information to outsiders. As
mentioned before, the main conclusion of asymmetric information theories is pecking order
hypothesis (Myers, 1984). Therefore, firms finance their projects in a hierarchical manner.
This preference, due to the existence of asymmetric information, shows the relative costs of
different source of finance. Therefore, it is reasonable to conclude that the first choice of
finance for profitable firms is retained earnings, then debt, and finally equity. According to
Pettit and Singer (1985), pecking order hypothesis is relevant for SMEs, because the cost of
external fund is higher for them rather than large firms.
Furthermore, according to Michaelas et al (1999), stock market volatility could widen the
firm’s ownership share. This flotation could result in loss of control by the original owner, or
even lead to a takeover. In this situation, the SMEs rational response would be to avoid the
use of external finance, and only rely on internal source of finance. Hence the next hypotheses
are:
27
H5: There is a negative relationship between Profitability and Short-term Debt
H6: There is a negative relationship between Profitability and Long-term Debt
3.4 Firm Age and Short Term and Long Term Debt
Jani et al. (2005) argued that the life cycle of the firm influences the debt level. Dollinger
(1995) stressed out that the developing firms are more likely to finance their project with
retained earning rather than external fund. He argued that developing firms face difficulties in
reassuring the creditors to provide them with funds; hence they are more willing to use their
internal source. However, the case is otherwise for the mature companies; since they have
proved their ability to staying alive and becoming mature in the competitive market.
In contrast, Van Der Wijst(1989) argued that older firms are using less debt to raise fund in
compare with their younger counterparts. Dollinger (1995) stress out that the firms’ condition
can influence on the level of debt. For example, mature firms are more likely to use equity
instead of debt, and the vice versa for developing and small firms. Young and small firms
prefer to use internal sources like trade credit, family loans instead of external source.
As the number of years increase since a firm starts its operation, the amount of accumulated
funds accordingly will increase. Therefore, older firms are less likely to use external funding
since they can use their internal funds to finance their projects. On the other side, young firms
may not have access to a sufficient amount of internal funds, and they are more likely to use
external financing.
Petersen and Rajan (1994) show that as the firm spend more time with the bank, the
availability of finance from the bank will increases. In fact, the established banking
relationships increase the availability of external finance and reduce the cost of credit for
companies. Therefore, when the age increase the amount of external finance will increase.
However, Petersen and Rajan argued that long term debt decreases with age because the older
firms tend to use the accumulated retained earnings. Therefore, there should be a negative
relationship between age and long term debt.
Pecking order theory provides support in shaping the below hypothesis. Considering the
above argument these hypotheses are suggested:
H7: There is a positive relationship between Age and Short-term Debt
H8: There is a negative relationship between Age and Long-term Debt
3.5 Firm Risk and Short Term and Long Term Debt
SMEs by nature are riskier than the larger companies. Cassar and Holmes (2003) mention in
their work that the characteristics of SMEs like higher agency and bankruptcy cost encourage
these firms to avoid the tax benefits of debt. When the firms become exposed to these sorts of
costs they would get more motivation to decrease their level of debt financing, which might
28
cause bankruptcy in SMEs. Operational risk is one of the most serious risk that affect SMEs.
Thus, the firms, which face higher level of operational risk, are more likely to have a lower
level of debt finance.
The hypothetical literature claims that the relationship between level of the risk and gearing is
negative. Deangelo and Masulis (1980) argued in their study that increasing the level of the
debt will increase the chance of bankruptcy. Investors prefer to invest in the firms, which have
less variability in their earning. According to DeAngelo and Masulis (1980) firms with higher
risk have a lower level of debt in its capital structure. Leverage increases the firm’s
probability to default on its debt obligations. According to Myers (1984), risky firms should
borrow less and ceteris paribus.
According to Cassar et al (2003) using debt will bring tax shield benefits, but bankruptcy and
agency costs make enough incentives for firms not to use debt to raise funds. Various authors
(Bradley et al., 1984; Kester, 1986 and Titman and Wessels, 1988) argued that an optimal
level of gearing in a firm is a decreasing function of the volatility of earnings, due to the
bankruptcy and agency cost. Volatility of earnings is a measure of the operating risk.
Michaelas et al (1999) pointed out that the fluctuation of the firm’s future income is the
cornerstone for anticipating the firm’s ability to meet the fixed charges. Therefore, a firm may
anticipate that operating risk is negatively related to the amount of the debt in a firm capital
structure.
Therefore, the following hypotheses are proposed:
H9: There is a negative relationship between operational risk and Short-term Debt
H10: There is a negative relationship between operational risk and Long-term Debt
3.6 Firm Asset Structure and Short Term and Long Term Debt
Asset structure of the firms is one of the factors that contribute in shaping the level of debt.
According to Harris and Raviv (1988), the firm level of tangible and generic asset result in the
higher liquidation value of the firm. As an example, Storey (1994) argued that, in many
cases, banks prefer to lend money to those firms with more tangible asset to secure their
funding. According to the previous studies such as in Cassar and Holmes (2003), one of the
crucial determinants of capital structure of SMEs is the structure of the assets in these firms. If
a firm has more tangible assets it would decrease the probability of default since the
liquidation of the firm increases subsequently. Therefore, firms are less probable to be
bankrupt after using the debt financing, which in turn decrease the debt financing cost and
encourages the firms to increase the debt level.
Barnea et al. (1981) believed that there is a direct positive relationship between the agency
problem and the level of asymmetric information. When the level of asymmetric information
is high, the agent has the capacity and motivation to transfer wealth among the parties. The
agent partial ownership let him use the firm’s assets, and pay less than the sum of the
29
individual cost to the principals. Barnea et al. (1981) argued that the agency cost is higher in
SMEs because the owner of a small firm has a tendency to follow his own interest prior to
other stakeholders. In addition, agency problems solutions are expensive for SMEs, which
increase the cost of transaction between SMEs and its stakeholders. Monitoring is even more
difficult and expensive for the SMEs because small firms are not required to disclose much of
the information. Therefore, providing audited financial information causes a significant cost
for SMEs. Adverse selection and moral hazard problems are also more severe for SMEs than
large firms, because of their closely held characteristics.
The solution to avoid all the above mentioned cost is to raise debt which is secured by the
known value property. Stiglitz and Weiss (1981) stressed out that banks respond to moral
hazard and adverse selection problems by asking for collateral. According to Binks et al.
(1988) in many countries lenders seeking for collateral or lenders only offer secured loans.
Therefore, firms, which have fixed assets with a strong collateral value, have an easier access
to raise external finance. Accordingly, due to the availability of collateral, these firms have a
higher level of debt rather than firms with lower value of collateral. The following hypotheses
are shaped to analyze whether the above discussion holds true or not:
H11: There is a positive relationship between Asset structure and Short-term Debt
H12: There is a positive relationship between Asset structure and Long-term Debt
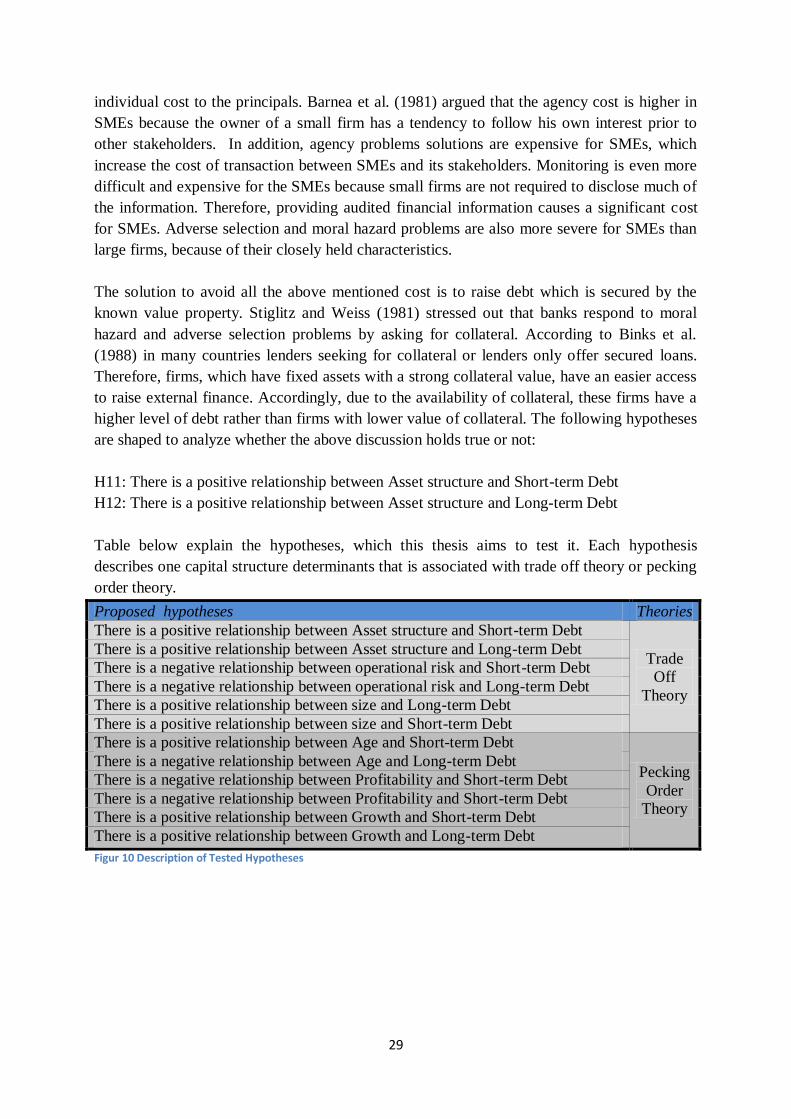
Table below explain the hypotheses, which this thesis aims to test it. Each hypothesis
describes one capital structure determinants that is associated with trade off theory or pecking
order theory.
Proposed hypotheses Theories
There is a positive relationship between Asset structure and Short-term Debt
Trade
Off
Theory
There is a positive relationship between Asset structure and Long-term Debt
There is a negative relationship between operational risk and Short-term Debt
There is a negative relationship between operational risk and Long-term Debt
There is a positive relationship between size and Long-term Debt
There is a positive relationship between size and Short-term Debt
There is a positive relationship between Age and Short-term Debt
Pecking
Order
Theory
There is a negative relationship between Age and Long-term Debt
There is a negative relationship between Profitability and Short-term Debt
There is a negative relationship between Profitability and Short-term Debt
There is a positive relationship between Growth and Short-term Debt
There is a positive relationship between Growth and Long-term Debt
Figur 10 Description of Tested Hypotheses
30
Chapter4. Methodology
4.1 Methodology; Qualitative and Quantitative
Research method briefly tells how and on what grounds this thesis reach conclusions. In
social science method can be divided into two categories: qualitative research method and
quantitative research method. Qualitative research collections of findings enable new unique
non-quantifiable insights about opinions, behaviors, events, social environment and
relationships (Ghauri and Grönhaug, 2005). On the other side, researcher in the quantitative
method, collects data and findings from statistical methods and other quantification
procedures (Ghauri and Grönhaug, 2005). Quantitative method enables studies to explain
phenomena by collecting numerical data. Researcher applies mathematical based methods to
analyze the data (Aliaga and Gunderson, 2003). Creswell (1997) defined a quantitative
research as:
“…an inquiry into social or human problems, based on testing a theory contains variables,
measured with numbers and analyzed with statistical procedures in order to determine
whether the predictive generalizations of the theory hold true…”
The purpose of empirical or quantitative research is to develop hypothesis, theories and apply
the statistical measures to assess the phenomena. Quantitative methods are deductive, and the
hypotheses are shaped by the data and information. Conclusions in deductive research draw
from logic reasoning. Hypothesis will check empirically, and it might be accepted or rejected.
Deductive research usually aligns with quantitative research (Ghauri and Grönhaug, 2005).
The other common method in social and behavioral science is qualitative research method,
which typically uses words. This method is suitable for studying organizations, individuals
and groups (Strauss and Corbin, 1990). Qualitative method tries to understand the phenomena
in the context of economics, politics and sociology. Avery common example of qualitative
research is a case study, which typically focuses to understand only one case. In fact, focusing
on a few subject or individual is the main disadvantages of this method. Qualitative researcher
applies different approaches to gather data like ground theory practice, storytelling, group
discussion, observation and interviews. Inductive research is most of the time associated with
the qualitative research. According to (Bryman and Bell, 2003), in inductive approach
conclusions deduce from empirical observation. In this research, observations provide
background for the findings, and the outcome of research is theory. Figure below is showing
the difference between qualitative and quantitative methods:
Qualitative
Method
Quantitative
method
Importance is given to understanding i.e.
theory is developed
Importance is given to testing and
verification i.e.
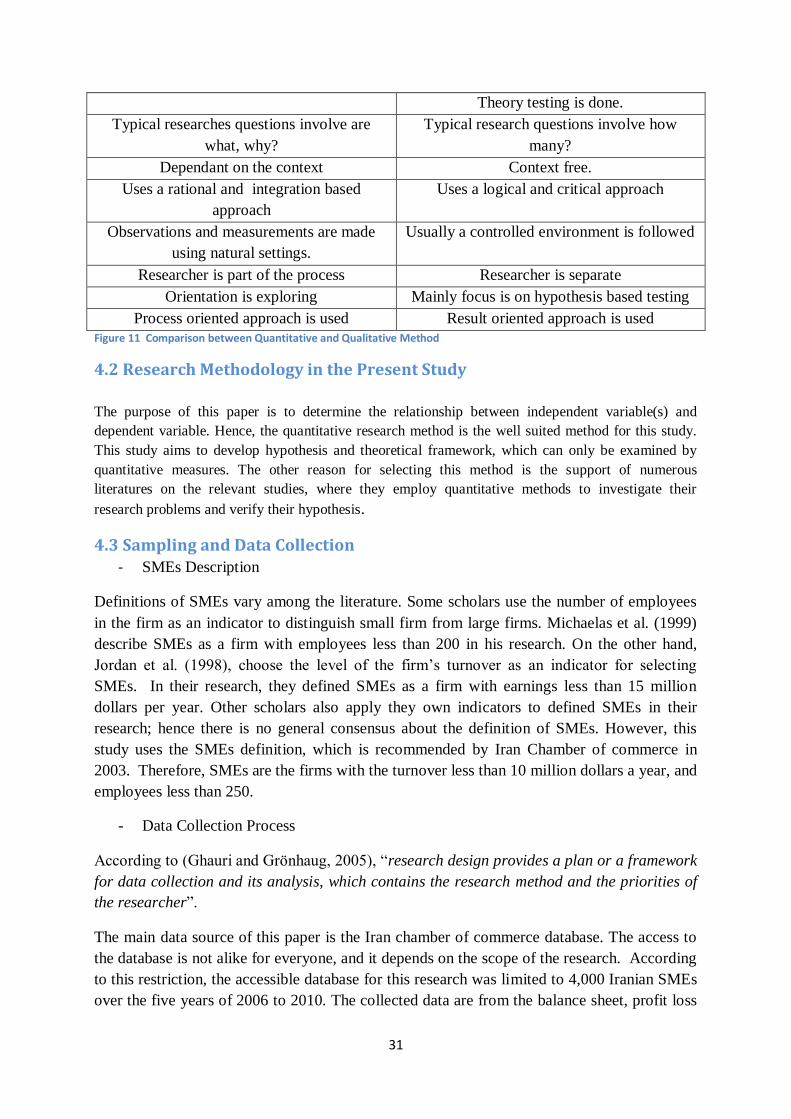
31
Theory testing is done.
Typical researches questions involve are
what, why?
Typical research questions involve how
many?
Dependant on the context Context free.
Uses a rational and integration based
approach
Uses a logical and critical approach
Observations and measurements are made
using natural settings.
Usually a controlled environment is followed
Researcher is part of the process Researcher is separate
Orientation is exploring Mainly focus is on hypothesis based testing
Process oriented approach is used Result oriented approach is used
Figure 11 Comparison between Quantitative and Qualitative Method
4.2 Research Methodology in the Present Study
The purpose of this paper is to determine the relationship between independent variable(s) and
dependent variable. Hence, the quantitative research method is the well suited method for this study.
This study aims to develop hypothesis and theoretical framework, which can only be examined by
quantitative measures. The other reason for selecting this method is the support of numerous
literatures on the relevant studies, where they employ quantitative methods to investigate their
research problems and verify their hypothesis.
4.3 Sampling and Data Collection - SMEs Description
Definitions of SMEs vary among the literature. Some scholars use the number of employees
in the firm as an indicator to distinguish small firm from large firms. Michaelas et al. (1999)
describe SMEs as a firm with employees less than 200 in his research. On the other hand,
Jordan et al. (1998), choose the level of the firm’s turnover as an indicator for selecting
SMEs. In their research, they defined SMEs as a firm with earnings less than 15 million
dollars per year. Other scholars also apply they own indicators to defined SMEs in their
research; hence there is no general consensus about the definition of SMEs. However, this
study uses the SMEs definition, which is recommended by Iran Chamber of commerce in
2003. Therefore, SMEs are the firms with the turnover less than 10 million dollars a year, and
employees less than 250.
- Data Collection Process
According to (Ghauri and Grönhaug, 2005), “research design provides a plan or a framework
for data collection and its analysis, which contains the research method and the priorities of
the researcher”.
The main data source of this paper is the Iran chamber of commerce database. The access to
the database is not alike for everyone, and it depends on the scope of the research. According
to this restriction, the accessible database for this research was limited to 4,000 Iranian SMEs
over the five years of 2006 to 2010. The collected data are from the balance sheet, profit loss
32
accounts. Specifically I have chosen firms with the turn over less than 10 million USD in
sales, and less than 250 employees. From the total sample, I have excluded the subsidiary
companies from their parents companies because the aim of this thesis is to examine the
independent firms. Considering the subsidiary firms would only create noise and potential
measurement errors, since the whole investigating is about external financing. Moreover, I
have excluded firms in the financial sector, and firms with inconsistent or extreme figures to
avoid further noise and measurement errors. To be able to exclude the negative equity firms, I
used the measurement as all debt-to-asset ratios should be to be larger than 0 and less than 1.
Besides, I excluded firms that their fiscal year is varying from the calendar year; in order to
create a data set with the same point in time to control the time fixed effects. Firms who did
not publish data for more than 2 years were also excluded. The definitive number of firms
after all the mentioned adjustments is 201 firms resulting in 8,040 observations.
2006 was the last year in the data base that I could find comprehensive data for my thesis. The
good point about the selected time boundary is that it includes 2008. The recent global
recession occurred in 2008 in which firms tried different financial policies to prevent
bankruptcy. Including this year in the sample, makes this research capable of investigating
the influence of the financial crisis on the Iran SMEs capital structure. The total number of
observation in the period of five years is around 8,040, although the actual number of
observation might become less than 8,040 in the process of regression.
In the Iran, manufacturing industries are homogeneous and normally reflect the same behavior
toward financing. In the present study, all firms are selected form the most of the
manufacturing industries because they are practicing in the quite similar economic condition.
Therefore, it is easier to generalize their financing behavior attribute to all the industry.
4.4 Selection of the Variables Variables in this study are selected according to the work of Michaelas et al. (1999) and Hall
et al. (2004). The independent variables are growth, asset structure, age, size, operational risk
and profitability. These independent variables are approved by the relevant literatures as the
suitable indicators for both SMEs and large firm’s capital structure. Some studies suggest tax
factor as an indicator for listed companies’ capital structure studies. However, in the case of
SMEs due to their characteristics tax indicator would not be suitable and is excluded from
independent variables in this study.
To define the dependent variables, the maturity structure of debt is considered. In order to put
emphasize on the effect of each independent variables on short term and long term debt
separately. As it was suggested in previous studies, SMEs are normally having different idea
about the short term and long term financing. SMEs are not willing to use long term financing
since it would increase the chance of bankruptcy. However, short term financing is not always
at hand, and it depends on the market condition. Each explanatory variables impact short term
and long term debt in different ways, hence these categories should be analyzed separately.
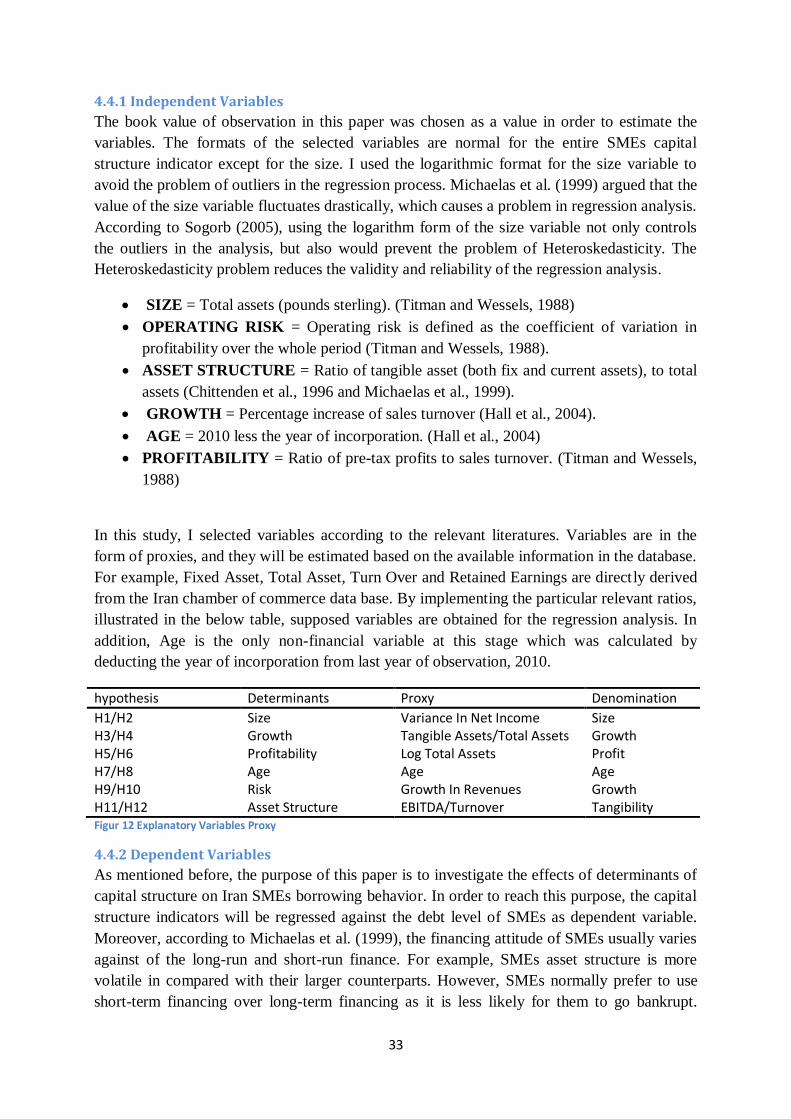
33
4.4.1 Independent Variables
The book value of observation in this paper was chosen as a value in order to estimate the
variables. The formats of the selected variables are normal for the entire SMEs capital
structure indicator except for the size. I used the logarithmic format for the size variable to
avoid the problem of outliers in the regression process. Michaelas et al. (1999) argued that the
value of the size variable fluctuates drastically, which causes a problem in regression analysis.
According to Sogorb (2005), using the logarithm form of the size variable not only controls
the outliers in the analysis, but also would prevent the problem of Heteroskedasticity. The
Heteroskedasticity problem reduces the validity and reliability of the regression analysis.
SIZE = Total assets (pounds sterling). (Titman and Wessels, 1988)
OPERATING RISK = Operating risk is defined as the coefficient of variation in
profitability over the whole period (Titman and Wessels, 1988).
ASSET STRUCTURE = Ratio of tangible asset (both fix and current assets), to total
assets (Chittenden et al., 1996 and Michaelas et al., 1999).
GROWTH = Percentage increase of sales turnover (Hall et al., 2004).
AGE = 2010 less the year of incorporation. (Hall et al., 2004)
PROFITABILITY = Ratio of pre-tax profits to sales turnover. (Titman and Wessels,
1988)
In this study, I selected variables according to the relevant literatures. Variables are in the
form of proxies, and they will be estimated based on the available information in the database.
For example, Fixed Asset, Total Asset, Turn Over and Retained Earnings are directly derived
from the Iran chamber of commerce data base. By implementing the particular relevant ratios,
illustrated in the below table, supposed variables are obtained for the regression analysis. In
addition, Age is the only non-financial variable at this stage which was calculated by
deducting the year of incorporation from last year of observation, 2010.
hypothesis Determinants Proxy Denomination
H1/H2 Size Variance In Net Income Size H3/H4 Growth Tangible Assets/Total Assets Growth H5/H6 Profitability Log Total Assets Profit H7/H8 Age Age Age H9/H10 Risk Growth In Revenues Growth H11/H12 Asset Structure EBITDA/Turnover Tangibility Figur 12 Explanatory Variables Proxy
4.4.2 Dependent Variables
As mentioned before, the purpose of this paper is to investigate the effects of determinants of
capital structure on Iran SMEs borrowing behavior. In order to reach this purpose, the capital
structure indicators will be regressed against the debt level of SMEs as dependent variable.
Moreover, according to Michaelas et al. (1999), the financing attitude of SMEs usually varies
against of the long-run and short-run finance. For example, SMEs asset structure is more
volatile in compared with their larger counterparts. However, SMEs normally prefer to use
short-term financing over long-term financing as it is less likely for them to go bankrupt.
34
Sample data in this thesis also confirms that most of the SMEs only apply the short-term debt
as external financing. Number of SMEs using long term debt in the sample is few. Therefore,
the first priorities of SMEs are short-term debt unless it is an exceptional condition.
Considering this characteristic of the SMEs, and making the results reliable and descriptive,
the maturity structure of debt (short-term debt and long-term debt) will be applied in this
thesis. Hence the two dependent variables are as following, and the regression analysis would
be carried out separately for each of them.
SHORT TERM DEBT RATIO = Short term debt to total assets
LONG TERM DEBT RATIO = Long term debt to total assets
Short term debt comprises the firm’s total debt repayable in one year or less, such as current
liabilities, bank overdrafts and bank loans. Long term debt is the firm’s total debt which is
repayable beyond one year. This includes long term liabilities and long term bank loans, such
as leasing obligation, directors’ loans and hire purchase. The dependent variables in this study
can easily be calculated by dividing the short-term and long-term debt by total assets. All the
components of the short-term and long-term debt along with total assets are collected from the
Iran chamber of commerce database.
4.5 Panel Data Analysis Buse and Hess (1983) applied time series method to conduct their empirical research on
capital structure. However, other scholars mostly use cross section data in later years
(Bradley et al., 1984; Kim and Sorensen, 1986; Titman and Wessels, 1988; Rajan and
Zingales, 1995). In the resent years, the panel data analyzed have been selected by many
authors in capital structure studies (Michaels et al., 1999; Sogorb-Mira and López-Gracia,
2003; Frank and Goyal, 2003). Panel data method brings more advantage over time series and
cross sectional methods, and it is beneficial in economic researches. Panel data method is a
combination of time series and cross sectional. In fact, panel data is multi dimensional data,
which includes observation on multiple phenomena over various time periods for the same
firm. Since this method has a vast amount of data points, the degree of freedom increases and
collinearity in the independent variables decreases (Hsiao, 1985).
The advantage of combining cross section and time series data is that it enables the researcher
to control the individual effects and time effects. These two effects can be unobservable and
correlated with the independent variables in the model (Hausman and Taylor, 1981). In the
present paper, panel data method helps me to control the firm’s heterogeneity and reduce the
collinearity between the independent variables. The general regression model of panel data is
written as following:
Where Xit, i=1...N and t=1 …T
In this thesis, Xit is 201 firms with six matrixes including all the explanatory variables. β is
the coefficients which is used as determinants of capital structure, and Uit is an error term. In
35
this model, i stands for the cross section of the data ranging from 1 to 201, and t indicates the
time-series dimension of the data ranging from 1 to 5 (2006-2010).
4.6 Proposed Regression Model In this paper, six indicators of firms’ capital structure, Size, Age, Growth, Asset Structure,
Profitability and Operational Risk will be regressed against two dependent variables of the
study, short-term debt and long-term debt ratios, through the panel data analysis method. The
regression model as below shows the variables arrangement:
Yi = αi + β1i(Size)i + β2i(Age)i + β3i(Asset Structure)i + β4i(Profitability)i +
β5i(Operational Risk)i + β6i(Growth)i+ ε
i =1, i=2
Y1 = Short-term Debt Ratio Y2 = Long-term Debt Ratio
The six explanatory variables regressed against the two dependent variables. The analysis will
conduct by considering the effect of each explanatory variable on the two dependent
variables. The obtained result would be considered in term of magnitude of the coefficients
and signs in order to check the compatibility of the result with the previous studies. The next
chapter aims to provide the detailed descriptive about the regression analysis.
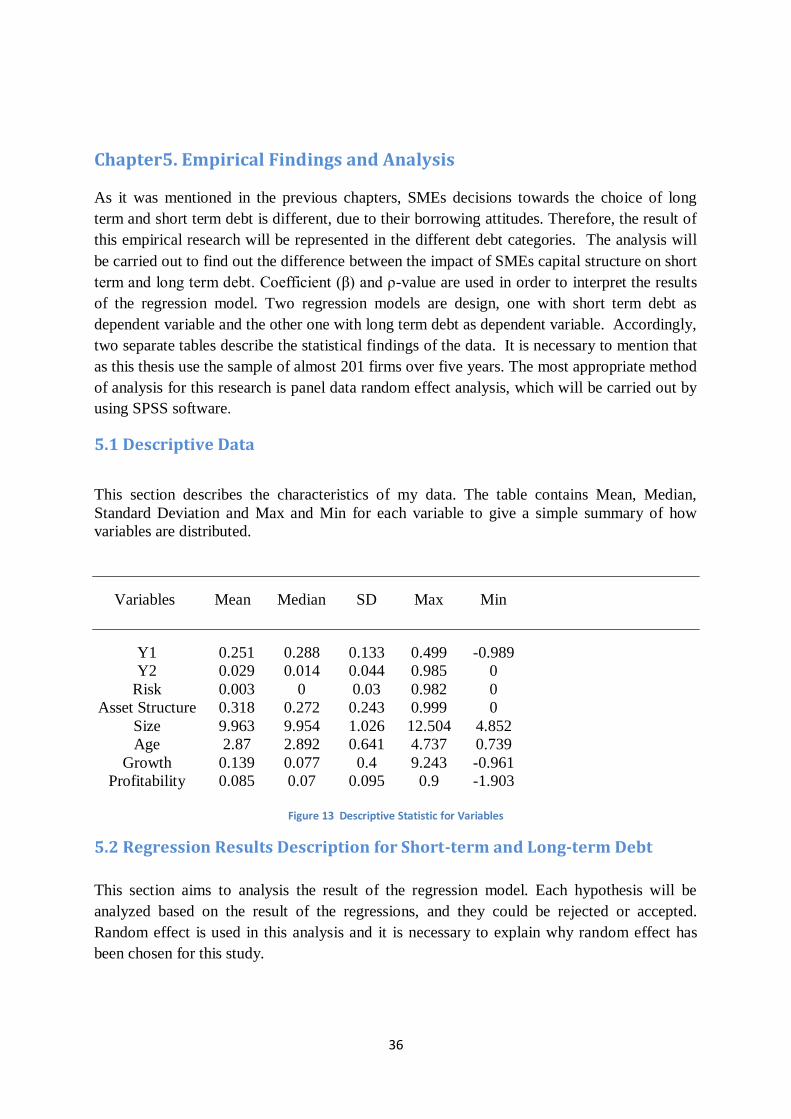
36
Chapter5. Empirical Findings and Analysis
As it was mentioned in the previous chapters, SMEs decisions towards the choice of long
term and short term debt is different, due to their borrowing attitudes. Therefore, the result of
this empirical research will be represented in the different debt categories. The analysis will
be carried out to find out the difference between the impact of SMEs capital structure on short
term and long term debt. Coefficient (β) and ρ-value are used in order to interpret the results
of the regression model. Two regression models are design, one with short term debt as
dependent variable and the other one with long term debt as dependent variable. Accordingly,
two separate tables describe the statistical findings of the data. It is necessary to mention that
as this thesis use the sample of almost 201 firms over five years. The most appropriate method
of analysis for this research is panel data random effect analysis, which will be carried out by
using SPSS software.
5.1 Descriptive Data
This section describes the characteristics of my data. The table contains Mean, Median,
Standard Deviation and Max and Min for each variable to give a simple summary of how
variables are distributed.
Variables Mean Median SD Max Min
Y1 0.251 0.288 0.133 0.499 -0.989
Y2 0.029 0.014 0.044 0.985 0
Risk 0.003 0 0.03 0.982 0
Asset Structure 0.318 0.272 0.243 0.999 0
Size 9.963 9.954 1.026 12.504 4.852
Age 2.87 2.892 0.641 4.737 0.739
Growth 0.139 0.077 0.4 9.243 -0.961
Profitability 0.085 0.07 0.095 0.9 -1.903
Figure 13 Descriptive Statistic for Variables
5.2 Regression Results Description for Short-term and Long-term Debt
This section aims to analysis the result of the regression model. Each hypothesis will be
analyzed based on the result of the regressions, and they could be rejected or accepted.
Random effect is used in this analysis and it is necessary to explain why random effect has
been chosen for this study.
37
One common issue in the panel data analysis is whether the individual effects are fixed effects
or random effects. Hsiao (1986) argued that, a random effect can be selected if the researcher
thinks of the variables included in the study as a sample drawn from a larger population of
variables that could have been selected.
The main difference between fixed and random effects is in the kind of information derived
from the analysis of the effects. In the fixed effects, researcher is interested in making
explicit comparisons of one level against another. If the primary interest is in the effects of
other variables across the levels of a factor (e.g. the effect of capital structure determinants on
gearing, across samples from 201 firms), then the method should be random effect. In this
study selecting 201 firms from a larger population of firms within the country; it is reasonable
to select random effect.
In the first table short term Debt Ratio, is considered as dependent variable. On the other side,
Risk, Growth, Asset Structure, Profitability, Age and Size are the explanatory variables,
which are being regressed against the dependent variable. The results of the regression for
short term debt are as following:
Dependent Variable: Y1 Method: Panel EGLS (Random effect) Date: 10/19/2012 Time: 14:18 Sample (adjusted): 2006 2010 Period included: 5 Cross-sections included: 201 Total panel (unbalanced) observation: 7694
Variable Coefficient Std. Error t-Statistic Prob.
SIZEN -0.14187 0.04505 -3.14916 0.0017
AGE 0.01069 0.00382 2.79842 0.0190
ASN 0.09537 0.04172 2.28593 0.0355
PROFIT - 0.71670 0.09400 7.62446 0.0000
RISK -0.06710 0.02645 -2.53682 0.0452
GROWTH -0.11741 0.04368 -2.68795 0.0433
C 0.03662 0.01596 2.29510 0.0351
Y1(-1) 0.93021 0.02012 46.2252 0.0000
R-squared 0.712324
Adjusted R-squared 0.710292
Figure 14 Short term Debt Financing Regression Result
38
According to the regression results tables, all the explanatory variables are significant at any
so-called significant level (%1, %5, and % 10). The level of significance and sign of the
coefficients shows the level and direction of independent variables on dependent variable.
5.2 H1/H2 Size and Leverage The first and second hypotheses are “There is a positive relationship between size and Long
term/short term debt”. A positive correlation between size and gearing is supported by Van
der Wijst and Thurik (1993) and Chittenden et al. (1996). However, the analysis of the
empirical finding shows that the impact of size on short term and long term debt ratios are
opposite. Data analysis in table 1 reveled the standardize β= -0.014187 and ρ-value<.01.
Therefore, the first hypothesis is rejected within this study. This result can be explained as one
unit increase in the firm size (asset structure) will decrease 0.014 usage of short term debt in
capital structure. Table 2 shows that size is positively related to long term debt. With the
standardized β=0.07483 and ρ-valued<.01. The second hypothesis is accepted, and the
primary data analysis indicates that one unit increase in firm size leads to 0.07 increase on the
use of long term debt in capital structure.
One reason for the existence of a negative relationship among the size and the short term debt
could be the transaction cost. Small size SMEs have higher transaction cost when they issue
long term debt; hence they rely on short term finance. In another word, when the size decrease
raising fund with short term debt increase, and when the size increased, level of short term
debt decrease. The transaction cost can also explain the positive relationship between size and
long term debt. Low transaction cost in large SMEs encourages them to use long term debt.
The different sign of coefficient can be interpret as large SMEs are less prone to bankruptcy
than small SMEs because of diversification. Moreover, a firm can increase its size (total
asset), when retained earnings in a firm increase. Access to a sufficient level of retained
Dependent Variable: Y2 Method: Panel EGLS(Random effect)
Date: 10/19/2012 Time: 14:25
Sample (adjusted): 2006 2010
Periods included: 5
Cross-sections included: 201
Total panel (unbalanced) observations:7694 Variable Coefficient Std. Error t-Statistic Prob. SIZEN 0.07483 0.00225 3.32134 0.0009
AGE -0.00049 0.00019 -2.61644 0.0473
ASN 0.01379 0.00216 6.37505 0.0000
PROFIT 0.14575 0.04210 -3.46199 0.0180
RISK -0.04191 0.01313 -3.19239 0.0242
GROWTH -0.06100 0.02165 -2.81791 0.0372
C 0.02081 0.00746 2.78681 0.0054
Y2(-1) 0.64926 0.02590 25.06293 0.0000 R-squared 0.477064
Adjusted R-squared 0.473371
Figure 15 Long term Debt Financing Regression Results
39
earnings may obviate the need for raising funds with short term debt. That could be another
reason for negative correlation between size and short term debt. Moreover, large SMEs can
raise fund with long term debt easier than small SMEs because they have stronger assets to
secure the long term debt (Michaels et al., 1999).
5.2H3/H4 Growth and Leverage
The two next hypotheses H3 and H4 proposed a “positive relationship between growth and
long term and short term debt”. Various authors such as (Chittenden et al., 1996.; Jordan et
al., 1998 and Michaels et al., 1999) reported a positive relationship between two concepts.
However, the empirical result of this study shows a negative relationship between growth and
short term and long term debt. The negative relationship among the growth and firm’s
leverage is consistent with findings of Myers, 1984; Williamson, 1988; and Harris and Raviv,
1991.
The hypothesis of a positive relationship between growth and short term debt is rejected with
the standardized β= -0.1174 and ρ-value<.05. The hypothesis of a positive relationship
between growth and long term debt is rejected with the standardized β= -0.0610 and ρ-
value<.05. According to Myers (1977), the negative correlation is due to the agency problem.
As mentioned before, agency cost is higher in small firms than large ones. In fact, conflicts
may arise between managers and owners in the firm when the growth opportunities increased.
These agency problems may have a negative impact on both short term and long term debt.
Titman & Wessels (1988) argued that growth opportunity does not generate current income,
and they have an intangible nature. When a bankruptcy is likely to occur in a firm, the value
of growth opportunity will decrease. Therefore, firms with higher growth opportunities are
more exposed to bankruptcy cost. Existence of bankruptcy cost has a negative influence on
borrowing behavior of firms. Findings of Myers (1977) and Titman and Wessels (1988) are
supported by the finding of Wald (1999), who finds a negative relationship between growth
opportunity and firms gearing.
5.3H5/H6 Profitability and Leverage
The H5 and H6 argued “there is a negative relationship between profitability and short term
and long term debt”. These two hypotheses are accepted within this empirical research. The
analysis of empirical data shows the standardized β= -0.7167 and ρ-value<.000, which
supports the H5. H6 is also supported by the standardized β= -0.1457 and ρ<.01.
The negative correlation between profitability and gearing provide evidence for pecking order
theory. Authors such as Michaelas et al., 1999; Myers, 1984; Cassar and Holmes, 2003; and
Voulgaris et al. (2004) mentioned SMEs are strictly following the Pecking Order theory. The
results can be interpreted that small business’s owner prefer to use internal source rather than
external sources. Managers tend to use retained earnings as much as possible, and when
additional finance is needed they raise debt. Therefore, if small firms use internally generated
40
funds as a first source, then those firms, which use external finance, are the ones with lower
level of profit. According to the results, it can be concluded that a firm with a high level of
profit will accordingly have access to a higher level of retained earnings hence they will
borrow less. A negative relationship between profitability and leverage in SMEs is also
confirmed by Van der Wijst and Thurik (1993), Chittenden et al. (1996a) and Jordan et al.
(1998).
5.4H7/H8 Age and Leverage
Hypotheses seven and eight proposed “there is a positive/negative correlation between age
and short term/long term debt”. The analysis of empirical data revealed that age has an
opposite effect on long term and short term debt. The result does support the H7, with the
positive standardize β= 0.0106 and ρ<.05. Moreover, data analysis shows that the age effect
on long term debt is negative, with the standardized β= -0.0004 and ρ<.05. The age
coefficient in the long term analysis is insignificant, and it is close to zero. Although,
hypothesis eight is accepted within this study, but the result can be interpreted as there is no
age impact on long term debt.
According to pecking order theory, older firms have enough time to collect internally
generated funds; hence they do not in a great need of external finance. The insignificant age
coefficient also proved the idea that the older firms are not in a great need of external finance.
The insignificant β certifies that older firms are more likely to use internal funds rather than
both long term and short term funds. The effect of Age on short term debt is extremely small,
although positive and bigger than long term debt. A comparison between the two coefficients
gives a conclusion that SMEs are more willing to raise short term debt rather than long term
debt. When the correlation between Age and short term debt is remarkably small, then no
correlation between age and long term debt is reasonable. The small impact of age on Short
term debt again confirmed the pecking order theory compatibility with SMEs financing.
Another explanation can be found in the firm’s capital structure. According to the descriptive
statistics older firms should have relatively more long term debt. However, older firms have a
chance to accumulate internally generated funds. Over time, the need for renewing maturing
long term debt would decrease. A long term debt with one year maturity becomes short term
debt in the firm’s balance sheet. This fact could be a reason why there is a positive correlation
between short term debt and age, and also a negative correlation between age and long term
debt.
5.5H9/H10 Operational Risk and Leverage The next two hypotheses are “there is a negative relationship between operational risk and
short term and long term debt”. The analyses of empirical data support both hypotheses with
a negative coefficient. The H9 is supported with the standardized β= -0.0671 and the ρ-
value<.05, hence the operational risk negatively affects the short term debt. Empirical data
also provides support for H10 with the standardized β= -0.0419 and ρ-value<.05.
41
The negative relationship between the level of the risk and debt can be explained as firms
normally raise lower level of debt when they are facing the risk. For example, at the time of
crisis or financial distress, firms are financially weak. The probability of bankruptcy will
increase if the firms raise more debt. The risk coefficient sign tells that the level of leverage in
SMEs would decrease by (short term= -0.06 and long term= -0.4) units if the firms’
operational risk increased by one unit.
The negative coefficient for both groups of leverage is in line with the proposed hypotheses
and static trade of theory. My results show that small firms with higher operating risk tend to
use less short term and long term debt. These results are consistent with the earlier works of
other scholars such as Hall et al. (2004) and Jordan et al. (1998). McConell and Pettit (1984)
and Pettit and Singer (1985) argued that bankruptcy costs could be distinguished in SMEs,
and would, therefore, expect a negative correlation between risk and gearing. Nevertheless,
Bradley et al. (1984) pointed out, that SMEs experiencing a higher level of financial distress.
He argued that SMEs have fewer tangible assets and less retained earnings to stand against the
economic shocks. Therefore, a negative relationship can exist between risk and gearing due to
the costs of financial distresses.
5.6 H11/H12 Asset Structure and Leverage
Analysis of empirical data provides support for H11/H12. The last two hypotheses suggest
“there is a positive relationship between asset structure and short term/long term debt”. The
H11 is supported by the standardized β= 0.0953 and ρ<.05. The H12 is also supported by the
standardized β= 0.0137 and ρ< .01. Various literatures confirm that the asset structure usually
has a positive correlation with the level of debt in the firms. Logically, being bankrupt is less
likely for firms with strong asset structure. Firms with higher level of asset structure are
willing to raise fund from external sources. These firms can secure their debt by their asset
structure.
One explanation for a positive relationship between asset structure and gearing is due the
information asymmetries and agency problems. As mentioned before, agency problem and
asymmetric information is more severe in small and medium size firms rather than large
firms. Creditors are reluctant to lend funds to SMEs, mainly because of the asset substitution
danger, and the existence of information asymmetric and agency cost in the SMEs. In order to
persuade creditors to provide debt finance, SMEs offer collateral to secure the bank loans.
According to Michaels et al (1999), more debt will be available at a lower cost if SMEs
secure their debt finance with fixed asset or inventory with a known value. In fact,
information asymmetry and agency cost will decrease when the firms secure its debt with
fixed asset or high level of inventory. As a result, firms with a high proportion of strong asset
structure are able to raise greater higher level of debt finance
The relevant studies also confirm that stronger asset structure brings more leverage for the
firms; hence there should be a positive relationship between these two variables in SMEs.
Cassar and Holmes (2003) argued that having more tangible assets increase the liquidity in
firms and make them less probable to go bankrupt. Therefore, firms with strong asset
structure are the ones who tend to raise higher level of leverage in their financing process.
42
Conclusion
The objective of this paper is to contribute to the limited research of the impact of capital
structure determinants on the borrowing behavior of SMEs in Iran. This paper has applied the
panel data regression for the sample of 201 SMEs in Iran. This thesis examined empirically
the implications of the theory of capital structure in the SMEs. The result of the empirical
analyses provides evidence on the magnitude, direction and significance of the regression
coefficients of the six capital structure determinants, over the time. My findings are not
conclusive, but they support the static trade off theory and pecking order theory.
The findings suggest that the capital structure determinants introduced by the theory of
finance are relevant for the Iran small business sector. The general conclusion of this paper
suggests that agency cost and asymmetric information cost have an influence on the level of
short term and long term debt in SMEs. SMEs experience a higher level of agency cost and
asymmetric information cost during their lives. The existence of these costs provides the
SMEs with lower ratios of collateralized assets. SMEs with the weak asset structure are
sensitive to economic turmoil and will be consider risky by financial institutions. Therefore,
SMEs should rely on lower levels of external funds.
My results show evidence that profit, defined as the ratio of pre-tax profits to sales turnover,
is the most powerful determinant of borrowing decisions in both long term and short term
debt. Profitability affects both groups of debt in the same way, but the magnitude is
substantially higher for short term debt than long term debt. This huge difference in
magnitude might be a result that SMEs raise relatively more short term debt than long term
debt. Pecking order theory supports the use of short term debt, but lack of collateralized assets
and the scope of a business could be the reasons for applying more short term debt. With the
same logic, SMEs use internally generated funds rather than short term debt to finance
projects once profitable. The next influential determinant after profit is size. My results reveal
that there is a negative correlation between short term leverage and size. The size coefficient
for long term leverage is positive but significantly lower than short term leverage. This
suggests that SMEs experience several constraints, such as transaction costs, information
asymmetries and bankruptcy risk. These constraints prevent SMEs from rising external fund
regardless of the size. Along profitability and size, asset structure seems to be another factor
which influences SMEs borrowing behavior. The positive correlation indicates that leverage
will be available for SMEs if they provide collateral to secure the bank loan. In other words,
lenders are worried to lend because of asset substitution danger. Securing the loan with fixed
assets or known value inventory is associated with both debt groups, since it reduces the
agency and information asymmetry costs. On the other hand, risk and growth opportunity
seem to influence the decomposed leverage for SMEs negatively to a greater extent.
Therefore, risk and growth opportunities appear to be more valuable for creditors while
evaluating SMEs. Age is the determinant which does not seem to affect the long term debt
level, and it has a very small positive effect on short term debt on Iranian SMEs. This
unexpected positive correlation between age and short term debt can be explained by the
43
leverage maturity. When a long term loan becomes mature within a year, if it is not renewed,
it turns into a short term loan in the balance sheet as the firm grows older.
Limitations and Improvement
The same as the other empirical studies regarding the SMEs, this thesis also faces some
noteworthy limitations. Limitation in generalizing the result of this study includes: firstly,
SMEs are not obliged to disclose their financial information. Those SMEs who disclose their
financial statement may decide to publish partially and incomplete. Lack of transparency and
incomplete data leads to an unbalanced dataset, which limit the sample size of this study to
only 201 SMEs. The availability of data for SMEs is mainly limited by two factors of: number
of firms and history of financial data. Data availability has been named as one of the most
crucial limitation of SMEs research. Secondly, this paper focused on six most used capital
structure indicators as independent variables. In order to increase the accuracy of the
regression model, more capital structure indicators that can be added to the model. Thirdly, all
the selected firms in this study are small private limited firms, which are survived from the
bankruptcy; although the risk of bankruptcy always exists. Reviewing on capital structure
literatures clearly shows that high gearing may result in bankruptcy. Therefore, the study’s
sample is likely to exclude the highly gearing SMEs. Further studies can be done with the
aim of adding more depending indicators, and also including highly gearing firms into the
sample.
44
References
- Akerlof, G. (1970), “The Market for "Lemons": Quality Uncertainty and the Market
Mechanism”, the Quarterly Journal of Economics, Vol. 84 No. 3, pp. 488-500.
- Kjellman, A., Ehrsten, M. (2005), A Theory of Homo Entreprenaurus, in G.T. Vinig,
R.C.W. Van Der Voort (ed.) The Emergence of Entrepreneurial Economics (Research
on Technological Innovation, Management and Policy, Volume 9), Emerald Group
Publishing Limited, pp.211-232.
- Anderson, R. C., Reeb, D. M. (2003), “Founding-Family Ownership, Corporate
Diversification, and Firm Leverage.” The Journal of Law and Economics. Vol.46 No.
2.
- Ang, J. S (1976), “The Intertemporal Behavior of Corporate Debt Policy”, Journal of
Financial and Quantitative Analysis, Vol.11 No.4, pp. 555-566.
- Ang J.S., Cole R.A., Lin J.W. (2000), “Agency costs and ownership structure.”
Journal of
- Ang, J. S., Chua, J. H., McConnell, J. J. (1982), "The Administrative Costs of
Corporate Bankruptcy: A Note", The Journal of Finance, Vol. 37 No. 2, pp. 219-226.
- Ang, J., (1992), “On the Theory of Finance for Privately Held Firms”, Journal of
Small Business Finance, Vol. 1 No.3, pp.185–203.
- Barnea, A., Haugen, R. H., Senbet, L. W. (1981), “An Equilibrium Analysis of Debt
Financing Under Costly Tax Arbitrage and Agency Problems”, Journal of Finance,
Vol. 36 No. 3, pp.569–581.
- Barnea, A., Haugen, R.A., Senbet, L.W. (1980), “A Rationale for Debt Maturity and
Call Provision in the Agency Theoretic Framework”. The Journal of Finance, Vol.35
No.5, pp. 1223–34.
- Berger, A.N., Udell, G.F. (1998), “The economics of small business finance: The
roles of private equity and debt markets in the financial growth cycle”. Journal of
Banking and Finance, Vol.22 No.6-8, pp.613–73.
- Berryman, J. (1982), “Small Business Failure and Bankruptcy: A Survey of the
Literature”, European Small Business Journal, Vol. 1 No. 4, pp. 47–59.
- Bolton, J.E. (1971), “Report of Committee of Enquiry on Small Firms”, Bolton
Report, 4811. London: HMSO.
- Bradley, M., Jarrel, G and Kim, E. H. (1984), “On the Existence of an Optimal Capital
Structure: Theory and Evidence”, Journal of Finance. Vol. 39 No. 3, pp. 857–880.
- Bradley, M., Jarrell, G. A., Kim, E. H. (1984), “On the Existence of an Optimal
Capital Structure: Theory and Evidence”, Journal of Finance, Vol. 39 No. 3, pp. 857-
878.
- Bryman, A., Bell, E. (2003), Business Research Methods, New York: Oxford
University Press.
- Buser, S., Hess, P. (1983), “The Marginal Cost of Leverage, the Tax Rate on Equity
and the Relation between Taxable and Tax-Exempt Yields”, Ohio State University
Working Paper.
45
- Carland,J. W., Hoy, F., Boulton, W. R., Carland, J. C. (1984), "Differentiating
Entrepreneurs from Small Business Owners: A Conceptualization", Academy of
Management Review, Vol. 9 No. 3, pp354-359.
- Cassar, G., Holmes, S. (2003), “Capital structure and financing of SMEs: Australian
evidence”. Journal of Accounting and Finance, Vol. 43 No.2, pp. 123–47.
- Chittenden, F., Hall, G, Hutchinson, P. (1996), “Small Firm Growth, Access to Capital
Markets and Financial Structure: Review of Issues and an Empirical Investigation”,
Small Business Economics. Vol. 8 No.1, pp. 59–67.
- Chittenden, F., Poutziouris, P., Watt, T. (1996), “Taxing Exapansion: A Model for
Farier Taxes on Small and Medium-Sized Enterprises”, London: National
Westminster Bank.
- Cosh, A.D., Hughes, A. (1994), “Size, financial structure and profitability: U.K.
companies in the 1980s”. In A. Hughes and D.J. Storey, eds., Finance and the Small
Firm. London: Routledge.
- Cosh, A.D., Hughes, A., Wood. E. (1999), “Innovation in SMEs: Causes and
Consequences for Firm Failure and Acquisition “in Acs, Z., Carlsson,B., and Karlson,
C., (eds) Entrepreneurship, Small and Medium Sized Firms and the Macroeconomy,
Cambridge University Press, Cambridge.
- DeAngelo, H., Masiuls, R.W. (1980), “Optimal Capital Structure under Corporate and
Personal Taxation.” Journal of financial economics, Vol. 8 No. 1, pp.3-29.
- Dollinger, M. (1995), Entrepreneurship: Strategies and Resources. First edition,
Flossmoor IL: Irwin/Austen Press.
- Donckels, R., (2000), Financing growth. Recent development with special reference to
the European Scene. In: Sexton, D., Landström, H (Ed), (2000), The Blackwell
handbook of entrepreneurship, Oxford, Blackwell.
- Driffield N., Mahambare V., Pal S. (2007),” How does ownership structure affect
capital structure and firm value? Recent evidence from East Asia”, The Economics of
Transition, Vol.15 No. 3, pp. 535.
- Eckbo, B.E., Masulis, R.W., Norli, O. (2007), “Security offerings”, in B.E. Eckbo,
(ed.) Handbook of Corporate Finance: Empirical Corporate Finance, Vol. 1. In:
Handbook of Finance Series, Chapter 6.
- Fama, E. F., French, K. R. (2002), “Testing Trade-Off and Pecking Order Predictions
about Dividends and Debt”, The Review of Financial Studies, Vol. 15 No. 1, pp. 1-33.
- Fama, E. F., Jensen, M. C. (1983), “Separation of Ownership and Control”, Journal of
Law and Economics, Vol. 26 No. 2, pp. 301-326.
- Ferri, M. G., Jones, W. H. (1979), “Determinants of Financial Structure: A New
Methodological Approach”, Journal of Finance, Vol. 34 No.3, pp.631–644.
- Frank, M.Z, Goyal, V.K. (2007), “Trade-Off and Pecking Order Theories of Debt,
Handbook of Corporate Finance”, Empirical Corporate Finance, Vol.2 No. 1, pp-82.
- Frank, M. Z., Goyal, V. K. (2003), “Testing the Pecking Order Theory of Capital
Structure”, Journal of Financial Economics”, Vol.67 No.2, pp.217-248.
- Garvey, G.T., Hanka, G. (1999), “Capital structure and corporate control: The effect
of antitakeover statutes on firm leverage”, Journal of Finance, Vol. 54 No. 2, pp. 519-
546.
46
- Gaud, P., Jani, E., Hoesli, M., Bender, A. (2005), “The Capital Structure of Swiss
Companies: an Empirical Analysis Using Dynamic Panel Data”, European Financial
Management, Vol. 11 No. 1, pp. 51-69.
- Geroski, P.A., Pomroy. R. (1990), “Innovation and the Evolution of Market
Structure”, Journal of Industrial Economics, Vol. 38, No.3, pp. 219-314.
- Ghauri, P., Gronhaug, K., (2005), Research Methods in Business Studies.3rd
ed.UK:
Prentice Hall.
- Gomez-Mejia, L.R., Nunez-Nickel, M., Gutierrez, I. (2001). “The role of family ties in
agency contact.” Academy of Management Journal, Vol. 44 No.1, pp. 81-95.
- Graham, J.R. (1999), “Do personal taxes affect corporate financing decisions?”
Journal of Public Economics, Vol. 73 No.2, pp. 147–185.
- Hall, G. C., Hutchinson, P. J., Michaelas, N. (2004), “Determinants of the Capital
Structure of European SMEs, Journal of Business Finance & Accounting, Vol. 31 No.
5-6, pp. 711-728.
- Hall, G.C., Hutchinson, P.J., Michaelas, N. (2004), “Determinants of the capital
structures of European SMEs”. Journal of Business Finance and Accounting, Vol. 31
No. 5-6, pp.711–28.
- Harris, M., Raviv, A. (1991), “The Theory of Capital Structure”, the Journal of
Finance, Vol. 46 No.1, pp.297-355.
- Hausman, J. A., Taylor, W. E. (1981). “Panel Data and Unobservable Individual
Effects”, Econometric a, vol. 49 No. 6, pp. 1377-1398.
- Heshmati, A. (2001), “The dynamics of capital structure: Evidence from Swedish
micro and small firms”. SSE/EFI Working Paper Series in Economics and Finance
No. 440
- Hillier, D., Ross, S., Westerfield, R., Jaffe, J., & Jordan, B. (2010), Corporate
Finance, European Edition. Berkshire: McGraw-Hill/Irwin.
- Holmes, S., Kent, P. (1991), “An Empirical Analysis of the Financial Structure of
Small and Large Australian Manufacturing Enterprises”, Journal of Small Business
Finance, Vol.1 No. 2, pp. 141–54.
- Hsiao, C. (1985), “Benefits and Limitations of Panel Data”, Econometric Reviews,
Vol. 4 No. 1, pp. 121-174.
- Hussain, J., Millman, C., Matlay, H. (2006), S”ME financing in the UK and in China:
a comparative perspective”, Journal of Small Business and Enterprise Development,
Vil.13 No. 4, pp.584-99.
- Jensen, M., Meckling, W. (1976), “Theory of the Firm: Managerial Behavior, Agency
Costs and Ownership Structure”, Journal of Financial Economics, Vol. 3 No.4, pp.
305-360.
- Jensen, M.C. (1986), “Agency Costs of Free Cash Flow, Corporate Finance, and
Takeovers”, The American Economic Review, Vol. 76, No. 2, pp. 323-329.
- Jordan, J., Lowe, J., Taylor, P. (1998), “Strategy and Financial Policy in U.K. Small
Firms”, Journal of Business Finance and Accounting, Vol. 25 No.1, pp. 1–27.
- Keasey, K., Watson, R. (1987), “Non-Financial Symptoms and the Prediction of Small
Company Failure: A Test of Argenti’s Hypothesis”, Journal of Business Finance &
Accounting, Vol.14 No.3.
47
- Kester, W. C. (1986), “Capital and Ownership Structure: A Comparison of United
States and Japanese Manufacturing Corporations”, Financial Management, pp. 5–16.
- Kim, W. S., Sorensen, E. H. (1986), "Evidence on the Impact of the Agency Costs of
Debt on Corporate Debt Policy", Journal of Financial and Quantitative Analysis, Vol.
21 No. 2, pp. 131-144.
- Kraus A., Litzenberger, R. (1973), “A State-Preference Model of Optimal Financial
Leverage.”, Journal of finance, Vol. 28 No.4, pp.911-922.
- Kremp, E., Stöss, E., Gerdesmeier, D. (1999), “Estimation of a Debt Function:
Evidence Form French and German Firm Panel Data”, in Sauvé A, Scheuer M (eds),
Corporate Finance in Germany and France (Frankfurt-am-Main and Paris: Deutsche
Bundesbank and Banque de France.
- Krishnan, V.S., Moyer, R.C. (1996), “Determinants of capital structure: An empirical
analysis of firms in industrialized countries”, Managerial Finance, Vol. 22 No.2,
pp.39-55.
- Lopez-Garcia, J., Sogorb, M. (2008), “Testing trade-off and pecking order theories
financing SMEs”. Small Business Economics, Vol. 31 No. 2, pp.117-136.
- Lowe, J., Tibbits, G. E., McKenna, J. (1991), “Small Firm Growth & Failure: Public
Policy Issues and Practical Problems”, in Renfrew, K. M., McCosker, R. C. (eds.), The
Growing Small Business, Proceedings of Fifth National Small Business Conference,
pp. 175–190.
- Marsh, P. (1982), “The Choice between Equity and Debt: An Empirical Study”,
Journal of Finance. Vol. 37 No. 1, pp. 121–143.
- McConaughy, D. (2000). “Family CEOs vs. nonfamily CEOs in the family controlled
firm: An examination of the level and sensitivity of pay to performance” Family
Business Review, Vol. 13 No. 2, pp. 121–131.
- Michaelas, N., Chittenden, F., Poutziouris, P. (1999), “Financial Policy and Capital
Structure Choice in U.K. SMEs: Empirical Evidence from Company Panel Data”,
Small Business Economics, Vol. 12 No. 2, pp. 113–130.
- Miglo, A. (2010), “The Pecking Order, Trade-off, Signaling, and Market-Timing
Theories of Capital Structure”, University of Bridgeport, School of Business,
Bridgeport.
- Modigliani, F., Miller, M. (1958), “The Cost of Capital, Corporate Finance, and the
Theory of Investment”, American Economic Review, Vol. 48 No. 3, pp. 291–297.
- Modigliani, F., Miller, M. (1963), “Corporate Income Taxes and the Cost of Capital:
A Correction”, the American Economic Review, Vol. 53 No. 3, pp. 433-443.
- Myers, S. C. (1977), “Determinants of Corporate Borrowing”, Journal of Financial
Economics, Vol.5 No.2, pp. 147–175.
- Myers, S. C. (1984), ‘The Capital Structure Puzzle”, Journal of Finance, Vol. 34,
pp.575-592.
- Myers, S. C., Majluf, N. S. (1984), “Corporate Financing and Investment Decisions
When Firms Have Information that Investors Do Not Have”, Journal of Financial
Economics, Vol. 13 No. 2, pp. 187-221.
- Ooi, J. (1999), “The determinant of capital structure: Evidence on UK property
companies”. Journal of Property Investment and Finance, Vol.17 No.5, pp.464–480.
48
- Osteryoung, J., Constand, R. L., Nast, D. (1992), “Financial Ratios in Large Public
and Small Private Firms”, Journal of Small Business Management, Vol. 30 No. 3, pp.
35–46.
- Ozkan, A. (2001), “Determinants of Capital Structure and Adjustment to Long Run
Target: Evidence from UK Company Panel Data”, Journal of Business Finance and
Accounting, Vol.28 No.1-2, pp.175-198.
- Paillaki, M., Dskalakis, N. (2008), “Are the Determinants of Capital Structure Country
or Firm Specific? Evidence from SMEs”, Journal of Small Business Economics,
Vol.33, No.3, pp. 319-333.
- Petersen, M. A., Rajan, R. G. (1994), “The Benefits of Lending Relationships:
Evidence from Small Business Data”, The Journal of Finance, Vol. 49 No.1, pp.3–37.
- Pettit, R., Singer, R. (1985), “Small Business Finance: A Research Agenda”,
Financial Management, Vol.14 No.3, pp.47–60.
- Porter, M.E., Ketles, C.H.M. (2003), UK Competiveness: Moving to the next stage.
Management Research Forum, Summary Report 6. London: Advance institute of
Management Research, London. http://www.aimresearch.org/AIM.
- Porter, T. (2006), “The Significance of Changes in Private-Sector Associational
Activity in Global Finance for the Problem of Inclusion and Exclusion”, in
Mooslechner, Peter, Helene Schuberth, and Beat Weber, eds. The Political Economy
of Financial Market Regulation: The Dynamics of Inclusion and Exclusion (Edward
Elgar: Cheltenham, UK), pp. 89-114.
- Rajan, R. G. and Zingales, L. (1995), “What Do We Know About Capital Structure?
Some Evidence from International Data”, Journal of Finance, Vol. 50 No. 5, pp.
1421-1460.
- Ross, G. C. (1977), “The Determination of Financial Structure: The Incentive
Signalling Approach”, Bell Journal of Economics & Management Science (Spring),
pp. 23–40.
- Ross, S. A., Westerfield, R.W., Jordan, B.D. (2008). Corporate Finance
Fundamentals: Interna-tional Student Edition (8th edition). New York: McGraw-
Hill/Irwin.
- Schulze, W. S., Lubatkin M.H., Dino R.N. (2003), “Exploring the agency
consequences of ownership dispersion among the directors of private family firms”
Academy of Management Journal,Vol.46 No.2, pp. 179-194.
- Shenoy, C., Koch, P.D. (1996), “The Firm’s Leverage-Cash Flow Relationship”,
Journal of Empirical Finance, Vol. 2 No.4, pp.307-331.
- Shyam – Sunder, L., Myers, S. (1999), “Testing Static Trade-Off against Pecking
Order Models of Capital Structure”, Journal of financial economics, Vol.51 No.2,
pp.219-44.
- Singh, R.K., Suresh, K., Garg, S., Deshmukh, G. (2010), “The Competitiveness of
Smes in A Globalized Economy; Observations from China and India”, Management
Research Review, Vol. 33 No.1, pp.54-65.
- Singh, A. (1995), “Corporate Financial Patterns in Industrializing Economies: A
Comparative Study”. IFC Technical Paper No.2. International Finance Corporation,
Washington, D.C.
49
- Singh, A., Hamid, J. (1992), “Corporate Financial Structures in Developing
Countries”, IFC Technical Paper No. 1. International Finance Corporation,
Washington, D.C
- Sogorb Mira, F. (2005), “How SME uniqueness affects capital structure: Evidence
from a 1994–1998 Spanish data panel”. Small Business Economics, VOl.25 No.5,
pp.447–57.
- Sogorb-Mira, F., López-Gracia, J. (2003), “Pecking Order versus Trade-Off: An
Empirical Approach to the Small and Medium Enterprise Capital Structure”, Working
Paper.
- Stiglitz, J. E., Weiss, A. (1981), “Credit Rationing in Markets with Imperfect
Information”, American Economic Review, Vol. 71 No. 3, pp. 393–410.
- Storey, D., Watson, A., Wynarczyk, P. (1988), “Fast Growth Small Businesses: A
Study of 40 Small Firms in North East England”, Research Paper No. 67, London
Department of Employment.
- Strauss, A., Corbin, J. (1990), Basics of qualitative research: Grounded theory
procedures and techniques. Newbury Park, CA: Sage Publications, Inc.
- Fraser, S. (2004), Finance for Small and Medium-Sized Enterprises, A Report on the
2004 UK Survey of SME Finances, Centre for Small and Medium-Sized Enterprises
Warwick Business School
- Stulz, R. (1990), “Managerial Discretion Optimal Financing Policies”, Journal of
Financial economics, Vol. 26 No.1, pp.3-27.
- Titman, S., Wessels, R. (1988), “The Determinants of Capital Structure Choice”,
Journal of Finance. Vol. 43 No. 1, pp. 1–19.
- Tong, G., Green, J. (2005), “Pecking Order or Trade – Off Hypothesis? Evidence on
the Capital Structure of Chinese Companies”, Appl. Econ., Vol.37 No. 19, pp. 79-89.
- Van der Wijst, N., Thurik, R. (1993), “Determinants of Small Firm Debt Ratios: An
Analysis of Retail Panel Data”, Small Business Economics. Vol. 5 No.1, pp. 55–65.
- Wald, J.K. (1999), “How firm characteristics affect capital structure: An international
comparison”. Journal of Financial Research, Vol. 22 No.2, pp.161–87.
- Warner, J.B. (1977), “Bankruptcy Costs: Some Evidence”, The Journal of Finance,
Vol. 32 No. 2, pp. 337-347.
- Wedig, G., Sloan, F.A., Assan, M., Morrisey, M.A. (1988), “Capital structure,
ownership, and capital payment policy: The case of hospitals”. The Journal of
Finance, Vol. 43 No.1, pp.21–40.
- Wilson, R. (1979), “Auctions of Shares”, The Quarterly Journal of Economics, Vol.93
No.4, pp.675-89.
- Wright, M., Westhead, P., Ucbasaran, D. (2007), “Internationalization of SMEs and
international entrepreneurship: A critique and policy implications”. Regional Studies,
Vol.41 No. 7, pp. 1013-1030.
- Yin, R. (2003) Case study research: Design and methods. California: Newbury Park;
2003.
- Ghauri, P. and Gronhaug , K. (2005), Research Methods in Business Studies.
Prentice Hall.

50
.