capital markets day 2020 - phoenix group
TRANSCRIPT

1
Capital Markets Day 2020 Thursday 3 December 2020

2
Agenda: Phoenix Group Capital Markets Day 2020
Introduction Nicholas Lyons - Chairman
Strategy Andy Briggs - Group Chief Executive Officer
Financial framework Rakesh Thakrar - Group Chief Financial Officer
Sustainability Claire Hawkins - Director of Corporate Affairs & Investor Relations
Heritage business Andy Moss - Heritage Chief Executive Officer
Open business Andy Curran - Chief Executive Officer, Savings & Retirement UK & Europe
Asset Management Mike Eakins - Chief Investment Officer
Summary Andy Briggs - Group Chief Executive Officer
Q&A Panel 3
2
1 Overview
Deep dive
Wrap up

3
Phoenix is the UK’s largest long-term savings and retirement business
HERITAGE
is the bedrock of our
business and we are
the market leader
OPEN
has strong foundations
and unique advantages
from operating
alongside Heritage
M&A & INTEGRATION
is a differentiated capability underpinned by our
specialist skills and scalable operating model
HELPING PEOPLE SECURE
A LIFE OF POSSIBILITIES
CASH
Dependable long-term cash generation
supports dividend
RESILIENCE
Our risk management framework delivers
resilience
GROWTH
Capital allocation framework supports our
growth aspirations
We have a clear strategy… …which delivers on our financial framework

4
Macro trends are driving profound change and growth in the UK long-term savings
market
People wanting to make a
difference and reduce
carbon impact
Driven by COVID-19 and
Brexit
DC scheme membership 8x
DB
The new “norm” for interaction
% of population >65
Growth in auto-
enrolment
Sustainability
Responsibility shift to
the individual
Financial uncertainty Digitisation
Ageing population
£8bn
£24bn
2012 2019
Per annum flows into
workplace schemes tripled
since 2012
18% 24%
2018 2043
14.6m
1.9m
Defined Contribution Defined Benefit

5
Customer
life stage:
Wealt
h
Early Mid Later
Managing transition to retirement
& protecting family / lifestyle
Saving for retirement &
protecting family / lifestyle
Securing
retirement income
Customer needs:
• Workplace pensions
• Consolidation
• Preparation for
retirement
Guidance required:
• Wealth management
and inheritance
planning
Customer needs:
• Retirement income
and equity release
• Social care
Guidance required:
• Wealth
decumulation and
long-term planning
Customer needs:
• Workplace
pensions
• Protection
Guidance required:
• Wealth
accumulation
Customers’ needs change as they move through the stages of the life savings
cycle

6
Customers Customer obsessed,
focused on outcomes
that matter to them
Helping people secure
a life of possibilities
Investors Allocate resources to the
most attractive opportunities,
where we have competitive
advantage, with clear
performance hurdles
Colleagues The best talent, with
differentiated capability, diverse
and highly engaged
Phoenix has a clear role to play in society - Helping people secure a life of
possibilities

7
Phoenix will be a leader in sustainability, making this integral to our purpose and
strategy
Our sustainability strategy…
Focuses on supporting our
circa 14 million customers and
investing our £323 billion of
AUA in a sustainable future
Will be fully embedded into our
core business activities and
integral to how we interact with
our stakeholders
Delivering for our
Customers
Fostering
Responsible Investment
Reducing our Environmental impact
Investing in our People and Culture
Supporting our Communities
Working ethically with our Suppliers
Governance and risk management
Is underpinned by
governance and risk
management
Our operations will be net-zero carbon by 2025, and our investment portfolio by 2050

8
(1) £1.6 trillion of Defined Benefits AUA has been excluded from long-term Savings and Retirement sector AUA
The UK long-term savings and retirement market is large, at £1.8 trillion, and
growing at 7% per annum
INDIVIDUAL PENSIONS & DRAWDOWN
AUA: £350bn
Wealt
h
PROTECTION
In-force premiums: c.£8bn
WORKPLACE SAVINGS
AUA: £400bn
ANNUITIES & ERM
AUA: £420bn
DEFINED BENEFITS(1)
AUA: £1.6tn
Early Mid
Saving for retirement &
protecting family / lifestyle
Managing transition to retirement &
protecting family / lifestyle
Later
HERITAGE
AUA: £600bn
Securing retirement
income

9
Wealt
h
SUNLIFE
In-force premiums: £225m
3% market share
WORKPLACE
AUA: £41bn
11% market share
DEFINED BENEFITS
RETIREMENT SOLUTIONS
AUA: £38bn
9% market share (BPA & Annuities)
CUSTOMER SAVINGS & INVESTMENTS
AUA: £55bn
16% market share
HERITAGE
AUA: £162bn
Phoenix has a 17% share of the total market, and strong positions in both Heritage
and Open product markets
Early Mid Later
Saving for retirement &
protecting family / lifestyle
Managing transition to retirement &
protecting family / lifestyle
Securing retirement
income

10
Strong AE
Workplace
growth
Driven by auto-
enrolment, the
ageing population
and the move from
defined benefits
Insurers are
consolidating
To release trapped
capital and avoid
cost inefficiencies
caused by legacy
systems
Corporates are
de-risking
Offloading of DB
schemes to focus
on core business
Individuals are
retiring
Customers seek
guidance to
consolidate and
journey to and
through retirement
Wealt
h
SUNLIFE
In-force premiums £225m
WORKPLACE
AUA: £41bn
DEFINED BENEFITS
Early Mid
Saving for retirement &
protecting family / lifestyle
Managing transition to retirement &
protecting family / lifestyle
Securing retirement
income
Later
£440bn
RETIREMENT SOLUTIONS
AUA: £38bn
HERITAGE
AUA: £162bn
CUSTOMER SAVINGS & INVESTMENTS
AUA: £55bn
£40bn
p.a.
£40bn
p.a.
£30bn
p.a.
The major market trends offer significant growth opportunities

11
Bedrock of our
business
HERITAGE
Market leader
Unique advantages from
operating alongside
Heritage
OPEN
Strong foundation
M&A &
INTEGRATION
Differentiated
capabilities
Market leader
…our strategy delivers cash, resilience and growth.
Acquire customers and grow our in-
force business by leveraging the
industry drivers of change
Customer acquisition
By engaging with our customers and
meeting their broader needs, we will
retain our customers and they will
consolidate towards us as they
journey to and through retirement
Deepen customer relationships
We manage our in force business to
deliver resilient cash generation and
management actions, including cost
and capital synergies
Optimise in-force business
Phoenix has a clear strategy that leverages our leading share of in-force, and the
major market trends

12
at 30 September 2020
Phoenix is the market leader in managing Heritage businesses
Competitive advantages
Strategic priorities
Strategy
Deliver customer outcomes and
manage in-force business for
resilience
Improve customer outcomes
Manage capital through approach to
risk management
Deliver value accretive management
actions
Integrate acquisitions to deliver cost
and capital synergies
Proven track record of improving customer
outcomes and excellent customer satisfaction
Scale as the UK’s largest long-term savings
business
Risk management framework delivers
resilience
Unique ability to deliver management actions
Proven track record of delivering cost and
capital synergies through integration
Optimised and scalable operating model
36%
60%
4%
With-profits
Protection & Shareholder
Unit linked
£162bn
Heritage segment by AUA

13
Phoenix’s Open businesses have strong foundations and are central to our
purpose of helping people secure a life of possibilities
Cost efficiency driven by move to a single
administration platform
Capital efficiency driven by diversification with
Heritage business
Significant share across a range of Open
business markets
Large customer base with circa 14 million
customers
Long-term commitment to the market
underpinned by Group’s strength and resilience
Competitive advantages Open segment by AUA
Strategic priorities
To help customers to journey to and
through retirement by providing long-
term solutions to their savings needs
Strategy
Workplace: Accelerate investment
in proposition and optimise shift from
restructure of market
CS&I: Deepen understanding of
customer needs and innovate
solutions
BPA: Improve capital efficiency and
grow market share
at 30 September 2020
25%
34%
24%
17%
0%
Customer Savings & Investments ("CS&I")
Workplace
SunLife
Retirement Solutions
Europe
£161bn

14
Phoenix has an excellent track record in M&A and integration
Our distinctive capabilities
Deal certainty through strong regulatory
relationships, Part VII capability and low cost of
capital funding
We have specialist skills including migrations
and management actions
Our broad range of existing business enables
greater synergies
Scalable operating model with modern, cost
efficient technology
Our recent transaction history
Target Delivered Cash
generation
ReAssure
Group
2020
£800m
total
synergies
£227m
by HY20 £7.0bn £3.2bn
Price paid
Standard Life
Assurance
2018
£1,220m
total
synergies
£946m
by HY20 £5.5bn £2.9bn
Abbey Life
2016
£500m cash
in 5 years £686m cash
in 2 years £1.6bn £0.9bn
£250m cash
in 6 months
£282m cash
in 5 months £0.5bn £0.4bn
AXA Wealth
2016

15
Our clear M&A strategy offers further growth potential
£440bn £190bn
UK
Germany & Ireland
£630bn
Heritage market opportunity by
geographies
UK Heritage market opportunity
by target size Priorities
Primary focus on UK
£440 billion opportunity...
... with European operations
providing optionality
Geography
Business mix
#1
Primary focus on Heritage
books… #1
… but option to buy Open
businesses with
complementary capabilities
40%
49%
Split by target size
£440bn
UK market
11%
100%
Targets > £50bn
Targets £10-£50bn
Targets < £10bn
16
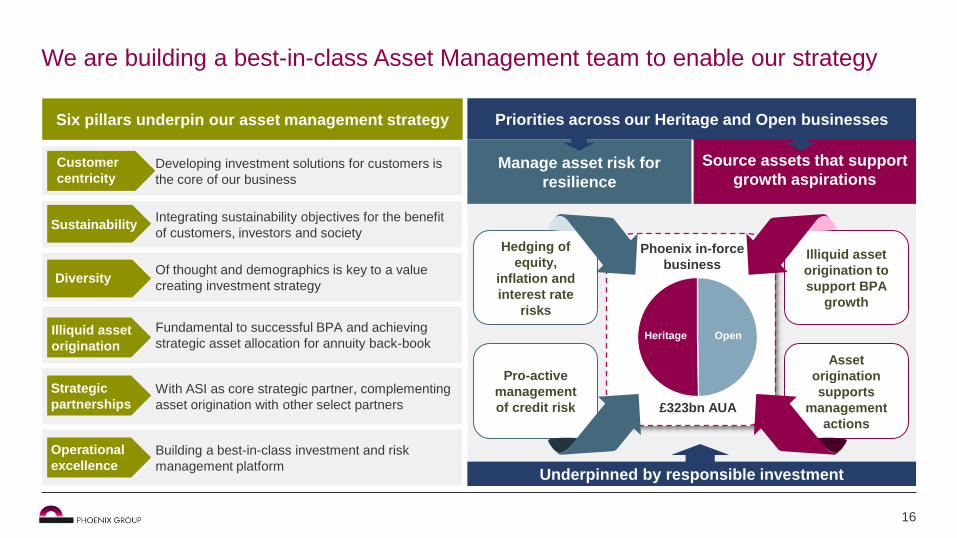
We are building a best-in-class Asset Management team to enable our strategy 0
1
Six pillars underpin our asset management strategy
Of thought and demographics is key to a value
creating investment strategy Diversity
Fundamental to successful BPA and achieving
strategic asset allocation for annuity back-book Illiquid asset
origination
With ASI as core strategic partner, complementing
asset origination with other select partners
Strategic
partnerships
Building a best-in-class investment and risk
management platform
Operational
excellence
Developing investment solutions for customers is
the core of our business
Customer
centricity
Integrating sustainability objectives for the benefit
of customers, investors and society Sustainability
Source assets that support
growth aspirations
Priorities across our Heritage and Open businesses
Manage asset risk for
resilience
Heritage
£323bn AUA
Phoenix in-force
business
Open
Hedging of
equity,
inflation and
interest rate
risks
Illiquid asset
origination to
support BPA
growth
Asset
origination
supports
management
actions
Pro-active
management
of credit risk
Underpinned by responsible investment
Open Heritage

17
10 year track record of meeting or exceeding all publicly stated targets
“Cash is King” at Phoenix and we deliver dependable cash generation year after
year
2020 2010-2019 2021 2022 2023 2024+
£6.7bn
£1.7bn
£13.1bn
£1.7 billion in 2020 vs
£1.5-1.6bn 1-year target
Target cash generation Historic cash generation Illustrative future cash generation Not to scale
£707m £817m
2014 2015 2010 2011 2012 2017 2013 2016
£690m
2018
£664m
2019
£734m £810m
£957m
£225m
£486m
£653m
Ignis sale proceeds Organic cash generation
Management actions Target
£5.9 billion 4-year guidance
£19.0 billion over life of business
Excess cash will be reinvested into value accretive growth

18
Phoenix manages its business for resilience and is materially less sensitive to risk
events than peers
Pro-forma HY20 Phoenix Shareholder Capital Coverage Ratio (SCCR) sensitivities relative to Life peers
% change in SCCR
-40%
-30%
-20%
-10%
0%
10%
20%
30%
40%
50%
Phoenix Peer A Peer B Peer D Peer C Peer G Peer E Peer F
Interest Rates +100bps Interest Rates -100bps Equity Market +20% Credit Spread +100 bps Equity Market -20%
Europe UK
• SCCR:150%
• Target range:
140-180%
Resilience brings certainty to our stable and sustainable dividend

19
Growth from Open brings long-term sustainability to cash generation and dividend
Manage our in-force business for cash and resilience
Growth of our Open business will offset the run-off of our in-
force business
Accelerate and increase total cashflows
Undertake value accretive M&A, accessing synergies through
integration
Time
M&A
Management Actions
Open
Heritage
Cash
ge
ne
ratio
n
Open growth more than offsetting Heritage run off is the trigger to consider dividend growth

20
Phoenix has delivered a dependable and growing dividend, and our resilience has
dramatically outperformed through the pandemic
90
100
110
120
130
140
2015 2016 2017 2018 2019 2020
FTSE 100 Phoenix
Phoenix vs FTSE 100 historic dividend growth
% Date FTSE ranking by
dividend size
Phoenix total
dividend
2020e # 24 £475m
2019 # 50 £338m
2018 # 54 £262m
2017 # 58 £193m
2016 # 69 £126m
2015 # 68 £120m Source: Factset

21
Phoenix is a sustainable and growing business, helping people secure a life of
possibilities
Phoenix’s strategy delivers unique advantages… … and the whole is greater than the sum of the parts
Our unique risk management framework
delivers resilience across all of our in-
force business
We deliver high levels of dependable
cash generation which supports our
dividend over the long-term
We generate surplus capital with excess
cash to invest in growth options which are
aligned to the industry drivers of change
Optimised operating model delivers superior
customer experience and market leading
cost efficiency across both Heritage and
Open
Diversified business drives capital
efficiency across both Heritage and Open
Scale as the UK’s largest long-term savings
and retirement provider with circa 14 million
customers
HERITAGE OPEN
M&A & INTEGRATION

22
Agenda: Phoenix Group Capital Markets Day 2020
Introduction Nicholas Lyons - Chairman
Strategy Andy Briggs - Group Chief Executive Officer
Financial framework Rakesh Thakrar - Group Chief Financial Officer
Sustainability Claire Hawkins - Director of Corporate Affairs & Investor Relations
Heritage business Andy Moss - Heritage Chief Executive Officer
Open business Andy Curran - Chief Executive Officer, Savings & Retirement UK & Europe
Asset Management Mike Eakins - Chief Investment Officer
Summary Andy Briggs - Group Chief Executive Officer
Q&A Panel 3
2
1 Overview
Deep dive
Wrap up

23
Phoenix continues to deliver in uncertain times
£5.0
billion
159% £472
million
Resilience Cash Growth
£1,713m
2020 Target range
£1,500-1,600m
£1,713
million Cash generation
See Appendix I for footnotes
PGH Solvency II
surplus(1)
PGH Shareholder
Capital Coverage
Ratio(1,2)
Incremental long-term cash
generation from new business
£300m
£472m
£94m £42m
£36m
Q320
Total
Other BPA Workplace CS&I
£4.4bn £4.4bn £5.0bn
HY20
pro-forma
FY19
pro-forma
Q320
150% 152% 159%
(3) (4)

24
And our capital position remains strong and resilient
Change in PGH Solvency II surplus
152% 9% 8% (3)% (7)% 3% (4)% 1%
£(0.2)bn
Financing
costs &
pension
contributions
Management
actions
£0.5bn
Surplus
emerging &
release of
capital
requirements
£0.2bn
Pro-forma
Group
surplus at
FY19
New
business
strain
incl. BPA
Economics Debt
issuance
Assumption
changes
Group
surplus
at Q320
£(0.1)bn
£4.4bn £(0.5)bn
£0.1bn
£0.6bn
£5.0bn
159% L&G Part VII transfer
Change in longevity assumptions
Further equity hedging and synergies
Accrual of 2020 final dividend
Securitisation of ERM portfolio
Further credit trades and matching
adjustment approval
Included in Q320
Expected in Q420
(3) (5)
See Appendix I for footnotes

25
Stable & sustainable
dividend
Dividend growth
GROWTH
Time
M&A
Management Actions
Open
Heritage
Cash
ge
ne
ratio
n
Phoenix has a clear financial framework supporting its strategy
RESILIENCE CASH
Risk mgt
framework
Capital
£19 bn
£5.9 bn
2021
£1.7bn
2024+ 2020 2023 2022

26
Cash generation from in-force business
Chart not to scale
Phoenix delivers predictable long-term cash generation
2024+ 2020 2023 2021 2022
£1.7bn
£1.5–1.6 billion
1-year target
£5.9 billion 4-year guidance
£19.0 billion guidance over life of business
• New BPA;
• Other new business;
• Future M&A; and
• Management actions
• after 2023
EXCLUDES
Resilience Growth Cash

27
Composition of £19 billion cash generation
Our £19 billion of in-force cash generation has three main sources
Organic cash
generation
• Cash generated from in-force run off of
£800 million per annum in 2020
• Reducing typically by 6% per annum
• c. £250 million per annum kicker from
TMTP run off from 2032
• Includes benefit of vesting annuities
Management
actions
• £19 billion only includes management
actions for 2020-2023
• Management actions have historically
been c. 1/3rd of annual cash generation
• £2.5 billion management actions over
last 10 years
Solvency II
Retained
surplus
• Retained surplus from operating entities
will be released over time
• Enhances dependability of short term
cash generation
£14.4bn
£19.0bn
£2.0bn
£2.6bn
Retained
surplus
Managment
actions 2020-2023
Organic cash
generation
Total
Resilience Growth Cash

28
Our sources of cash exceed our total uses, with £1.8 billion additional liquidity and
optionality over the next 4 years
Illustrative 2020-2023 sources and uses of cash
£0.8bn
£1.4bn
£1.9bn
£1.8bn
£5.9bn cash generation Sources
Uses
Operating costs
and interest(6)
Dividend(7)
Debt maturities
and call dates
Excess of
sources over
uses
£5.9 billion of cash generation from in-
force business of Combined Group
Stable and sustainable dividend
£0.8 billion of debt instruments have
maturity and call dates in the period
£1.8 billion of surplus cash
generation available for growth OR
special returns to shareholders
Includes head office costs, debt
interest and integration costs
Resilience Growth Cash
See Appendix I for footnotes

29
£8 billion supports a
stable and sustainable
dividend till 2040...
...but we can enhance
dividend sustainability
and / or increase returns
to shareholders through:
Open new business
M&A
Management actions beyond
2023
Phoenix’s resilient in-force cash generation supports the dividend for many years
2024+ in-force
cash generation
Debt principal Interest Illustrative cash
generation
for dividends, expenses
and growth
£13.1bn £(4.2)bn
£8.0bn
2024+ cash generation from in-force business
£(0.9)bn
Resilience Growth Cash

30
Increases as in-force cash generation is
remitted
Total cash available within the Group
Total debt outstanding at the balance
sheet date
Transition costs to deliver integration of
SLAL and ReAssure
We are introducing a new metric – long-term free cash
Resilience Growth Cash
31 Dec 2019 pro-forma
Decreases as cash is remitted to
HoldCo Long-term in-force cash generation £19.0bn
Closing HoldCo cash £0.3bn
Long-term Group cash £19.1bn
Shareholder debt £(5.0)bn
Total cash available for operating costs,
interest, growth and shareholder returns Long-term free cash £14.1bn
M&A and transition costs £(0.2)bn

31
Our risk management framework delivers resilience
Disciplined
balance sheet
management
Liquidity
Capital
Leverage
25-30%
target
leverage
ratio
1 in 200
liquidity
policy
140-180% target
solvency ratio
• Supports investment grade
rating from Fitch
• Acceptable to be above 30%
for a short period
Leverage
• Manage risk in accordance
with our risk appetite
• Flexibility to move within
target range for growth
opportunities
• Above the target range we
will consider a return of
capital
Capital
• Surplus liquidity for
dividends and growth
• Draw-down on £1.25 billion
revolving credit facility
integral to policy compliance
Liquidity
Resilience Growth Cash

32
We manage risk in accordance with our risk appetite
22%
5%
7%
19% 5%
19%
6%
11%
3%
3%
Interest rates
Longevity
Equity
Credit
Other non-market risks Property
Persistency
Operational
Currency
Other market risks
Estimated Q320 SCR by risk type Risk Approach to risk management
Longevity risk • Reinsure circa 50% - 60% of longevity risk with
external counterparties
Equity Risk • Hedge 80-90% of shareholder exposure to
equity risk through futures and options
Interest Rate Risk • Manage exposure to protect SII surplus by use
of swaps and swaptions
• Active management during volatile periods
Credit Risk • A rewarded risk that we manage through
dynamic portfolio management and a high
quality and diversified portfolio with BBB<20%
Resilience Growth Cash

33
Phoenix is more resilient to risks than peers
Phoenix Peer A Peer B Peer F Peer C Peer G Peer E Peer D
Pro-forma HY20 Phoenix Shareholder Capital Coverage Ratio (SCCR) sensitivities relative to Life peers(8)
Europe UK
% point change in SCCR
0%
-40%
20%
-20%
40%
Credit Spread +100 bps Equity Market -20% Equity Market +20% Interest Rates -100bps Interest Rates +100bps
Resilience Growth Cash
See Appendix I for footnotes

34
We fund M&A efficiently to ensure we do not over capitalise transactions
SC
CR
Ta
rge
t R
an
ge
SCCR normally
reduces at
completion as we
manage funding
mix and utilise
own resources
SCCR increases
as organic
surplus and
synergies
emerge from
integration
activities
Resilience Growth Cash
Shareholder Capital Coverage Ratio
Abbey Life
acquisition
(Dec 16)
Standard Life
acquisition
(Aug 18)
ReAssure
acquisition
(Jul 20)
130%
120%
160%
150%
140%
170%
180%
HY18 FY19 FY16 HY17 FY17 FY18 HY19 HY20 Q120 HY20
pro-forma
Q320

35
And we also utilise the full target leverage range
Fitch
Ta
rge
t R
an
ge
Leverage
increases at
completion as we
use debt to fund
the deal
Leverage reduces
after each
acquisition as
synergies emerge
and debt is repaid
Resilience Growth Cash
Fitch leverage
Abbey Life
acquisition
(Dec 16)
Standard Life
acquisition
(Aug 18)
ReAssure
acquisition
(Jul 20)
20%
22%
24%
28%
26%
30%
HY19 FY16 HY17 FY17 HY18 FY18 FY19 Q120 HY20 HY20
pro-forma
Expected
Q320 (9)
See Appendix I for footnotes

36
Return of capital (in the absence of growth
options)
Growth through
M&A or BPA
We have a rigorous Capital Allocation Framework for surplus capital
Resilience Growth Cash
Strategic fit
Supports growth aspirations in
either the Heritage or Open
business
Value accretive IRR > risk adjusted WACC
Long-term cash generation
Supports the dividend Timing of cash flows supports dividend payment profile
Maintains investment grade rating Funding mix for M&A will utilise full 25%-30% leverage range to best match cash flow profile
£
Workplace and CS&I are
capital light and therefore not
subject to allocation of capital
Capital Allocation Framework Allocating capital to BPA & M&A
Internal vestings funded
from in-force organic
cash generation
1
2
SURPLUS
CAPITAL

37
Shorter payback
increases IRR and allows
for reinvestment Payback
Transaction must exceed
hurdle rate of return
(WACC + risk adjusted
premium)
IRR Quantum and profile of
long-term cash will drive
proof of the wedge
Long-term
cash
generation
Reducing the capital
strain drives efficiency
Capital
strain
We will allocate £150 million - £200 million of surplus capital to BPA per annum
Success criteria
£116m
£1,446m
£150m
£3,000m
Q320
Capital
strain
Q320
Liabilities
Target
Capital
strain
Target
Liabilities
8%
5%
£116m
£300m
£150m
£600m
Target
Cash
generation
Target
Capital
strain
Q320
Capital
strain
Q320
Cash
generation
2.6x
4x
2 yr
8 yr
6 yr
4 yr
10 yr
2018 2019 2020
YTD
Payback
Resilience Growth Cash

38
We evaluate M&A targets by identifying the total cash generation they deliver and
applying the appropriate funding mix
Incremental cash generation from target
Yr 5 Yr 2 Yr 6 Yr 10 Yr 1 Yr 3 Yr 7 Yr 4 Yr 8 Yr 9
Organic cashflows
Phase 1 synergies
Phase 2 synergies
Phase 3 synergies
Future management actions
Cash g
enera
tio
n e
merg
ence
• Derived from cash flows
emerging from the target
including synergy benefits and
future management actions
IRR and
payback
• Cash flow profile used to confirm
quantum of dividend increase and
/ or duration increase Dividend
• Utilise Solvency II ratio range with
a view of synergies benefit
trajectory Solvency
• Cash flow quantum and timing
determines funding mix and term
that utilises leverage range over
short term
Leverage
Resilience Growth Cash

39
Proving the wedge hypothesis will evidence the sustainability of organic cash
generation
Growth of the open business can offset the run off of
the in-force cash generation and therefore organic
cash generation is sustainable
The
hypothesis
The outcomes
Resilience Growth Cash
Organic offset not
achieved
Organic offset
achieved
Organic offset more
than achieved
Stable and sustainable
dividend payable for
20+ years plus further
upside from M&A
Stable and sustainable
dividend payable in
perpetuity plus further
upside from M&A
Potential for
dividend growth plus
further upside from
M&A
Time
M&A
Open
Heritage
In-f
orc
e c
ash
ge
ne
ratio
n
Management Actions

40
Step 1: Illustrative organic cash generation of £800 million from in-force business
declines as business runs off
Organic cash generation
£800m
£752m
£707m
£664m £625m
£587m £552m
£519m £488m
£458m £431m
2024 2022 2021 2020 2023 2025 2027 2026 2028 2029 2030
Cash generation
£m 2020 2021 2022 2023 2024 2025 2026 2027 2028 2029 2030
LT cash
gen from
new
business
In-force
organic cash
generation 800 752 707 664 625 587 552 519 488 458 431
In-y
ea
r cash g
enera
tion f
rom
Open n
ew
busin
ess 2020
2021
2022
2023
2024
2025
2026
2027
2028
2029
Open
growth
Total 800 752 707 664 625 587 552 519 488 458 431
Resilience Growth Cash
In-force business typically runs off at 6% per annum

41
Step 2: Open new business delivers incremental organic cash generation
Organic cash generation
£800m
2027
£587m
2025 2021 2024 2020 2022 2023 2026 2028
£624m
2029 2030
£800m
£519m
£752m
£706m
£459m
£665m
£552m
£487m
In-force organic cash generation Cash from 2020 new business
Resilience Growth Cash
Cash generation
£m 2020 2021 2022 2023 2024 2025 2026 2027 2028 2029 2030
LT cash
gen from
new
business
In-force
organic cash
generation 800 752 707 664 625 587 552 519 488 458 431
800
In-y
ea
r cash g
enera
tion f
rom
Open n
ew
busin
ess 2020 48 45 42 40 37 35 33 31 29 28
2021
2022
2023
2024
2025
2026
2027
2028
2029
Open
growth 0 48 45 42 40 37 35 33 31 29 28
Total 800 800 752 706 665 624 587 552 519 487 459
New open business also runs off at circa 6% per annum

42
Step 3: Successive years of Open new business replenishes in-force organic cash
generation
Organic cash generation
Delivering £800 million of long-term cash generation per
annum from Open new business will achieve the organic offset
2020 2021 2030 2022
£800m
2023
£800m
2024 2027 2025
£800m
2026 2028 2029
£800m £800m £800m £800m £800m £800m £800m £800m
In-force organic cash generation Open organic cash generation
Resilience Growth Cash
Cash generation
£m 2020 2021 2022 2023 2024 2025 2026 2027 2028 2029 2030
LT cash
gen from
new
business
In-force
organic cash
generation 800 752 707 664 625 587 552 519 488 458 431
800
In-y
ea
r cash g
enera
tion f
rom
Open n
ew
busin
ess 2020 48 45 42 40 37 35 33 31 29 28
800 2021 48 45 42 40 37 35 33 31 29
800 2022 48 45 42 40 37 35 33 31
800 2023 48 45 42 40 37 35 33
800 2024 48 45 42 40 37 35
800 2025 48 45 42 40 37
800 2026 48 45 42 40
800 2027 48 45 42
800 2028 48 45
800 2029 48
Open
growth 0 48 93 136 175 213 248 281 312 342 369
Total 800 800 800 800 800 800 800 800 800 800 800
43
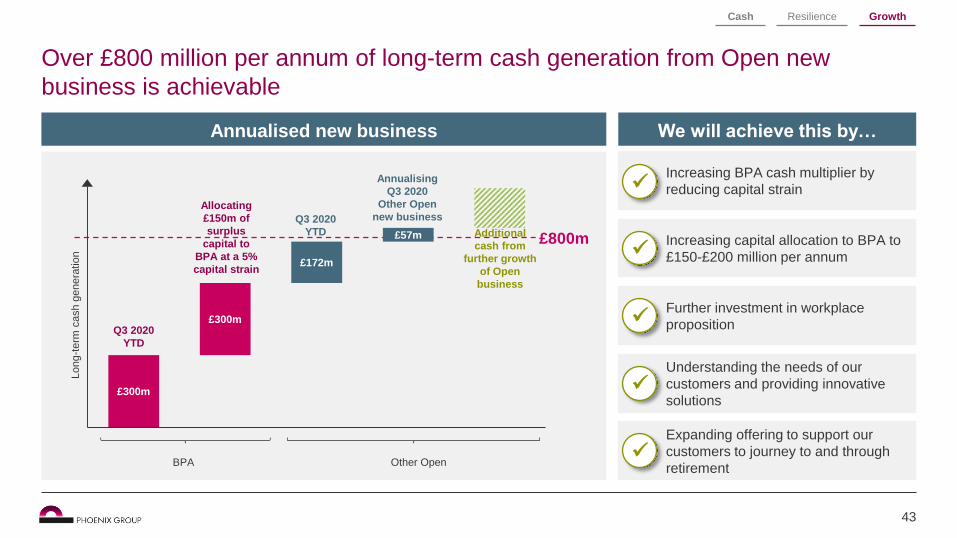
Over £800 million per annum of long-term cash generation from Open new
business is achievable
We will achieve this by…
Increasing capital allocation to BPA to
£150-£200 million per annum
Further investment in workplace
proposition
Expanding offering to support our
customers to journey to and through
retirement
Increasing BPA cash multiplier by
reducing capital strain
Understanding the needs of our
customers and providing innovative
solutions
Resilience Growth Cash
Annualised new business
Long-t
erm
cash g
enera
tio
n
£300m
£300m
£172m
£57m £800m
BPA Other Open
Allocating
£150m of
surplus
capital to
BPA at a 5%
capital strain
Q3 2020
YTD
Q3 2020
YTD
Annualising
Q3 2020
Other Open
new business
Additional
cash from
further growth
of Open
business

44
We will monitor growth by reporting the movement in long-term free cash each
year
A growing level of long-term free cash will support
dividend growth
New business
LTCG
Start of year Additional
mgt actions
Economics &
assumption
changes
Operating
costs &
interest
BPA funding Dividend End of year
Resilience Growth Cash
The in-year increase in life company long-
term cash generation including:
• Long-term cash generation from Open
new business
• Over-delivery of management actions
• Economics, assumption changes and
other operating variances (+ve or –ve)
Sources of cash
Uses of cash
The in-year uses of Holdco cash
including:
• Operating costs and interest
• BPA funding
• Dividend
Sources of cash Uses of cash
45
0
100
200
300
400
500
600
700
800
900
2015 2016 2017 2018 2019 2020 2021
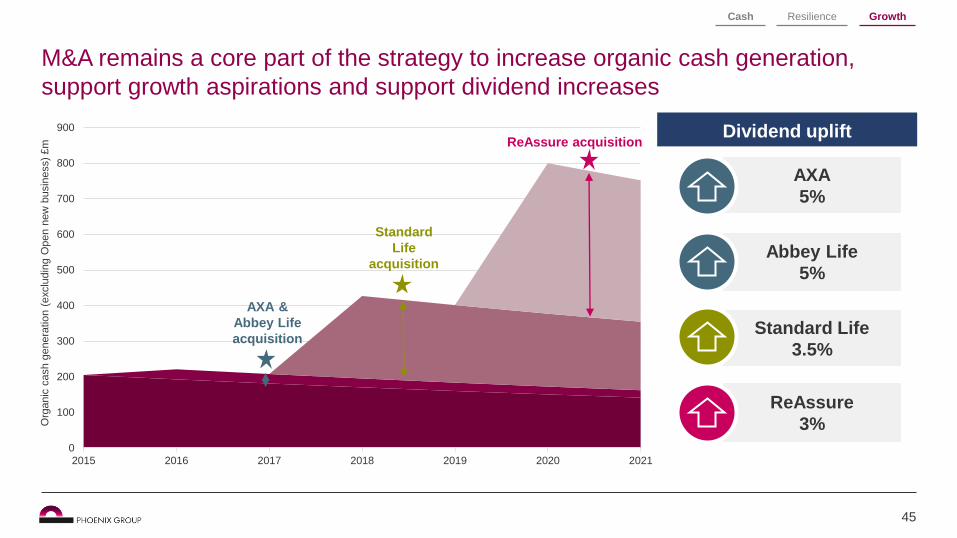
M&A remains a core part of the strategy to increase organic cash generation,
support growth aspirations and support dividend increases
AXA &
Abbey Life
acquisition
Standard
Life
acquisition
ReAssure acquisition Dividend uplift
Abbey Life
5%
Standard Life
3.5%
ReAssure
3%
AXA
5%
Org
anic
cash g
enera
tio
n (
exclu
din
g O
pen n
ew
busin
ess)
£m
Resilience Growth Cash

46
Phoenix’s financial framework is supported by a clear set of reporting metrics
CASH
Annual
cash
generation £1.7 billion
£19 billion In-force
cash
generation
Long-term
free cash
c. £14
billion
RESILIENCE
Solvency II
surplus £5.0 billion
159% SCCR
Fitch
leverage 28%
GROWTH
New
business
cash
generation
£800 million
Movement in long-term free
cash generation
Sources of cash Uses of cash
See Appendix I for footnotes
(8)
(1)
(1) (2)

47
Key messages
Cash, resilience and growth remain at the core of Phoenix’s financial framework
Phoenix’s resilient cash generation supports the dividend for many years
Surplus capital is allocated to BPA and M&A for growth and to enhance shareholder returns
New reporting metrics within Phoenix’s financial framework will allow us to track growth
Proving the wedge alongside growing long-term free cash provide a platform for a growing dividend

48
1) The 30 September 2020 Solvency II capital position is an estimated position and reflects a dynamic recalculation of transitionals for the
Group’s Life companies. Had the dynamic recalculation not been assumed, the Solvency II surplus and the Shareholder Capital Coverage
Ratio would increase by £0.2 billion and 3% respectively.
2) The Shareholder Capital Coverage Ratio excludes Solvency II own funds and Solvency Capital Requirements of unsupported with-profit funds
and unsupported pension schemes.
3) The pro-forma position for the Combined Group assumes the acquisition of ReAssure took place on 31 December 2019. The position reflects
a regulator approved recalculation of transitionals as at 31 December 2019 for all Group companies.
4) The pro-forma position for the Combined Group assumes the acquisition of ReAssure and the novation of equity hedging instruments from the
Group’s holding companies to ReAssure Assurance Limited took place on 30 June 2020. The 30 June 2020 Solvency II capital position is an
estimated position and reflects a dynamic recalculation of transitionals for the Life companies.
5) Includes £136 million strain from Open new business and £4 million strain on internal vestings.
6) Illustrative combined group operating expenses of £45 million p.a. over 2020 to 2023. Phoenix pension scheme contributions estimated in line
with current funding agreements, comprising £70 million in respect of the Pearl Scheme and £39 million in respect of the Abbey Life Scheme.
Assumes integration costs of c. £200 million net of tax, split c. £150 million on Standard Life integration and c. £50 million on Reassure
integration. Includes interest on the combined Group’s listed debt and senior debt, but excludes interest on the PLL Tier 2 bond which is
incurred directly by Phoenix Life Limited.
7) Illustrative dividend allowing for the issue of equity and 3% increase.
8) All sensitivities based on HY20 disclosures. The sensitivities for Phoenix are pro-forma for the acquisition of ReAssure Group plc which
completed on 22 July 2020.
9) Estimate based on internal management information.
Appendix I: Footnotes

49
Agenda: Phoenix Group Capital Markets Day 2020
Introduction Nicholas Lyons - Chairman
Strategy Andy Briggs - Group Chief Executive Officer
Financial framework Rakesh Thakrar - Group Chief Financial Officer
Sustainability Claire Hawkins - Director of Corporate Affairs & Investor Relations
Heritage business Andy Moss - Heritage Chief Executive Officer
Open business Andy Curran - Chief Executive Officer, Savings & Retirement UK & Europe
Asset Management Mike Eakins - Chief Investment Officer
Summary Andy Briggs - Group Chief Executive Officer
Q&A Panel 3
2
1 Overview
Deep dive
Wrap up
50
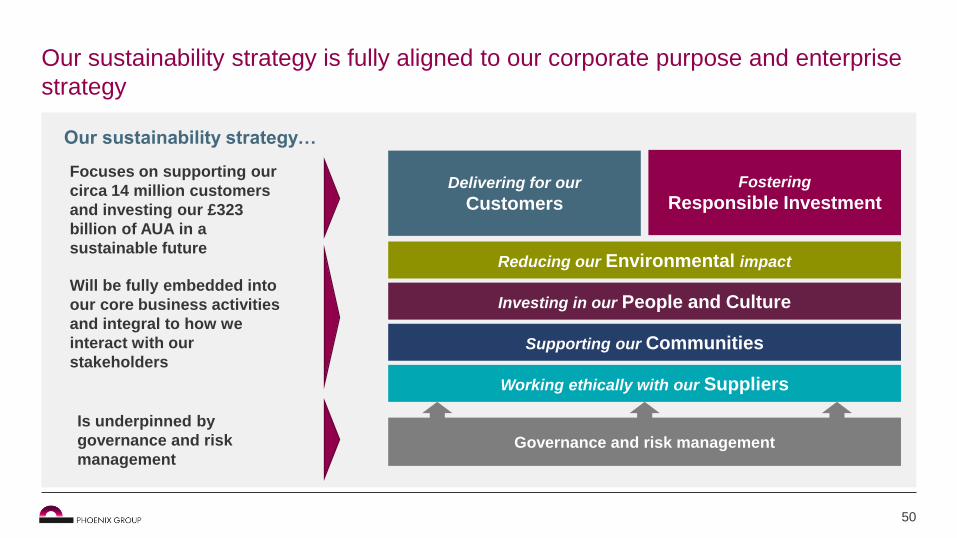
Our sustainability strategy is fully aligned to our corporate purpose and enterprise
strategy
I would like to have the narrative on the
slide – but better link it to the box picture.
The idea is that the first bullet of the strategy
lines up with customers and RI, the second
bullet then lines up with the next 4 boxes
and then you have governance and risk
management at the bottom of the whole
thing.
Our sustainability strategy…
Focuses on supporting our
circa 14 million customers
and investing our £323
billion of AUA in a
sustainable future
Will be fully embedded into
our core business activities
and integral to how we
interact with our
stakeholders
Delivering for our
Customers
Fostering
Responsible Investment
Reducing our Environmental impact
Investing in our People and Culture
Supporting our Communities
Working ethically with our Suppliers
Governance and risk management
Is underpinned by
governance and risk
management

51
Delivered through active
realignment of our investment
portfolios and active engagement
with high carbon emitters
Immediate focus on equities and
liquid credit with further asset
classes to be added in due course
Includes Scope 1 and Scope 2 of
occupied premises and Scope 3
business travel
Science-based emission reduction
target with focus on reducing
emission
Decarbonisation of our portfolio by
setting a science-based target in
line with a 1.5°C Paris Agreement
aligned pathway
Remaining emissions offset using
certified greenhouse gas removal
projects
Phoenix is committed to becoming net-zero carbon by 2050
Operations by 2025
TCFD compliance is an enabler of our net-zero carbon commitment
Investment portfolio by 2050
Aligning to the
1.5° Paris
Agreement target
52
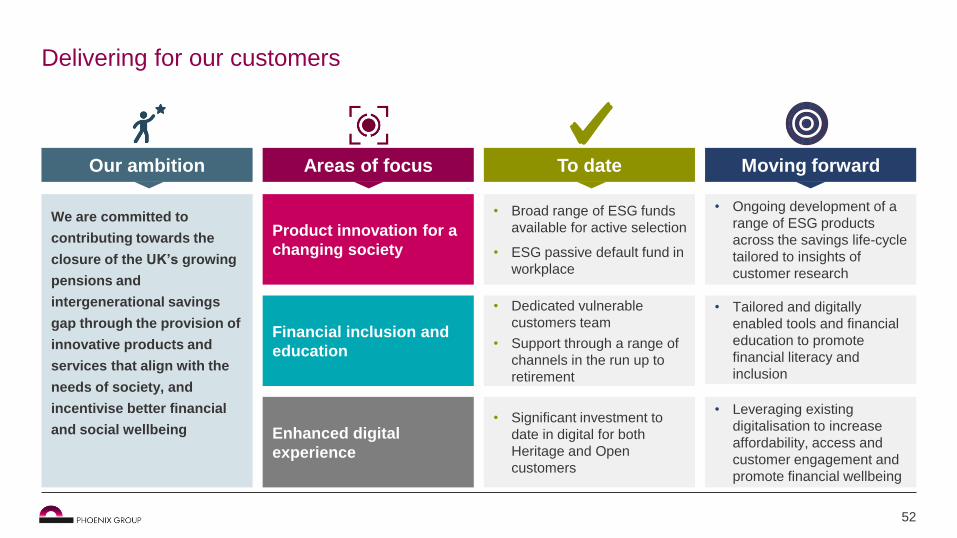
Delivering for our customers
Format is rubbish, but what I am looking for
here is a slide where I can set out our
ambition and then tell the story for each of
the areas of focus that support our ambition
– what have we done and where are we
going
We are committed to
contributing towards the
closure of the UK’s growing
pensions and
intergenerational savings
gap through the provision of
innovative products and
services that align with the
needs of society, and
incentivise better financial
and social wellbeing
Our ambition
• Ongoing development of a
range of ESG products
across the savings life-cycle
tailored to insights of
customer research
• Tailored and digitally
enabled tools and financial
education to promote
financial literacy and
inclusion
• Leveraging existing
digitalisation to increase
affordability, access and
customer engagement and
promote financial wellbeing
Moving forward
Product innovation for a
changing society
Financial inclusion and
education
Enhanced digital
experience
Areas of focus
• Broad range of ESG funds
available for active selection
• ESG passive default fund in
workplace
• Dedicated vulnerable
customers team
• Support through a range of
channels in the run up to
retirement
• Significant investment to
date in digital for both
Heritage and Open
customers
To date

53
Fostering responsible investment
Decarbonising the
existing portfolio
Strategy and
Governance
Stewardship
As an asset owner we act on
behalf of our clients with a
long term view to invest
responsibly. Factoring ESG
subject matters into how we
invest is fundamental to this.
We will play a vital role in
decarbonising the capital
markets and financing the
transition to a sustainable,
low carbon economy
• Net-zero commitment
• 1 of 5 participants in IIGCC pilot
to build and test Paris-aligned
portfolios
• Membership of Climate Action
100+ and Net-Zero Asset
Owners Alliance
• Responsible Investment
Philosophy
• Further enhance policies and
procedures to embed the ESG
risks and opportunities within
our portfolios
• Asset managers act in
accordance with UK
Stewardship Code
• Will only work with managers
who meet our standards and
we will ensure we hold them to
account
Integrated ESG
management
• Due diligence of asset manager
capability
• ESG considerations integrated
within investment process
• Alignment to 2020 stewardship
code
Our ambition Moving forward Areas of focus To date

54
Reducing the environmental impact of our operations
100% renewable energy electricity contracts
across all sites in 2021
Gas offsetting programme for Phoenix UK sites
effective Q12021
100% of waste diverted away from landfill
during 2021
Targeting removal of single use plastics from all
UK site catering facilities in 2021
Baselined 2019 greenhouse gas emissions of
all 22 occupied premises within the Group
Focus is on greenhouse gas emission
reduction
Officially committed to the SBTi Business
Ambition for 1.5°C
Emissions reduction plan in line with SBTi
requirements, with key milestones to be set in
Q12021
We continue to make good progress Our 2025 net-zero carbon target is market leading

55
Investing in our people and our culture
Employee engagement 1
Development and retention 5
Job quality and balance 3
Diversity and inclusion 2
4 Wellbeing and mental health
We are committed
to making Phoenix
the best place our
colleagues have
ever worked and
have five areas of
focus
Colleague
engagement stats(1) 10pt rise to 75%
in colleague engagement
16pt rise to 71% in advocacy of Phoenix as a
place to work
87% of colleagues are committed to
the success of Phoenix
Phoenix
accreditations
and pledges
(1) The colleague engagement stats were the views of c. 3k colleagues and exclude ReAssure

56
Supporting our communitiesand interests
To date Moving forward
Group wide volunteering programme with
engagement at community level
Colleague fundraising and donation
matching schemes
New mental health UK-wide charity
partnership to be chosen by colleagues
Supporting literacy and job seeking
skills through school partnerships
Establish framework for measuring
social value to enable prioritisation and
monitoring of community initiatives
Committed to using Phoenix’s collective
expertise to address pressing societal issues
in the communities in which we are based
Five UK corporate charity partners and three
charities across Europe
Our
communities

57
Working ethically with our supply chain
We will address incidents of abuse of
human rights and workers’ rights
Human Rights &
Modern Slavery
Climate change
and the
environment
We will push for reductions in the
environmental impact of our supply chain
Supply chain management framework Our commitments
Our supply chain management framework takes a multifaceted
approach to assessing and managing sustainability risk which
will be built into our Supplier Management Model
Using this framework, we will work in partnership with our
suppliers in a phased approach, focussing on key issues
associated with:
Health & Safety
We will expect robust health and safety
conditions for all workers in the supply
chain
Manage Evaluate
Implement Select

58
Our strategy is underpinned by governance and risk management
PGH plc Board committees
PGH plc Board
Sustainability Committee
Audit Committee
Risk Committee Remuneration
Committee Nomination Committee
PGH plc Board committees
Role:
To review, challenge, oversee and recommend
for Board approval the Sustainability Strategy
Chair:
Karen Green
Members:
• Mike Tumilty
• Wendy Mayall
• Nicholas Shott
Executive attendees:
• Andy Briggs
• Claire Hawkins
• Sara Thompson
First meeting:
January 2021

59
Our performance ratings are improving, reflecting the progress we have made with
our sustainability commitments
Increased our total score to 45 in November which is above an
industry average of 39
We were ranked 34th in the Responsibility 100 Index, now leading the life sector
In August, we were upgraded to ‘A’ from ‘BBB’
(Scale AAA to CCC)
We have been a proud member of the FTSE4Good Index Series since July 2019
In September our risk rating was 23.3, ranking us 68th out of
267 in the insurance industry
During 2020, the Group has become a formal supporter of and signatory to TCFD

60
Key messages
Sustainability is integral to Phoenix’s purpose of helping people secure a life of possibilities
Our sustainability strategy is focused on delivering for customers and fostering responsible investment
Phoenix is committed to becoming net-zero carbon by 2050
The Group Board has established a “Sustainability Committee” to oversee delivery of the sustainability strategy
Phoenix’s sustainability strategy is aligned to the enterprise strategy and will deliver value to all stakeholders

61
Agenda: Phoenix Group Capital Markets Day 2020
Introduction Nicholas Lyons - Chairman
Strategy Andy Briggs - Group Chief Executive Officer
Financial framework Rakesh Thakrar - Group Chief Financial Officer
Sustainability Claire Hawkins - Director of Corporate Affairs & Investor Relations
Heritage business Andy Moss - Heritage Chief Executive Officer
Open business Andy Curran - Chief Executive Officer, Savings & Retirement UK & Europe
Asset Management Mike Eakins - Chief Investment Officer
Summary Andy Briggs - Group Chief Executive Officer
Q&A Panel 3
2
1 Overview
Deep dive
Wrap up

62
at 30 September 2020
Phoenix is the market leader in managing Heritage businesses
Competitive advantages
Strategic priorities
Strategy
Deliver customer outcomes and
manage in-force business for
resilience
Improve customer outcomes
Manage capital through approach to
risk management
Deliver value accretive management
actions
Integrate acquisitions to deliver cost
and capital synergies
Proven track record of improving customer
outcomes and excellent customer satisfaction
Scale as the UK’s largest long-term savings
business
Risk management framework delivers
resilience
Unique ability to deliver management actions
Proven track record of delivering cost and
capital synergies through integration
Optimised and scalable operating model
36%
60%
4%
With-profits
Protection & Shareholder
Unit linked
£162bn
Heritage segment by AUA

63
Our unique and distinctive Heritage strategy positions us to outperform
CASH RESILIENCE GROWTH
Optimised
Operating
Model
Accounting and
actuarial models
Administration
platform
Investment
strategy
Risk
management
framework
IMPROVED
CUSTOMER
OUTCOMES
CAPITAL
EFFICIENCIES
COST
EFFICIENCIES
DELIVERING FOR
CUSTOMERS
INTEGRATION
MANAGEMENT
ACTIONS

64
Management
actions Integration Customers
Delivering for our customers is central to our sustainability strategy
We have a long track record
of taking actions which
improve customer
outcomes
Our customer teams are
focused on delivering
excellent service to our
Heritage customers
Customers are
increasingly choosing to
interact digitally and we
continue to invest in our
digital capabilities to
enhance digital journeys
Putting customers at the heart of all
that we do
Facilitating ease
of customer
interaction
Consistent
service
delivery
Improving
customer
outcomes

65
We have a strong track record of improving outcomes for our Heritage customers
Taking an active role with
government and industry
influencers on the topics
that matter most to our
customers
Championing
customer concerns
Development of innovative
customer centric
communications to
underpin improved
engagement
Ongoing improvements
in customer
communications
Proactive approach to
remediating inherited legacy
issues
Remediation of legacy
reviews
Repatriated policyholder
estates with c. £13 million of
unclaimed life insurance
policies (to date) through the
proactive tracing of
customers
Proactive tracing for
outstanding claims
Making proactive changes to
fees and reduction in
investment management
fees of £13 million per
annum over 5 years
Strong value for money
framework £
We have prevented over £30
million of potential pension
fraud since the issue 2013
Pension fraud
prevention
Management
actions Integration Customers

66
Our Heritage customers recognise our high quality service as we continue to
support them through COVID-19
Proactive offering of premium flexibility to
support financial hardship
1.2 million customers contacted by letter
encouraging them to move to digital
Annuitants encouraged to accept bank
transfers rather than receive cheque payments
Delivered over 80 online enhancements to
support customers during Covid-19
Customer call centres remained open across
in-house and outsourced partners
92% 93% 93% 94% 90%
Target 2017 2020 2018 2019
Phoenix Group customer satisfaction(1) Response to Covid-19
Covid-19 customer support and help page on
website
Introduction of online financial glossary and
advice on how to protect your online security
Phoenix has
proactively
managed the
numerous
challenges
caused by the
pandemic for
our customers
Management
actions Integration Customers
(1) Customer satisfaction data is Phoenix heritage only

67
Investment in digital is transforming the way we engage with our Heritage
customers
Improved availability & convenience
Expanded online capability
Drive efficiency
Drive engagement
2020 2021
Benefits for customers
and IFAs
Contact channel
optionality – moving
from phone and mail to
digital
24/7 availability
Contact via secure
messaging with ability
to send attachments
Encashment options for
pensions up to £30k
Policy level fund and
benefit details
Deaths notification and
surrender / claim options
Online valuations and
dynamic illustrations
IFA digital options
Increasing functionality
to move more
processes online and
away from reliance on
the postal system
Channel integration &
automated processes
in contact centres
Investment in
education, learning and
engagement on
websites and portals
Enhanced customer
feedback
Covid updates, security
and scam support on
the website
Management
actions Integration Customers

68
Management actions increase or accelerate cashflows
Increase own funds Decrease risk capital
Cost efficiencies
Improvements in outsourcer
cost per policy, internal costs
or investment fees
Transitional benefits
Accessing transitional
measures on acquired
business
Asset liability management
Investment of annuity
backing assets in illiquid
asset classes
Reducing risks
Hedging of equity, currency
and interest rate risk and
reinsurance of longevity risk
Diversification benefit
Accessed by internal
reinsurance and Part VII
transfers
Capital harmonisation
Single internal capital
framework, internal model and
approach to risk management
• Management actions either:
increase own funds and
therefore increase the overall
cash flows from the business, or
decrease risk capital and
therefore accelerate the timing
of cash flows
• They include a wide range of
innovative solutions designed to
deliver additional value to both
shareholders and customers
Management
actions Integration Customers

69
US $ block trade
Exchange of large
blocks of BBB
£GBP assets to A
US$
In 2020 we have continued our track record of delivering management actions
Cash generation from management actions 2020 Solvency II management actions
19%
6%
19%
5%
21%
20%
10%
Other actions
Variety of actions from active
management of the balance
sheet and operational
efficiency
Illiquid asset origination
Sourcing of assets to
deliver closer matching of
cash flows in our annuity
books
£0.6bn
Equity hedge novation
Novation of equity hedge
into ReAssure to reduce
risk capital held
Management
actions Integration Customers
Asset restructuring
ERM SPV restructure & VAT savings
on other portfolio restructuring
ReAssure TMTP synergy
Amendments to the ReAssure
TMTP methodology
Capital and expense savings
arising on transfer of L&G
Mature Savings business to
ReAssure
L&G Part VII
£242m
£2,510m
£359m
£209m
£332m
£180m
£20m
£265m
£380m
£237m
£286m
2012
2010
2017
2011
2013
2014
2015
2016
2018
2019
Total

70
Management action case study #1: Investing in illiquid assets
Q320 Solvency II impact
• £9 billion illiquid asset portfolio
represents 24% of annuity backing
assets, target is 40%
• Present value of liabilities is calculated
using a discount rate derived from the
yield of assets matching the liability
• Illiquid assets are higher yielding than
liquid assets to reflect an illiquidity
premium
• Replacing liquid assets with illiquid
assets therefore reduces the present
value of the liabilities – this is the
matching adjustment benefit
• However, we hold additional risk
capital that will unwind over time
£1.4bn
£0.3bn
£0.1bn
£0.6bn
£0.4bn
Local authority loans
Public investment grade bond
Private placements
Infrastructure debt
ERM
As
se
ts
Su
rplu
s
SC
R
Lia
bilit
ies
-£265m
Higher yield
reduces
liabilities
+£145m
Risk
capital
increases
+£120m
Surplus
emerges
Investing in illiquid assets £1.4 billion asset reallocation
Management
actions Integration Customers

71
• Prior to announcement of Phoenix’s
acquisition, ReAssure was hedging
circa 40% of the equity risk exposure
arising from unit linked ViF
• Phoenix views equity risk as un-
rewarded and hedges 80-90% of
equity risk exposure
• Phoenix therefore placed additional
Group hedges to bring the total ViF
hedge ratio to c. 80%, in line with
Phoenix policy
• At completion, this hedge was passed
down into ReAssure and enabled
equity risk capital to be released
Management action case study #2: Hedging of ReAssure equity risk
Hedging of risk Q320 Solvency II impact ReAssure ViF equity risk
exposure
1.5
0.0
1.0
0.5
80%
hedged
Total exposure RAL -
on
announcement
Group -
on
announcement
RAL -
Sep 20
c. 40%
hedged
40%
hedged
As
se
ts
Su
rplu
s
SC
R
Lia
bilit
ies
Liabilities
unchanged
-£120m
Hedging
reduces
risk
capital
+£120m
Surplus
emerges
(£bn)
Management
actions Integration Customers

72
We have a strong pipeline of management actions and a range of future
management action opportunities
£1.0bn
£2.9bn
£2.0bn
£5.9bn
Organic cash generation
Management actions
Retained surplus
Hedging
Part VII
transfers
Longevity
reinsurance
Credit
management
Operational
efficiencies
Illiquid
assets
origination
Capital
optimisation
Regulatory change
Regime changes bring opportunities to
maximise capital efficiency
Digitalisation
Opportunities to improve customer journeys,
reduce costs and drive efficiency
Future M&A
Opportunities for cost and capital synergies,
leveraging of benefits of scale
Macroeconomics
Evolution of unrewarded risk and opportunity in
emerging private debt markets
Cash generation
target 2020-2023
£2.0 billion delivered over
2020-2023 through a range of actions Future opportunities
Management
actions Integration Customers

73
Phoenix and ReAssure have been leaders in the consolidation market
Nov 16
Consideration:
£375m
Dec 16
Consideration:
£935m
Aug 18
Consideration:
£2,930m
Jan 16
Consideration:
£1,600m
Dec 19
Consideration:
£425m
Dec 17
Consideration:
£650m
Jul 20
Consideration:
£3,200m
Management
actions Integration Customers

74
Our legacy businesses have a consistent approach to integration
CASH RESILIENCE GROWTH
Optimised
Operating
Model
Accounting and
actuarial models
Administration
platform
Investment
strategy
Risk
management
framework
IMPROVED
CUSTOMER
OUTCOMES
CAPITAL
EFFICIENCIES
COST
EFFICIENCIES INTEGRATION
ACTIVITIES
Management
actions Integration Customers

75
Old Mutual Wealth Case Study: £275 million of management actions delivered on
Day 1
Management actions supported OMWLA £290 million cash release on Day 1
Price to own
funds ratio 109%
Price to own
funds ratio 76%
£425m £446m
£21m
Internal
reinsurance &
consolidation
SCR
£244m
Headline price
agreed at FY18
Harmonising
assumptions
Interest from
FY18 to FY19
Surplus
£167m
Cash paid at FY19 OMWLA solo
balance sheet
at FY19
Expense
assumptions &
integration costs
Hedging
SCR
£142m
Surplus
£442m
OMWLA marginal
contibution to
ReAssure Group
at FY19
Increase in Surplus
Decrease in SCR
Increase in Own Funds
Own funds
£411m
Own funds
£584m
Management
actions Integration Customers

76
Managing
scale
Managing
complexity
Managing
uncertainty
L&G Mature Savings Part VII underlies capabilities to deliver complex transactions
Situation
£33 billion of AUM(1)
1.1 million customers(1)
Administered on 5 L&G
retained platforms
Over 60 policy types
High court not a
“rubber stamp”
ReAssure offering
£650 million upfront payment
Reinsurance to Part VII
Policy extraction onto single
Alpha platform
Complex Part VII
approved
Implications
Vendors can release
significant capital quickly
without entity sales
Broad product experience
and material cost synergies
Highly regarded and secure
home for customers
Management
actions Integration Customers
(1) At FY17 per source systems

77
2016
Our three phased integration approach enables overlap of M&A
2019 2020 2021 2018 2022 2023+
Finance & Actuarial
2 SLAL
ReAssure
Customer &
IT
3 ALPHA
Diligenta/
BANCS
Deal completion SLAL Announced
SLAL Completed
ReAssure Announced
ReAssure Completed
Group
Functions
1 Potential for further M&A SLAL
ReAssure
Potential for further
M&A
2017
0.9m Guardian
policies
0.8m L&G policies
0.2m OMW policies
1.2m AXA
policies
1.8m Phoenix Capita policies
4.1m SLAL policies
Potential for further
M&A
Management
actions Integration Customers
Potential for further M&A

78
Key messages
Phoenix is the market leader in managing Heritage businesses
Delivering for customers is central to our strategy and at the heart of all that we do
We have a strong track record of delivering management actions and confidence of ongoing delivery into the future
Phoenix has unique and differentiated capabilities in delivering value through integrations
ReAssure further strengthens our M&A and integration capabilities and brings additional optionality for future transactions

79
Agenda: Phoenix Group Capital Markets Day 2020
Introduction Nicholas Lyons - Chairman
Strategy Andy Briggs - Group Chief Executive Officer
Financial framework Rakesh Thakrar - Group Chief Financial Officer
Sustainability Claire Hawkins - Director of Corporate Affairs & Investor Relations
Heritage business Andy Moss - Heritage Chief Executive Officer
Open business Andy Curran - Chief Executive Officer, Savings & Retirement UK & Europe
Asset Management Mike Eakins - Chief Investment Officer
Summary Andy Briggs - Group Chief Executive Officer
Q&A Panel 3
2
1 Overview
Deep dive
Wrap up

80
Cost efficiency driven by move to a single
administration platform
Capital efficiency driven by diversification with
Heritage business
Significant share across a range of Open
business markets
Large customer base with circa 14 million
customers
Long-term commitment to the market
underpinned by Group’s strength and resilience
Competitive advantages Open segment by AUA
Strategic priorities
To help customers to journey to and
through retirement by providing long-
term solutions to their savings needs
Strategy
Workplace: Accelerate investment
in proposition and optimise shift from
restructure of market
CS&I: Deepen understanding of
customer needs and innovate
solutions
BPA: Improve capital efficiency and
grow market share
at 30 September 2020
£161bn
Phoenix’s Open business is central to our purpose of helping people secure a life
of possibilities
25%
34%
24%
17%
0%
Workplace
Europe
Customer Savings & Investments ("CS&I")
Retirement Solutions
SunLife

81
To prove the Wedge, Open new business must deliver over £800 million of
incremental long-term cash generation per annum
Annualised new business The Wedge
Long-t
erm
cash g
enera
tio
n
Time
M&A
Open
Heritage
Management Actions
Ca
sh
ge
ne
ratio
n
£800m
BPA Other Open
Q3 2020
YTD
Annualising
Q3 2020
Other Open
new business
Additional
cash from
further growth
of Open
business
£300m
£300m
£172m
£57m
Allocating
£150m of
surplus
capital to
BPA at a 5%
capital strain
Q3 2020
YTD

82
Phoenix’s Open business has three core growth drivers
Workplace
Customer
Savings
& Investments
Retirement
solutions
Phoenix’s
Open
business
Phoenix share
of market
flows
c.11%
c.4%
c.5%
Phoenix
share of
market AUA
c.11%
c.16%
c.9%
Phoenix’s strategy
Strategy: To Protect and Grow
Delivered by: Continuing to invest in
strengthening our proposition and digital
platform
Strategy: Engage and Develop
Delivered by: Engaging our c. 14 million
customers to better understand their needs
and provide innovative solutions
Strategy: To Grow and Expand
Delivered by: Improving capital efficiency and
expanding illiquid asset capabilities
£40bn p.a.
£30bn p.a.
£40bn p.a.
Industry drivers of
growth
Strong AE
Workplace
growth
Individuals
are retiring
Corporates
are de-risking
Delivering a similar share of flows, to our share of stocks, will drive significant growth

83
41%
44%
47%
2018 asset pool
9%
44%
15%
2028 asset pool
£389bn
£955bn
+146%
Contract based Trust based Master trust
Industry driver Market shifting to Master Trust
Workplace Retirement
Solutions CS&I
Source: Broadridge
1 Best-in-class proposition
2 Customer service and
engagement
3 Competitive pricing - which
requires cost efficiency
4 Commitment to long-term
nature of market
Phoenix market position
Phoenix share of
market AUA c. 11%
Phoenix share of
market flows c. 11%
Workplace £40bn p.a.
Strong AE Workplace
growth Driven by auto-enrolment,
the ageing population and
the move from defined
benefits to defined
contribution
The workplace market is growing and competitive
Key to winning in this market

84
Phoenix is a top 3 workplace provider and our strategy is to grow and protect
Our Workplace business
Customers
Brand
• 15k active schemes
• 1.9m members of which
1.1m active members
at 30 September 2020
Workplace Retirement
Solutions CS&I
Our Workplace strategy focuses on:
• Continue to make significant investments in our proposition
• Wide range of investment solutions
• Exceptional member, employer and trustee experience
Proposition
• Tata Consultancy Services (“TCS”) partnership will deliver market
leading cost efficiency while maintaining customer service
Cost
efficiency
• Excellent customer service with customer satisfaction at 90% and
call answer rates maintained at 98% throughout COVID-19
• Strong digital proposition with app rating of 4.6 stars
Customer
service
• Evidenced by rapid proposition investment over the last 18 months
• Size and scale provides platform for growth
Commitment
to long-term
market
74%
13%
13%
Contract based Trust based Master trust
£41.0bn

85
We continue to make significant investments in our proposition, driven by
customer insight
Completed enhancements Upcoming enhancements
Refine
investment
pathways
Evolve our guided
investment journeys
to align with the
FCA’s investment
pathways
Workplace
ISA
In collaboration with
TCS we are
developing a salary
deductible Workplace
ISA which we plan to
launch in 2021,
offering the same
investments as
members’ pensions
and at the same price
Further expand the
range of investment
options throughout
2021 with a focus on
ESG
Responsible
investment
options
Enhanced scheme
analytics tool launched
September 2020,
delivered in
partnership with TCS.
This is our first joint
development
Enhanced
client analytics
tool
New, passive ESG
default fund launched
in November 2020
with go-live in mid-
December, and new
self-select ESG
funds launched in
2020
New ESG
funds
Allows Master Trust
members to access
retirement savings
from their Workplace
pension and retain
their scheme discount
across both their
savings and
drawdown pots
In-scheme
drawdown
functionality
Workplace Retirement
Solutions CS&I

86
We are planning to enhance the ESG content of our default
funds. Our new passive default solution is designed to
deliver good member outcomes at retirement, using a blend
of ESG approaches, to:
We are expanding our responsible investment options for
customers who want to better align their investments with
their own beliefs:
And we are expanding our range of ESG investment solutions
Our ESG programme is moving at pace Our new ESG passive default solution
“Go live” mid December 2020 Actively reviewed to meet evolving
needs of members
Workplace Retirement
Solutions CS&I
Exclude companies
identified as having long-term
financially material ESG risks
Target positive ESG outcomes
through portfolio tilting to enhance
performance versus parent indices
Influence positive change
through stewardship expertise
of fund managers
Sustainable Index UK Equity
Sustainable Index World Equity
Climate and Environment
Gender Diversity
Funds launching Q4 2020
UK and Europe Sustainable Equities
Emerging Markets Sustainable & Responsible Investment Equity
Global Responsible Managed
Sustainable Water & Waste
Launching H1 2021
Global Lower Carbon Bonds and Equities
Sustainable Asian Equities
Default
funds
Wider
options

87
Our partnership with TCS will improve efficiency while maintaining customer service
… maintains high customer service
Retained the
existing customer
service team
Hub consists of skilled
experts from Standard Life
Assurance and TCS
Innovation lab
enables clients to
experience future
proposition
enhancements
Delivers more agile and flexible proposition
Enables broader product offering and optionality
Facilitates plug-in partnerships
Further improves digital capabilities
Accelerates speed to market
… and delivers market leading cost efficiency
Workplace Retirement
Solutions CS&I
Migration of customer and IT operating model…

88
Customers need help to journey to and through retirement
Key trends within this market
• Retirement is now seen as a longer, more complex transition versus a single event
• Responsibility for managing retirement income continues to shift to the individual,
resulting in the need for increased engagement
• Striking the balance between advice and value is changing the distribution landscape
• Gap in advice for the growing number approaching retirement with mid-sized pots
• Retirement market getting increasingly competitive with a focus on value for money
resulting in scale becoming increasingly important
• The macroeconomic backdrop with interest rates lower for longer creates uncertainty
Few players are capable of engaging customers and providing holistic
solutions to help consumers secure their income in retirement
Workplace Retirement
Solutions CS&I
Industry driver
Phoenix market position
Phoenix share of
market AUA c. 16%
Phoenix share of
market flows c. 4%
Customer
Savings &
Investments
£30bn p.a.
Individuals are retiring
Customers seek guidance
to consolidate and journey
to and through retirement

89
Brands
Products
By engaging with our customers, we can better understand their needs and help
them secure a life of possibilities
Engage our customers in their holistic savings needs to motivate them to consolidate pension pots with Phoenix
Retain our existing customers when they reach retirement age through a guidance proposition
AUA, at 30 September 2020
Age 50 Age 70 Early Mid Later
Saving for retirement &
protecting family / lifestyle
Managing transition to retirement
& protecting family / lifestyle
Securing
retirement income
Wealt
h
Phoenix manages c. 14
million policies across
the life savings cycle
Our Customer Savings &
Investments business
Workplace Retirement
Solutions CS&I
49%
43%
8%
Wrap SIPP
Retail SIPP
Drawdown products
£54.8bn

90
Our strategy in Customer Savings & Investments is to engage and develop
We will achieve this by focusing on the needs of customers across the stages of engagement
We will therefore seek to progress activity that seeks to improve both lead and lag indicators at each stage of the
conversion funnel.
Awareness of the need
for financial planning
and what it will take to
secure their future
Relevant offers to the
right customers at the
right time
Clarity on the options
and choices they have
Help to validate
thinking
Simple journeys that
make it easy to take
action
Successful engagement
with customers in
understanding their
options
Information, guidance or
access to advice to
support informed and
confident decision making
Solutions that make it
as easy as possible for
customers to act
Customer
needs
Phoenix
provides
Consideration
Support
Transact
Awareness
1. 2. 3. 4.
Workplace Retirement
Solutions CS&I

91
We have made significant digital enhancements across our Workplace and CS&I
propositions
Workplace Customer Savings & Investments
Workplace Retirement
Solutions CS&I
14.6m log-ins
Jan-Oct 20
In-scheme
drawdown
Online drawdown journey for Master
Trust pensions launched in July
New app
features
Able to select retirement date as well
as add, view and edit pension
beneficiaries
Secure
messaging
Implemented priority functionality for
NHS staff secure message queries
New customer
dashboard
investment
hub
Helps customers understand investing
in a pension, fund performance and
their investment options.
Pot
consolidation
81% of pension transfers processed
online this year and SIPP/GSIPP journey
launched in September
Drawdown
£325m moved into drawdown online with
c.21k users of online retirement journey
YTD
Vulnerable
customers
Circumstance tool allows customers to
disclose vulnerability through secure
messaging
Charges
transparency
Customer dashboard allows over 80% of
our pension customers to see charges in
£ and %
Key
enhancem
ents
Key
enhancem
ents
c. 50% of total log-ins now
through mobile app
£0.9bn in new cash online
Jan-Oct 20
£0.4bn online consolidation
Jan-Oct 20
106% increase in secure
messaging
2020 key
stats

92
The BPA market is substantial and growing as corporates continue to de-risk
Room for further growth Key market trends
Increased
volumes
28% CAGR increase in
volumes between 2009 and
2019
Increased no.
buy-outs 40% of deals in 2019 were
buy-outs
Larger
transactions
90% of 2019 total volumes
were deals of £200 million+.
46% were deals of £3
billion+
Alternative
consolidation
options
The emergence of
superfunds
Stock of corporate BPAs as at 31 March 2019
£2.1tn
£1.2tn
DB liabilities %>75% funded (buy-out) liabilities
£1.2(1) trillion
of liabilities
sufficiently
funded for a
buy-in/out
Workplace Retirement
Solutions CS&I
Source: The Purple Book 2019
Source (increased volumes, larger transactions): LCP report 2020
Source (increased buy-outs): Hymans Robertson report 2020
(1) £1.2 trillion of Defined Benefits liabilities includes those Defined Benefits schemes which have already undertaken buy-in exercise
Industry driver
Phoenix market position
Phoenix share of
market AUA c. 9%
Phoenix share of
market flows c. 5%
Retirement
solutions
£40bn p.a.
Corporates are de-
risking Driven by the offloading of
Defined Benefit schemes to
focus on core business

93
Phoenix is an established player in the BPA market and our strategy is to grow and expand
£5.7 billion of BPA written to date
We have strong relationships with EBCs, having been invited to price
72 deals in 2019 and 55 deals YTD in 2020
£1.2bn
£5.8bn
£0.8bn
£1.1bn
£1.5bn
£1.1bn
2019 2016 2018 Q32020 To date
Internal buy-in External BPA
First external
transaction in
2018
We have grown to
5% market share
in 2019
£2.3bn
£3.4bn
Workplace Retirement
Solutions CS&I
£ Targeting deals in the £100
million to £1 billion range
Funded from own resources,
allocating £150 million to £200
million surplus capital per
annum
Our ambition is to develop a
market-leading BPA franchise
Continued focus on value not
volume, whilst meeting hurdle
criteria and maintaining product
diversification
% Optimised capital strain

94
Optimising the capital strain will improve our deal economics
Our current deal economics, 2020 YTD Our target deal economics
£116m
£300m
Capital (includes capital management policy)
Liabilities
£1,446m
LT cash generation
£150m
£600m
Capital (includes capital management policy)
Liabilities LT cash generation
£3,000m
8%
5%
8%
5%
x
TARGET STRAIN CURRENT STRAIN Optimise capital within
the framework of the
Harmonised Internal
Model
Best-in-class
approach to sourcing
and allocation of
illiquid assets
Optimise approach
to reinsurance
Workplace Retirement
Solutions CS&I
Reducing capital strain

95
We are strengthening our capabilities to support our BPA ambitions
Workplace Retirement
Solutions CS&I
• Enlarged market leading
team with specialist skills
and proven track record of
delivery
• Increase resources to
enhance pricing capability
and provide a scalable
operating model
• Investment in pricing
platform to increase
scalability
Develop operating model
• Pricing of deferred liabilities
from 2021 (current
proposition biased towards
pensioner-only transactions)
• Enhance buyout capability
• Supported by best in class
onboarding and
administration processes
Expand our proposition
• Leverage mutual benefits of
long-term de-risking
partnerships including
reinsurance
• Continue to use umbrella
terms to facilitate efficient
follow-on transactions,
having completed 4 to date
De-risking partnerships
• Identify and execute
bespoke asset origination
opportunities for BPA deals
• Leverage in-house
investment expertise to
enable real time asset
pricing into BPA deals
• Increase volume of illiquid
asset origination
Build best in class
asset capability
Underpinned by our solutions-focused approach to customer requirements and proven ability
to work collaboratively to execute transactions efficiently

96
Workplace Retirement
Solutions CS&I
Unusual Scheme demographics:
90% female population
Significant part-time working
£11 billion M&S Pension Scheme
£4.5bn Pensioner liabilities
£5.5bn Deferred liabilities
Umbrella contracts enable:
Long term cost savings
A clear, transparent path for
future transactions
Schemes to act quickly to
take advantage of market
opportunities
Our relationship to date
Current opportunity Future opportunity
3 transactions
£1.3bn liabilities insured
13,500 members
Covering c. 30% of the Scheme’s total
pension liabilities
Pensioner benefits fully
modelled on Phoenix
systems
March 2018
£470m buy-in
5,300 members 1
Umbrella contract
established as part of initial
transaction to facilitate
future risk transfer
April 2019
£460m buy-in
5,200 members 2
September 2020
£360m buy-in
3,000 members 3
Collaborative approach
allows Scheme to benefit
from market opportunities
M&S case study: our ability to build lasting relationships facilitates follow-on
transactions

97
Key messages
Our Open business has strong foundations and is central to our purpose of helping people secure a life of possibilities
We are a top 3 workplace provider and are accelerating our investment in proposition
By deepening our customer relationships we will retain our customers and they will consolidate towards us
We are an established player in the BPA market, and are improving our capital efficiency
Delivering £800 million of incremental cash generation from new business per annum is achievable – we can prove the wedge

98
Agenda: Phoenix Group Capital Markets Day 2020
Introduction Nicholas Lyons - Chairman
Strategy Andy Briggs - Group Chief Executive Officer
Financial framework Rakesh Thakrar - Group Chief Financial Officer
Sustainability Claire Hawkins - Director of Corporate Affairs & Investor Relations
Heritage business Andy Moss - Heritage Chief Executive Officer
Open business Andy Curran - Chief Executive Officer, Savings & Retirement UK & Europe
Asset Management Mike Eakins - Chief Investment Officer
Summary Andy Briggs - Group Chief Executive Officer
Q&A Panel 3
2
1 Overview
Deep dive
Wrap up

99
Source assets that support
growth aspirations
Priorities across our Heritage and Open businesses
Manage asset risk for
resilience
Heritage
£323bn AUA
Phoenix in-force
business
Open
Hedging of
equity,
inflation and
interest rate
risks
Illiquid asset
origination to
support BPA
growth
Asset
origination
supports
management
actions
Pro-active
management
of credit risk
Underpinned by responsible investment
We are building a best-in-class in-house asset management team 0
1
Six pillars underpin our asset management strategy
Of thought and demographics is key to a value
creating investment strategy Diversity
Fundamental to successful BPA and achieving
strategic asset allocation for annuity back-book Illiquid asset
origination
With ASI as core strategic partner, complementing
asset origination with other select partners
Strategic
partnerships
Building a best-in-class investment and risk
management platform
Operational
excellence
Developing investment solutions for customers is
the core of our business
Customer
centricity
Integrating sustainability objectives for the benefit
of customers, investors and society Sustainability
Add chart to thinkcell s/s
Open Heritage

100
Market expertise
Phoenix Asset Management (“AM”) structure
Team of market
experts – average of
c.22 years of experience
across liquid credit,
illiquid assets and rates
markets
Shareholder and
policyholder teams – complemented by
specialist teams across
ALM, Sustainability,
Internal Ratings and COO
Dedicated function
We will be a centre of excellence with extensive asset management expertise
Shareholder Policyholder
Phoenix AM operate as a shared service, providing
investment solutions into each of the Business Units to the
benefit of both shareholders and policyholders
Open BPA • Phoenix AM offer real time pricing and
execution capability into the BPA
transaction process
Open
Workplace
• Workplace is the engine of the Open
Business and Phoenix AM will support that
business through continued optimisation of
product offering
Heritage • Deliver value to shareholders and
customers by delivering investment
outcomes that support cash generation
Business unit partnerships
+
+
Resilience Illiquid
assets
Phoenix Asset
Management
Head of Illiquid Assets
Mike Chappell
Chris Palmer
Head of ALM and
Structuring
Henrik Wijkander
Head of Sustainable
Investments
Sindhu Krishna
Head of Liquid Credit
Marcin Nawrocki
Chief Investment
Officer
Mike Eakins
Head of
Policyholder Assets
Craig Baker
Head of Manager
Oversight
James Mitchell
Head of Markets and
Portfolio Management
Nuwan Goonetilleke
Head of
Investment Solutions
Gareth Trainor
Head of Internal
Ratings
Chief Operating Officer
Philip Shaw (Interim)

101
Phoenix strategy and partnerships
ASI are Phoenix’s core strategic asset management
partner and are complemented by a network of select
other partners
Partnership network is global in scale allowing
Phoenix to leverage expertise across all levels of the
investment strategy including asset origination, portfolio
management and sustainability
Structural competitive advantages from Phoenix
partnering with chosen asset managers on a global basis
to ensure the best in class asset origination and
performance across all asset classes
Resilience Illiquid
assets
Phoenix Asset
Management
SH PH
SH
PH
- Mandates for
Shareholder Assets
- Mandates for
Policyholder Assets
SH PH
SH PH
SH PH
SH PH PH
PH
SH
SH
SH
We use our global strategic partnerships to deliver optimal investment outcomes

102
Resilience Illiquid
assets
Phoenix Asset
Management
Decarbonisation of investment portfolio
• Net-zero carbon by 2050 and active
engagement with decarbonisation
alliances, initiatives and policy makers
• Enhance internal capability and tools to
perform portfolio analysis using best in
class metrics taking into account both
physical and transition risks
Stewardship
• ‘Engagement first’ approach: asset
managers actively engage with investee
companies on our behalf.
• Use our position of influence as large
asset owner to bring change: with in-
action post sustained engagement
leading to divestment
Strategy and governance
• Ability to work with best-in-class asset
managers to deliver customer
expectations
• Invest in assets that support a sustainable
world, aligned with UN SDGs
Integrate ESG considerations
• Integration of ESG factors to maximise
long-term investment performance for all
our stakeholders
• Comprehensive ESG reporting from
investee companies and asset managers
Fostering responsible investment for the benefit of customer, investors and society

103
Phoenix’s asset management strategy delivers resilience through risk
management
Estimated Q320 SCR by risk type
Managed in line with risk appetite
through systematic hedging to stated
risk benchmarks
Interest rates
Inflation
Equities
Currencies
Unrewarded market risks
Risks we see as unrewarded :
Rewarded market risks
Managed in line with risk appetite
through disciplined investment within
set risk tolerance limits
Credit spreads
Credit downgrades/default
Property
Risks we see as rewarded :
19%
5%
3%
58%
5%
7%
3%
Other market risks
Credit Currency
Property
Demographic risks
Equity
Interest rate
15% 27%
Resilience Illiquid
assets
Phoenix Asset
Management

104
This is evidenced in our low sensitivity to risk events
159%
160%
156%
165%
152%
160%
151%
157%
149%
Q320 Solvency II SCCR
Equities: 20% fall in markets
Property: 12% fall in values(2)
Rates: 88bps fall in interest rates(3)
Credit: 120bps spread widening(4)
Credit: 20% portfolio full letter downgrade(5)
Lapse: 10% increase/decrease in rates(6)
Longevity: 6 months increase(7)
See Appendix I for footnotes
Rates: 73bps rise in interest rates(3)
Impact on
Solvency II
surplus Target range
140% 180%
£nil
£(0.2)bn
£(0.2)bn
£(0.2)bn
£(0.6)bn
£(0.2)bn
£(0.9)bn
£5.0bn
£0.1bn
Resilience Illiquid
assets
Phoenix Asset
Management
Combined Group Solvency II Shareholder Capital Coverage Ratio sensitivities(1)

105
Phoenix hedges 80-90% of the shareholders equity risk exposure
With-profit Indirectly exposed to equity which leads to
an increase in shareholder burn-through
costs, as equity markets fall
Unit linked Indirectly exposed as decline in market
erodes value of unit linked funds =
reduction in Present Value of Future
Profits (VIF)
Annuities No material exposure to equities
Shareholder exposure
Objective: hedge c80-90% of
shareholders equity risk:
£4.9bn VIF
£3.9bn (c80%) hedged Residual
Risk
• 3 month – 2 year rolling programme
using options, futures and forward
contracts matching mix of underlying
funds
• Hedging costs not material versus
risk reductions
Hedging programme
£0.5bn
£nil
£0.1bn
£(0.5)bn
With hedges Without hedges
Hedging 80-90% of risk
protects value
Change in Solvency II Surplus
20% fall in
equities
20% rise in
equities
Resilience Illiquid
assets
Phoenix Asset
Management

106
Hedging to risk appetite
protects value
88bps fall in
interest rates
73bps rise in
interest rates
We hedge residual shareholder interest rate risk exposure within risk appetite
With-profit Indirectly exposed to low interest rates
which lead to an increase in shareholder
burn-through costs
Unit linked No material exposure to interest rate risk
Annuities Directly exposed through investment
performance and asset / liability
mismatching
Shareholder exposure
Objective: reduce the exposure to
interest rates on the Solvency II balance
sheet. Delivered by:
• Initially through use of cash flow
matching in annuity Matching
Adjustment funds
• Then through portfolio of swaps and
swaptions to reduce the interest rate
exposure, including curve risk. Total
risk that has been hedged is £13
million, per 1bp movement in interest
rates
Hedging programme
£0.1bn
£(0.2)bn
£(1.2)bn
£1.0bn
With hedges Without hedges
Resilience Illiquid
assets
Phoenix Asset
Management
Change in Solvency II Surplus

107
We have a well diversified £46 billion shareholder asset portfolio
£46 billion shareholder portfolio £323 billion asset portfolio
£323bn
Key messages
at 30 September 2020
£76bn
£201bn
£7bn
£39bn
Unit linked 62%
With profits 24%
Annuities 12%
Protection 1% & Shareholder 1%
11%
7%
22% 45%
11%
Cash Gilt/Govt credit
Corporate bonds ERM
CRE
Other
Illiquid credit
£46bn
Resilience Illiquid
assets
Phoenix Asset
Management
£46 billion
shareholder
portfolio
£35 billion
debt portfolio
Shareholder portfolio includes £39
billion annuity backing assets
Sustainable objectives are
fundamental to the investment
process
£9 billion illiquid assets portfolio
comprises 24% of annuity backing
assets
Diversification of shareholder assets
in terms of rating, sector and
geography
Defensive positioning and pro-active
management across portfolio
at 30 September 2020

108
Our £35 billion debt portfolio is defensively positioned and proactively managed
at 30 September 2020
Approach to managing risk Key messages
Largest exposures are to defensive
sectors
£2.6 billion (8%) of debt portfolio
invested in US credit
Minimised exposure to sectors
sensitive to COVID-19 impact
1.6% exposure to oil and gas across
the debt portfolio
2.2% exposure to airlines, hotel,
leisure & traditional retail across the
debt portfolio
• Dedicated in-house credit expertise
with market leading managers
• Scenario analysis to actively monitor
movement and exposures for ‘at risk’
sectors
• Daily calls between asset managers
and Phoenix Asset Management team
• Target <20% BBB to manage non-
investment grade downgrade exposure
• Target to increase investment in US
credit in excess of 10% to balance risk
through geographical diversification
without compromising on yield return
• Ongoing management actions to
further de-risk the shareholder portfolio
in terms of rating and sector
£35bn
6%
15%
12%
30%
9%
Real
estate
Gilts/Sovereigns/
Supra/Sub-sov
Banks
Resilience Illiquid
assets
Phoenix Asset
Management
Utilities
Industrials
Consumer, cyclical
Tech & Telecoms
Financial services
Consumer, non-cyclical
Oil & gas
Insurance
Infrastructure
Other
Debt portfolio by sector

109
The Group has a high quality debt portfolio and is on track to reduce BBB and
below holdings to under 20%
Rating breakdown Active management of BBB and below
8%
34% 35%
9% 10%
2% 2%
AA AAA A BBB- BBB BBB+ BB and
below / NR
at 30 September 2020
0.2%
(2.0%)
Illiquids
deployment
30 Jun
2020
Actions 30 Sep
2020
BBB
rotation
Other 20 Nov
2020
23.5%
(1.8)%
21.7%
(0.2)%
19.7%
Management Actions
Resilience Illiquid
assets
Phoenix Asset
Management
(8)
See Appendix I for footnotes
(9)

110
Execution risk reduction through portfolio block trading helps deliver credit portfolio
management actions
£2.0 billion block trades YTD Logic
Diversification into
USD investment grade
and reduction of GBP
concentration risks /
watchlist names
Credit quality ratings
pick-up and sales of
mostly BBB-rated assets
and deployment into A
or better portfolio
Surplus generation through Matching
Adjustment spread pick-
up and positive
Solvency II impacts
£2,015m
£140m
£125m
Apr Jul
£550m
May May
£190m
£210m
Sep
£500m
YTD Oct
£300m
Nov
Stages of block trade delivery
Execution
Optimisation within
set investment limits,
targets and
restrictions
Analysis of
combined hedging,
ALM and surplus
generation impact
Execution through
bank and asset
management
partners
3
Balance
sheet impact
assessment
Portfolio
Construction
1
2
Resilience Illiquid
assets
Phoenix Asset
Management
GBP to USD trades to reduce holdings in BBB

111
Active management of debt portfolio has led to limited downgrade experience
Average credit rating by sector (Q320 vs HY20) Key messages
Sector Q320 AA A BBB ∆ vs HY20
Industrials 4%
Consumer, Cyclical 4%
Tech and Telecoms 6%
Consumer, Non-cyclical 6%
Banks 15%
Financial Services 3%
Utilities 12%
Gilts/Supra/Sub-sov 30%
Real Estate 9%
Insurance 3%
Oil and Gas 2%
Infrastructure 4%
Other 2%
TOTAL 100% Key: Q320 HY20
Resilience Illiquid
assets
Phoenix Asset
Management
Proactive rotation out of assets on ASI
downgrade forecast and internal Watchlist
No defaults in liquid portfolio. There has
been one default of a Retail asset in
illiquid portfolio – value £37 million
Only £1.6 billion (4.5%) of bonds in the
debt portfolio subject to a letter rating
downgrade
Only £148 million (0.4%) of bonds in the
debt portfolio downgraded to sub-
investment grade
99.3% of cash flows paid on illiquid bonds
and 99.99% paid on liquid bonds

112
To manage property risk, we maintain a highly resilient and well diversified Equity
Release Mortgage portfolio
Managing property risk Key portfolio statistics
Regional distribution
Current
portfolio
Average
LTV
Average
age
Average
time to
redemption
34% 77 years 11 years
at 30 September 2020
53%
14%
9%
22%
£3.3bn
at 30 September 2020
Credit rating determined through securitisation
Clearly defined risk appetite parameters
Selective approach in origination to meet hurdle criteria
on rating, duration and diversification
Ongoing regular monitoring including stress and scenario
testing
BB
AAA
AA
A
Awaiting securitisation
North West
South East
South West
East
Scotland
West Midlands
London
Wales
East Midlands
North East
Yorkshire and Humberside
Northern Ireland
Resilience Illiquid
assets
Phoenix Asset
Management
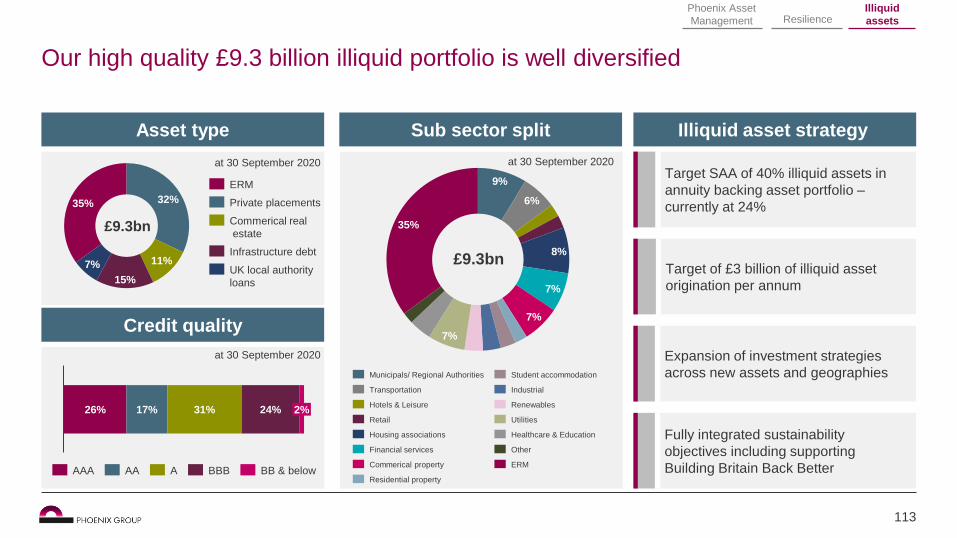
113
at 30 September 2020
Our high quality £9.3 billion illiquid portfolio is well diversified
Credit quality
Asset type
35% 32%
11%
15%
7%
£9.3bn
ERM
Infrastructure debt
Private placements
Commerical real
estate
UK local authority
loans
at 30 September 2020
at 30 September 2020
Sub sector split
£9.3bn
9%
6%
8%
7%
7%
7%
35%
Healthcare & Education
Municipals/ Regional Authorities
Utilities
Transportation
Hotels & Leisure
Commerical property
Retail
Residential property
Housing associations
Financial services
Student accommodation
Industrial
Renewables
Other
ERM
Illiquid asset strategy
Target SAA of 40% illiquid assets in
annuity backing asset portfolio –
currently at 24%
Target of £3 billion of illiquid asset
origination per annum
Expansion of investment strategies
across new assets and geographies
Fully integrated sustainability
objectives including supporting
Building Britain Back Better
Resilience Illiquid
assets
Phoenix Asset
Management
26% 17% 31% 24% 2%
AAA BB & below AA A BBB

114
Origination focused on longer maturities at attractive spreads 50% of origination in ESG assets
£1.4 billion
originated YTD
£0.1 billion
Solvency II
benefit
Average credit
rating of A Key statistics:
0
50
100
150
200
250
300
350
0 2 4 6 8 10 12 14 16 18 20 22 24 26 28 30 32 34 36
A
AA
A
A BBB
A+
AAA
A
A-
A
AA
A-
BBB
A+
BBB
A+
BBB A-
BBB
AA
A
AA
BBB+
BBB+
AA-
AAA
BBB
Spre
ad (
bps)
Infrastructure
Social housing Student accommodation
Local authority
CRE
Investment trust
Sub sovereign
ECA
Industrial
Weighted average life (years)
2020 origination delivers diversified assets of appropriate tenor and credit quality
Investment in
social housing
Other illiquid
asset origination
Resilience Illiquid
assets
Phoenix Asset
Management
£90m
£724m
£127m
£460m
Investment in sustainable
development Investment in
renewable
energy
£1.4bn

115
Illiquid asset origination helping to Build Britain Back Better
Project Albion – Renewable Energy Project TunTum – Social housing
What Albion is a diversified portfolio of
renewable assets across onshore
wind, hydro and solar
Where All the assets are UK based,
spread across England,
Scotland, Wales and Northern
Ireland
Structure Albion is owned by Albion Capital
Group LLP, an independent
investment manager, with a focus
on developing green energy
projects across the UK
What TunTum is a community-based
housing association, founded in
1988 with a BAME focus
Where Based in the East-Midlands, with c.
1400 homes providing affordable
housing to over 3000 people
Structure TunTum is independently led.
Founders and staff are community
activists and professionals,
motivated to create social and
economic opportunities
Resilience Illiquid
assets
Phoenix Asset
Management

116
Key messages
Phoenix is building a best in class asset management team, leveraging a global network of asset management partners with ASI as our strategic partner
Sustainable investing is integral to our strategy and we commit to net-zero carbon by 2050
We deliver resilience by hedging shareholder equity and interest rate risk
We have a well diversified, actively managed, high quality credit portfolio
Illiquid asset origination supports the growth of BPA and drives capital efficiency

117
(1) Sensitivity assumes stress occurs on Day 1 and that there is no market recovery
(2) Property stress represents an overall average fall in property values of 12%
(3) Assumes the impact of a dynamic recalculation of transitionals and an element of dynamic hedging which is performed on a continuous basis
to minimise exposure to the interaction of rates with other correlated risks including longevity
(4) Credit stress varies by rating and term and is equivalent to an average 120bps spread widening (full range of spread widening is 49bps to
204bps). It assumes the impact of a dynamic recalculation of transitionals and makes no allowance for the cost of defaults/downgrades
(5) Impact of an immediate full letter downgrade across 20% of the shareholder exposure to the bond portfolio (e.g. from AAA to AA, AA to A,
etc). This sensitivity assumes no management actions are taken to rebalance the annuity portfolio back to the original average credit rating
and makes no allowance for the spread widening which would be associated with a downgrade.
(6) Assumes most onerous impact of a 10% increase/decrease in lapse rates across different product groups
(7) Applied to the annuity portfolio
(8) Includes £132 million BB and below and £333 million non-rated assets
(9) Estimated position as at 20 November 2020
Appendix I: Footnotes

118
Agenda: Phoenix Group Capital Markets Day 2020
Introduction Nicholas Lyons - Chairman
Strategy Andy Briggs - Group Chief Executive Officer
Financial framework Rakesh Thakrar - Group Chief Financial Officer
Sustainability Claire Hawkins - Director of Corporate Affairs & Investor Relations
Heritage business Andy Moss - Heritage Chief Executive Officer
Open business Andy Curran - Chief Executive Officer, Savings & Retirement UK & Europe
Asset Management Mike Eakins - Chief Investment Officer
Summary Andy Briggs - Group Chief Executive Officer
Q&A Panel 3
2
1 Overview
Deep dive
Wrap up

119
Customers Customer obsessed,
focused on outcomes
that matter to them
Helping people secure
a life of possibilities
Investors Allocate resources to the
most attractive opportunities,
where we have competitive
advantage, with clear
performance hurdles
Colleagues The best talent, with
differentiated capability, diverse
and highly engaged
Phoenix has a clear role to play in society - Helping people secure a life of
possibilities

120
Phoenix has a clear strategy that leverages our leading share of in-force, and
the major market trends
Bedrock of our
business
HERITAGE
Market leader
Unique advantages from
operating alongside
Heritage
OPEN
Strong foundation
M&A &
INTEGRATION
Differentiated
capabilities
Market leader
…our strategy delivers cash, resilience and growth.
Acquire customers and grow our in-
force business by leveraging the
industry drivers of change
Customer acquisition
By engaging with our customers and
meeting their broader needs, we will
retain our customers and they will
consolidate towards us as they
journey to and through retirement
Deepen customer relationships
We manage our in force business to
deliver resilient cash generation and
management actions, including cost
and capital synergies
Optimise in-force business

121
Phoenix is a sustainable and growing business, helping people secure a life of
possibilities
Phoenix’s strategy delivers unique advantages… … and the whole is greater than the sum of the parts
Our unique risk management framework
delivers resilience across all of our in-
force business
We deliver high levels of dependable
cash generation which supports our
dividend over the long-term
We generate surplus capital with excess
cash to invest in growth options which are
aligned to the industry drivers of change
Optimised operating model delivers superior
customer experience and market leading
cost efficiency across both Heritage and
Open
Diversified business drives capital
efficiency across both Heritage and Open
Scale as the UK’s largest long-term savings
and retirement provider with circa 14 million
customers
HERITAGE OPEN
M&A & INTEGRATION

122
Disclaimer and other information
• This presentation in relation to Phoenix Group Holdings plc and its subsidiaries (the ‘Group’) contains, and we may make other statements (verbal or otherwise)
containing, forward-looking statements and other financial and/or statistical data about the Group’s current plans, goals and expectations relating to future
financial conditions, performance, results, strategy and/or objectives.
• Statements containing the words: ‘believes’, ‘intends’, ‘will’, ‘may’, ‘should’, ‘expects’, ‘plans’, ‘aims’, ‘seeks’, ‘targets’, ‘continues’ and ‘anticipates’ or other words
of similar meaning are forward-looking. Such forward-looking statements and other financial and/or statistical data involve risk and uncertainty because they
relate to future events and circumstances that are beyond the Group’s control. For example, certain insurance risk disclosures are dependent on the Group’s
choices about assumptions and models, which by their nature are estimates. As such, actual future gains and losses could differ materially from those that the
Group has estimated.
• Other factors which could cause actual results to differ materially from those estimated by forward-looking statements include but are not limited to: domestic and
global economic and business conditions; asset prices; market related risks such as fluctuations in interest rates and exchange rates, the potential for a sustained
low-interest rate environment, and the performance of financial markets generally; the policies and actions of governmental and/or regulatory authorities,
including, for example, initiatives related to the financial crisis, the COVID 19 pandemic and the effect of the European Union's "Solvency II” requirements on the
Group’s capital maintenance requirements; the impact of inflation and deflation; the political, legal, social and economic ef fects of the COVID 19 pandemic and
the UK’s vote to leave the European Union; market competition; changes in assumptions in pricing and reserving for insurance business (particularly with regard
to mortality and morbidity trends, gender pricing and lapse rates); the timing, impact and other uncertainties of future acquisitions or combinations within relevant
industries; risks associated with arrangements with third parties; inability of reinsurers to meet obligations or unavailabil ity of reinsurance coverage; the impact of
changes in capital, solvency or accounting standards, and tax and other legislation and regulations in the jurisdictions in which members of the Group operate.
• As a result, the Group’s actual future financial condition, performance and results may differ materially from the plans, goals and expectations set out in the
forward-looking statements and other financial and/or statistical data within this presentation. The Group undertakes no obligation to update any of the forward-
looking statements or data contained within this presentation or any other forward-looking statements or data it may make or publish. Nothing in this presentation
should be construed as a profit forecast or estimate.