capital link shipping weekly markets reportmaritime-connector.com/documents/capital link shipping...
TRANSCRIPT

1
Tuesday, January 19, 2016 (Week 3)
1
Tuesday, January 19, 2016 (Week 3)
IN THE NEWS Latest Company News
“Shipping Oracles event- an overview” by Barry Parker
CAPITAL MARKETS DATA Currencies, Commodities & Indices
Shipping Equities – Weekly Review
Dividend Paying Shipping Stocks
Weekly Equity Trading Statistics – by KCG
Global Shipping Company Bond Data
SHIPPING MARKETS Global Shipping Company Bond Profiles
Weekly Market Report – Allied Shipbroking Inc
Stifel Shipping Markets
Weekly Tanker Market Opinion, by Poten & Partners
Tanker Market - Weekly Highlights, by Charles R. Weber Company
Dry/Wet & TC Rates – Alibra Shipping
TERMS OF USE & DISCLAIMER
CONTENT CONTRIBUTORS
Capital Link Shipping
Weekly Markets Report
REGISTER

Capital Link - New York - London - Athens - Oslo New York - 230 Park Avenue, Suite 1536, New York, NY, 10169 Tel.: +1 212 661 7566 Fax: +1 212 661 7526London - Longcroft House,2-8 Victoria Avenue, London, EC2M 4NS, U.K Tel. +44(0) 203 206 1320 Fax. +44(0) 203 206 1321 Athens - 40, Agiou Konstantinou Str, Suite A 5, 151-24 Athens, Greece Tel. +30 210 6109 800 Fax +30 210 6109 801 Oslo - Raadhusgaten 25 P.O. Box 1904 Vika N-0116 Oslo, Norway
www.capitallink.comwww.capitallinkforum.com
www.CapitalLinkShipping.comA web based resource that provides information on the major shipping and stock market
Investor Relations & Financial Advisory
indices, as well as on all shipping stocks. It also features an earnings and conference call calendar, industry reports from major industry participants and interviews with CEOs, analysts and other market participants.
www.CapitalLinkWebinars.comSector Forums & Webinars: Regularly, we organize panel discussions among CEOs, analysts, bankers and shipping industry participants on the developments in the various shipping sectors (containers, dry bulk, tankers) and on other topics of interest (such as Raising Equity in Shipping Today, Scrapping, etc).
Capital Link Investor Shipping ForumsIn New York, Athens and London bringing together investors, bankers, financial advisors, listed companies CEOs, analysts, and shipping industry participants.
www.MaritimeIndices.comCapital Link Maritime Indices: Capital Link developed and maintains a series of stock market maritime indices which track the performance of U.S. listed shipping stocks (CL maritime Index, CL Dry Bulk Index, CL Tanker Index, CL Container Index, CL LNG/LPG Index, CL Mixed Fleet Index, CL Shipping MLP Index – Bloomberg page: CPLI. The Indices are also distributed through the Reuters Newswires and are available on Factset.
Capital Link Shipping Weekly Markets ReportWeekly distribution to an extensive audience in the US & European shipping, financial and investment communities with updates on the shipping markets, the stock market and listed company news.
Operating more like a boutique investment bank rather than a traditional Investor Relations firm, our objective is to assist our clients enhance long term shareholder value and achieve proper valuation through their positioning in the investment community. We assist them to determine their objectives, establish the proper investor outreach strategies, generate a recurring information flow, identify the proper investor and analyst target groups and gather investor and analyst feedback and related market intelligence information while keeping track of their peer group. Also, to enhance their profile in the financial and trade media.
Capital Link is a New York-based Advisory, Investor Relations and Financial Communications firm. Capitalizing on our in-depth knowledge of the shipping industry and capital markets, Capital Link has made a strategic commitment to the shipping industry becoming the largest provider of Investor Relations and Financial Communications services to international shipping companies listed on the US and European Exchanges. Capital Link's headquarters are in New York with a presence in London and Athens.
In our effort to enhance the information flow to the investment community and contribute to improving investor knowledge of shipping, Capital Link has undertaken a series of initiatives beyond the traditional scope of its investor relations activity, such as:
...Linking Shipping and Investors Across the GlobeCapital Link Shipping

2
Tuesday, January 19, 2016 (Week 3)
Monday, January 11, 2016
Gener8 Maritime, Inc. Announces Delivery of the Gener8 Apollo
and the Gener8 Supreme
Gener8 Maritime, Inc. (NYSE: GNRT), a leading U.S.-based provider
of international seaborne crude oil transportation services,
announced that it took delivery of the "ECO" VLCCs the Gener8
Apollo on January 5, 2016 and the Gener8 Supreme onJanuary 6,
2016 from Daewoo Shipbuilding & Marine Engineering and Shanghai
Waigaoqiao Shipbuilding Co., Ltd., respectively. The Gener8
Apolloand the Gener8 Supreme represent the fourth and fifth of 21
"ECO" VLCCs expected to be delivered into Gener8 Maritime's fleet.
Upon delivery, the Gener8 Apollo and Gener8 Supreme were
entered into Navig8's VL8 Pool.
http://ir.gener8maritime.com/2016-01-11-Gener8-Maritime-Inc-
Announces-Delivery-of-the-Gener8-Apollo-and-the-Gener8-Supreme
Don't ignore fleet age and new market dynamics, says Dorian
LPG
Older vessels can make room for new, and cargo demand is rising,
says one of the world's leading VLGC owners. The very large gas
carrier fleet includes more than 40 vessels over 20 years old, which
would be ideal candidates to be displaced if the influx of new
tonnage is not completely absorbed by increased demand, according
to leading VLGC owner Dorian LPG.
http://dorianlpg.investorroom.com/2016-01-11-Dorian-LPG-Dont-
Ignore-Fleet-Age
KNOT Offshore Partners LP Announces Fourth Quarter 2015
Earnings Results Conference Call
KNOT Offshore Partners LP (NYSE:KNOP) plans to release its
financial results for the fourth quarter of 2015 before opening of the
market on Thursday, February 18, 2016.
http://ir.knotoffshorepartners.com/investor-relations/Investor-
Information/news-releases/news-details/2016/KNOT-Offshore-
Partners-LP-Announces-Fourth-Quarter-2015-Earnings-Results-
Conference-Call/default.aspx
Tuesday, January 12, 2016
Scorpio Bulkers Inc. Announces Purchase of Common Shares
by Scorpio Services Holding Limited
Scorpio Bulkers, Inc. (NYSE: SALT) announced that Scorpio
Services Holding Limited ("SSH") has purchased an aggregate of
338,436 common shares of the Company at an average price of
$4.64 per share in the open market since the Company's previous
announcement on October 1, 2015. The Company currently has
28,697,366 common shares outstanding, of which SSH owns
2,238,228 or 7.80%.
http://ir.scorpiobulkers.com/press-releases/scorpio-bulkers-inc-
announces-purchase-of-common-shares-by-scorpio-services-hold-
nyse-salt-1238558
Seaspan Declares Quarterly Dividends on Common and
Preferred Shares
Seaspan Corporation (NYSE:SSW) announced that the Company's
Board of Directors has declared cash dividends on its common and
preferred shares
http://seaspan.mwnewsroom.com/Files/a8/a84b8ba9-7ffb-4272-
b46f-be98733ff7b7.pdf
Star Bulk Provides Updated Corporate Presentation
Star Bulk Carriers Corp. (Nasdaq: SBLK) a global shipping company
providing transportation solutions in the dry bulk sector, announced
that the Company has uploaded an updated corporate presentation
on the Company’s website, including updated cash and debt figures
as of December 31, 2015 and latest Capex schedule.
http://www.starbulk.com/UserFiles/sblk011216.pdf
Tsakos Energy Navigation Limited Declares Dividend on its
8.00% Series B and 8.875% Series C Cumulative Redeemable
Perpetual Preferred Shares
Tsakos Energy Navigation Limited (NYSE: TNP), a leading crude,
product, and LNG tanker operator, announced that its Board of
Directors declared regular quarterly cash dividends of $0.50 per
share for its 8.00% Series B Cumulative Redeemable Perpetual
Preferred Shares (the “Series B Preferred Shares”; NYSE; TNPPRB)
and approximately $0.5547 per share for its 8.875% Series C
Cumulative Redeemable Perpetual Preferred Shares (the “Series C
Preferred Shares”; NYSE; TNPPRC).
http://www.tenn.gr/en/about.html
Wednesday, January 13, 2016
Atwood Oceanics Announces First Quarter Earnings Guidance
Atwood Oceanics, Inc. (NYSE: ATW) provided earnings guidance for
its fiscal year 2016 first quarter ended December 31, 2015 due to
unusual market volatility.
http://ir.atwd.com/file.aspx?IID=4010374&FID=32527953
Diamond Offshore To Release Fourth Quarter 2015 Results on
February 8
Diamond Offshore Drilling, Inc. (NYSE: DO) announced that it will
issue a press release and host a conference call and webcast
related to its fourth quarter 2015 operating results on Monday,
February 8, 2016. The conference call and webcast will begin at
7:30 a.m. CST and will include a discussion by management
regarding the Company's results of operation.
http://investor.diamondoffshore.com/phoenix.zhtml?c=78110&p=irol-
newsArticle&ID=2128904
Noble Corporation plc to Announce Fourth Quarter and Full
Year 2015 Results
Noble Corporation plc (NYSE: NE) announced it plans to report
financial results for the fourth quarter and full year 2015 on
Wednesday, February 3, 2016, after the close of trading on the New
York Stock Exchange. Copies of the Company's press release will
be available on the Noble Web site at www.noblecorp.com.
http://phx.corporate-ir.net/phoenix.zhtml?c=98046&p=irol-
newsArticle&ID=2128961
Scorpio Tankers Announces Upsizing of a Previously
Announced Credit Facility
Scorpio Tankers Inc. (NYSE: STNG) announced the upsizing of its
Latest Company News
IN THE NEWS

3
Tuesday, January 19, 2016 (Week 3)
previously announced ING Credit Facility.
http://ir.scorpiotankers.com/press-releases/scorpio-tankers-
announces-upsizing-of-a-previously-announced-credit-facility-nyse-
stng-1238833
Thursday, January 14, 2016
Diana Shipping Inc. Announces Time Charter Contract for m/v
Nirefs with Transgrain
Diana Shipping Inc. (NYSE: DSX), a global shipping company
specializing in the ownership of dry bulk vessels, announced that,
through a separate wholly-owned subsidiary, it entered into a time
charter contract with Transgrain Shipping B.V., Rotterdam, for one of
its Panamax dry bulk vessels, the m/v Nirefs. The gross charter rate
is US$4,600 per day, minus a 5% commission paid to third parties,
for a period of minimum eleven (11) months to about fourteen (14)
months. The charter is expected to commence tomorrow.
http://www.dianashippinginc.com/news/news-diana-shipping-inc-
announces-time-charter-contract-for-m-v-nirefs-with-transgrain
Ensco Rated #1 Offshore Driller for Sixth Consecutive Year in
Independent Customer Satisfaction Survey
For the sixth consecutive year, Ensco plc (NYSE: ESV) has earned
first place for total customer satisfaction in the Offshore Drilling
segment of the Oilfield Products & Services Customer Satisfaction
Survey conducted by EnergyPoint Research. The annual survey is
the industry benchmark for customer satisfaction in the global
oilfield.
http://www.enscoplc.com/news-and-media/press-releases/press-
release-details/2016/Ensco-Rated-1-Offshore-Driller-for-Sixth-
Consecutive-Year-in-Independent-Customer-Satisfaction-
Survey/default.aspx
Noble Corporation plc Provides Fleet Contract Status Update
Noble Corporation plc (NYSE:NE) today announced that its report of
drilling rig status and contract information has been updated as of
January 14, 2016. The report, titled "Fleet Status Report," can be
found on the Company's Web site www.noblecorp.com, under the
"Investor Relations" section of the Web site.
http://phx.corporate-ir.net/phoenix.zhtml?c=98046&p=irol-
newsArticle&ID=2129510
Overseas Shipholding Group Announces Waiver of
Supplemental Indenture Condition and Extension of Expiration
Date of Tender Offer and Consent Solicitation for Its 7.50%
Senior Notes Due 2024
Overseas Shipholding Group, Inc. (NYSE MKT:OSG, OSGB)
announced the further extension of the previously announced tender
offer (the “Tender Offer”) for any and all of its 7.50% Senior Notes
due 2024 (the “Notes”) and the solicitation of consents (“Consents”)
from registered holders of the Notes (the “Consent Solicitation”) to
amend the indenture governing the Notes to affirm that for the
purposes of the restriction in such indenture on the Company’s
ability to dispose of assets, the Company’s international operations,
held through its subsidiary OSG International, Inc., do not constitute
substantially an entirety of the Company’s assets (the “Proposed
Amendment”).
http://ir.osg.com/phoenix.zhtml?c=82053&p=irol-
newsArticle&ID=2129535
Safe Bulkers, Inc. Declares Quarterly Dividend on its 8.00%
Series B Cumulative Redeemable Perpetual Preferred Shares;
8.00% Series C Cumulative Redeemable Perpetual Preferred
Shares; 8.00% Series D Cumulative Redeemable Perpetual
Preferred Shares
Safe Bulkers, Inc. (NYSE: SB), an international provider of marine
drybulk transportation services, announced that the Company's
Board of Directors has declared:
• A cash dividend of $0.50 per share on its 8.00% Series B
Cumulative Redeemable Perpetual Preferred Shares (the “Series B
Preferred Shares”) (NYSE: SB.PR.B) for the period from October 30,
2015 to January 29, 2016;
• A cash dividend of $0.50 per share on its 8.00% Series C
Cumulative Redeemable Perpetual Preferred Shares (the “Series C
Preferred Shares”) (NYSE: SB.PR.C) for the period from October 30,
2015 to January 29, 2016;
• A cash dividend of $0.50 per share on its 8.00% Series D
Cumulative Redeemable Perpetual Preferred Shares (the “Series D
Preferred Shares”) (NYSE: SB.PR.D) for the period from October 30,
2015 to January 29, 2016.
http://www.safebulkers.com/sbpr011416.pdf
Friday, January 15, 2016
Diana Shipping Inc. Announces Time Charter Contract for m/v
Aliki with SwissMarine
Diana Shipping Inc. (NYSE: DSX), a global shipping company
specializing in the ownership of dry bulk vessels, announced that,
through a separate wholly-owned subsidiary, it entered into a time
charter contract with SwissMarine Services S.A., Geneva, for one of
its Capesize dry bulk vessels, the m/v Aliki. The gross charter rate is
US$5,300 per day, minus a 5% commission paid to third parties, for
a period of minimum eleven (11) months to maximum fourteen (14)
months. The charter is expected to commence tomorrow.
http://www.dianashippinginc.com/news/news-diana-shipping-inc-
announces-time-charter-contract-for-m-v-aliki-with-swissmarine
Dryships Announces Availability of Notice of Special Meeting
and Proxy Statement
DryShips Inc. (NASDAQ: DRYS), an international owner of drybulk
carriers and offshore support vessels, announced the availability of
the Notice of Special Meeting and Proxy Statement for the
Company’s Special Meeting of Shareholders, to be held at the
Company’s offices located at 109 Kifisias Avenue & Sina Street, GR
151 24, Marousi, Athens, Greece, on Friday, February 19, 2016 at
4:00 p.m., local time. The Notice of Special Meeting and Proxy
Statement were mailed on or about January 15, 2016 to
shareholders of record as of January 8, 2016, and can also be found
on the Company’s website at:
http://dryships.irwebpage.com/2016_Special_Meeting_of_Sharehold
ers.html.
http://dryships.irwebpage.com/press/dryspr011516.pdf
Trading Update
Euronav NV (NYSE: EURN & Euronext: EURN) takes the
opportunity to update investors on current market conditions in the
Latest Company News
IN THE NEWS

4
Tuesday, January 19, 2016 (Week 3)
large tanker market.
http://www.euronav.com/Documents/IR/Press%20Releases/2016011
5_Trading%20Update.pdf
SDRL - Announces Agreement with DSME Shipyard
Seadrill Limited ("SDRL") announces that an agreement with DSME
shipyard has been reached to defer the delivery of two ultra-
deepwater drillships, the West Aquila and West Libra, until the
second quarter of 2018 and first quarter of 2019 respectively.
http://www.seadrill.com/investor-relations/news/pr-
story.aspx?ResultPageURL=http://cws.huginonline.com/S/135817/P
R/201601/1979043.xml
Safe Bulkers, Inc. Receives Share Price Continued Listing
Standard Notice from NYSE
Safe Bulkers, Inc. (NYSE: SB), an international provider of marine
drybulk transportation services, announced that the Company was
notified by the New York Stock Exchange (“NYSE”) that the trading
price of shares of the Company’s common stock, listed on the NYSE
as “SB”, is not in compliance with the NYSE’s continued listing
standard that requires a minimum average closing price of $1.00 per
share over a period of 30 consecutive trading days. The NYSE
notification has no impact on the Company’s business operations.
http://www.safebulkers.com/sbpr011516.pdf
KNOT Offshore Partners LP Announces Fourth Quarter 2015
Cash Distribution
KNOT Offshore Partners LP (NYSE:KNOP) announced that its
Board of Directors has declared a quarterly cash distribution with
respect to the quarter ended December 31, 2015, of $0.52 per unit.
http://ir.knotoffshorepartners.com/investor-relations/Investor-
Information/news-releases/news-details/2016/KNOT-Offshore-
Partners-LP-Announces-Fourth-Quarter-2015-Cash-
Distribution/default.aspx
Monday, January 18, 2016
Scorpio Tankers Inc. Announces an Update on Its Securities
Repurchase Program
Scorpio Tankers Inc. (NYSE: STNG) announced an update on its
Securities Repurchase Program.
http://ir.scorpiotankers.com/press-releases/scorpio-tankers-inc-
announces-an-update-on-its-securities-repurchase-program-nyse-
stng-1239405
Latest Company News
IN THE NEWS

5
Tuesday, January 19, 2016 (Week 3)
IN THE NEWS
Contributed by
Barry Parker Barry Parker is a financial writer and
analyst. His articles appear in a number of
prominent maritime periodicals including
Lloyds List, Fairplay, Seatrade, and
Maritime Executive and Capital Link
Shipping.
New York Maritime Inc. (NYMAR) hosted a session billed as “The Oracles
of shipping: A look at 2016”. kicking off its schedule of events for the new
year. A quick brush-up on Greek lore suggests that the wisdom imparted
by the ancient Greek oracles, most notably from Delphi, required some
parsing; ie it was not “actionable” at the outset. So it goes with NYMAR;
there was a lot of knowledge on the panel, but some review and
interpretation is necessary the wisdom of NYMAR’s sages may need
further evaluation, and interpretation. Like everything with shipping, there
are nuances. What a great event though. The investment bank Jefferies
provided both the venue, and the moderator- shipping banker Jeff Pribor.
The panel of Oracles covered the entire waterfront- ranging from drybulk,
tankers, containers, banking with a splash of offshore oil and marine
insurance.
Bob Burke, the Chief Executive Officer of Ridgebury Tankers, was looking
ahead to clear sailing in both the crude and product tanker sectors, which
he described as “inter-related”, “unless the orderbook is overheating.” He
talked about the entire oil distribution system being clogged, noting that
1.5 million barrels/ day of crude oil production in excess of demand must
be stored, including on tankers. The lifting of the Iranian embargo may
have been mentioned- if so, for just a millisecond and I missed it- its
possible impacts are presently confounding tanker market watchers as
the hires have backed down. There’s uncertainty concerning cargo flows;
how fast will Iran ramp up (some experts suggest that they can get to
500,000 barrels/ day quickly)? And then we have that Iranian tanker fleet-
will those vessels come onto the spot market, and if so, what exactly is
their deliverability? Or, will those holding barrels in storage continue to
hold them? We invited opinions on the Iran situation from experts on
economics and statistics related to vessels; nothing heard back. By the
way, Mr. Burke continues to look for a low oil price throughout 2016; he
was at the low end of the range in a poll of the Oracles on the likely oil
price at end 2016; guesses ranged from $25/barrel to $60/barrel. Mr.
Burke also opined on the newly allowed U.S. crude oil exports, saying that
with they would bring no benefit to the tanker market right now- with the
price of U.S. oil (West Texas Intermediate) at parity with the worldwide
market (Brent oil). Based on this view, the spread would probably not
deviate too far from parity- so if this line of Oracling is correct- don’t look
for headlines in the shipping media, or the mainstream media, on the topic
of U.S. crude exports.
A U.S. Merchant Marine Academy classmate of Bob Burke’s, maritime
lawyer Peter McLauchlan, partner in the Houston law office of Gardere
Wynne & Sewell LLP, talked about the energy space, where there is
something like “$70 billion of active bankruptcy filings” as participants in
all aspects of production, including the offshore energy sector, restructure.
It was not all doom and gloom. When talking about big offshore projects
(such as those undertaken by the energy majors in the Gulf of Mexico), he
acknowledged that “…multi-year projects just don’t stop.” The panel also
included insurance representative Joe Hughes, from the Shipowners
Claims Bureau- the managers of the American Club (based downtown),
who talked about insurance being “…a bright spot for shipowners”- with
relatively benign increases in recent years.
Kevin Kennedy, another classmate of Burke’s from Kings Point (and later
a colleague at GE Capital, where Burke worked prior to striking out on his
own) who is now Managing Director of container shipping fund packager
MC Seamax, described a gloomy outlook for the container sector, which
he described as “driven by oversupply”. Mr. Kennedy, who was
Shipping Oracles event- an overview
previously the CFO at Seaspan, waxed enthusiastic on shipowners who
charter vessels out…”the liners generally pay”. He noted a bifurcation
among listed companies, with dividends to shareholders being sustained
by some, in spite of the weak markets.
The Oracles also delved heavily into ship finance, which was what much
of NYMAR ‘s membership, heavily involved in finance and capital raising,
had really come to hear. Banker Martin Lunder, from Nordea, emphasized
his bank’s participation in a large tanker financing, but acknowledged that
“…we’ll be busy with amendments and waivers…” when it comes to
drybulk, a sector clearly in trouble. The question of new capital sources
for shipping is often discussed at such venues as the industry has been
taking $100 billion of new debt each year, according to his numbers. Mr.
Lunder said that Export Credit Agencies (ECAs) have filled part of the
funding vacuum as shipping banks have pulled back; The panelists then
discussed the impact of professional investors owning ships; Kevin
Kennedy noted much more liquid markets for trading debt than previously
(indeed such liquidity has been the cornerstone of various “loan to own”
schemes that have enabled a number of once high flyers to restructure,
and live to fight another day, albeit with different owners).
Distressed selling of assets is another topic that comes up frequently at
such events. The moderator, Jeff Pribor , postulated what might happen
in the realm of asset sales, where non-emotional private equity investors
are involved. Unlike family businesses, the traditional model for shipping
company ownership, professional investors might not be positioning for
the next cycle (unlike closely owned companies which will wait out bad
markets before handing off the helm to the next generation). Lambros
Papaeconomou, an excellent analyst and, these days, a top shipping
journalist, implored companies to recognize their problems, and then
suggested that: “Chapter 11 is not the worst thing…” for companies that
are restructuring their debt.
Hamish Norton, President of Star Bulk Carriers (and previously a shipping
banker at Jefferies) summarized drybulk with a well known Monty Python
skit that evokes images of the Black Death, on a video clip. No
Powerpoints for this group! After the chants of “…almost dead…” Mr.
Norton added that the market is as bad as Mr. Petros Pappas (a longtime
shipping man, now the Chairman at Star Bulk, a listed entity) can
remember.
So, what to make of the Oracles, and all the folks in the standing room
only conference room who came to listen to them? Yogi Berra quotes, like
difficulties forecasting the future, come quickly to mind. But the evening
was about much more than predicting oil prices (there was some of that)
and levels of the Baltic Dry Index. New York has a vibrant community of
finance, legal and other specialists who are devoted to maritime
businesses. But, despite adversity plaguing parts of the market (not all),
the culture is “half full”, rather than half empty, full of clever professionals
who can see the positives in the murky atmosphere that true Oracles must
breath from, and turn them into real action.

6
Tuesday, January 19, 2016 (Week 3)
Dividend Paying Shipping Stocks Stock Prices as of January 15, 2016
CAPITAL MARKETS DATA
Company Name Ticker Quarterly
Dividend
Annualized
Dividend
Last Closing Price
(January 15, 2016)
Annualized
Dividend Yield
Container
Costamare Inc CMRE $0.29 $1.16 6.93 0.17
Diana Containerships DCIX $0.0025 $0.01 0.54 0.02
Global Ship Lease GSL $0.10 $0.40 1.79 0.22
Seaspan Corp SSW $0.375 $1.50 14.06 0.11
Dry Bulk
Navios Maritime Holdings Inc. NM $0.06 $0.24 0.86 0.28
Safe Bulkers Inc. SB $0.01 $0.04 0.35 0.11
Tankers
Ardmore Shipping Corp. ASC $0.31 $0.40 9.20 0.13
DHT Holdings, Inc. DHT $0.18 $0.72 5.51 0.13
Euronav NV EURN $0.62* $1.24 10.09 0.12
Navios Maritime Acquisition Corp NNA $0.05 $0.20 2.07 0.10
Nordic American Tankers Limited NAT $0.38 $1.52 13.03 0.12
Scorpio Tankers Inc STNG $0.125 $0.50 5.74 0.09
Teekay Tankers Ltd TNK $0.03 $0.12 4.23 0.03
Tsakos Energy Navigation Ltd TNP $0.06 $0.24 5.66 0.04
Mixed Fleet
Ship Finance International Limited SFL $0.45 $1.80 13.40 0.13
Teekay Corporation TK $0.55 $2.20 6.18 0.36
LNG/LPG
GasLog Ltd GLOG $0.14 $0.56 6.34 0.09
Golar LNG GLNG $0.45 $1.80 13.56 0.13
Maritime MLPs
Capital Product Partners L.P. CPLP $0.2385 $0.954 3.73 0.26
Dynagas LNG Partners DLNG $0.4225 $1.69 7.31 0.23
GasLog Partners LP GLOP $0.478 $1.912 11.13 0.17
Golar LNG Partners, L.P. GMLP $0.5775 $2.31 10.18 0.23
Hoegh LNG Partners HMLP $0.3375 $1.35 13.58 0.10
KNOT Offshore Partners L.P. KNOP $0.52 $2.08 10.89 0.19
Navios Maritime Partners L.P. NMM $0.2125 $0.85 1.92 0.44
Navios Maritime Midstream Partners NAP $0.4225 $1.69 8.15 0.21
Teekay LNG Partners L.P. TGP $0.70 $2.80 9.99 0.28
Teekay Offshore Partners L.P. TOO $0.56 2.24 3.52 0.64
Offshore Drilling
Atwood Oceanics, Inc. ATW $0.075 $0.30 6.07 0.05
Diamond Offshore Drilling DO $0.125 $0.50 16.91 0.03
Ensco plc ESV $0.15 $0.60 10.30 0.06
Noble Corporation NE $0.15 $0.60 7.79 0.08
Rowan Companies RDC $0.10 $0.40 12.19 0.03
*Semi-annual dividend

7
Tuesday, January 19, 2016 (Week 3)
(1) Annual dividend percentage based upon the liquidation preference of the preferred shares.
* Prices reflected are since inception date:
Costamare Series D - 5/6/2015
Dynagas LNG Partners Series A – 7/13/2015
GasLog Series A – 3/30/2015
Teekay Offshore Series B – 4/13/2015
Tsakos Energy Series D – 4/22/2015
.
CAPITAL MARKETS DATA
Company Ticker
Amount
Issued
($m)
Type Annual
Coupon
Offer
Price
Current
Price
1/15/2016
Current Yield
(annualized)
%
change
last
week
52-week
range*
Costamare Series B CMRE PRB 50 perpetual 7.625% $25.00 $8.43 25.94% -19.02% $14.01-$26.20
Costamare Series C CMRE PRC 100 perpetual 8.50% $25.00 $40.05 23.72% -13.98% $15.26-$27.09
Costamare Series D CMRE PRD 100 perpetual 8.75% $25.00 $40.00 22.50% -15.02% $15.05-$25.05*
Diana Shipping Series B DSXPRB 65 perpetual 8.875% $25.00 $3.57 61.27% -14.58% $9.58-$25.59
Dynagas LNG Partners
Series A DLNGPRA 75 perpetual 9.000% $25.00 $2.70 79.86% -17.91% $14.80-$24.75*
GasLog Series A GLOGA 111 perpetual 8.75% $25.00 $19.54 10.24% -21.32% $15.61-$26.10*
Global Ship Lease
Series B GSLB 35 perpetual 8.75% $25.00 $6.84 29.24% -24.57% $8.43-$23.94
International
Shipholding Series A ISHPRA 25 perpetual 9.50% $100.00 $6.79 29.46% -18.27% $35.00-$105.00
Navios Maritime
Holdings Series G NMPRG 50 perpetual 8.75% $25.00 $24.45 9.71% -14.89% $25.00-$101.98
Navios Maritime
Holdings Series H NMPRH 120 perpetual 8.625% $25.00 $23.52 8.45% -39.90% $3.57-$26.50
Safe Bulkers Series B SBPRB 40 perpetual
step up 8.00% $25.00 $23.22 8.88% -51.87% $2.70-$22.37
Safe Bulkers Series C SBPRC 58 perpetual 8.00% $25.00 $11.00 16.48% -1.86% $13.00-$25.20
Safe Bulkers Series D SBPRD 80 perpetual 8.00% $25.00 $12.57 21.60% -17.09% $6.84-$21.28
Seaspan Series C SSWPRC 100 perpetual
step up 9.50% $25.00 $22.28 8.98% -17.70% $6.29-$21.30
Seaspan Series D SSWPRD 128 perpetual 7.95% $25.00 $21.25 10.44% -2.00% $24.36-$27.35
Seaspan Series E SSWPRE 135 perpetual 8.25% $25.00 $17.82 16.23% -1.09% $21.46-$26.60
Teekay Offshore Series
A TOOPRA 150 perpetual 7.25% $25.00 $8.43 25.94% -1.65% $22.92-$26.51
Teekay Offshore Series
B TOOPRB 125 perpetual 8.50% $25.00 $40.05 23.72% -16.98% $10.67-$23.67
Tsakos Energy Series B TNPPRB 50 perpetual
step up 8.00% $25.00 $40.00 22.50% -16.64% $12.57-$25.05*
Tsakos Energy Series C TNPPRC 50 perpetual 8.875% $25.00 $3.57 61.27% -7.17% $21.85-$25.80
Tsakos Energy Series D TNPPRD 85 perpetual 8.75% $25.00 $2.70 79.86% -10.67% $21.00-$26.42
Preferred Shipping Stocks Stock Prices as of January 15, 2016

8
Tuesday, January 19, 2016 (Week 3)
Indices Week ending January 15, 2016
CAPITAL MARKETS DATA
MAJOR INDICES
CAPITAL LINK MARITIME INDICES
America Symbol 1/15/2016 1/8/2016 % Change YTD % Change 2-Jan-15
Dow Jones INDU 15,988.08 16,346.45 -2.19 -10.35 17,832.99
Dow Jones Transp. TRAN 6,689.06 6,946.36 -3.70 -26.49 9,098.98
NASDAQ CCMP 4,488.42 4,643.63 -3.34 -5.04 4,726.81
NASDAQ Transp. CTRN 3,041.92 3,123.89 -2.62 -22.73 3,936.65
S&P 500 SPX 1,880.33 1,922.03 -2.17 -8.64 2,058.20
Europe Symbol 1/15/2016 1/8/2016 % Change YTD % Change 2-Jan-15
Deutsche Borse Ag DAX 9,545.27 9,849.34 -3.09 -2.25 9,764.73
Euro Stoxx 50 SX5E 2,952.48 3,033.47 -2.67 -5.96 3,139.44
FTSE 100 Index UKX 5,804.10 5,912.44 -1.83 -11.36 6,547.80
Asia/Pacific Symbol 1/15/2016 1/8/2016 % Change YTD % Change 2-Jan-15
ASX 200 AS51 4,892.80 4,990.84 -1.96 -9.99 5,435.93
Hang Seng HSI 19,520.77 20,453.71 -4.56 -18.18 23,857.82
Nikkei 225 NKY 17,147.11 17,697.96 -3.11 -1.74 17,450.77
Index Symbol 1/15/2016 1/8/2016 % Change YTD %
Change 2-Jan-15
Capital Link Maritime Index CLMI 836.86 952.53 -12.14 -63.13 2,270.00
Tanker Index CLTI 658.65 786.22 -16.23 -50.21 1,322.86
Drybulk Index CLDBI 164.79 225.80 -27.02 -73.53 622.45
Container Index CLCI 1,000.27 1,034.55 -3.31 -32.01 1,471.29
LNG/LPG Index CLLG 1,053.62 1,197.32 -12.00 -65.82 3,082.31
Mixed Fleet Index CLMFI 1,000.20 1,142.61 -12.46 -59.04 2,441.80
MLP Index CLMLP 856.53 1,024.19 -16.37 -70.29 2,882.73
*The Capital Link Maritime Indices were updated recently to adjust for industry changes. Dorian LPG Ltd (NYSE:LPG) became a member of Capital
Link LNG/LPG Index, GasLog Partners L.P. (NYSE:GLOP) became a member of Capital Link LNG/LPG Index and Capital Link MLP Index, Navios
Maritime Midstream Partners (NYSE:NAP) became a member of Capital Link MLP Index, Euronav NV (NYSE: EURN) became a member of Capital
Link Tanker Index, and Gener8 Maritime (NYSE: GNRT) became a member of Capital Link Tanker Index. Additionally, Capital Link Dry Bulk Index
reflects the stock name change of Baltic Trading Ltd (NYSE: BALT) to Genco Shipping & Trading Limited (NYSE: GNK).

9
Tuesday, January 19, 2016 (Week 3)
CAPITAL MARKETS DATA
TRANSPORTATION STOCKS
DRYBULK TICKER 1/15/2016
Friday
1/8/2016
Friday
Change
%
52 week
high
52 week
low 1/2/2015
Three Month
Avg. Volume
Genco Shipping & Trading Ltd GNK $1.01 $1.26 -19.84% N/A N/A N/A 268,327
Diana Shipping Inc DSX $2.48 $3.46 -28.32% $8.11 $2.15 $6.65 574,789
DryShips Inc DRYS $0.10 $0.12 -12.59% $1.06 $0.08 $1.13 4,621,186
Eagle Bulk Shipping Inc EGLE $2.05 $2.66 -22.93% $12.90 $2.05 $14.42 36,052
FreeSeas Inc FREE $0.44 $0.64 -30.90% $2,475.00 $0.31 $32.93 259,460
Globus Maritime Ltd GLBS $0.09 $0.20 -54.89% $2.35 $0.09 $2.30 14,687
Golden Ocean Group GOGL $0.71 $0.73 -2.16% $5.73 $0.64 $4.27 349,960
Navios Maritime Holdings Inc NM $0.86 $0.99 -13.15% $4.59 $0.72 $4.09 1,166,532
Navios Maritime Partners LP NMM $1.92 $2.37 -18.99% $13.89 $1.78 $11.01 1,060,199
Paragon Shipping Inc PRGN $0.11 $0.14 -21.43% $2.01 $0.09 $2.66 131,543
Safe Bulkers Inc SB $0.35 $0.46 -24.50% $4.00 $0.34 $3.84 399,240
Scorpio Bulkers SALT $3.65 $4.89 -25.36% $33.12 $3.01 $1.95 248,110
Seanergy Maritime SHIP $1.64 $2.89 -43.25% $6.75 $1.64 $0.90 2,549
Star Bulk Carriers Corp SBLK $0.43 $0.44 -3.18% $4.64 $0.36 $6.12 530,244
BALTIC INDICES
Index Symbol 1/15/2016 1/8/2016 % Change YTD %
Change 2-Jan-15
Baltic Dry Index BDIY 373 429 -13.05 -51.62 771
Baltic Capesize Index BCIY 198 343 -42.27 -56.58 456
Baltic Panamax Index BPIY 381 434 -12.21 -53.93 827
Baltic Supramax Index BSI 394 430 -8.37 -55.43 884
Baltic Handysize Index BHSI 245 256 -4.30 -49.80 488
Baltic Dirty Tanker Index BDTI 897 1,016 -11.71 1.36 885
Baltic Clean Tanker Index BCTI 707 716 -1.26 -8.77 775
TANKERS Ticker 1/15/2016 1/8/2016 Change % 52 wk
high
52 wk
low 1/2/2015
3-Month
Avg. Vol.
Ardmore Shipping Corp ASC $9.20 $10.83 -15.05% $14.79 $9.01 $12.00 321,211
Capital Product Partners LP CPLP $3.73 $4.74 -21.31% $9.94 $3.67 $7.97 539,933
DHT Holdings Inc DHT $5.51 $7.10 -22.39% $8.90 $5.51 $7.71 1,777,620
Euronav NV EURN $10.09 $12.07 -16.40% $16.32 $10.09 N/A 730,833
Frontline Ltd/Bermuda FRO $2.03 $2.45 -17.14% $3.54 $2.03 $2.51 2,456,444
Gener8 Maritime Inc GNRT $6.35 $7.99 -20.53% $14.37 $6.20 N/A 215,277
KNOT Offshore Partners KNOP $10.89 $13.88 -21.54% $26.42 $10.87 $23.21 125,854
Navios Acquisition NNA $2.07 $2.48 -16.53% $4.33 $2.07 $3.76 412,630
Navios Midstream Partners NAP $8.15 $8.66 -5.89% $17.70 $6.77 $13.39 107,465
Nordic American NAT $13.03 $14.65 -11.06% $17.27 $9.41 $10.21 1,827,108
Overseas Shipholding OSGB $2.84 $3.14 -9.55% $4.76 $2.84 $5.28 37,480
Scorpio Tankers Inc STNG $5.74 $6.55 -12.37% $11.55 $5.69 $8.54 2,549,853
Teekay Offshore Partners LP TOO $3.52 $4.68 -24.79% $24.42 $3.39 $26.00 929,590
Teekay Tankers Ltd TNK $4.23 $5.50 -23.09% $8.39 $4.22 $5.22 2,539,528
Top Ships TOPS $0.25 $0.30 -16.67% $1.26 $0.25 $1.11 20,537
Tsakos Energy Navigation Ltd TNP $5.66 $6.79 -16.64% $10.32 $5.64 $6.96 541,584

10
Tuesday, January 19, 2016 (Week 3)
CAPITAL MARKETS DATA
LPG/LNG Ticker 1/15/2016 1/8/2016 Change % 52 wk
high
52 wk
low 1/2/2015
3-Month
Avg. Vol.
Dynagas LNG Partners DLNG $7.31 $9.06 -19.32% $20.68 $6.86 $17.23 140,944
GasLog Ltd GLOG $6.34 $7.47 -15.13% $23.41 $6.34 $20.08 935,008
Gaslog Partners GLOP $11.13 $12.91 -13.79% $29.28 $10.99 $26.41 164,192
Golar LNG Ltd GLNG $13.56 $15.91 -14.77% $50.85 $13.26 $35.71 1,847,665
Golar LNG Partners LP GMLP $10.18 $11.70 -12.99% $29.70 $8.66 $31.93 527,022
Hoegh LNG Partners HMLP $13.58 $17.13 -20.72% $23.25 $12.84 $20.48 47,456
Navigator Gas NVGS $12.01 $12.28 -2.20% $22.06 $11.44 $20.19 208,533
StealthGas Inc GASS $2.72 $2.89 -5.88% $7.02 $2.63 $6.33 48,242
Teekay LNG Partners LP TGP $9.99 $11.97 -16.54% $40.69 $9.01 $42.91 587,285
MIXED FLEET Ticker 1/15/2016 1/8/2016 Change % 52 wk
high
52 wk
low 1/2/2015
3-Month
Avg. Vol.
Euroseas Ltd ESEA $2.36 $2.45 -3.67% $8.40 $2.31 $7.53 3,914
Ship Finance International Ltd SFL $13.40 $15.48 -13.44% $17.69 $13.30 $14.67 817,171
Teekay Corp TK $6.18 $7.89 -21.67% $50.88 $5.89 $50.05 2,215,555
MLPs Ticker 1/15/2016 1/8/2016 Change % 52 wk
high
52 wk
low 1/2/2015
3-Month
Avg. Vol.
Capital Product Partners CPLP $3.73 $4.74 -21.31% $9.94 $3.67 $7.97 539,933
Dynagas LNG Partners DLNG $7.31 $9.06 -19.32% $20.68 $6.86 $17.23 140,944
GasLog Partners GLOP $11.13 $12.91 -13.79% $29.28 $10.99 $26.41 164,192
Golar LNG Partners LP GMLP $10.18 $11.70 -12.99% $29.70 $8.66 $31.93 527,022
Hoegh LNG Partners HMLP $13.58 $17.13 -20.72% $23.25 $12.84 $20.48 47,456
Knot Offshore Partners KNOP $10.89 $13.88 -21.54% $26.42 $10.87 $23.21 125,854
Navios Maritime Midstream NAP $8.15 $8.66 -5.89% $17.70 $6.77 $13.39 107,465
Navios Partners NMM $1.92 $2.37 -18.99% $13.89 $1.78 $11.01 1,060,199
Teekay Offshore TOO $3.52 $4.68 -24.79% $24.42 $3.39 $26.00 929,590
Teekay LNG TGP $9.99 $11.97 -16.54% $40.69 $9.01 $42.91 587,285
OFFSHORE DRILL RIGS Ticker 1/15/2016 1/8/2016 Change % 52 wk
high
52 wk
low 1/2/2015
3-Month
Avg. Vol.
Atwood Oceanics ATW $6.07 $8.54 -28.92% $35.35 $5.83 $28.67 3,750,256
Diamond Offshore Drilling DO $16.91 $18.33 -7.75% $36.95 $16.72 $37.23 2,676,853
Ensco International ESV $10.30 $12.79 -19.47% $31.93 $9.80 $30.17 6,302,218
Hercules Offshore HERO $1.12 $1.81 -38.12% $276.79 $1.12 $276.79 75,527
Noble Corp. NE $7.79 $9.10 -14.40% $19.51 $7.77 $16.84 8,532,385
Ocean Rig UDW Inc ORIG $1.24 $1.41 -12.06% $9.29 $1.21 $9.42 1,070,325
Pacific Drilling PACD $0.35 $0.64 -46.06% $4.86 $0.35 $4.71 615,867
Rowan Companies RDC $12.19 $14.34 -14.99% $24.88 $11.89 $23.72 3,220,178
Seadrill Ltd. SDRL $2.34 $2.82 -17.02% $15.00 $2.33 $12.01 9,052,274
Transocean RIG $9.86 $10.75 -8.28% $21.39 $9.55 $18.12 10,476,684
Vantage Drilling Company VTGDF $0.00 $0.00 -52.24% $0.60 $0.00 $0.49 2,281,070
CONTAINERS Ticker 1/15/2016 1/8/2016 Change % 52 wk
high
52 wk
low 1/2/2015
3-Month
Avg. Vol.
Box Ships Inc TEUFF $0.12 $0.16 -23.42% $1.06 $0.12 $0.89 110,756
Costamare Inc CMRE $6.93 $8.19 -15.38% $20.35 $6.72 $17.61 248,801
Danaos Corp DAC $4.82 $5.16 -6.59% $6.62 $4.57 $5.57 30,708
Diana Containerships Inc DCIX $0.54 $0.66 -18.88% $2.66 $0.51 $2.03 88,139
Global Ship Lease Inc GSL $1.79 $2.51 -28.69% $6.29 $1.79 $4.65 119,924
Seaspan Corp SSW $14.06 $14.63 -3.90% $20.77 $14.06 $18.39 295,724

11
Tuesday, January 19, 2016 (Week 3)
OFFSHORE SUPPLY Ticker 1/15/2016 1/8/2016 Change % 52 wk
high
52 wk
low 1/2/2015
3-Month
Avg. Vol.
Gulfmark Offshore GLF $2.82 $3.16 -10.76% $21.83 $2.60 $24.80 574,568
Hornback Offshore HOS $7.34 $8.40 -12.62% $24.73 $7.01 $24.77 1,140,103
Nordic American Offshore NAO $3.60 $4.29 -16.08% $11.61 $3.56 $12.51 179,385
Tidewater TDW $5.49 $5.91 -7.11% $33.24 $5.22 $32.33 1,577,111
Seacor Holdings CKH $44.45 $45.92 -3.20% $77.65 $43.93 $74.10 147,641
OSLO-Listed Shipping Comps
(currency in NOK) Ticker 1/15/2016 1/8/2016 Change %
52 wk
high
52 wk
low 1/2/2015
3-Month
Avg. Vol.
Golden Ocean GOGL $6.79 $6.60 2.88% $44.80 $5.68 N/A N/A
Stolt-Nielsen Ltd. SNI $95.25 $102.50 -7.07% $142.50 $94.75 $124.50 34,953
Frontline Ltd. FRO $17.80 $21.85 -18.54% $28.93 $17.75 $19.40 3,308,582
Jinhui Shpg. & Trans JIN $5.97 $6.75 -11.56% $14.40 $5.58 $12.50 64,859
Odfjell (Common A Share) ODF $26.30 $26.80 -1.87% $29.50 $18.60 $31.00 109,151
American Shipping Co. AMSC $23.50 $24.30 -3.29% $43.97 $23.30 $33.30 112,518
Hoegh LNG HLNG $86.25 $90.75 -4.96% $132.50 $76.00 $84.75 125,292
I.M. Skaugen IMSK $1.90* $1.95 -2.56% $3.95 $1.87 $4.68 25,569
Western Bulk WBULK $1.35 $1.40 -3.57% $4.50 $1.27 $4.51 148,488
*As of 1/14/2016.

12
Tuesday, January 19, 2016 (Week 3)
Shipping Equities: The Week in Review SHIPPING EQUITIES UNDERPERFORM THE BROADER MARKET
During last week, shipping equities underperformed the broader market, with the Capital Link Maritime Index
(CLMI), a composite index of all US listed shipping stocks, down 12.14%, compared to the S&P 500 dropping
2.17%, Nasdaq decreasing 3.34%, and Dow Jones Industrial Average (DJII) diminishing 2.19%.
Container stocks were the best performers during last week, with Capital Link Container Index down 3.31%,
followed by Capital Link LNG/LPG Index decreasing 12.00%. Dry Bulk equities were the least performer during
last week, with Capital Link Dry Bulk Index falling 27.02%.
During last week, Dry Bulk shipping stocks underperformed the physical market, with Baltic Dry Index (BDI)
diminishing 13.05%, compared to the Capital Link Dry Bulk Index slumping 27.02%.
During last week, Baltic Dirty Tanker Index (BDTI) decreased 11.71%, and Baltic Clean Tanker Index (BCTI)
dropped 1.26%, compared to Capital Link Tanker Index falling 16.23%.
The Trading Statistics supplied by KCG Holdings, Inc. provide details of the trading performance of each
shipping stock and analyze the market’s trading momentum and trends for the week and year-to-date.
The objective of the Capital Link Maritime Indices is to enable investors, as well as all shipping market
participants, to better track the performance of listed shipping stocks individually, by sector or as an industry.
Performance can be compared to other individual shipping stocks, to their sector, to the broader market, as well
as to the physical underlying shipping markets or other commodities. The Indices currently focus only on
companies listed on US Exchanges providing a homogeneous universe. They are calculated daily and are
based on the market capitalization weighting of the stocks in each index. In terms of historical data, the indices
go back to January 2, 2005, thereby providing investors with historical performance.
There are seven indices in total; the Capital Link Maritime Index comprised of all 45 listed shipping stocks, and
six Sector Indices, the CL Dry Bulk Index, the CL Tanker Index, the CL Container Index, the CL LNG / LPG
Index, the CL Mixed Fleet Index and the CL Maritime MLP Index.
The Index values are updated daily after the market close and can be accessed at
www.CapitalLinkShipping.com or at or www.MaritimeIndices.com. They can also be found through the
Bloomberg page “CPLI” and Reuters.
CAPITAL MARKETS DATA
Get your message across to
36,000 weekly recipients around the globe
Join a select group of shipping & financial industry’s advertisers by promoting your
brand with Capital Link’s Shipping Weekly Markets Report.
For additional advertising information and a media kit, please contact/email:
Capital Link at +1 212 661-7566 or [email protected]

13
Tuesday, January 19, 2016 (Week 3)
MARITIME INDEX DAILY COMPARISON CHARTS (52 -WEEK )
*SOURCE: BLOOMBERG
CAPITAL MARKETS DATA
*Teekay Corp was removed from the Capital Link Tanker Index on Aug 28, 2014.

14
Tuesday, January 19, 2016 (Week 3)
Custom Statistics Prepared Weekly for Capital Link Shipping
BROAD MARKET
Percent Change of Major Indexes for the Week Ending Friday, January 15, 2016
Name Symbol Close Net Gain Percent Gain
S&P 500 Index SPX 1880.29 -41.74 -2.17%
Dow Jones Industrial Average Index INDU 15988.08 -358.37 -2.19%
Russell 1000 Index RUI 1038.02 -25.53 -2.40%
Russell 3000 Index RUA 1103.34 -28.24 -2.50%
Nasdaq-100 Index NDX 4141.08 -129.70 -3.04%
Nasdaq Composite Index COMPX 4488.42 -155.21 -3.34%
Russell 2000 Index RUT 1007.84 -38.36 -3.67%
Dow Jones Transportation Index TRAN 6689.06 -257.30 -3.70%
SHIPPING INDUSTRY DATA (43 Companies)
Moving Averages
• 2.50% closed > 10D Moving Average.
• 2.50% closed > 50D Moving Average.
• 2.50% closed > 100D Moving Average.
• 0.00% closed > 200D Moving Average.
Top Downside Momentum* (Issues with the greatest 100 day
downward momentum*)
*Momentum: (100D % change) + 1.5*(50D % change) + 2.0*(10D
% change) for each stock then sort all names that have a negative value in ascending order and report the top 10.
Symbol Close Weekly %
Change
50-Day %
Change
SB 0.35 -23.91% -88.67%
SALT 3.65 -25.36% -76.05%
GLBS 0.09 -55.00% -85.00%
TOO 3.52 -24.79% -77.58%
TK 6.18 -21.67% -81.07%
NM 0.86 -13.13% -57.00%
EGLE 2.05 -22.93% -65.02%
SBLK 0.43 -2.27% -71.14%
NMM 1.92 -18.99% -65.53%
DSX 2.48 -28.32% -60.76%
SHIPPING MARKETS
Top Consecutive Lower Closes
Symbol Close Up Streak
DAC 4.82 -2
FRO 2.03 -2
SHIP 1.64 -2
NAT 13.03 -2
NNA 2.07 -2
DCIX 0.54 -3
GLBS 0.09 -3
PRGN 0.11 -3
CPLP 3.73 -5
GSL 1.79 -6

15
Tuesday, January 19, 2016 (Week 3)
Top Largest Weekly Trading Losses
Symbol Close One
Week Ago
Today
Close
Net
Change % Change
GLBS 0.2 0.09 -0.11 -55.00%
SHIP 2.89 1.64 -1.25 -43.25%
GSL 2.51 1.79 -0.72 -28.69%
DSX 3.46 2.48 -0.98 -28.32%
SALT 4.89 3.65 -1.24 -25.36%
TOO 4.68 3.52 -1.16 -24.79%
SB 0.46 0.35 -0.11 -23.91%
TNK 5.5 4.23 -1.27 -23.09%
EGLE 2.66 2.05 -0.61 -22.93%
DHT 7.1 5.51 -1.59 -22.39%
Top Largest Monthly Trading Gains (A month has been
standardized to 20 trading days)
Top Largest Monthly Trading*Losses (A month has been
standardized to 20 trading days)
Stocks Nearest to 52-Week Highs Stocks Nearest To 52-Week Lows
Symbol Close One
Month Ago
Today
Close
Net
Change % Change
FREE 0.02 0.4405 0.42 2102.50%
PRGN 0.1 0.11 0.01 10.00%
DRYS 0.1 0.101 0.00 1.00%
Symbol Close One
Month Ago
Today
Close
Net
Change % Change
TK 17.49 6.18 -11.31 -64.67%
SB 0.95 0.35 -0.60 -63.16%
GLBS 0.21 0.09 -0.12 -57.14%
TOO 7.8 3.52 -4.28 -54.87%
SALT 7.92 3.65 -4.27 -53.91%
SHIP 3.35 1.64 -1.71 -51.04%
TGP 18.38 9.99 -8.39 -45.65%
TNK 7.34 4.23 -3.11 -42.37%
GSL 2.94 1.79 -1.15 -39.12%
EGLE 3.34 2.05 -1.29 -38.62%
Symbol 52W Low % Away
ESEA 2.30 2.61%
GLOG 6.17 2.76%
GSL 1.74 2.87%
TNP 5.40 4.81%
KNOP 10.37 5.01%
DAC 4.56 5.70%
SB 0.33 6.06%
DLNG 6.76 8.14%
SFL 12.29 9.07%
MATX 33.43 10.94%
SHIPPING MARKETS
Symbol 52W High % Away
NAT 16.61 -21.54%
SFL 17.32 -22.62%
DAC 6.70 -28.06%
SSW 20.02 -29.76%
MATX 53.18 -30.26%
DHT 8.59 -35.89%
ASC 14.67 -37.31%
FRO 3.61 -43.73%
TNP 10.34 -45.24%
NVGS 22.31 -46.17%

16
Tuesday, January 19, 2016 (Week 3)
SHIPPING MARKETS
Symbol Close Net % Change Run Rate
SALT 3.65 -25.36% 9.2847
SHIP 1.64 -43.25% 8.2740
FREE 0.4405 4305.00% 2.6919
DSX 2.48 -28.32% 2.4715
SFL 13.4 -13.44% 2.3210
TK 6.18 -21.67% 2.2033
GSL 1.79 -28.69% 2.1793
GLBS 0.09 -55.00% 2.0786
STNG 5.74 -12.37% 2.0475
CPLP 3.73 -21.31% 1.9651
Top Stocks with Highest Weekly Volume Run Rate* > 1
*The Volume Run Rate is calculated by divided the current week's volume by the average volume over the last 20 weeks. For example, a run rate of 2.0 means the stock traded twice its average volume.
Top Year-To-Date Gainers
Symbol YTD Decline %
SALT -63.09%
SB -56.79%
SHIP -51.76%
NM -50.86%
TOO -45.68%
DSX -42.99%
EGLE -41.76%
DRYS -40.59%
TNK -38.52%
TK -37.39%
The following are the 43 members of this group: Symbol - Name: ASC – Ardmore Shipping Corp; BALT - Baltic Trading Ltd; CMRE - Costamare Inc;
CPLP - Capital Product Partners LP; DAC - Danaos Corp; DCIX - Diana Containerships Inc.; DHT - DHT Maritime Inc; DLNG - Dynagas LNG Partners LP;
DRYS - DryShips Inc; DSX - Diana Shipping Inc; EGLE - Eagle Bulk Shipping Inc; ESEA - Euroseas Ltd; FREE - FreeSeas Inc; FRO - Frontline Ltd; GASS -
StealthGas Inc; GLBS - Globus Maritime Limited; GLNG - Golar LNG Ltd; GLOG - GasLog Ltd.; GMLP - Golar LNG Partners LP; GSL - Global Ship Lease
Inc; KNOP - KNOT Offshore Partners LP; MATX - Matson, Inc.; NAT - Nordic American Tanker Shipping; NM - Navios Maritime Holdings Inc; NMM - Navios
Maritime Partners LP; NNA - Navios Maritime Acquisition Corp; NVGS - Navigator Holdings Ltd.; PRGN - Paragon Shipping Inc; SALT - Scorpio Bulkers; SB -
Safe Bulkers Inc; SBLK - Star Bulk Carriers Corp; SFL - Ship Finance International Ltd; SHIP - Seanergy Maritime Holdings Corp; SSW - Seaspan Corp;
STNG - Scorpio Tankers Inc; TEU - Box Ships Inc.; TGP - Teekay LNG Partners LP; TK - Teekay Corp; TNK - Teekay Tankers Ltd; TNP - Tsakos Energy
Navigation Ltd; TOO - Teekay Offshore Partners LP; TOPS - TOP Ships Inc; VLCCF - Knightsbridge Tankers Ltd;
DISCLAIMER: This communication has been prepared by Knight Capital Americas LLC.s ("KCA"), trading, market making and/or sales personnel
(collectively, "KCG Traders") to compile commentary received from either particular KCG Traders providing their personal perspectives on the markets,
sectors and general news or third party sources. The information set forth above has been obtained from or based upon sources believed by the KCG Traders
to be reliable, but each KCG Trader and KCG (as defined below) does not represent or warrant its accuracy or completeness and is not responsible for losses
or damages arising out of errors or omissions, delays in the receipt of this information, or any actions taken in reliance thereon. Opinions, historical price(s) or
value(s) are as of the date and, if applicable, time indicated. KCG does not accept any responsibility to update any opinions or other information contained in
this communication. The information provided herein is not intended to provide a sufficient basis on which to make an investment decision. It is intended only
to provide observations and views of individual KCG Traders, which may be different from, or inconsistent with, the observations and views of KCG and/or its
affiliates, officers, directors and/or employees (including other KCG Traders). The communication is for your general information only and is not an offer or
solicitation to buy or sell any security or product. KCG Traders may, from time to time express indications of interest to potentially buy or sell a particular
security. These indications of interest are not firm orders or quotes, and may not be current. Accordingly, please contact your KCG representative if you have
any interest or questions relating to these indications of interest or to any information provided herein. KCA most likely makes a market in the securities
mentioned in this document. KCG and/or its affiliates, officers, directors and employees, including persons involved in the preparation or issuance of this
material, may, from time to time, have long or short positions in, or buy or sell (on a principal basis or otherwise) the securities mentioned in this
communication which may be inconsistent with the views expressed herein. Questions regarding the information presented herein or to request a copy of this
document should be referred to your KCG Representative.
This document is a product of KCG Holdings, Inc. ("KCG") and its affiliates and subsidiaries (collectively "KCG"). KCG Holdings, Inc. ("KCG") is comprised of
trading and related entities under common control such as Knight Capital Americas, LLC, KCG Europe Limited (a U.K. registered broker-dealer) and KCG
Hotspot FX LLC.
© 2013 KCG Holdings, Inc. ("KCG") All rights reserved. Provided by Knight Capital Americas LLC, member of FINRA and SIPC.

17
Tuesday, January 19, 2016 (Week 3)
17
Global Shipping Company Bond Data
Contributed by Stifel Nicolaus & Co, Inc.
SHIPPING MARKETS

18
Tuesday, January 19, 2016 (Week 3)
Aggregate Price Index
15 Jan ±∆ ±%Capesize 38 q -2 -6.1%
Panamax 35 q 0 -0.9%
Supramax 38 q -1 -3.5%
Handysize 46 q -1 -1.6%
M-O-M change
SHIPPING MARKETS
Contributed by
Allied Shipbroking Inc
48 Aigialeias Str. 151 25 Maroussi
Athens, Greece
Phone: +30 2104524500
Website: www.allied-shipbroking.gr
Weekly Market Report Market Analysis
With the big news this weekend being the lifting of Iran’s international
sanctions, the crude oil market was spooked by the prospects of further
supply glut hitting the scene, while many see this 12 year low in crude oil
prices being only a small chapter in the upcoming developments to be
noted over the course of the year.
During the course of the past 12 months, crude oil supply brought about
mainly by the decision by OPEC members has created one of the
biggest and longest price drops in the history of crude oil trading. This
strategy, which has been in part to help OPEC members regain market
share, has come at a great cost and despite all efforts many of the
targeted high priced oil producers continue to operate. It is by no
coincidence that the U.S. announced that it would lift its ban on oil
exports, allowing its excess production from shale oil to spill over to
other markets.
In the midst of all this OPEC now forecasts that oil supply from non-
member countries will post a decline of 660,000 barrels per day within
2016 (almost double its previous forecast) as the new price reality of
below US$ 30 a barrel (the price fell to US$28 a barrel which is the
lowest recorded since 2003) squeezes ever more producers out of
competition. Yet many in the market see this as only a start to further
price drops, with many quoting a new price norm of around US$ 20 per
barrel. This in part will surely be supported by the supply impact of
500,000 bpd coming into play within 2016. At the same time estimates
for demand within 2016 is set to be close to the 1.26 million bpd, a
notable slowdown from the 1.54 million bpd estimated for 2015.
All this turns up the heat on most of these OPEC member countries
many of which have seen a large chunk of their cash reserves sapped
and most of their generous welfare systems (most notably in recent
news reports the situation faced by Venezuela). Saudi Arabia as well as
the rest of the five Gulf Cooperation Council members have announced
that they are preparing to announce considerable spending cuts in their
annual government budgets, while many expect an even tougher year in
terms of their earnings. All this points to extended tensions that will arise
during the next biannual meeting of the OPEC members, while it will be
hard to ascertain the true success of their original decision back in 2014.
What is becoming ever certain now is that it will be hard to head back to
the hay days of US$ 80-140 per barrel, while the recent advancements
in oil production brought about by the technologies behind shale oil has
meant that production is more flexible to price changes then ever before.
The big challenge moving forward will be a demand one, with strategic
reserves by most countries having peaked to some of their highest
levels ever, it is difficult to see were all this new excess supply will be
absorbed. What’s more is that despite the fact that energy commodity
prices have dipped by so much, there is still plentiful efforts being put on
new technologies which provide ever higher efficiencies in consumption,
leaving all to believe that we will likely see a stagnation in demand over
the coming years. This stagnation is by no means limited to the OECD
economies but is likely to effect the fast paced emerging economies as
well, as they leapfrog straight from their low oil consumption per capita
onto oil consumption dictated by energy efficient technologies which are
equally available. After all, all new cars purchased in China or India are,
if not on par, of almost equal energy efficiency ratings as the ones being
bought in the U.S. and Europe.
Dry Bulk Freight Market
Secondhand Market
Newbuilding Market
Demolition Market
Tanker Freight Market
15 Jan ±∆ ±%BDI 373 q -56 -13.1%
BCI 198 q -145 -42.3%
BPI 381 q -53 -12.2%
BSI 394 q -36 -8.4%
BHSI 245 q -11 -4.3%
W-O-W change
15 Jan ±∆ ±%BDTI 897 q -119 -11.7%
BCTI 707 q -9 -1.3%
W-O-W change
Avg Price Index (main 5 regions)
15 Jan ±∆ ±%Dry 222 q -3 -1.3%
Wet 242 q -3 -1.2%
W-O-W change
Aggregate Price Index
15 Jan ±∆ ±%Bulkers 79 q 0 -0.2%
Cont 100 u 0 0.0%
Tankers 101 q 0 -0.1%
Gas 100 u 0 0.0%
M-O-M change
VLCC 112 p 4 3.3%
Suezmax 101 p 3 3.4%
Aframax 123 p 3 2.4%
MR 129 p 7 5.8%
19
Tuesday, January 19, 2016 (Week 3)
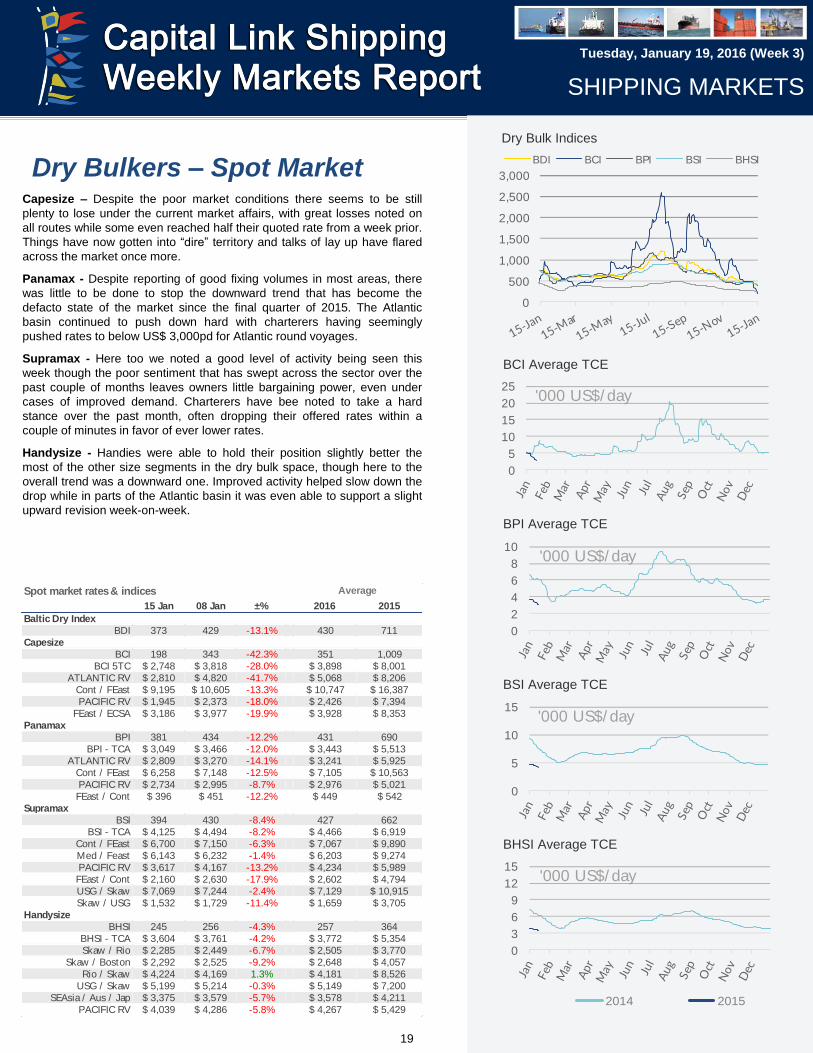
Dry Bulkers – Spot Market
SHIPPING MARKETS
Capesize – Despite the poor market conditions there seems to be still
plenty to lose under the current market affairs, with great losses noted on
all routes while some even reached half their quoted rate from a week prior.
Things have now gotten into “dire” territory and talks of lay up have flared
across the market once more.
Panamax - Despite reporting of good fixing volumes in most areas, there
was little to be done to stop the downward trend that has become the
defacto state of the market since the final quarter of 2015. The Atlantic
basin continued to push down hard with charterers having seemingly
pushed rates to below US$ 3,000pd for Atlantic round voyages.
Supramax - Here too we noted a good level of activity being seen this
week though the poor sentiment that has swept across the sector over the
past couple of months leaves owners little bargaining power, even under
cases of improved demand. Charterers have bee noted to take a hard
stance over the past month, often dropping their offered rates within a
couple of minutes in favor of ever lower rates.
Handysize - Handies were able to hold their position slightly better the
most of the other size segments in the dry bulk space, though here to the
overall trend was a downward one. Improved activity helped slow down the
drop while in parts of the Atlantic basin it was even able to support a slight
upward revision week-on-week.
2014 2015
BCI Average TCE
BPI Average TCE
BSI Average TCE
BHSI Average TCE
Dry Bulk Indices
15 Jan 08 Jan ±% 2016 2015
Baltic Dry Index
BDI 373 429 -13.1% 430 711
Capesize
BCI 198 343 -42.3% 351 1,009
BCI 5TC $ 2,748 $ 3,818 -28.0% $ 3,898 $ 8,001
ATLANTIC RV $ 2,810 $ 4,820 -41.7% $ 5,068 $ 8,206
Cont / FEast $ 9,195 $ 10,605 -13.3% $ 10,747 $ 16,387
PACIFIC RV $ 1,945 $ 2,373 -18.0% $ 2,426 $ 7,394
FEast / ECSA $ 3,186 $ 3,977 -19.9% $ 3,928 $ 8,353
Panamax
BPI 381 434 -12.2% 431 690
BPI - TCA $ 3,049 $ 3,466 -12.0% $ 3,443 $ 5,513
ATLANTIC RV $ 2,809 $ 3,270 -14.1% $ 3,241 $ 5,925
Cont / FEast $ 6,258 $ 7,148 -12.5% $ 7,105 $ 10,563
PACIFIC RV $ 2,734 $ 2,995 -8.7% $ 2,976 $ 5,021
FEast / Cont $ 396 $ 451 -12.2% $ 449 $ 542
Supramax
BSI 394 430 -8.4% 427 662
BSI - TCA $ 4,125 $ 4,494 -8.2% $ 4,466 $ 6,919
Cont / FEast $ 6,700 $ 7,150 -6.3% $ 7,067 $ 9,890
Med / Feast $ 6,143 $ 6,232 -1.4% $ 6,203 $ 9,274
PACIFIC RV $ 3,617 $ 4,167 -13.2% $ 4,234 $ 5,989
FEast / Cont $ 2,160 $ 2,630 -17.9% $ 2,602 $ 4,794
USG / Skaw $ 7,069 $ 7,244 -2.4% $ 7,129 $ 10,915
Skaw / USG $ 1,532 $ 1,729 -11.4% $ 1,659 $ 3,705
Handysize
BHSI 245 256 -4.3% 257 364
BHSI - TCA $ 3,604 $ 3,761 -4.2% $ 3,772 $ 5,354
Skaw / Rio $ 2,285 $ 2,449 -6.7% $ 2,505 $ 3,770
Skaw / Boston $ 2,292 $ 2,525 -9.2% $ 2,648 $ 4,057
Rio / Skaw $ 4,224 $ 4,169 1.3% $ 4,181 $ 8,526
USG / Skaw $ 5,199 $ 5,214 -0.3% $ 5,149 $ 7,200
SEAsia / Aus / Jap $ 3,375 $ 3,579 -5.7% $ 3,578 $ 4,211
PACIFIC RV $ 4,039 $ 4,286 -5.8% $ 4,267 $ 5,429
Spot market rates & indices Average
0
5
10
15
20
25'000 US$/ day
0
2
4
6
8
10'000 US$/ day
0
5
10
15'000 US$/ day
0
3
6
9
12
15'000 US$/ day
0
500
1,000
1,500
2,000
2,500
3,000
BDI BCI BPI BSI BHSI

20
Tuesday, January 19, 2016 (Week 3)
Tankers – Spot Market
SHIPPING MARKETS
Crude Oil Carriers - It seems as though the recent drop in crude oil prices
has caused a bit of a disturbance in the market for crude oil tankers, with
demand dropping notably during the past couple of days. Although this may
well have been a temporary shock influenced in part by the lifting of the
sanctions on Iran, there has started to emerge a sense that the January
program may well fall short on expectations keeping these new downward
revised figures in place over the next two weeks give or take.
Oil Products - On the basis of mixed emotions in the crude oil space,
product tankers have also felt a halt in their previous upward momentum,
with demand slowing down this week giving a sense that the market held
over flat in terms of given rates. However with the given repositioning that
has been reported in the market this past week, expectations are that
things may turn around soon possibly giving ample room for another round
of freight rate improvements over the coming weeks.
2014 2015
VLCC Average TCE
Suezmax Average TCE
Aframax Average TCE
MR Average TCE
Tanker Indices
15 Jan 08 Jan ±% 2016 2015
Baltic Tanker Indices
BDTI 897 1,016 -11.7% 980 820
BCTI 707 716 -1.3% 700 637
VLCC
WS 43.42 55.67 -22.0% 54.72 36.36
$/ day $ 32,796 $ 45,649 -28.2% $ 46,548 $ 31,968
WS 61.04 95.61 -36.2% 89.17 64.43
$/ day $ 54,104 $ 92,461 -41.5% $ 84,315 $ 61,629
WS 59.79 94.11 -36.5% 87.80 63.09
$/ day $ 48,198 $ 81,773 -41.1% $ 78,334 $ 68,288
WS 74.50 106.50 -30.0% 99.05 72.72
$/ day $ 101,820 $ 150,087 -32.2% $ 138,799 $ 76,589
SUEZMAX
WS 95.00 115.00 -17.4% 109.09 81.13
$/ day $ 63,072 $ 78,256 -19.4% $ 73,748 $ 46,404
WS 122.05 141.59 -13.8% 129.63 91.34
$/ day $ 54,712 $ 66,323 -17.5% $ 60,430 $ 46,346
AFRAMAX
WS 113.33 117.22 -3.3% 116.42 111.01
$/ day $ 33,608 $ 35,159 -4.4% $ 35,632 $ 37,053
WS 128.94 146.50 -12.0% 140.25 112.26
$/ day $ 29,672 $ 34,204 -13.2% $ 33,394 $ 31,406
WS 131.94 118.33 11.5% 123.63 133.63
$/ day $ 28,692 $ 23,555 21.8% $ 26,353 $ 37,962
WS 92.78 94.44 -1.8% 93.20 92.57
$/ day $ 36,254 $ 36,345 -0.3% $ 36,774 $ 43,406
DPP
WS 145.00 150.00 -3.3% 142.95 138.77
$/ day $ 37,415 $ 39,135 -4.4% $ 36,809 $ 30,727
WS 140.00 139.50 0.4% 138.35 122.73
$/ day $ 41,809 $ 41,742 0.2% $ 41,270 $ 30,281
WS 122.88 140.38 -12.5% 133.81 110.54
$/ day $ 31,393 $ 36,668 -14.4% $ 35,551 $ 35,804
WS 101.89 115.39 -11.7% 113.69 108.70
$/ day $ 22,753 $ 27,670 -17.8% $ 28,587 $ 35,902
CPP
WS 136.67 148.28 -7.8% 139.72 105.50
$/ day $ 30,842 $ 33,510 -8.0% $ 32,001 $ 28,796
WS 154.09 149.54 3.0% 147.88 134.68
$/ day $ 19,693 $ 18,503 6.4% $ 18,645 $ 18,755
WS 147.50 155.00 -4.8% 143.64 134.05
$/ day $ 28,607 $ 30,540 -6.3% $ 27,685 $ 22,099
WS 100.00 110.00 -9.1% 109.84 96.47
$/ day $ 10,795 $ 12,092 -10.7% $ 12,583 $ 12,481
BALTIC-UKC
ARA-USG
Spot market rates & indices Average
MED-MED
CONT-USAC
USG-CONT
MEG-USG
MEG-SPORE
WAF-USG
BSEA-MED
MEG-SPORE
MEG-JAPAN
WAF-USAC
NSEA-CONT
CARIBS-USG
CARIBS-USAC
SEASIA-AUS
MEG-JAPAN
CARIBS-USAC
250
450
650
850
1,050
1,250
BDTI BCTI
-10
10
30
50
70
90
110'000 US$/ day
-25
0
25
50
75
100'000 US$/ day
0
20
40
60
80
100'000 US$/ day
5
10
15
20
25
30
35'000 US$/ day

21
Tuesday, January 19, 2016 (Week 3)
Period Charter Market
SHIPPING MARKETS
Capesize Panamax
Dry Bulk 12 month period charter rates (USD ‘000/day)
VLCC Suezmax
Tanker 12 month period charter rates (USD ‘000/day)
Supramax Handysize
Aframax MR
Latest indicative Dry Bulk Period Fixtures
Latest indicative Tanker Period Fixtures
last 5 years
15 Jan 11 Dec ±% Min Avg Max
Capesize
$ 6,500 $ 7,000 -7.1% $ 6,450 $ 15,724 $ 31,450
$ 8,000 $ 7,000 14.3% $ 6,950 $ 16,270 $ 25,200
Panamax
$ 5,500 $ 6,500 -15.4% $ 5,450 $ 10,949 $ 18,700
$ 6,750 $ 7,250 -6.9% $ 6,700 $ 11,457 $ 16,700
Supramax
$ 5,000 $ 6,000 -16.7% $ 4,950 $ 10,794 $ 15,950
$ 7,000 $ 7,250 -3.4% $ 6,950 $ 11,048 $ 15,450
Handysize
$ 5,500 $ 6,000 -8.3% $ 5,450 $ 8,893 $ 12,950
$ 6,000 $ 6,500 -7.7% $ 5,950 $ 9,411 $ 12,950
36 months
12 months
36 months
36 months
12 months
36 months
12 months
12 months
Dry Bulk period market TC rates
last 5 years
15 Jan 11 Dec ±% Min Avg Max
VLCC
$ 57,500 $ 55,000 4.5% $ 18,000 $ 28,996 $ 57,750
$ 44,000 $ 42,500 3.5% $ 22,000 $ 31,097 $ 45,000
Suezmax
$ 40,000 $ 38,000 5.3% $ 15,250 $ 22,472 $ 42,500
$ 33,500 $ 33,500 0.0% $ 17,000 $ 24,126 $ 35,000
Aframax
$ 30,000 $ 30,000 0.0% $ 13,000 $ 17,463 $ 30,000
$ 26,750 $ 26,750 0.0% $ 14,750 $ 18,628 $ 27,000
MR
$ 19,000 $ 18,500 2.7% $ 12,500 $ 14,833 $ 21,000
$ 18,000 $ 17,500 2.9% $ 14,000 $ 15,204 $ 18,250
12 months
36 months
Tanker period market TC rates
12 months
36 months
12 months
36 months
12 months
36 months
5
7
9
11
13
15
17
19
21
5
6
7
8
9
10
11
12
5
6
7
8
9
10
11
5
6
7
8
9
10
20
25
30
35
40
45
50
55
60
15
20
25
30
35
40
45
12
17
22
27
32
1213141516171819202122
M/ T ''BW UTAH'', 299500 dwt, built 2001, $44,500, for 18 months trading,
to SHELL
M/ T ''GERD KNUTSEN'', 155000 dwt, built 1996, $30,000, for 6+3 months
trading, to ISS
M/ T ''PANTELIS'', 114500 dwt, built 2004, $37,000, for 3 months trading,
to LITASCO
M/ T ''HAFNIA LEO'', 52300 dwt, built 2013, $18,850, for 1 year trading, to
TRAFIGURA
M/ T ''HAFNIA ROBINSON'', 40000 dwt, built 2004, $17,500, for 1 year
trading, to TRAFIGURA
M/ V ''ALIKI'', 180435 dwt, built 2005, dely Baoshan spot, $5,300, for 11/ 14
months trading, to SwissMarine
M/ V ''NIREFS'', 75311 dwt, built 2001, dely Rizhao 12/ 16 Jan, $4,600, for
11/ 14 months trading, to Transgrain
M/ V ''GENEVA QUEEN'', 81361 dwt, built 2012, dely retro Dhamra 19
December, $5,100, for 4/ 6 months trading, to Phaethon
M/ V ''NCS BEIJING '', 81508 dwt, built 2009, dely Kinuura 20/ 25 Jan,
$5,400, for 4/ 8 months trading, to Chart Not Rep
M/ V ''MONA FRONTIER'', 172865 dwt, built 2001, dely Lanshan 20/ 25
Jan, $4,250, for 4/ 6 months trading, to Rio Tinto

22
Tuesday, January 19, 2016 (Week 3)
Indicative Tanker Values (US$ million)
15 Jan 11 Dec ±% Min Avg Max
VLCC
310k dwt Resale 100.0 100.0 0.0% 80.0 95.3 108.5
310k dwt 5 year old 83.0 80.0 3.8% 55.0 70.0 87.0
250k dwt 10 year old 58.0 55.0 5.5% 33.8 45.9 62.0
250k dwt 15 year old 39.5 38.0 3.9% 16.9 27.1 41.0
Suezmax
160k dwt Resale 70.0 70.0 0.0% 53.0 63.9 73.0
150k dwt 5 year old 62.0 60.0 3.3% 38.0 49.8 62.0
150k dwt 10 year old 44.5 42.0 6.0% 24.0 33.5 44.5
150k dwt 15 year old 23.0 22.0 4.5% 14.0 18.6 23.3
Aframax
110k dwt Resale 56.0 56.0 0.0% 39.0 48.4 57.0
110k dwt 5 year old 47.5 46.0 3.3% 27.0 36.7 47.5
105k dwt 10 year old 32.0 31.0 3.2% 16.0 23.9 33.0
105k dwt 15 year old 17.5 17.0 2.9% 8.0 13.0 18.5
MR
52k dwt Resale 38.5 38.5 0.0% 32.0 36.9 39.3
52k dwt 5 year old 31.0 29.0 6.9% 22.0 26.9 31.0
45k dwt 10 year old 21.0 19.5 7.7% 14.0 17.8 21.0
45k dwt 15 year old 13.0 12.0 8.3% 9.0 10.9 13.5
last 5 years
Indicative Dry Bulk Values (US$ million)
15 Jan 11 Dec ±% Min Avg Max
Capesize
180k dwt Resale 36.0 39.0 -7.7% 36.0 49.4 65.0
170k dwt 5 year old 23.0 26.0 -11.5% 23.0 38.2 53.0
170k dwt 10 year old 13.0 13.0 0.0% 13.0 26.4 39.0
150k dwt 15 year old 7.5 7.5 0.0% 7.5 16.0 25.0
Panamax
82k dwt Resale 24.0 24.5 -2.0% 24.0 31.3 43.0
76k dwt 5 year old 11.5 11.5 0.0% 11.5 22.9 36.8
76k dwt 10 year old 7.3 7.3 0.0% 7.3 17.1 29.3
74k dwt 15 year old 4.5 4.5 0.0% 4.5 11.3 22.0
Supramax
62k dwt Resale 21.0 23.0 -8.7% 21.0 29.3 36.8
58k dwt 5 year old 11.0 11.0 0.0% 11.0 22.0 30.5
52k dwt 10 year old 6.5 6.5 0.0% 6.5 16.1 24.3
52k dwt 15 year old 4.5 4.5 0.0% 4.5 10.8 19.0
Handysize
37k dwt Resale 19.0 19.0 0.0% 19.0 23.5 30.0
32k dwt 5 year old 9.0 9.0 0.0% 9.0 18.1 25.5
32k dwt 10 year old 7.0 7.5 -6.7% 7.0 13.6 19.5
28k dwt 15 year old 4.0 4.0 0.0% 4.0 9.2 14.5
last 5 years
Secondhand Asset Values
SHIPPING MARKETS
On the dry bulk side, there was a fair amount of activity being reported in
the capesize sector, with a number of deals indicating to another
softening in prices. With talks now mounting in terms of putting up
tonnage for cold lay-up, it looks as though things are set to get even
tougher over the coming days with further price drops now clearly in
sight.
On the tanker side, there was a slight calm with lower then average
volume seen in reported transactions, while there still seems to be a
strong holding for the firm prices to continue. Freight rates may have
stumbled slightly this week, yet it looks as though there is still firm
demand out there for tonnage. Expectations are not for any great
increases in terms of pricing, especially given the fact that more and
more will be driven towards the new ordering option given the price gap
quoted under the current market.
Capesize Panamax
Supramax Handysize
VLCC Suezmax
Aframax MR
Price movements of 5 year old Dry Bulk assets
Price movements of 5 year old Tanker assets
-12%
-34%
-26%
-36%-40%
-35%
-30%
-25%
-20%
-15%
-10%
-5%
0%
1 month diff 3 months diff6 months diff 12 months diff
+0%
-36%
-30%
-39%-45%
-40%
-35%
-30%
-25%
-20%
-15%
-10%
-5%
0%
1 month diff 3 months diff6 months diff 12 months diff
+0%
-31%
-24%
-42%-45%
-40%
-35%
-30%
-25%
-20%
-15%
-10%
-5%
0%
1 month diff 3 months diff6 months diff 12 months diff
+0%
-31% -31%
-44%-50%
-45%
-40%
-35%
-30%
-25%
-20%
-15%
-10%
-5%
0%
1 month diff 3 months diff6 months diff 12 months diff
+4% +4%
-1%
+4%
-1%
-1%
0%
1%
1%
2%
2%
3%
3%
4%
4%
1 month diff 3 months diff6 months diff 12 months diff
+3% +3% +3% +3%
0%
1%
1%
2%
2%
3%
3%
4%
1 month diff 3 months diff6 months diff 12 months diff
+3%
+6%
+4%
+3%
0%
1%
2%
3%
4%
5%
6%
1 month diff 3 months diff6 months diff 12 months diff
+7% +7%
+15% +15%
0%
2%
4%
6%
8%
10%
12%
14%
16%
1 month diff 3 months diff6 months diff 12 months diff

23
Tuesday, January 19, 2016 (Week 3)
Newbuilding Market
SHIPPING MARKETS
Tanker Newbuilding Prices
Dry Bulk Newbuilding Prices
Demolition Market
Wet Scrap Prices
Dry Scrap Prices
Indicative Dry Prices ($/ ldt) last 5 years
15 Jan 08 Jan ±% Min Avg Max
Indian Sub Continent
Bangladesh 280 285 -1.8% 250 413 515
India 275 280 -1.8% 270 420 525
Pakistan 275 280 -1.8% 270 416 510
Far East Asia
China 125 125 0.0% 120 320 455
Mediterranean
Turkey 155 155 0.0% 155 271 355
Indicative Wet Prices ($/ ldt) last 5 years
15 Jan 08 Jan ±% Min Avg Max
Indian Sub Continent
Bangladesh 305 310 -1.6% 280 435 540
India 300 305 -1.6% 295 443 550
Pakistan 300 305 -1.6% 295 440 525
Far East Asia
China 145 145 0.0% 140 338 485
Mediterranean
Turkey 160 160 0.0% 160 281 355
Indicative Dry NB Prices (US$ million) last 5 years
15 Jan 11 Dec ±% Min Avg Max
Dry Bulkers
Capesize (180,000dwt) 46.0 46.5 -1.1% 46.0 50.6 58.0
Kamsarmax (82,000dwt) 26.3 26.3 0.0% 26.3 29.2 36.5
Panamax (77,000dwt) 25.8 25.8 0.0% 25.8 28.3 34.5
Ultramax (64,000dwt) 24.3 24.3 0.0% 24.3 26.5 31.0
Handysize (37,000dwt) 20.5 20.5 0.0% 20.5 22.5 26.5
Container
Post Panamax (9,000teu) 88.0 88.0 0.0% 76.5 86.6 94.5
Panamax (5,200teu) 56.0 56.0 0.0% 48.6 57.2 65.6
Sub Panamax (2,500teu) 29.5 29.5 0.0% 29.5 33.2 41.0
Feeder (1,700teu) 20.5 20.5 0.0% 20.5 24.6 29.4
Indicative Wet NB Prices (US$ million) last 5 years
15 Jan 11 Dec ±% Min Avg Max
Tankers
VLCC (300,000dwt) 93.5 94.0 -0.5% 89.5 96.4 104.0
Suezmax (160,000dwt) 63.0 63.0 0.0% 55.8 61.5 66.0
Aframax (115,000dwt) 52.0 52.0 0.0% 47.0 51.9 56.0
LR1 (75,000dwt) 45.8 45.8 0.0% 40.5 43.9 47.0
MR (56,000dwt) 35.5 35.5 0.0% 33.5 35.3 37.3
Gas
LNG 160k cbm 199.0 199.0 0.0% 198.0 200.1 203.0
LPG LGC 80k cbm 77.0 77.0 0.0% 70.0 74.1 80.0
LPG MGC 55k cbm 67.5 67.5 0.0% 62.0 64.5 68.5
LPG SGC 25k cbm 45.0 45.0 0.0% 41.0 44.1 46.5
10
20
30
40
50
60
Capesize Panamax Supramax Handysize
US$ million
30
50
70
90
110
VLCC Suezmax Aframax LR1 MR
US$ million
100150200250300350400450500
Bangladesh India Pakistan China Turkey
US$/ ldt
100150200250300350400450500
Bangladesh India Pakistan China Turkey
US$/ ldt

24
Tuesday, January 19, 2016 (Week 3)
First Watch: Stifel Shipping Weekly Contributed by
Stifel Nicolaus & CO, Inc.
Stifel
One Financial Plaza,
501 North Broadway
St. Louis, MO 63102
Phone: (314) 342-2000 Website: www.stifel.com
VLCC spot rates were in free fall last week, down 41% to about $52,000 per day, and were down even further over the weekend. During the
first several weeks of the year, there has been a drop in Middle Eastern spot fixtures down to an average of 17 contracts relative to 19 per
week in December. However, this Mid-January fall in rates is seasonally typical. In fact, for 7 of the 8 last years, following strong rates in early
January, spot VLCC rates fell into mid-late February. Refineries ease their buying activity ahead of the spring maintenance season, causing a
temporary reduction in tanker demand. Thus we would not anticipate the weakness in rates to persist. However, we also do not believe there
is likely to be an instant rebound to December levels. This week's lifting of Iranian sanctions should result in growing oil volumes from Iran,
but as we have noted extensively in the past, the nation's underutilized domestic fleet should initially more than make up for incremental
volume, resulting in no material impact on international tanker demand. Also, while the potential for floating storage to take advantage of
contango in the oil prices is possible, at the moment the six-month spread in Brent prices is slightly lower than $5 per barrel. We estimate at
current time charter rates the spread would need to be closer to $7 per barrel to see floating storage develop. Consequently, we would expect
VLCC spot rates to stabilize in the near term before gradually rising in the spring.
SHIPPING MARKETS

25
Tuesday, January 19, 2016 (Week 3)
25
Global Shipping Fleet & Orderbook Statistics
Contributed by Stifel Nicolaus & Co, Inc.
SHIPPING MARKETS

26
Tuesday, January 19, 2016 (Week 3)
Breakup as Backup What is the scrapping potential of the crude fleet?
Tanker owners are currently doing fairly well, certainly compared to
their colleagues in the dry bulk market. However, history shows that
such markets do not last forever and when the downturn comes, it is
important that the supply side can respond quickly. The tanker
orderbook is not excessively large in historical terms but still requires
a sizable demand increase to maintain a balanced market in the
coming years. Scrapping is the other variable that influences the
supply side of the equation and the question is: What is the potential
for scrapping to help balance the market in the coming years?
The tanker fleet is fairly modern, following the single hull phase out of
the early 2000’s and the ordering wave during the great commodity
boom from 2004 to 2008. This is illustrated by relatively modest
scrapping in the last several years (Fig 1).
There are an estimated 92 crude tankers of Aframax size and larger
that will be 20 years and older by the end of the year. The current
VLCC fleet consists of 653 vessels with an additional 128 (20% of the
fleet) on order. 26 of the trading VLCCs will reach an age of 20 years
or older by the end of this year and could be considered potential
scrapping candidates in the coming years to offset the fleet growth.
The Suezmax fleet consists of 426 tankers with 129 vessels (30%) on
order but only 21 vessels were built prior to 1997. For Aframaxes, we
are adding older coated tankers to the crude fleet as these vessels
are more likely to be employed in the dirty trades as the economics of
maintaining the coatings worsen, especially in a poor market. The
Aframax fleet has 594 crude tankers and an orderbook of 92 vessels
(15%). The number of Aframax tankers older than 20 years is about
half the orderbook at 45 crude tankers including five coated tankers.
Ship owners will continue to trade vessels as long as they feel they
can do so profitably. A major decision point is when the vessel needs
to perform a special survey, typically when it reaches 20 years and
again at 22.5 years and 25 years of age. The special survey of such
older vessels often requires the investment of up to several million
dollars in steel, coatings, etc., dependent on the condition of the
vessel. When these special surveys come due during a poor market,
owners are more likely to sell the vessel for demolition.
In order to assess the likelihood of tankers heading for the scrap
yard, it is useful to examine the employment opportunities of such
tonnage. AIS data shows that the vast majority of these vessels are
trading East of Suez. With the exception of 8 PDV Marina Aframaxes,
involved in Venezuelan crude trades, and some Eastern
Mediterranean and Black Sea voyages, most of these vessels rarely
show up in the Western hemisphere, where terminal operators are
often stricter on age limitations. During the last couple of months,
about 21 of these tankers were predominantly involved in IntraMiddle
Eastern trades. Of the remaining tankers, 23 vessels have been
trading predominantly from the Middle East to Asia, mainly India,
China or Korea. Another 10 vessels were employed in Intra-Asian
trades.
Another way to look at the data is to examine the special survey
dates. Based on Q88 data and estimates, we project that 47 tankers
will have a special survey due in 2016 and an additional 17 in 2017.
Contributed by
Poten & Partners, Inc.
805 Third Avenue
New York, NY 10022
Phone: (212) 230 - 2000
Website: www.poten.com
SHIPPING MARKETS
In 2018, 23 tankers will have their next special survey (and likely
some of the vessels with a survey in 2016). For four vessels, Q88
data states that their next surveys are in 2019 and later. If the market
remains strong in 2016, most, if not all, of the scheduled tankers will
undergo their special survey, and in the years thereafter, a smaller
number will face the decision.
We forecast a continuation of the strong market for 2016, as high
crude production will continue to require transportation and
inefficiencies related to high oil inventories persist. After this year, we
foresee weakening freight rates as deliveries increasingly affect
tonnage supply and oil inventories start to wind down. Based on the
profile of the fleet, it does not look like there are enough scrapping
candidates to offset the deliveries and quickly support the rates.

27
Tuesday, January 19, 2016 (Week 3)
SHIPPING MARKETS
Contributed by
Charles R. Weber Company, Inc.
Greenwich Office Park One,
Greenwich, CT 06831
Phone: (203) 629 - 2300
Website: www.crweber.com
Tanker Market – Weekly Highlights

28
Tuesday, January 19, 2016 (Week 3)
Tanker Market – Weekly Highlights
SHIPPING MARKETS
VLCC
The VLCC market was markedly weaker this week with rates in the
Middle East and West Africa markets falling sharply with those in the
Caribbean market following suit after a lag. Demand in the Middle East
market rose modestly, rising to a tally of 25 from last week’s 22 while
that in the West Africa market remained uninspiring with just two
observed. The January Middle East loading program came to an
abrupt end with just 114 cargoes (below our expected range of
117‐122), which contributed to the negative pressure. More importantly,
demand for February West Africa stems by Asian buyers has remained
soft, which was reflected this week in the sustaining of light VLCC
chartering activity. The lower West Africa demand reduced the number
of units drawn from the Middle East market; this contributed to a wider
supply/demand imbalance which was augmented by the appearance of
more units on position lists (including a number of previously “hidden”
positions) as well as the continued presence of disadvantaged units
(recently ex‐dry dock, newbuildings, older units), which proved taxing on
owners.
We note that with the January program concluded and just two
additional January positions likely to be drawn to the West Africa market,
the surplus of Middle East positions has driven up to 18 units. This
represents a strong increase on the implied surplus as viewed just a
week ago and a considerable increase relative to 2015‐end month
average of nine surplus units – as well as the most overall since
September 2014. The near‐term demand outlook soured after
indications as to the Basrah loading program materialized and showed a
light first‐decade (despite a stronger overall daily supply rate), which
further compounded the impact on rates. As a result of these factors,
the market witnessed a 45% w/w contraction of average earnings to
~$57,299/day. Despite the extent thereof, earnings are only a modest
14% below the 2016 average which represents a strong disconnect from
the wide supply/demand imbalance. While we believe that February
loadings will ultimately lead to a tighter balance and stronger rates by
mid‐February, the present balance suggests that further rate losses are
likely to materialize in the interim.
Middle East
Assessed rates to the Far East averaged ws68.8 (basis 2016 flat rates),
off 44.9 points, w/w, while corresponding TCEs lost 44% to an average
of ~$60,742/day. The present assessment of ws57.5 yields
~$48,964/day. Rates to the USG via the Cape lost 18.2 points w/w to an
assessed ws48.5. Triangulated Westbound earnings dropped 17%
w/w to an average of ~$97,082/day while present assessments yield
~$84,141/day.
Atlantic Basin
Rates in the West Africa market continued to trail those in the Middle
East and the WAFR‐FEAST route lost 24.3 points w/w to an assessed
average of ws86. Corresponding TCEs dropped 25% to an average of
~$76,123/day. The present assessment of ws70 yields ~$60,030/day.
The Caribbean market was more active this week; however, with more
units appearing on position lists and the earlier demand lull having left
more units uncovered rates were under negative pressure which was
compounded by some ballast units from Asia considering voyages from
the Caribbean instead of the Middle East. This saw rates on the
CBS‐SPORE route drop $1.25m to $6.50m lump sum.

29
Tuesday, January 19, 2016 (Week 3)
Tanker Market – Weekly Highlights
SHIPPING MARKETS
Suezmax
The pace of demand in the West Africa Suezmax market was largely
unchanged from last week with the fixture tally rising by one to
fourteen. While the final decade of the January program has been more
active than the prior two (26 final decade vs. 16 and 18, respectively, for
the first and second decades), the Suezmax‐oriented cargo volume for
the month stands 14% below the 4Q15 average as the region’s spot
market serviced exports appear to have declined by around 650,000
b/d. The slower Suezmax demand for January loadings has left a
greater number of units available as charterers progress into February
dates which – together with softer rates in the Black Sea and Caribbean
markets – exerted negative pressure on rates this week. The
WAFR‐UKC route shed 12.5 points to conclude at ws97.5 and given the
growing supply/demand imbalance is likely to observe markedly lower
rates from early during the upcoming week as this becomes more
apparent to participants.
Aframax
Rates in the Caribbean Aframax market commenced the week stronger
on last week’s elevated demand and a measure of date‐sensitivity for
early cargoes worked this week, which boosted rates for some cargoes
with carryover effects for participants working normal dates. However,
as the week progressed, demand levels moderated – this week’s
regional fixture tally of sixteen represented a 35% w/w decline – and
some earlier fixtures failed leading to a small number of prompt positions
and an easing of rates from the week’s earlier highs. Having touched as
high as ws135, the CBS‐USG route concluded at ws130, representing a
weekly gain of 12.5 points. Lingering uncertainty over fog‐related port
closures in the region likely prevented a further late‐paring of the week’s
gains; once the full impact on itineraries is better known at the start of
the upcoming week, the extent thereof is likely to prove influential on the
direction rates take at the start of the week.
Panamax
Rates on the CBS‐USG route commenced the week with a correcting of
last week’s observed gains, losing 10 points to ws140. However, with
demand remaining fairly active this week, rates gained modestly to
conclude at ws145. With supply/demand levels appearing balanced,
rates should remain around through the start of the upcoming week.
MR
The USG MR market commenced on a particularly strong note as
charterers rushed to cover requirements following the holidays. Though
activity levels eased by mid‐week, the week concluded with a fixture tally
of 45 – representing a seven‐week high. Of this week’s tally, five units
were bound for points in Europe (+1, w/w), 24 units were bound for

30
Tuesday, January 19, 2016 (Week 3)
Tanker Market – Weekly Highlights
SHIPPING MARKETS
MR
The USG MR market was slower this week, leading rates to ease from
last week’s late gains. A total of 24 fixtures were reported, including
three bound for points in Europe (‐ 40% w/w), 15 were bound for points
in Latin America and the Caribbean (‐48% w/w), and the remainder were
for alternative locations or have yet to be determined. Due to fresh rate
gains in the European market, units freeing on the US East Coast were
more firmly oriented to ballasts to Europe (which was particularly true for
ice‐classed units given greater ice coverage in the Baltic area); this led
to a reduction of available USG positions with the two‐week forward
view thereof dropping 18% w/w to 28 units. This likely factored into a
halting of USG‐area rate erosion by the close of the week. The
USG‐UKC route lost 10 points at mid‐week and settled at ws100 while
the USG‐CBS route lost $15k to conclude at $510k lump sum. Soaring
PADD 3 distillate inventories (EIA data shows a 2.3 Mb/d build last
week) have failed to support greater Europe‐bound cargo flows given
high inventories in Europe, which could continue to limit export demand
during the upcoming week (but could simultaneous limit overall export
demand destruction as refineries progress into seasonal
maintenance). Meanwhile, surprisingly sluggish US gasoline demand
– the first two weeks of 2016 have shown a 5.8% y/y decline – could
also limit trans‐Atlantic gasoline voyages from Europe and thus ballast
interest from USAC positions (last week gasoline inventories in the
PADD 1B Central Atlantic sub‐region rose by nearly 3 Mnbbls). On this
basis, the pace of forward seasonal rate erosion could be relatively
muted during the upcoming weeks with only modest downside potential
during the upcoming week for ex‐USG voyages likely.
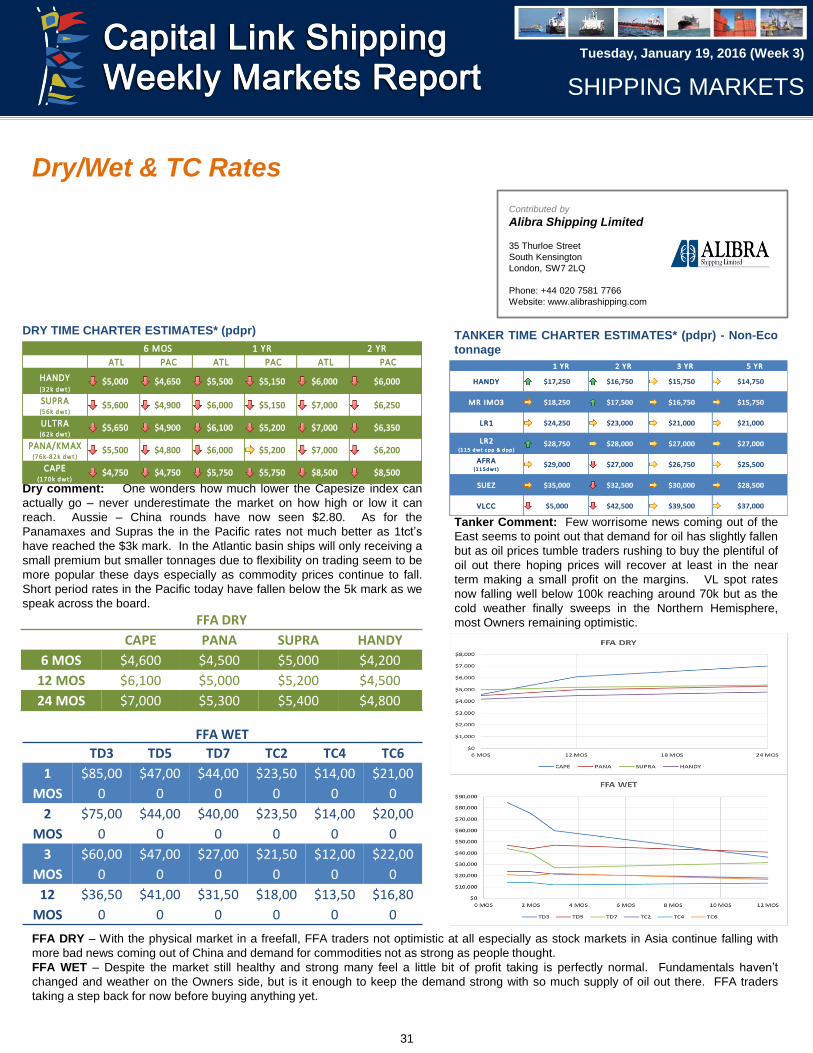
31
Tuesday, January 19, 2016 (Week 3)
TANKER TIME CHARTER ESTIMATES* (pdpr) - Non-Eco
tonnage
Tanker Comment: Few worrisome news coming out of the
East seems to point out that demand for oil has slightly fallen
but as oil prices tumble traders rushing to buy the plentiful of
oil out there hoping prices will recover at least in the near
term making a small profit on the margins. VL spot rates
now falling well below 100k reaching around 70k but as the
cold weather finally sweeps in the Northern Hemisphere,
most Owners remaining optimistic.
Contributed by
Alibra Shipping Limited
35 Thurloe Street
South Kensington
London, SW7 2LQ
Phone: +44 020 7581 7766
Website: www.alibrashipping.com
Dry/Wet & TC Rates
SHIPPING MARKETS
DRY TIME CHARTER ESTIMATES* (pdpr)
Dry comment: One wonders how much lower the Capesize index can
actually go – never underestimate the market on how high or low it can
reach. Aussie – China rounds have now seen $2.80. As for the
Panamaxes and Supras the in the Pacific rates not much better as 1tct’s
have reached the $3k mark. In the Atlantic basin ships will only receiving a
small premium but smaller tonnages due to flexibility on trading seem to be
more popular these days especially as commodity prices continue to fall.
Short period rates in the Pacific today have fallen below the 5k mark as we
speak across the board.
FFA DRY – With the physical market in a freefall, FFA traders not optimistic at all especially as stock markets in Asia continue falling with
more bad news coming out of China and demand for commodities not as strong as people thought.
FFA WET – Despite the market still healthy and strong many feel a little bit of profit taking is perfectly normal. Fundamentals haven’t
changed and weather on the Owners side, but is it enough to keep the demand strong with so much supply of oil out there. FFA traders
taking a step back for now before buying anything yet.
ATL PAC ATL PAC ATL PAC
HANDY (3 2 k dw t )
$5,000 $4,650 $5,500 $5,150 $6,000 $6,000
SUPRA (5 6 k dw t )
$5,600 $4,900 $6,000 $5,150 $7,000 $6,250
ULTRA (6 2 k dw t )
$5,650 $4,900 $6,100 $5,200 $7,000 $6,350
PANA/KMAX (7 6 k-8 2 k d w t )
$5,500 $4,800 $6,000 $5,200 $7,000 $6,200
CAPE (1 7 0 k d w t )
$4,750 $4,750 $5,750 $5,750 $8,500 $8,500
6 MOS 1 YR 2 YR
1 YR 2 YR 3 YR 5 YR
HANDY $17,250 $16,750 $15,750 $14,750
MR IMO3 $18,250 $17,500 $16,750 $15,750
LR1 $24,250 $23,000 $21,000 $21,000
LR2 (1 1 5 dw t c pp & dpp)
$28,750 $28,000 $27,000 $27,000
AFRA (1 1 5 dw t )
$29,000 $27,000 $26,750 $25,500
SUEZ $35,000 $32,500 $30,000 $28,500
VLCC $5,000 $42,500 $39,500 $37,000
FFA DRY
CAPE PANA SUPRA HANDY
6 MOS $4,600 $4,500 $5,000 $4,200
12 MOS $6,100 $5,000 $5,200 $4,500
24 MOS $7,000 $5,300 $5,400 $4,800
FFA WET
TD3 TD5 TD7 TC2 TC4 TC6
1
MOS
$85,00
0
$47,00
0
$44,00
0
$23,50
0
$14,00
0
$21,00
0
2
MOS
$75,00
0
$44,00
0
$40,00
0
$23,50
0
$14,00
0
$20,00
0
3
MOS
$60,00
0
$47,00
0
$27,00
0
$21,50
0
$12,00
0
$22,00
0
12
MOS
$36,50
0
$41,00
0
$31,50
0
$18,00
0
$13,50
0
$16,80
0
