capital budget fy 2019 - carroll county public schools · this document presents the approved...
TRANSCRIPT

CAPITAL BUDGET FY 2019
& CAPITAL IMPROVEMENT PROGRAM
FY 2020 - 2024
REQUEST
Board of Education 10/11/2017

BOARD OF EDUCATION
Devon M. Rothschild, President
Bob E. Lord, Vice-President
Virginia R. Harrison, Member
Marsha B. Herbert, Member
Donna M. Sivigny, Member
Matthew E. Johnson, Student Representative
SUPERINTENDENT
Stephen H. Guthrie

TABLE OF CONTENTS
Superintendent’s Letter ............................................................................................................................. 1 INTRODUCTION Capital Budget and Capital Improvement Program ...................................................................... 2 Capital Budget Process ................................................................................................................. 2 Project Identification .................................................................................................................... 3 Prioritization of Projects ............................................................................................................... 4 Project Budget Development ........................................................................................................ 4 CAPITAL BUDGET AND CAPITAL IMPROVEMENT PROGRAM FY 2019 Capital Budget Request ................................................................................................. 7 FY 2020 – 2024 Capital Improvement Program Request ............................................................ 8 Project Description and Justification Forms ................................................................................. 9 APPENDICES Appendix A: CCPS Student Enrollment Projections 2017-2026 .............................................. 35 Appendix B: School Capacity and Utilization Numbers 2017-2026......................................... 36 Appendix C: Relocatable Classroom Placements 2017-2018 School Year .............................. 52

1
FROM: Stephen H. Guthrie, Superintendent SUBJECT: Proposed FY2019 Capital Budget Request, Proposed FY 2020-2024 Capital
Improvement Program This document presents the approved FY2019 Capital Budget Request and Proposed FY 2020-2024 Capital Improvement Program (CIP) for Carroll County Public Schools. The purpose of this plan is to address the facility needs identified in the 2017-2026 Educational Facilities Master Plan. This plan takes into consideration current and projected student enrollments, the age and condition of facilities, and the current and future needs of the instructional program. The projects detailed in this document have been identified as necessary to maintain adequate school facilities in order to deliver a quality instructional program. Some highlights of the FY 2019 Capital Budget and FY 2020- 2024 CIP Request are:
• The FY 2019 Capital Budget request is for $16,464,000. The County share of this request is $9,475,000 and the State share is $6,989,000.
• The FY 2020 – 2024 CIP request total is $147,953,000. The anticipated County share of
these projects is $78,622,000 based on the State share being $69,331,000. • The cumulative total of the six year request (FY 2019 – 2024) is $164,417,000.
• The scheduling of school modernizations in this year’s request is based on the 2017
update to the March 2008 Report on Physical and Functional Assessments of Schools Constructed Prior to 1980.
A public hearing was held on Wednesday September 27 at 7:00 p.m. in the Charles I. Ecker Boardroom located at 125 North Court Street Westminster, Maryland 21157. This hearing provided an opportunity for interested parties to provide input on this CIP Budget Request. The Board of Education approved this document at its meeting on October 11, 2017 at 5:00 p.m. The approved Capital Budget and CIP Request will be forwarded to the Carroll County Commissioners and to the Maryland Public School Construction Program. Additional information may be obtained by calling Raymond Prokop, Director of Facilities, at 410-751-3177.

2
The Capital Budget and Capital Improvements Program Request This Capital Budget request is for school construction projects that are being requested for the next fiscal year. Funding for these projects is received from both the County and State. Once the County and State adopt their capital budgets, the funds for that fiscal year are transferred to Carroll County Public Schools (CCPS). The Capital Improvement Program (CIP) request refers to school projects that are scheduled to occur in the next five future fiscal years. An important distinction between the capital budget and the CIP is that the funding for projects included in the Capital Budget becomes part of the legally adopted budget, but the longer term CIP is not legally binding. As a result, it not unusual for projects included in the capital improvements program to change from year to year based on changes in the state and county fiscal picture, changes in enrollment trends, changes in the instructional program, and unanticipated changes in the condition of systems and equipment. The capital budget differs from the operating budget in that it is structured in terms of projects. Each project within the capital budget is a “mini budget” in itself, and the budget/funds may be spent over multiple fiscal years ending with the completion of the project. Capital Budget Projects are typically large in scope and address improvements and renewal of the school system’s physical plant. Although the capital and operating budgets are separate, the relationship between them is a critical consideration in the overall fiscal picture of CCPS. The capital budget impacts the operating budget in three ways. First the issuance of general obligation bonds, required to fund capital projects, creates the need to fund debt service payments in the operating budget. Second, a portion of the capital budget request is funded by current revenues, which are the same sources that fund the operating budget. Finally, new schools and additions create operating budget impacts due to increased costs for staff, utilities, maintenance, and other services. Capital Budget Process The Capital Budget process actually begins each year with the annual update of the Educational Facilities Master Plan. This document evaluates the facility needs of the system and identifies a calendar of projects to address these needs. This document is presented to the Board of Education in May each year, and is then approved in June for submission to the State by July 1. After the approval of the Educational Facilities Master Plan, the next step is for staff to develop the annual Capital Budget and CIP request in July and August. This document is presented to the Board of Education in August, and approved by the Board of Education in October of each year. Once the Board of Education approves the annual Capital Budget and CIP request, it is then submitted to the Carroll County Department of Management and Budget (DMB). The DMB staff reviews this request and presents their preliminary recommendation for capital projects to the Carroll County Planning and Zoning Commission in February. The Planning and Zoning Commission utilizes this information to make their recommendation for school projects to the

3
Board of Carroll County Commissioners. In early March, the DMB makes their final recommendations to the Commissioners. Also in March, the Commissioners hold work sessions with each agency to review their specific requests. The Commissioners then issue their Proposed Budget, and hold public hearings to receive public comments regarding this document. After the hearings are held, the Commissioners make any necessary adjustments and the budget is adopted at the end of May each year. In order to receive State funds for school construction, CCPS must meet the requirements of the Maryland Public School Construction Program regarding the submittal of the Capital Improvement Program. The first step in this process is that CCPS must submit or amend its Educational Facilities Master Plan by July 1. After this submission in July, the next step is to submit the Capital Improvement Program Request to the Maryland Public School Construction Program at the beginning of October. This CIP request consists of three major parts: Current Planning Approval Requests, Current Funding Approval Requests, and Future Project Request. Current Planning Approval Requests are for projects that CCPS wants to begin design on in the next fiscal year. Due to the fact that the State does not contribute funds to the design of school construction projects, design must be funded through County capital funds. State Planning Approval does give CCPS a commitment for future state funding for a specific project. Current Funding Requests are projects for which State funding is being requested for the next fiscal year. Future Project Requests include projects that are scheduled to be state requests in the next five future fiscal years. Once the CIP has been submitted to the Public School Construction Program, their staff then makes recommendations to the Interagency Committee on School Construction (IAC) for project approvals. IDENTIFYING PROJECTS This 2019 Capital Budget and 2020-2024 Capital Improvement Program Request is based on the facility needs identified in the 2017 - 2026 Educational Facilities Master Plan. The projects scheduled in this document address the need to modernize aging schools, the need to meet changing instructional philosophies, and the need for building system replacements.

4
PRIORITIZATION In order to communicate to both funding authorities the highest priority projects in the current budget request, projects are listed in priority order. Projects included in the Capital Budget Request are ranked in accordance with the following criteria:
1. Projects partially funded and currently in progress 2. Projects that renovate or replace facilities in a comprehensive manner to ensure that all
students are provided with a safe, orderly and modern learning environment. 3. Projects that include the replacement of critical building systems necessary to maintain
school operations. 4. Projects that improve the ability of a facility to accommodate the current instructional
program. 5. Projects that provide general improvements to increase the levels of efficiency in the
operation of school facilities. PROJECT BUDGET DEVELOPMENT Cost estimates for each project included in the Capital Improvement Program must be developed in order to make a request for funding. Depending on the project type, the method for developing the budget may vary. Most projects utilize a cost per square foot number to determine the construction cost of the project. Each year the Maryland Public School Construction Program publishes a cost per square foot number that is used for all state funded projects. The number utilized in this document is $302 per square foot for the building only, and $360 for the building with site development. Until a Construction Planning Committee is formed to develop the Educational Specifications for a new school or addition, it is difficult to determine how many square feet are needed for a project. As a result the initial square footage for a project is based on the square foot allowance per student published by the Maryland Public School Construction Program. The following are the square foot allowance per student based on optimum size school standards contained in the Educational Facilities Master Plan. Elementary School (Capacity = 600)
• 108 square feet per regular education student • 180 square feet per special education student
Middle School (Capacity = 750)
• 135 square feet per regular education student • 180 square feet per special education student

5
High School (Capacity = 1200)
• 187,350 square feet total for a school with a capacity between 1,151 to 1,249 • 200 square feet per special education student • 210 square feet per career and technology student
In addition to the cost to construct the building, each project also has necessary costs associated with it. Typically these other costs will be based on a percentage of the building construction cost. These percentages are evaluated against actual project bids annually to verify their validity. The following is a list of these additional items that make up the total project estimate
Site costs – 19% for new construction; 5% for renovations
Architect and Engineering Fees –
• New Schools and Renovations – 7% of the total construction and site budget. • HVAC Projects – 8% of total construction budget • Roofing Projects – 4% of total construction budget
Construction Management Fees –
• Pre-construction services – 2% of the total construction and site budget
Contingency
• New Construction – 5% of the total construction and site budget. • Renovation/Modernization/Addition – 7% of the total construction and site
budget.
Furniture and Equipment budget request is based on a percentage of the total building construction cost estimate depending on the type of project as listed below:
• Elementary School – 4% • Secondary School – 5% • Career & Technology – 10%
Other costs – Miscellaneous items, such as roads, utilities, agency review fees,
asbestos and lead abatement, impact fees, etc. will vary with project

6
Off-site Improvements – Any off-site improvement necessary for the school project (i.e. roads, water and sewer lines, etc.) will be performed by Carroll County Government

7
State Local State County Total StateRequest
For CountyRequest
ForTotal
Request1 1 Sandymount ES HVAC Replacement 418$ 418$ 2,716$ (SR) 1,999$ (SR) 4,715$ 2 2 Westminster HS Electrical System Renovation 160$ 160$ 1,180$ (SR) 820$ (SR) 2,000$ 3 3 Liberty HS Science Room Renovations 50$ 50$ 813$ (C) 724$ (C) 1,537$ 4 4 South Carroll HS Science Room Renovations 50$ 50$ 465$ (C) 417$ (C) 882$ 5 5 Sandymount ES Roof Replacement 842$ (SR) 660$ (SR) 1,502$ 6 6 Linton Springs ES Roof Replacement 973$ (SR) 763$ (SR) 1,736$
7 Career & Technology Center Project 100$ 100$ 700$ (P) 700$ 8 Winfield ES HVAC Replacement 515$ (P) 515$ 9 South Carroll HS Window Replacement 150$ (P) 150$
10 Taneytown ES Kindergarten Addition 115$ (P) 115$ 11 Cranberry Station ES Kindergarten Addition 92$ (P) 92$ 12 Security Improvements 630$ (C) 630$ 13 Technology Improvements 800$ (C) 800$ 14 Paving 865$ (C) 865$ 15 Relocatable Classroom Movement 175$ (C) 175$ 16 Barrier Free Modifications 50$ (C) 50$
-$ 778$ 778$ 6,989$ 9,475$ 16,464$
(S) = HVAC Scope Study(FS) = PSCP Required Feasibility Study(P) = Planning Approval [State] or Planning Funds [County] (SR) = Systemic Renovation(C) = Construction Funding(E) = Furniture & Equipment Funds
NOTE: All dollar figures are shown in thousands
FY 2019 CAPITAL IMPROVEMENT PROGRAM BUDGET REQUEST
Priority Prior Authorization/Allocation Fiscal Year 2019 Funding Request

8
Project Title State Local State Local State Local State Local State Local Total
ModernizationsCCCTC Project 4,700$ 4,264$ 3,300$ 27,692$ 19,244$ 59,200$ Westminster K-8 School 100$ 100$ Westminster West MS Modernization 70$ 4,651$ 4,721$
Roof ReplacementsCranberry Station ES - Roof Replacement 851$ 667$ 1,518$ Winfield ES - Roof Replacement 1,095$ 859$ 1,954$ Spring Garden ES - Roof Replacement 911$ 717$ 1,628$ Oklahoma Road MS - Roof Replacement 1,831$ 1,436$ 3,267$ Century HS - Roof Replacement 2,359$ 1,852$ 4,211$
-$
Winfield ES - System Replacement 3,892$ 2,866$ 6,758$ Spring Garden ES - System Replacement 439$ 3,321$ 2,444$ 6,204$ Oklahoma Road MS - System Replacement 659$ 4,984$ 3,668$ 9,311$ Northwest MS - System Replacement 589$ 4,456$ 3,279$ 8,324$ Carrolltowne ES - System Replacement 685$ 5,179$ 3,814$ 9,678$ Liberty HS - System Replacement 1,373$ 1,373$
Kindergarten AdditionsTaneytown ES Kindergarten Addition 981$ 868$ 1,849$ Cranberry Station ES Kindergarten Addition 783$ 690$ 1,473$ Friendship Valley ES Kindergarten Addition 190$ 1,612$ 1,330$ 3,132$ Sandymount ES Kindergarten Addition 95$ 807$ 664$ 1,566$
Science Room RenovationWestminster High 1,664$ 1,482$ 3,146$
Security Improvements 660$ 690$ 725$ 760$ 800$ 3,635$ Technology Improvements 825$ 1,730$ 875$ 500$ 900$ 4,830$ Paving 865$ 1,085$ 850$ 1,100$ 1,000$ 4,900$ Roofing Improvements 180$ 190$ 200$ 570$ Relocatable Classroom Movement 185$ 195$ 380$ Barrier Free Modifications 50$ 50$ 50$ 50$ 50$ 250$
Electrical Service UpgradesSykesville Middle Electrical Equipment Replacement 75$ 443$ 307$ 825$
Window ReplacementsSouth Carroll High Window Replacement 885$ 615$ 1,500$ Westminster High Window Replacement 150$ 885$ 615$ 1,650$
13,756$ 14,931$ 7,278$ 13,453$ 34,472$ $27,593 6,287$ 8,005$ 7,538$ 14,640$ 147,953$
Annual Requests
HVAC-Replacements
FY 2020-2024 CAPITAL IMPROVEMENT PROGRAM PLAN($ ,000 omitted)
FY2020 FY2021 FY2022 FY2023 FY2024

9
Sandymount ES - HVAC System Replacement
Project Description:
Project Justification:
BUDGET REQUEST FY19 FY20 FY21 FY22 FY23 FY24Prior
Allocation418,000
Land AcquisitionSite WorkConstruction 4,491,000Equipment/FurnishingsOther 224,000
TOTAL 4,715,000 418,000
SOURCES OF FUNDSCounty 1,999,000 418,000State PSCP 2,716,000
2,417,0002,716,000
04,491,000
0224,000
5,133,000
This project involves the replacement of the existing rooftop air handling units and terminal control units. The project will also include replacement of both the heating and cooling plants and associated piping and pumps located in the mechanical room. The existing pneumatic control system shall be replaced and upgraded to be electric/electronic actuation, direct digitally controlled and interlocked to the County Energy Mangement System. Although the electrical service is not anticipated to require an upgrade to accomodate the HVAC renovation, some of the aging electrical equipment does need replacing. New panelboards, sized as required for the new HVAC equipment, are recommended. The emergency generator will also need to be replaced with a new unit sized to accomodate the emergency loads and additional MEMA requirements required for State funding of the project.
The mechanical equipment was installed when the school was modernized in 1992. The age of this equipment will be 25 years old in 2017-18. The replacement of this aging equipment will provide a modern energy efficient mechanical system that meets the current Indoor Air Quality requirements for schools and provides a better learning environment for students and staff.
Total Project Cost
Engineering/Design 418,0000

10
Westminster High - Electrical Equipment Replacement
Project Description:
Project Justification:
BUDGET REQUEST FY19 FY20 FY21 FY22 FY23 FY24Prior
Allocation160,000
Land AcquisitionSite WorkConstruction 2,000,000Equipment/FurnishingsOther
TOTAL 2,000,000 160,000
SOURCES OF FUNDSCounty 820,000 160,000State PSCP 1,180,000
980,0001,180,000
02,000,000
00
2,160,000
This project involves the replacement of aging electrical equipment that is showing signs of failure. The scope includes the replacement of the existing Main Distribution Board, the replacement of the Sub Distribution Board, the replacement of the exsisting undersized emergency generator, the upgrading of 13 wire panels throughout the building and the installation of emergency and stand by power circuits.
The electrical systems in older schools are starting to have pieces of equipment that need to be replaced. At the same time, the dramatic increase of the use of technology equipment has created electrical demands that were not present when these older schools were designed. This increasing dependence on technology has also created certain emergency and stand-by power requirements that did not exist when these schools were constructed. This project will address all of these issues in a comprehensive manner.
Total Project Cost
Engineering/Design 160,0000

11
Liberty High - Science Room Renovation
Project Description:
Project Justification:
BUDGET REQUEST FY19 FY20 FY21 FY22 FY23 FY24Prior
Allocation50,000
Land AcquisitionSite WorkConstruction 1,344,000Equipment/Furnishings 108,000Other 85,000
TOTAL 1,537,000 50,000
SOURCES OF FUNDSCounty 724,000 50,000State PSCP 813,000
The modernization of the science facilities provides a learning environment more consistent with the laboratory experiences the students will experience after graduation. These science facilities will provide the environment necessary to deliver quality science instruction to meet the goals of the science program in the Carroll County Public Schools.
Total Project Cost
Engineering/Design 50,0000
This project is part of the Look of the Future High School Science Classroom state initiative. It involves the renovation of four science classrooms originally constructed in 1980 and the introduction of the Carroll County Public Schools’ technology component into these renovated science laboratory spaces.
774,000813,000
01,344,000
108,00085,000
1,587,000

12
South Carroll High - Science Room Renovation
Project Description:
Project Justification:
BUDGET REQUEST FY19 FY20 FY21 FY22 FY23 FY24Prior
Allocation50,000
Land AcquisitionSite WorkConstruction 770,000Equipment/Furnishings 62,000Other 50,000
TOTAL 882,000 50,000
SOURCES OF FUNDSCounty 417,000 50,000State PSCP 465,000
This project is part of the Look of the Future High School Science Classroom state initiative. It involves the renovation of science classrooms originally constructed in 1967 and the introduction of the Carroll County Public Schools’ technology component into these renovated science laboratory spaces.
The modernization of the science facilities provides a learning environment more consistent with the laboratory experiences the students will experience after graduation. These science facilities will provide the environment necessary to deliver quality science instruction to meet the goals of the science program in the Carroll County Public Schools.
Total Project Cost
Engineering/Design 50,00000
770,00062,00050,000
932,000
467,000465,000

13
Roof Replacement - Sandymount Elementary
Project Description:
Project Justification:
BUDGET REQUEST FY19 FY20 FY21 FY22 FY23 FY24Prior
Allocation56,000
Land AcquisitionSite WorkConstruction 1,391,000Equipment/FurnishingsOther 55,000
TOTAL 1,502,000
SOURCES OF FUNDSCounty 660,000State PSCP 842,000
Replacement of 63,232 square feet of roofing, associated tapered insulation system, and roof drains and flashings. The 2019 request is for design and construction funding.
Replacement of the roof is required to protect building structure, building components, and preserve the learning environment which supports the educational programs. The roof is currently leaking in several places. This water infiltration will damage the structural roof deck, interior ceilings, floor and wall finishes, building contents, and provide the conditions which could lead to air quality issues in the building.
Total Project Cost
Engineering/Design 56,0000
660,000842,000
01,391,000
055,000
1,502,000

14
Roof Replacement - Linton Springs Elementary
Project Description:
Project Justification:
BUDGET REQUEST FY19 FY20 FY21 FY22 FY23 FY24Prior
Allocation64,000
Land AcquisitionSite WorkConstruction 1,608,000Equipment/FurnishingsOther 64,000
TOTAL 1,736,000
SOURCES OF FUNDSCounty 763,000State PSCP 973,000
Replacement of 73,112 square feet of roofing, associated tapered insulation system, and roof drains and flashings. The 2019 request is for design and construction funding.
Replacement of the roof is required to protect building structure, building components, and preserve the learning environment which supports the educational programs. The roof is currently leaking in several places. This water infiltration will damage the structural roof deck, interior ceilings, floor and wall finishes, building contents, and provide the conditions which could lead to air quality issues in the building.
Total Project Cost
Engineering/Design 64,0000
763,000973,000
01,608,000
064,000
1,736,000

15
Carroll County Career & Technology Center Project
Project Description:
Project Justification:
BUDGET REQUEST FY19 FY20 FY21 FY22 FY23 FY24Prior
Allocation700,000 3,300,000 100,000
Land AcquisitionSite Work 1,241,000Construction 6,531,000 46,936,000Equipment/Furnishings 653,000Other 539,000
TOTAL 700,000 8,964,000 3,300,000 46,936,000 100,000
SOURCES OF FUNDSCounty 700,000 4,264,000 3,300,000 19,244,000 100,000State PSCP 4,700,000 27,692,000
This project involves a phased approach to the partial modernization of the Career & Technology Center. Phase One would include the planning and construction of a 21,000 square foot addition to the existing Carroll County Career & Technology Center. The addition would provide classrooms to address the existing waiting list for several programs. Phase Two would renovate the existing building to bring the entire building into conformance with current building and life safety codes. Enlargement of program space within the existing building is not provided as part of this project. Maintaining building occupancy and operation during construction will require a multi-phase construction process.
653,000539,000
Total Project Cost
Engineering/Design 4,100,0000
1,241,00053,467,000
32,392,000
60,000,000
27,608,000
Phase One would address the needs of current CCPS students who are not able to take certain programs due to a lack of classroom space and staffing. Phase Two would replace all major building systems to ensure compliance with all current building, life safety, energy and accessiblity codes. Phase Two would also improve the interior environmental quality level and educational experience by providing improved comfort systems and new finishes.

16
Westminster Area K-8 School
Project Description:
Project Justification:
BUDGET REQUEST FY19 FY20 FY21 FY22 FY23 FY24Prior
Allocation100,000
Land AcquisitionSite WorkConstructionEquipment/FurnishingsOther
TOTAL 0 100,000 0 0
SOURCES OF FUNDSCounty 0 100,000 0 0 0 0State PSCP
This project involves the exporation of the concept of a new Westminster Area K-8 school replacing both East MIddle and William Winchester Elementary. The size of this school would be determined as part of a comprehensive facility utilization plan that will be developed in the future.
Consoldiating two aging school facilities into one new building in the Westminster Area will ensure that students in the Westminster are served in the most cost effective way possible.
Total Project Cost
Engineering/Design 100,0000
100,0000
0000
100,000

17
Winfield - HVAC System Replacement
Project Description:
Project Justification:
BUDGET REQUEST FY19 FY20 FY21 FY22 FY23 FY24Prior
Allocation515,000
Land AcquisitionSite WorkConstruction 6,436,000Equipment/FurnishingsOther 322,000
TOTAL 515,000 6,758,000 0
SOURCES OF FUNDSCounty 515,000 2,866,000 0State PSCP 3,892,000
This project involves the replacement of the existing unit ventilators in each classroom. The project will also include replacement of both the heating and cooling plants and associated piping and pumps located in the mechanical room. The existing pneumatic control system shall be replaced and upgraded to be electric/electronic actuation, direct digitally controlled and interlocked to the County Energy Mangement System.
The mechanical equipment was installed when the school was modernized in 1993. The age of this equipment will be 24 years old in 2017-18. The replacement of this aging equipment will provide a modern energy efficient mechanical system that meets the current Indoor Air Quality requirements for schools and provides a better learning environment for students and staff.
Total Project Cost
Engineering/Design 515,0000
3,381,0003,892,000
06,436,000
0322,000
7,273,000

18
South Carroll High - Window Replacement Project
Project Description:
Project Justification:
BUDGET REQUEST FY19 FY20 FY21 FY22 FY23 FY24Prior
Allocation150,000
Land AcquisitionSite WorkConstruction 1,500,000Equipment/FurnishingsOther
TOTAL 150,000 1,500,000
SOURCES OF FUNDSCounty 150,000 615,000State PSCP 885,000
This project involves the replacement of the window wall system that was utilized during the original construction of the school. Replacement with modern energy efficient windows is necessary to protect building components and contents, and preserve the learning environment.
Replacement of old single-pane windows is required to protect building structure and building components, to maintain good indoor air quality, and to improve the energy efficiency of these aging facilities. Without a window replacement program, the exterior building envelope will continue to be compromised. As a result, these failing windows will continue to waste energy and provide the conditions which could lead to air quality issues in the building.
Total Project Cost
Engineering/Design 150,000
765,000885,000
00
1,500,00000
1,650,000

19
Taneytown Elementary Kindergarten Addition
Project Description:
Project Justification:
BUDGET REQUEST FY19 FY20 FY21 FY22 FY23 FY24Prior
Allocation115,000
Land AcquisitionSite Work 254,000Construction 1,400,000Equipment/Furnishings 112,000Other 83,000
TOTAL 115,000 1,849,000
SOURCES OF FUNDSCounty 115,000 868,000State PSCP 981,000
Based on projected kindergarten enrollments, two additional kindergarten classroom will be necessary to accomodate additional kindergarten students. The preliminary scope of this project includes the construction of two new kindergarten classrooms, a new prekindergarten classroom, and the renovation of the current prekindergarten classroom to provide access to the new addition. The final scope will be determined once an architect is hired, and the Construction Planning Committee is formed.
Full-day kindergarten was mandated by the State of Maryland through its Bridge to Excellence Act, during the 2002 legislative session. The school was originally constructed with 2 kindergarten classrooms, and 1 prekindergarten classroom. These three classrooms were not sufficient to accomodate the 63 kindergarteners and 30 Prekindergarten who were enrolled in 2016. Due to the shortage of early childhood classrooms, some classes are being held in classrooms that were not designed to meet the instructional needs of these students. Based on the current enrollment projections, this will continue to be a problem for the school until additional early childhood classrooms are provided.
Total Project Cost
Engineering/Design 115,0000
254,0001,400,000
112,000
981,000
83,000
1,964,000
983,000
20
Cranberry Station Elementary Kindergarten Addition
Project Description:
Project Justification:
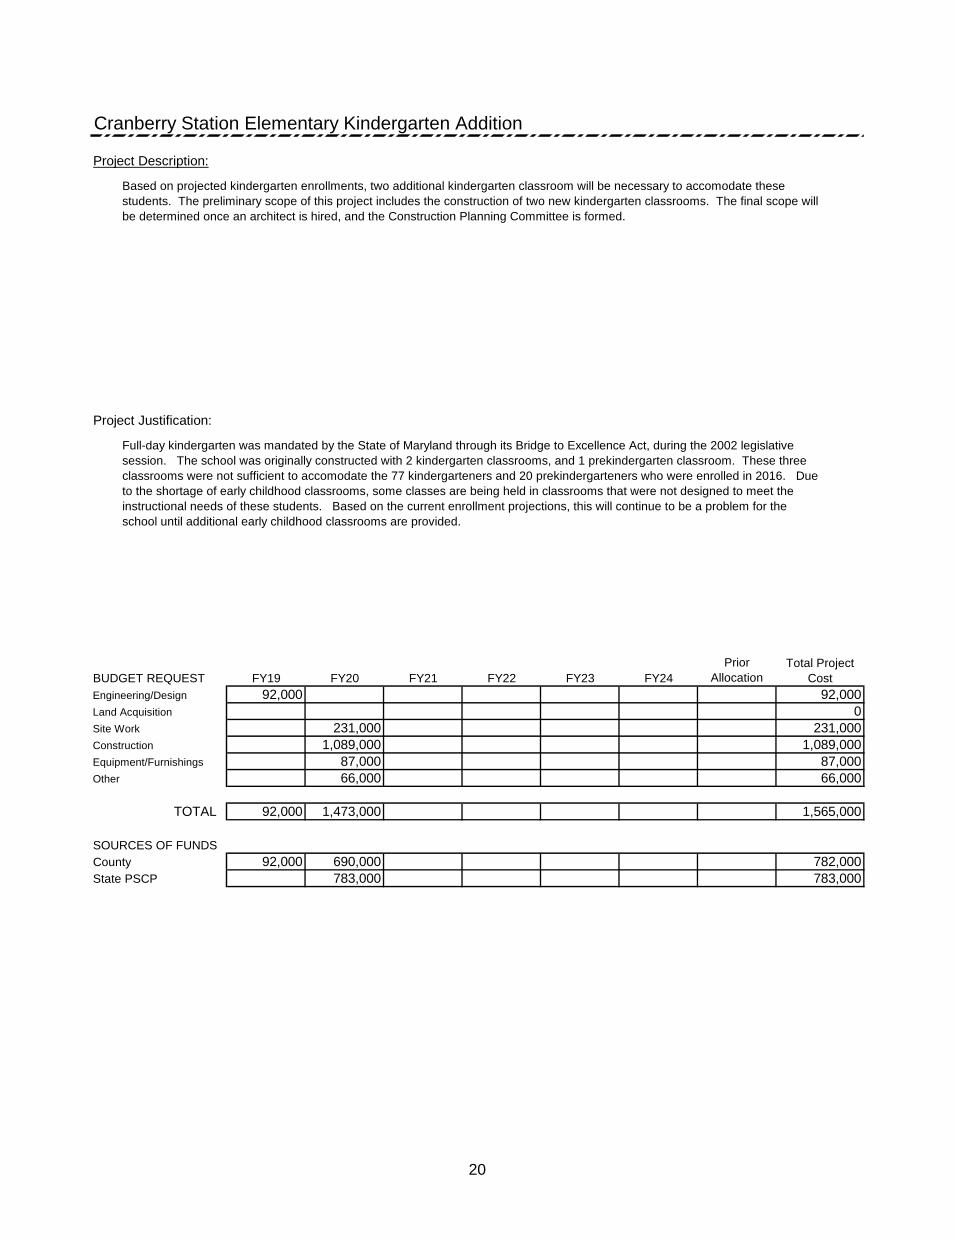
BUDGET REQUEST FY19 FY20 FY21 FY22 FY23 FY24Prior
Allocation92,000
Land AcquisitionSite Work 231,000Construction 1,089,000Equipment/Furnishings 87,000Other 66,000
TOTAL 92,000 1,473,000
SOURCES OF FUNDSCounty 92,000 690,000State PSCP 783,000 783,000
66,000
1,565,000
782,000
0231,000
1,089,00087,000
Based on projected kindergarten enrollments, two additional kindergarten classroom will be necessary to accomodate these students. The preliminary scope of this project includes the construction of two new kindergarten classrooms. The final scope will be determined once an architect is hired, and the Construction Planning Committee is formed.
Full-day kindergarten was mandated by the State of Maryland through its Bridge to Excellence Act, during the 2002 legislative session. The school was originally constructed with 2 kindergarten classrooms, and 1 prekindergarten classroom. These three classrooms were not sufficient to accomodate the 77 kindergarteners and 20 prekindergarteners who were enrolled in 2016. Due to the shortage of early childhood classrooms, some classes are being held in classrooms that were not designed to meet the instructional needs of these students. Based on the current enrollment projections, this will continue to be a problem for the school until additional early childhood classrooms are provided.
Total Project Cost
Engineering/Design 92,000
21
Security Improvements
Project Description:
Project Justification:
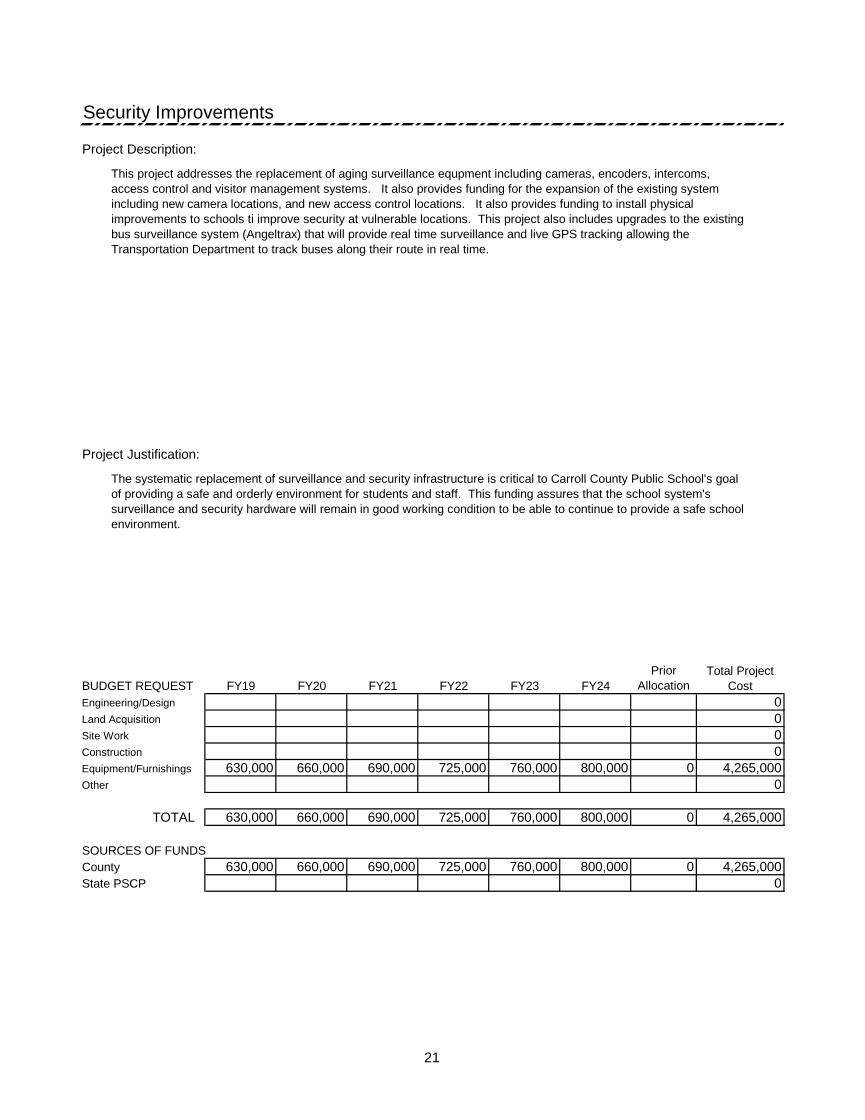
BUDGET REQUEST FY19 FY20 FY21 FY22 FY23 FY24Prior
Allocation
Land AcquisitionSite WorkConstructionEquipment/Furnishings 630,000 660,000 690,000 725,000 760,000 800,000 0Other
TOTAL 630,000 660,000 690,000 725,000 760,000 800,000 0
SOURCES OF FUNDSCounty 630,000 660,000 690,000 725,000 760,000 800,000 0State PSCP
4,265,0000
00
4,265,0000
4,265,000
This project addresses the replacement of aging surveillance equpment including cameras, encoders, intercoms, access control and visitor management systems. It also provides funding for the expansion of the existing system including new camera locations, and new access control locations. It also provides funding to install physical improvements to schools ti improve security at vulnerable locations. This project also includes upgrades to the existing bus surveillance system (Angeltrax) that will provide real time surveillance and live GPS tracking allowing the Transportation Department to track buses along their route in real time.
The systematic replacement of surveillance and security infrastructure is critical to Carroll County Public School's goal of providing a safe and orderly environment for students and staff. This funding assures that the school system's surveillance and security hardware will remain in good working condition to be able to continue to provide a safe school environment.
Total Project Cost
Engineering/Design 00

22
Technology Improvements
Project Description:
Project Justification:
BUDGET REQUEST FY19 FY20 FY21 FY22 FY23 FY24Prior
Allocation
Land AcquisitionSite WorkConstructionEquipment/Furnishings 800,000 825,000 1,730,000 875,000 500,000 900,000 0Other
TOTAL 800,000 825,000 1,730,000 875,000 500,000 900,000 0
SOURCES OF FUNDSCounty 800,000 825,000 1,730,000 875,000 500,000 900,000 0State PSCP 0
5,630,000
5,630,000
A systematic replacement and upgrading of technology infrastructure is critical to preventing Carroll County Public Schools from slipping into technological obsolescence. Further, critical infrastructure upgrades are necessary to meet the requirements of the MSDE Technology Plan, the Federal No Child Left Behind Act, Maryland's Race-To-The Top initiative, Financial and the State Legislative Audits, other legislation including Sarbanes Oxley and CALEA, and the expectations of public agencies in regards to Business Continuity/Disaster Recovery. This program assures that the school system's computing hardware will keep pace with technological advances that will prepare students for the rapidly changing workforce and retire aging equpiment. Without a planned program of replacement the school system will realize a degradation of its ability to support instructional programs and services. Further, technology investments are required to realize the cost savings and benefit of the Carroll County Public Network.
This project addresses the integration of new and systematic replenishment of core technology infrastructure hardware and software. It includes installation, expansion, and replacement of hardware such as servers; storage; telecommunications devices; and network infrastructure equipment including switches, routers, and firewalls. Cabling upgrades, wireless technologies, and other technology delivery systems and equipment is included in the expanding technology infrastructure of the school system. End-user computing devices connect to this technology infrastructure that provides links to available software, databases, the wide area network, telecommunications networks, various private networks, the Internet.
5,630,0000
Total Project Cost
Engineering/Design 0000

23
Paving
Project Description:
Project Justification:
BUDGET REQUEST FY19 FY20 FY21 FY22 FY23 FY24Prior
Allocation
Land AcquisitionSite WorkConstruction 865,000 865,000 1,085,000 850,000 1,100,000 1,000,000Equipment/FurnishingsOther
TOTAL 865,000 865,000 1,085,000 850,000 1,100,000 1,000,000 0
SOURCES OF FUNDSCounty 865,000 865,000 1,085,000 850,000 1,100,000 1,000,000 0State PSCP 0
5,765,000
5,765,000
Maintaining the paved areas delays or eliminates the need for much more costly parking and driveway reconstruction projects. It also prevents damage to school buses; maintenance vehicles during snow removal activities; and the vehicles of staff, parents and visitors. Contributes to the prevention of injuries to the students, employees and the public who utilize the parking areas. As the age of the parking areas continues to increase, the quality of the surface will continue to deteriorate and, depending upon weather conditions, the roadway will fail. All of the projects included in this CIP request have large areas where the paving has failed and require total reconstruction. Without the requested increase in funding for paving, these projects will be pushed out even farther and the amount of failed pavement will continue to increase.
00
Total Project Cost
Engineering/Design 000
5,765,000
2019 - East MS (Main Lot and Roads); Robert Moton (entire site)2020 - Westminster ES (entire site); Shiloh MS (entire site)
2021 - Mechanicsville ES (entire site); Mt. Airy ES (entire site)
2023 - Sykesville MS (entire site); Northwest MS (entire site)
2017 - Carroll County Career & Technology Center (main parking lot)2018 - Westminster HS (stadium parking lot)
This on-going project addresses the maintenance and replacement of school parking areas and driveways. Potential projects planned include:
2022 - Liberty HS (Parking Lots)

24
Relocatable Classroom Movement
Project Description:
Project Justification:
BUDGET REQUEST FY19 FY20 FY21 FY22 FY23 FY24Prior
Allocation
Land AcquisitionSite WorkConstruction 175,000 185,000 195,000Equipment/FurnishingsOther
TOTAL 175,000 185,000 195,000 0
SOURCES OF FUNDSCounty 175,000 185,000 195,000 0State PSCP
This project provides for the removal of relocatable classrooms from various school sites where they are no longer needed due to the declining student enrollments. An evaluation of the condition and utilization of the existing relocatable classroom inventory was performed last year to identify relocatables that were candidates for removal. These relocatables were grouped into three tiers. Tier One were building that were vacant and could be removed immediately. Tier Two were buildings that were being utilized for temporary construction phasing or programs that could be moved into the main building. Tier Three were buildings that were being utilized to eliminate the need to float classroom teachers. The funding included in this request would reduce the current relocatable inventory by almost 50% by removing all three tiers of buildings.
00
Total Project Cost
Engineering/Design 000
555,000
0
555,000
555,000
The original intent of this project was to provide funding to add relocatable classrooms for capacity to handle the enrollment growth that the county experienced. Due to the recent enrollment declines, some of these relocatable classrooms are no longer necessary.

25
Roofing Improvements
Project Description:
Project Justification:
BUDGET REQUEST FY19 FY20 FY21 FY22 FY23 FY24Prior
Allocation
Land AcquisitionSite WorkConstruction 180,000 190,000 200,000Equipment/FurnishingsOther
TOTAL 180,000 190,000 200,000
SOURCES OF FUNDSCounty 180,000 190,000 200,000State PSCP
This project addresses general roofing repairs required during the life cycle of a roof system at various facilities. These repairs are to restore the roof system that has been damaged through normal wear and tear and weather or are partial replacement of specific damaged areas. This preventative maintenance maintains the integriy of the roof system and warranties obtained at time of original installation. Annual inspections by the Plant Maintenance department and work order requests identifies roof sections requiring immediate attention.
00
Total Project Cost
Engineering/Design 000
570,000
0
570,000
570,000
Protection of the building components and contents, as well as preserves the learning environment which supports the educational programs. This project allows for the extension of the life cycle of partial areas of the building's roofing system until the cost effective replacement of the total roof system can be funded and scheduled. It addresses emergency repairs and permits immediate corrective action that prevents water infiltration into the building envelope. This water infiltration would damage the structural roof deck, interior ceilings, floor and wall finishes, building contents, and provide the conditions which could lead to air quality issues in the building.

26
Barrier Free Modifications
Project Description:
Project Justification:
BUDGET REQUEST FY19 FY20 FY21 FY22 FY23 FY24Prior
Allocation
Land AcquisitionSite WorkConstruction 50,000 50,000 50,000 50,000 50,000 50,000Equipment/FurnishingsOther
TOTAL 50,000 50,000 50,000 50,000 50,000 50,000
SOURCES OF FUNDSCounty 50,000 50,000 50,000 50,000 50,000 50,000State PSCP
This on-going project provides funding to accommodate individual and group program needs and particular accommodations (changing areas, life skills space, etc.) of special education students as they are integrated into the student population. Funds may also be utilized to address building issues involving staff and public accessibility concerns as they may arise.
00
Total Project Cost
Engineering/Design 000
300,000
0
300,000
300,000
Modifications to school system's facilities are required to accommodate the integration of students with individual education plans, address compliance to ADA codes at specific locations that are noted through public use of the buildings and perform capital renewal of equipment installed to provide handicap assessibilty.

27
Westminster High - Science Room Renovation
Project Description:
Project Justification:
BUDGET REQUEST FY19 FY20 FY21 FY22 FY23 FY24Prior
Allocation100,000
Land AcquisitionSite WorkConstruction 2,750,000Equipment/Furnishings 220,000Other 176,000
TOTAL 0 3,146,000 100,000
SOURCES OF FUNDSCounty 0 1,482,000 100,000State PSCP 1,664,000
This project is part of the Look of the Future High School Science Classroom state initiative. It involves the renovation of science classrooms originally constructed in 1970 and the introduction of the Carroll County Public Schools’ technology component into these renovated science laboratory spaces.
The modernization of the science facilities provides a learning environment more consistent with the laboratory experiences the students will experience after graduation. These science facilities will provide the environment necessary to deliver quality science instruction to meet the goals of the science program in the Carroll County Public Schools.
Total Project Cost
Engineering/Design 100,00000
2,750,000220,000176,000
3,246,000
1,582,0001,664,000

28
HVAC - Improvements and Replacements
Project Description:
Project Justification:
BUDGET REQUEST FY19 FY20 FY21 FY22 FY23 FY24Prior
Allocation439,000 659,000 589,000 685,000 1,373,000
Land AcquisitionSite WorkConstruction 5,491,000 8,240,000 7,367,000 8,565,000Equipment/FurnishingsOther 274,000 412,000 368,000 428,000
TOTAL 0 439,000 6,424,000 9,241,000 8,420,000 10,366,000 0
SOURCES OF FUNDSCounty 0 439,000 3,103,000 4,257,000 3,964,000 5,187,000 0State PSCP 3,321,000 4,984,000 4,456,000 5,179,000
Liberty HS system replacement - Design (FY24) & Construction (FY25)
This on-going project includes funding for the replacement of aging Heating, Ventilation and Air Conditioning (HVAC) equipment in school facilities.
Future Planned Projects include:
Spring Garden Elementary system replacement - Design (FY20) & Construction (FY21)
Carrolltowne Elementary system replacement - Design (FY23) & Construction (FY24)Northwest Middle system replacement - Design (FY22) & Construction (FY23)Oklahoma Road Middle system replacement - Design (FY21) & Construction (FY22)
29,663,000
Replacement of these systems and equipment is required to protect the building systems' contents and improve ventilation and provide a controlled interior environment to support the learning environment. Due to the fact that there are new ventilation and humidity control requirements necessary for indoor air quality, the complexity of these systems require a detailed study to determine the full scope of project. These Scope Studies will be performed prior to the budget request to examine the options available and determine the actual project budget.
Total Project Cost
Engineering/Design 3,745,000
0
00
17,940,000
1,482,000
34,890,000
16,950,000

29
Systemic Roof Replacements
Project Description:
Project Justification:
BUDGET REQUEST FY19 FY20 FY21 FY22 FY23 FY24Prior
Allocation56,000 72,000 60,000 121,000 156,000
Land AcquisitionSite WorkConstruction 1,406,000 1,810,000 1,508,000 3,026,000 3,900,000Equipment/FurnishingsOther 56,000 72,000 60,000 120,000 155,000
TOTAL 1,518,000 1,954,000 1,628,000 3,267,000 4,211,000
SOURCES OF FUNDSCounty 667,000 859,000 717,000 1,436,000 1,852,000State PSCP 851,000 1,095,000 911,000 1,831,000 2,359,000 7,047,000
12,578,000
5,531,000
Replacement of roof will be required to protect building structure, building components, and preserve the learning environment which supports the educational programs. Without a roof replacement program, the roofs will continue to deteriorate, which allows water to infiltrate the building envelope. This water infiltration will damage the structural roof deck, interior ceilings, floor and wall finishes, building contents, and provide the conditions which could lead to air quality issues in the building.
This project involves the replacement of roofs that are beyond their life cycle and are exhibiting signs of approaching failure and are no longer repairable. Their replacement is necessary to protect building components and contents, and preserve the learning environment.
The funding request is based on the following schedule:
Cranberry Station ES - FY20Winfield ES - FY21Spring Garden ES - FY22Oklahoma Rd MS - FY23Century HS - FY24
0463,000
Total Project Cost
Engineering/Design 465,00000
11,650,000

30
Electrical System Upgrades
Project Description:
Project Justification:
BUDGET REQUEST FY19 FY20 FY21 FY22 FY23 FY24Prior
Allocation75,000
Land AcquisitionSite WorkConstruction 750,000Equipment/FurnishingsOther
TOTAL 75,000 750,000
SOURCES OF FUNDSCounty 75,000 307,000State PSCP 443,000 443,000
825,000
382,000
The electrical systems in older schools are starting to have pieces of equipment that need to be replaced. At the same time, the dramatic increase of the use of technology equipment has created electrical demands that were not present when these older schools were designed. This increasing dependence on technology has also created certain emergency and stand-by power requirements that did not exist when these schools were constructed. These projects will address all of these issues in a comprehensive manner as opposed to continuing to piece meal solutions to these problems.
These projects involve the upgrade of electrical service, replacement of aging distribution boards, installation of additional electrical branch circuits to accommodate the increasing use of technology, installation of emergency and stand-by power circuits, and replacement of aging generators.
Sykesville Middle - Design (FY20), Construction (FY21)
00
Total Project Cost
Engineering/Design 75,00000
750,000

31
Window Replacements
Project Description:
Project Justification:
BUDGET REQUEST FY19 FY20 FY21 FY22 FY23 FY24Prior
Allocation150,000
Land AcquisitionSite WorkConstruction 1,500,000Equipment/FurnishingsOther
TOTAL 150,000 1,500,000 0
SOURCES OF FUNDSCounty 150,000 615,000 0State PSCP 885,000
These projects involve the replacement of windows that are beyond their life cycle and are exhibiting signs of approaching failure. Their replacement with modern energy efficient windows is necessary to protect building components and contents, and preserve the learning environment.
Westminster High - Design (FY21), Construction (FY22)
00
Total Project Cost
Engineering/Design 150,00000
Replacement of old single-pane windows is required to protect building structure and building components, to maintain good indoor air quality, and to improve the energy efficiency of these aging facilities. Without a window replacement program, the exterior building envelope will continue to be compromised. As a result, these failing windows will continue to waste energy and provide the conditions which could lead to air quality issues in the building.
1,500,000
885,000
1,650,000
765,000

32
Friendship Valley Elementary - Kindergarten and PRIDE Program Addition
Project Description:
Project Justification:
BUDGET REQUEST FY19 FY20 FY21 FY22 FY23 FY24Prior
Allocation190,000
Land AcquisitionSite Work 476,000Construction 2,240,000Equipment/Furnishings 90,000Other 136,000
TOTAL 190,000 2,942,000 0
SOURCES OF FUNDSCounty 190,000 1,330,000 0State PSCP 1,612,000
This project involves the construction of two additional kindergarten classrooms and also additional square footage to house the PRIDE program currently housed in the relocatable classroom building next to Friendship Valley Elementary. The PRIDE program is an alternative educational setting for Pre-Kindergarten and elementary students. This project will provide the additional kindergarten classrooms needed as well as provide a permanent more adequate facility to house the PRIDE program. The final scope will be determined once an architect is hired, and the Construction Planning Committee is formed.
Full-day kindergarten was mandated by the State of Maryland through its Bridge to Excellence Act, during the 2002 legislative session. The school is designed around 4 classrooms for every grade level except for Kindergarten. The school was originally constructed with 2 kindergarten classrooms due to the fact that kindergarten was a half-day program. Now that kindergarten is a full day program, these two classrooms were not sufficient to accomodate the 72 kindergarteners who were enrolled in 2016. Due to the shortage of kindergarten classrooms, some classes are being held in classrooms that were not designed to meet the instructional needs of kindergarten students. Based on the current enrollment projections, this will continue to be a problem for the school until additional kindergarten classrooms are provided. The PRIDE program is currently located in a relocatable classroom due to lack of permanent space in a centrally located elementary school. The program serves a diverse population, consissting of students exhibiting severe behavioral issues resulting in disciplinary consequence and placement, students transferring into Carroll County from alternative schools in other systems, and students needing a transition from hospitalization. A permanent addition to Friendship Valley would provide a more suitable learning environment for these students.
Total Project Cost
Engineering/Design 190,0000
1,520,0001,612,000
476,0002,240,000
90,000136,000
3,132,000

33
Sandymount Elementary Kindergarten Addition
Project Description:
Project Justification:
BUDGET REQUEST FY19 FY20 FY21 FY22 FY23 FY24Prior
Allocation95,000
Land AcquisitionSite Work 238,000Construction 1,120,000Equipment/Furnishings 45,000Other 68,000
TOTAL 95,000 1,471,000
SOURCES OF FUNDSCounty 95,000 664,000State PSCP 807,000
Based on projected kindergarten enrollments, two additional kindergarten classroom will be necessary to accomodate these students. The preliminary scope of this project includes the construction of two new kindergarten classrooms. The final scope will be determined once an architect is hired, and the Construction Planning Committee is formed.
Full-day kindergarten was mandated by the State of Maryland through its Bridge to Excellence Act, during the 2002 legislative session. The school was originally constructed with 2 kindergarten classrooms. These two classrooms were not sufficient to accomodate the 72 kindergarteners and 14 prekindergarteners who were enrolled in 2016. Due to the shortage of early childhood classrooms, some classes are being held in classrooms that were not designed to meet the instructional needs of these students. Based on the current enrollment projections, this will continue to be a problem for the school until additional early childhood classrooms are provided.
Total Project Cost
Engineering/Design 95,0000
759,000807,000
238,0001,120,000
45,00068,000
1,566,000

34
West Middle School Modernization
Project Description:
Project Justification:
BUDGET REQUEST FY19 FY20 FY21 FY22 FY23 FY24Prior
Allocation70,000 4,651,000
Land AcquisitionSite WorkConstructionEquipment/FurnishingsOther
TOTAL 70,000 4,651,000
SOURCES OF FUNDSCounty 70,000 4,651,000State PSCP 0
0
4,721,000
4,721,000
This project involves the modernization of the existing West Middle School building of 135,733 square feet. Due to the fact that the majority of this building will be over 50 years old at the time of modernization, the entire building will need to be brought up to current educational and building standards. In order to determine the best way to modernize this school, a Feasibility Study needs to be performed to evaluate options for addressing the physical and educational deficiencies at the school.
Based on the Physical and Functional Assessment Report developed in March 2008 and updated in 2017, Westminster West Middle was listed as the sixth school on the Modernization priority list.The original building was constructed in 1958 with additions constructed in 1964 and in 1996. The instructional and support spaces need to be modernized to facilitate the instructional program. Replacement of aging building systems and components such as electrical, plumbing, life safety, security, technology and telecommunication systems; and heating systems is required to protect the school system's physical assets. This modernization will also address ADA accessibility concerns; and reconfigure the building interior support the middle school educational program delivery.
0000
Total Project Cost
Engineering/Design 4,721,000

2016-17 ACTUAL and 2017-18 THROUGH 2026-27 PROJECTIONS SUMMARY
MIDDLE HIGH
PreK K-5 6-8 9-12 K-12 PreK-12 CARROLL POST GRAND FTE FTE
YEAR TOTAL TOTAL TOTAL TOTAL TOTAL TOTAL SPRINGS SECONDARY TOTAL TOTAL Diff.
2016-17 381 10617 5930 8153 24700 25081 61 10 17 35 29 23 25256 25066
2017-18 406 10543 5783 8215 24541 24947 61 10 17 35 29 23 25121 24918 -148
2018-19 406 10361 5693 8131 24185 24591 60 10 17 34 28 23 24763 24560 -358
2019-20 406 10263 5641 8062 23966 24372 59 10 17 34 28 22 24542 24339 -221
2020-21 406 10309 5561 7877 23747 24153 59 10 16 34 28 22 24322 24119 -220
2021-22 406 10360 5452 7773 23585 23991 58 10 16 33 28 22 24159 23956 -163
2022-23 406 10424 5404 7640 23468 23874 58 10 16 33 28 22 24041 23838 -118
2023-24 406 10533 5408 7509 23450 23856 58 10 16 33 28 22 24022 23819 -19
2024-25 406 10728 5331 7444 23503 23909 58 10 16 33 28 22 24076 23873 54
2025-26 406 10907 5279 7345 23531 23937 58 10 16 33 28 22 24104 23901 28
2026-27 406 11035 5324 7281 23640 24046 58 10 16 34 28 22 24213 24010 110
GATEWAY
ELEMENTARY
PRIDE FSS
CROSS-
ROADS
Page 35

36
Carroll County Public Schools Actual & Projected EnrollmentEducational Facilities Master Plan - 2017-2026ELEMENTARY SCHOOLS Comparisons are based on total State Rated capacity with FTE
Enrollment Enrollment EnrollmentActual Projected Projected
School K-5 PreK Spec. Ed. Total 2016 2017 2018 2019 2020 2021 2022 2023 2024 2025 2026Carrolltowne 548 0 50 598 532 535 544 551 545 560 546 551 561 571 578
Over (Under) State Rated Capacity (66) (63) (54) (47) (53) (38) (52) (47) (37) (27) (20) Percent of STATE Capacity 89.0% 89.5% 91.0% 92.1% 91.1% 93.6% 91.3% 92.1% 93.8% 95.5% 96.7%
Cranberry Station 550 20 0 570 523 528 535 525 521 518 530 535 545 554 561Over (Under) State Rated Capacity (47) (42) (35) (45) (49) (52) (40) (35) (25) (16) (9) Percent of STATE Capacity 91.8% 92.6% 93.9% 92.1% 91.4% 90.9% 93.0% 93.9% 95.6% 97.2% 98.4%
Ebb Valley 571 20 0 591 538 519 498 477 475 471 469 475 483 491 496Over (Under) State Rated Capacity (53) (72) (93) (114) (116) (120) (122) (116) (108) (100) (95) Percent of STATE Capacity 91.0% 87.8% 84.3% 80.7% 80.4% 79.7% 79.4% 80.4% 81.7% 83.1% 83.9%
Eldersburg 570 0 0 570 470 469 459 462 466 467 466 471 480 487 492Over (Under) State Rated Capacity (100) (101) (111) (108) (104) (103) (104) (99) (90) (83) (78) Percent of STATE Capacity 82.5% 82.3% 80.5% 81.1% 81.8% 81.9% 81.8% 82.6% 84.2% 85.4% 86.3%
Elmer Wolfe 548 0 0 548 417 415 401 400 404 409 413 417 424 431 436Over (Under) State Rated Capacity (131) (133) (147) (148) (144) (139) (135) (131) (124) (117) (112) Percent of STATE Capacity 76.1% 75.7% 73.2% 73.0% 73.7% 74.6% 75.4% 76.1% 77.4% 78.6% 79.6%
Freedom 525 0 0 525 477 490 486 501 490 493 501 506 516 525 532Over (Under) State Rated Capacity (48) (35) (39) (24) (35) (32) (24) (19) (9) - 7 Percent of STATE Capacity 90.9% 93.3% 92.6% 95.4% 93.3% 93.9% 95.4% 96.4% 98.3% 100.0% 101.3%
Friendship Valley 527 0 0 527 465 474 457 441 437 443 445 450 458 466 472Over (Under) State Rated Capacity (62) (53) (70) (86) (90) (84) (82) (77) (69) (61) (55) Percent of STATE Capacity 88.2% 89.9% 86.7% 83.7% 82.9% 84.1% 84.4% 85.4% 86.9% 88.4% 89.6%
Hampstead 526 0 50 576 346 346 359 372 374 383 379 383 390 397 401Over (Under) State Rated Capacity (230) (230) (217) (204) (202) (193) (197) (193) (186) (179) (175) Percent of STATE Capacity 60.1% 60.1% 62.3% 64.6% 64.9% 66.5% 65.8% 66.5% 67.7% 68.9% 69.6%
Linton Springs 731 0 0 731 617 612 593 592 601 587 595 600 611 621 628Over (Under) State Rated Capacity (114) (119) (138) (139) (130) (144) (136) (131) (120) (110) (103) Percent of STATE Capacity 84.4% 83.7% 81.1% 81.0% 82.2% 80.3% 81.4% 82.1% 83.6% 85.0% 85.9%
Manchester 707 20 0 727 612 629 612 597 577 599 609 615 627 638 645Over (Under) State Rated Capacity (115) (98) (115) (130) (150) (128) (118) (112) (100) (89) (82) Percent of STATE Capacity 84.2% 86.5% 84.2% 82.1% 79.4% 82.4% 83.8% 84.6% 86.2% 87.8% 88.7%
Mechanicsville 616 0 0 616 463 448 452 438 450 460 456 460 468 475 480Over (Under) State Rated Capacity (153) (168) (164) (178) (166) (156) (160) (156) (148) (141) (136) Percent of STATE Capacity 75.2% 72.7% 73.4% 71.1% 73.1% 74.7% 74.0% 74.7% 76.0% 77.1% 77.9%
State Rated Capacity

37
Enrollment Enrollment EnrollmentActual Projected Projected
School K-5 PreK Spec. Ed. Total 2016 2017 2018 2019 2020 2021 2022 2023 2024 2025 2026State Rated Capacity
Mt. Airy 598 0 0 598 455 425 445 450 454 445 446 449 460 469 476(Grades 3-5) Over (Under) State Rated Capacity (143) (173) (153) (148) (144) (153) (152) (149) (138) (129) (122)
Percent of STATE Capacity 76.1% 71.1% 74.4% 75.3% 75.9% 74.4% 74.6% 75.1% 76.9% 78.4% 79.6%
Parr's Ridge 590 20 0 610 445 451 443 444 447 457 466 472 478 483 488(Grades K-2) Over (Under) State Rated Capacity (165) (159) (167) (166) (163) (153) (144) (138) (132) (127) (122)
Percent of STATE Capacity 73.0% 73.9% 72.6% 72.8% 73.3% 74.9% 76.4% 77.4% 78.4% 79.2% 80.0%
Piney Ridge 571 0 0 571 540 546 527 516 524 515 530 536 546 556 563Over (Under) State Rated Capacity (31) (25) (44) (55) (47) (56) (41) (35) (25) (15) (8) Percent of STATE Capacity 94.6% 95.6% 92.3% 90.4% 91.8% 90.2% 92.8% 93.9% 95.6% 97.4% 98.6%
Robert Moton 548 20 40 608 408 400 396 399 402 397 393 396 402 408 414Over (Under) State Rated Capacity (200) (208) (212) (209) (206) (211) (215) (212) (206) (200) (194) Percent of STATE Capacity 67.1% 65.8% 65.1% 65.6% 66.1% 65.3% 64.6% 65.1% 66.1% 67.1% 68.1%
Runnymede 594 20 40 654 595 598 582 586 589 590 578 583 593 602 609Over (Under) State Rated Capacity (59) (56) (72) (68) (65) (64) (76) (71) (61) (52) (45) Percent of STATE Capacity 91.0% 91.4% 89.0% 89.6% 90.1% 90.2% 88.4% 89.1% 90.7% 92.0% 93.1%
Sandymount 527 0 0 527 425 434 428 437 449 447 453 458 467 474 479Over (Under) State Rated Capacity (102) (93) (99) (90) (78) (80) (74) (69) (60) (53) (48) Percent of STATE Capacity 80.6% 82.4% 81.2% 82.9% 85.2% 84.8% 86.0% 86.9% 88.6% 89.9% 90.9%
Spring Garden 593 0 0 593 487 466 443 425 435 435 446 450 458 465 470Over (Under) State Rated Capacity (106) (127) (150) (168) (158) (158) (147) (143) (135) (128) (123) Percent of STATE Capacity 82.1% 78.6% 74.7% 71.7% 73.4% 73.4% 75.2% 75.9% 77.2% 78.4% 79.3%
Taneytown 550 20 0 570 406 388 372 364 365 378 384 389 395 402 406Over (Under) State Rated Capacity (164) (182) (198) (206) (205) (192) (186) (181) (175) (168) (164) Percent of STATE Capacity 71.2% 68.1% 65.3% 63.9% 64.0% 66.3% 67.4% 68.2% 69.3% 70.5% 71.2%
Westminster 593 0 0 593 492 486 472 451 463 444 450 455 464 471 476Over (Under) State Rated Capacity (101) (107) (121) (142) (130) (149) (143) (138) (129) (122) (117) Percent of STATE Capacity 83.0% 82.0% 79.6% 76.1% 78.1% 74.9% 75.9% 76.7% 78.2% 79.4% 80.3%
Wm. Winchester 571 20 0 591 582 578 555 542 546 557 565 570 580 590 597Over (Under) State Rated Capacity (9) (13) (36) (49) (45) (34) (26) (21) (11) (1) 6 Percent of STATE Capacity 98.5% 97.8% 93.9% 91.7% 92.4% 94.2% 95.6% 96.4% 98.1% 99.8% 101.0%
Winfield 662 0 60 722 517 509 507 496 499 506 509 514 524 533 539Over (Under) State Rated Capacity (205) (213) (215) (226) (223) (216) (213) (208) (198) (189) (183) Percent of STATE Capacity 71.6% 70.5% 70.2% 68.7% 69.1% 70.1% 70.5% 71.2% 72.6% 73.8% 74.7%
TOTALS 12816 160 240 13216 10812 10746 10566 10466 10513 10561 10629 10735 10930 11109 11238
Over (Under) State Rated Capacity (2,404) (2,470) (2,650) (2,750) (2,703) (2,655) (2,587) (2,481) (2,286) (2,107) (1,978) Percent of STATE Capacity 81.8% 81.3% 79.9% 79.2% 79.5% 79.9% 80.4% 81.2% 82.7% 84.1% 85.0%

38
Carroll County Public Schools Actual & Projected EnrollmentEducational Facilities Master Plan - 2017-2026ELEMENTARY SCHOOLS Northeast Area Schools
Enrollment Enrollment EnrollmentActual Projected Projected
School K-5 PreK Spec. Ed. Total 2016 2017 2018 2019 2020 2021 2022 2023 2024 2025 2026Ebb Valley 571 20 0 591 538 519 498 477 475 471 469 475 483 491 496
Over (Under) State Rated Capacity (53) (72) (93) (114) (116) (120) (122) (116) (108) (100) (95) Percent of STATE Capacity 91.0% 87.8% 84.3% 80.7% 80.4% 79.7% 79.4% 80.4% 81.7% 83.1% 83.9%
Hampstead 526 0 50 576 346 346 359 372 374 383 379 383 390 397 401Over (Under) State Rated Capacity (230) (230) (217) (204) (202) (193) (197) (193) (186) (179) (175) Percent of STATE Capacity 60.1% 60.1% 62.3% 64.6% 64.9% 66.5% 65.8% 66.5% 67.7% 68.9% 69.6%
Manchester 707 20 0 727 612 629 612 597 577 599 609 615 627 638 645Over (Under) State Rated Capacity (115) (98) (115) (130) (150) (128) (118) (112) (100) (89) (82) Percent of STATE Capacity 84.2% 86.5% 84.2% 82.1% 79.4% 82.4% 83.8% 84.6% 86.2% 87.8% 88.7%
Spring Garden 593 0 0 593 487 466 443 425 435 435 446 450 458 465 470Over (Under) State Rated Capacity (106) (127) (150) (168) (158) (158) (147) (143) (135) (128) (123) Percent of STATE Capacity 82.1% 78.6% 74.7% 71.7% 73.4% 73.4% 75.2% 75.9% 77.2% 78.4% 79.3%
TOTALS 2397 40 50 2487 1983 1960 1912 1871 1861 1888 1903 1923 1958 1991 2012
Over (Under) State Rated Capacity (504) (527) (575) (616) (626) (599) (584) (564) (529) (496) (475) Percent of STATE Capacity 79.7% 78.8% 76.9% 75.2% 74.8% 75.9% 76.5% 77.3% 78.7% 80.1% 80.9%
Comparisons are based on total State Rated capacity with FTE
State Rated Capacity

39
Carroll County Public Schools Actual & Projected EnrollmentEducational Facilities Master Plan - 2017-2026ELEMENTARY SCHOOLS Northwest Area
Enrollment Enrollment EnrollmentActual Projected Projected
School K-5 PreK Spec. Ed. Total 2016 2017 2018 2019 2020 2021 2022 2023 2024 2025 2026Elmer Wolfe 548 0 0 548 417 415 401 400 404 409 413 417 424 431 436
Over (Under) State Rated Capacity (131) (133) (147) (148) (144) (139) (135) (131) (124) (117) (112) Percent of STATE Capacity 76.1% 75.7% 73.2% 73.0% 73.7% 74.6% 75.4% 76.1% 77.4% 78.6% 79.6%
Runnymede 594 20 40 654 595 598 582 586 589 590 578 583 593 602 609Over (Under) State Rated Capacity (59) (56) (72) (68) (65) (64) (76) (71) (61) (52) (45) Percent of STATE Capacity 91.0% 91.4% 89.0% 89.6% 90.1% 90.2% 88.4% 89.1% 90.7% 92.0% 93.1%
Taneytown 550 20 0 570 406 388 372 364 365 378 384 389 395 402 406Over (Under) State Rated Capacity (164) (182) (198) (206) (205) (192) (186) (181) (175) (168) (164) Percent of STATE Capacity 71.2% 68.1% 65.3% 63.9% 64.0% 66.3% 67.4% 68.2% 69.3% 70.5% 71.2%
TOTALS 1692 40 40 1772 1418 1401 1355 1350 1358 1377 1375 1389 1412 1435 1451
Over (Under) State Rated Capacity (354) (371) (417) (422) (414) (395) (397) (383) (360) (337) (321) Percent of STATE Capacity 80.0% 79.1% 76.5% 76.2% 76.6% 77.7% 77.6% 78.4% 79.7% 81.0% 81.9%
Comparisons are based on total State Rated capacity with FTE
State Rated Capacity

40
Carroll County Public Schools Actual & Projected EnrollmentEducational Facilities Master Plan - 2017-2026ELEMENTARY SCHOOLS Westminster Area Schools
Enrollment Enrollment EnrollmentActual Projected Projected
School K-5 PreK Spec. Ed. Total 2016 2017 2018 2019 2020 2021 2022 2023 2024 2025 2026
Cranberry Station 550 20 0 570 523 528 535 525 521 518 530 535 545 554 561Over (Under) State Rated Capacity (47) (42) (35) (45) (49) (52) (40) (35) (25) (16) (9) Percent of STATE Capacity 91.8% 92.6% 93.9% 92.1% 91.4% 90.9% 93.0% 93.9% 95.6% 97.2% 98.4%
Friendship Valley 527 0 0 527 465 474 457 441 437 443 445 450 458 466 472Over (Under) State Rated Capacity (62) (53) (70) (86) (90) (84) (82) (77) (69) (61) (55) Percent of STATE Capacity 88.2% 89.9% 86.7% 83.7% 82.9% 84.1% 84.4% 85.4% 86.9% 88.4% 89.6%
Mechanicsville 616 0 0 616 463 448 452 438 450 460 456 460 468 475 480Over (Under) State Rated Capacity (153) (168) (164) (178) (166) (156) (160) (156) (148) (141) (136) Percent of STATE Capacity 75.2% 72.7% 73.4% 71.1% 73.1% 74.7% 74.0% 74.7% 76.0% 77.1% 77.9%
Robert Moton 548 20 40 608 408 400 396 399 402 397 393 396 402 408 414Over (Under) State Rated Capacity (200) (208) (212) (209) (206) (211) (215) (212) (206) (200) (194) Percent of STATE Capacity 67.1% 65.8% 65.1% 65.6% 66.1% 65.3% 64.6% 65.1% 66.1% 67.1% 68.1%
Sandymount 527 0 0 527 425 434 428 437 449 447 453 458 467 474 479Over (Under) State Rated Capacity (102) (93) (99) (90) (78) (80) (74) (69) (60) (53) (48) Percent of STATE Capacity 80.6% 82.4% 81.2% 82.9% 85.2% 84.8% 86.0% 86.9% 88.6% 89.9% 90.9%
Westminster 593 0 0 593 492 486 472 451 463 444 450 455 464 471 476Over (Under) State Rated Capacity (101) (107) (121) (142) (130) (149) (143) (138) (129) (122) (117) Percent of STATE Capacity 83.0% 82.0% 79.6% 76.1% 78.1% 74.9% 75.9% 76.7% 78.2% 79.4% 80.3%
Wm. Winchester 571 20 0 591 582 578 555 542 546 557 565 570 580 590 597Over (Under) State Rated Capacity (9) (13) (36) (49) (45) (34) (26) (21) (11) (1) 6 Percent of STATE Capacity 98.5% 97.8% 93.9% 91.7% 92.4% 94.2% 95.6% 96.4% 98.1% 99.8% 101.0%
TOTALS 3932 60 40 4032 3358 3348 3295 3233 3268 3266 3292 3324 3384 3438 3479
Over (Under) State Rated Capacity (674) (684) (737) (799) (764) (766) (740) (708) (648) (594) (553) Percent of STATE Capacity 83.3% 83.0% 81.7% 80.2% 81.1% 81.0% 81.6% 82.4% 83.9% 85.3% 86.3%
Comparisons are based on total State Rated capacity with FTE
State Rated Capacity

41
Carroll County Public Schools Actual & Projected EnrollmentEducational Facilities Master Plan - 2017-2026ELEMENTARY SCHOOLS Southeast Area Schools
Enrollment Enrollment EnrollmentActual Projected Projected
School K-5 PreK Spec. Ed. Total 2016 2017 2018 2019 2020 2021 2022 2023 2024 2025 2026Carrolltowne 548 0 50 598 532 535 544 551 545 560 546 551 561 571 578
Over (Under) State Rated Capacity (66) (63) (54) (47) (53) (38) (52) (47) (37) (27) (20) Percent of STATE Capacity 89.0% 89.5% 91.0% 92.1% 91.1% 93.6% 91.3% 92.1% 93.8% 95.5% 96.7%
Eldersburg 570 0 0 570 470 469 459 462 466 467 466 471 480 487 492Over (Under) State Rated Capacity (100) (101) (111) (108) (104) (103) (104) (99) (90) (83) (78) Percent of STATE Capacity 82.5% 82.3% 80.5% 81.1% 81.8% 81.9% 81.8% 82.6% 84.2% 85.4% 86.3%
Freedom 525 0 0 525 477 490 486 501 490 493 501 506 516 525 532Over (Under) State Rated Capacity (48) (35) (39) (24) (35) (32) (24) (19) (9) - 7 Percent of STATE Capacity 90.9% 93.3% 92.6% 95.4% 93.3% 93.9% 95.4% 96.4% 98.3% 100.0% 101.3%
Linton Springs 731 0 0 731 617 612 593 592 601 587 595 600 611 621 628Over (Under) State Rated Capacity (114) (119) (138) (139) (130) (144) (136) (131) (120) (110) (103) Percent of STATE Capacity 84.4% 83.7% 81.1% 81.0% 82.2% 80.3% 81.4% 82.1% 83.6% 85.0% 85.9%
Piney Ridge 571 0 0 571 540 546 527 516 524 515 530 536 546 556 563Over (Under) State Rated Capacity -31 (25) (44) (55) (47) (56) (41) (35) (25) (15) (8) Percent of STATE Capacity 94.6% 95.6% 92.3% 90.4% 91.8% 90.2% 92.8% 93.9% 95.6% 97.4% 98.6%
TOTALS 2945 0 50 2995 2636 2652 2609 2622 2626 2622 2638 2664 2714 2760 2793
Over (Under) State Rated Capacity (359) (343) (386) (373) (369) (373) (357) (331) (281) (235) (202) Percent of STATE Capacity 88.0% 88.5% 87.1% 87.5% 87.7% 87.5% 88.1% 88.9% 90.6% 92.2% 93.3%
Comparisons are based on total State Rated capacity with FTE
State Rated Capacity

42
Carroll County Public Schools Actual & Projected EnrollmentEducational Facilities Master Plan - 2017-2026ELEMENTARY SCHOOLS Southwest Area Schools
Enrollment Enrollment EnrollmentActual Projected Projected
School K-5 PreK Spec. Ed. Total 2016 2017 2018 2019 2020 2021 2022 2023 2024 2025 2026Mt. Airy 598 0 0 598 455 425 445 450 454 445 446 449 460 469 476
Over (Under) State Rated Capacity (143) (173) (153) (148) (144) (153) (152) (149) (138) (129) (122) Percent of STATE Capacity 76.1% 71.1% 74.4% 75.3% 75.9% 74.4% 74.6% 75.1% 76.9% 78.4% 79.6%
Parr's Ridge 590 20 0 610 445 451 443 444 447 457 466 472 478 483 488Over (Under) State Rated Capacity (165) (159) (167) (166) (163) (153) (144) (138) (132) (127) (122) Percent of STATE Capacity 73.0% 73.9% 72.6% 72.8% 73.3% 74.9% 76.4% 77.4% 78.4% 79.2% 80.0%
Winfield 662 0 60 722 517 509 507 496 499 506 509 514 524 533 539Over (Under) State Rated Capacity (205) (213) (215) (226) (223) (216) (213) (208) (198) (189) (183) Percent of STATE Capacity 71.6% 70.5% 70.2% 68.7% 69.1% 70.1% 70.5% 71.2% 72.6% 73.8% 74.7%
TOTALS 1850 20 60 1930 1417 1385 1395 1390 1400 1408 1421 1435 1462 1485 1503
Over (Under) State Rated Capacity (513) (545) (535) (540) (530) (522) (509) (495) (468) (445) (427) Percent of STATE Capacity 73.4% 71.8% 72.3% 72.0% 72.5% 73.0% 73.6% 74.4% 75.8% 76.9% 77.9%
Comparisons are based on total State Rated capacity with FTE
State Rated Capacity

43
Carroll County Public Schools Actual & Projected EnrollmentEducational Facilities Master Plan - 2017-2026MIDDLE SCHOOLS
Enrollment Enrollment EnrollmentActual Projected Projected
School 6-8 Spec Ed 6-8 Spec Ed 2016 2017 2018 2019 2020 2021 2022 2023 2024 2025 2026Mt. Airy 850 20 750 20 758 756 700 702 666 683 680 686 678 676 681
Over (Under) State Rated Capacity (112) (114) (170) (168) (204) (187) (190) (184) (192) (194) (189) Percent of STATE Capacity 87.1% 86.9% 80.5% 80.7% 76.6% 78.5% 78.2% 78.9% 77.9% 77.7% 78.3%Over (Under) Functional Capacity (12) (14) (70) (68) (104) (87) (90) (84) (92) (94) (89) Percent of Functional Capacity 98.4% 98.2% 90.9% 91.2% 86.5% 88.7% 88.3% 89.1% 88.1% 87.8% 88.4%
North Carroll 850 20 750 20 587 580 585 586 613 575 551 525 532 528 532Over (Under) State Rated Capacity (283) (290) (285) (284) (257) (295) (319) (345) (338) (342) (338) Percent of STATE Capacity 67.5% 66.7% 67.2% 67.4% 70.5% 66.1% 63.3% 60.3% 61.1% 60.7% 61.1%Over (Under) Functional Capacity (183) (190) (185) (184) (157) (195) (219) (245) (238) (242) (238) Percent of Functional Capacity 76.2% 75.3% 76.0% 76.1% 79.6% 74.7% 71.6% 68.2% 69.1% 68.6% 69.1%
Northwest 850 20 750 20 640 659 669 673 655 609 618 619 621 608 614Over (Under) State Rated Capacity (230) (211) (201) (197) (215) (261) (252) (251) (249) (262) (256) Percent of STATE Capacity 73.6% 75.7% 76.9% 77.4% 75.3% 70.0% 71.0% 71.1% 71.4% 69.9% 70.6%Over (Under) Functional Capacity (130) (111) (101) (97) (115) (161) (152) (151) (149) (162) (156) Percent of Functional Capacity 83.1% 85.6% 86.9% 87.4% 85.1% 79.1% 80.3% 80.4% 80.6% 79.0% 79.7%
Oklahoma Road 871 20 825 20 752 729 708 654 688 684 731 712 715 692 697Over (Under) State Rated Capacity (139) (162) (183) (237) (203) (207) (160) (179) (176) (199) (194) Percent of STATE Capacity 84.4% 81.8% 79.5% 73.4% 77.2% 76.8% 82.0% 79.9% 80.2% 77.7% 78.2%Over (Under) Functional Capacity (93) (116) (137) (191) (157) (161) (114) (133) (130) (153) (148) Percent of Functional Capacity 89.0% 86.3% 83.8% 77.4% 81.4% 80.9% 86.5% 84.3% 84.6% 81.9% 82.5%
Shiloh 871 20 825 20 660 658 649 622 587 577 578 598 587 587 593Over (Under) State Rated Capacity (231) (233) (242) (269) (304) (314) (313) (293) (304) (304) (298) Percent of STATE Capacity 74.1% 73.8% 72.8% 69.8% 65.9% 64.8% 64.9% 67.1% 65.9% 65.9% 66.6%Over (Under) Functional Capacity (185) (187) (196) (223) (258) (268) (267) (247) (258) (258) (252) Percent of Functional Capacity 78.1% 77.9% 76.8% 73.6% 69.5% 68.3% 68.4% 70.8% 69.5% 69.5% 70.2%
Sykesville 808 20 725 20 802 744 751 739 723 717 697 710 674 681 687Over (Under) State Rated Capacity (26) (84) (77) (89) (105) (111) (131) (118) (154) (147) (141) Percent of STATE Capacity 96.9% 89.9% 90.7% 89.3% 87.3% 86.6% 84.2% 85.7% 81.4% 82.2% 83.0%Over (Under) Functional Capacity 57 (1) 6 (6) (22) (28) (48) (35) (71) (64) (58) Percent of Functional Capacity 107.7% 99.9% 100.8% 99.2% 97.0% 96.2% 93.6% 95.3% 90.5% 91.4% 92.2%
CapacityState Rated Functional

44
Enrollment Enrollment EnrollmentActual Projected Projected
School 6-8 Spec Ed 6-8 Spec Ed 2016 2017 2018 2019 2020 2021 2022 2023 2024 2025 2026
CapacityState Rated Functional
Westminster East 808 40 750 40 700 700 710 744 741 735 715 712 696 693 699Over (Under) State Rated Capacity (148) (148) (138) (104) (107) (113) (133) (136) (152) (155) (149) Percent of STATE Capacity 82.5% 82.5% 83.7% 87.7% 87.4% 86.7% 84.3% 84.0% 82.1% 81.7% 82.4%Over (Under) Functional Capacity (90) (90) (80) (46) (49) (55) (75) (78) (94) (97) (91) Percent of Functional Capacity 88.6% 88.6% 89.9% 94.2% 93.8% 93.0% 90.5% 90.1% 88.1% 87.7% 88.5%
Westminster West 1126 20 1025 20 1031 958 922 921 888 872 833 848 828 814 821Over (Under) State Rated Capacity (115) (188) (224) (225) (258) (274) (313) (298) (318) (332) (325) Percent of STATE Capacity 90.0% 83.6% 80.5% 80.4% 77.5% 76.1% 72.7% 74.0% 72.3% 71.0% 71.6%Over (Under) Functional Capacity (14) (87) (123) (124) (157) (173) (212) (197) (217) (231) (224) Percent of Functional Capacity 98.7% 91.7% 88.2% 88.1% 85.0% 83.4% 79.7% 81.1% 79.2% 77.9% 78.6%
TOTAL 7034 180 6400 180 5930 5784 5694 5641 5561 5452 5403 5410 5331 5279 5324
Over (Under) State Rated Capacity (1,284) (1,430) (1,520) (1,573) (1,653) (1,762) (1,811) (1,804) (1,883) (1,935) (1,890) Percent of STATE Capacity 82.2% 80.2% 78.9% 78.2% 77.1% 75.6% 74.9% 75.0% 73.9% 73.2% 73.8%Over (Under) Functional Capacity (650) (796) (886) (939) (1,019) (1,128) (1,177) (1,170) (1,249) (1,301) (1,256) Percent of Functional Capacity 90.1% 87.9% 86.5% 85.7% 84.5% 82.9% 82.1% 82.2% 81.0% 80.2% 80.9%

45
Carroll County Public Schools Actual & Projected EnrollmentEducational Facilities Master Plan - 2017-2026MIDDLE SCHOOLSSouthern Area
Enrollment Enrollment EnrollmentActual Projected Projected
School 6-8 Spec Ed 6-8 Spec Ed 2016 2017 2018 2019 2020 2021 2022 2023 2024 2025 2026Mt. Airy 850 20 750 20 758 756 700 702 666 683 680 686 678 676 681
Over (Under) State Rated Capacity (112) (114) (170) (168) (204) (187) (190) (184) (192) (194) (189) Percent of STATE Capacity 87.1% 86.9% 80.5% 80.7% 76.6% 78.5% 78.2% 78.9% 77.9% 77.7% 78.3%Over (Under) Functional Capacity (12) (14) (70) (68) (104) (87) (90) (84) (92) (94) (89) Percent of Functional Capacity 98.4% 98.2% 90.9% 91.2% 86.5% 88.7% 88.3% 89.1% 88.1% 87.8% 88.4%
Oklahoma Road 871 20 825 20 752 729 708 654 688 684 731 712 715 692 697 Over (Under) State Rated Capacity (139) (162) (183) (237) (203) (207) (160) (179) (176) (199) (194) Percent of STATE Capacity 84.4% 81.8% 79.5% 73.4% 77.2% 76.8% 82.0% 79.9% 80.2% 77.7% 78.2%Over (Under) Functional Capacity (93) (116) (137) (191) (157) (161) (114) (133) (130) (153) (148) Percent of Functional Capacity 89.0% 86.3% 83.8% 77.4% 81.4% 80.9% 86.5% 84.3% 84.6% 81.9% 82.5%
Sykesville 808 20 725 20 802 744 751 739 723 717 697 710 674 681 687 Over (Under) State Rated Capacity (26) (84) (77) (89) (105) (111) (131) (118) (154) (147) (141) Percent of STATE Capacity 96.9% 89.9% 90.7% 89.3% 87.3% 86.6% 84.2% 85.7% 81.4% 82.2% 83.0%Over (Under) Functional Capacity 57 (1) 6 (6) (22) (28) (48) (35) (71) (64) (58) Percent of Functional Capacity 107.7% 99.9% 100.8% 99.2% 97.0% 96.2% 93.6% 95.3% 90.5% 91.4% 92.2%
TOTALS 2529 60 2300 60 2312 2229 2159 2095 2077 2084 2108 2108 2067 2049 2065
Over (Under) State Rated Capacity (277) (360) (430) (494) (512) (505) (481) (481) (522) (540) (524) Percent of STATE Capacity 89.3% 86.1% 83.4% 80.9% 80.2% 80.5% 81.4% 81.4% 79.8% 79.1% 79.8%Over (Under) Functional Capacity (48) (131) (201) (265) (283) (276) (252) (252) (293) (311) (295) Percent of Functional Capacity 98.0% 94.4% 91.5% 88.8% 88.0% 88.3% 89.3% 89.3% 87.6% 86.8% 87.5%
CapacityState Rated Functional

46
Carroll County Public Schools Actual & Projected EnrollmentEducational Facilities Master Plan - 2017-2026MIDDLE SCHOOLSWestminster Area
Enrollment Enrollment EnrollmentActual Projected Projected
School 6-8 Spec Ed 6-8 Spec Ed 2016 2017 2018 2019 2020 2021 2022 2023 2024 2025 2026Westminster East 808 40 750 40 700 700 710 744 741 735 715 712 696 693 699
Over (Under) State Rated Capacity (148) (148) (138) (104) (107) (113) (133) (136) (152) (155) (149) Percent of STATE Capacity 82.5% 82.5% 83.7% 87.7% 87.4% 86.7% 84.3% 84.0% 82.1% 81.7% 82.4%Over (Under) Functional Capacity (90) (90) (80) (46) (49) (55) (75) (78) (94) (97) (91) Percent of Functional Capacity 88.6% 88.6% 89.9% 94.2% 93.8% 93.0% 90.5% 90.1% 88.1% 87.7% 88.5%
Westminster West 1126 20 1025 20 1,031 958 922 921 888 872 833 848 828 814 821 Over (Under) State Rated Capacity (115) (188) (224) (225) (258) (274) (313) (298) (318) (332) (325) Percent of STATE Capacity 90.0% 83.6% 80.5% 80.4% 77.5% 76.1% 72.7% 74.0% 72.3% 71.0% 71.6%Over (Under) Functional Capacity (14) (87) (123) (124) (157) (173) (212) (197) (217) (231) (224) Percent of Functional Capacity 98.7% 91.7% 88.2% 88.1% 85.0% 83.4% 79.7% 81.1% 79.2% 77.9% 78.6%
TOTALS 1934 60 1775 60 1,731 1,658 1,632 1,665 1,629 1,607 1,548 1,560 1,524 1,507 1,520 Over (Under) State Rated Capacity (263) (336) (362) (329) (365) (387) (446) (434) (470) (487) (474) Percent of STATE Capacity 86.8% 83.1% 81.8% 83.5% 81.7% 80.6% 77.6% 78.2% 76.4% 75.6% 76.2%Over (Under) Functional Capacity (104) (177) (203) (170) (206) (228) (287) (275) (311) (328) (315) Percent of Functional Capacity 94.3% 90.4% 88.9% 90.7% 88.8% 87.6% 84.4% 85.0% 83.1% 82.1% 82.8%
CapacityState Rated Functional

47
Carroll County Public Schools Actual & Projected EnrollmentEducational Facilities Master Plan - 2017-2026MIDDLE SCHOOLSNortheast
Enrollment Enrollment EnrollmentActual Projected Projected
School 6-8 Spec Ed 6-8 Spec Ed 2016 2017 2018 2019 2020 2021 2022 2023 2024 2025 2026North Carroll 850 20 750 20 587 580 585 586 613 575 551 525 532 528 532
Over (Under) State Rated Capacity (283) (290) (285) (284) (257) (295) (319) (345) (338) (342) (338) Percent of STATE Capacity 67.5% 66.7% 67.2% 67.4% 70.5% 66.1% 63.3% 60.3% 61.1% 60.7% 61.1%Over (Under) Functional Capacity (183) (190) (185) (184) (157) (195) (219) (245) (238) (242) (238) Percent of Functional Capacity 76.2% 75.3% 76.0% 76.1% 79.6% 74.7% 71.6% 68.2% 69.1% 68.6% 69.1%
Shiloh 871 20 825 20 660 658 649 622 587 577 578 598 587 587 593 Over (Under) State Rated Capacity (231) (233) (242) (269) (304) (314) (313) (293) (304) (304) (298) Percent of STATE Capacity 74.1% 73.8% 72.8% 69.8% 65.9% 64.8% 64.9% 67.1% 65.9% 65.9% 66.6%Over (Under) Functional Capacity (185) (187) (196) (223) (258) (268) (267) (247) (258) (258) (252) Percent of Functional Capacity 78.1% 77.9% 76.8% 73.6% 69.5% 68.3% 68.4% 70.8% 69.5% 69.5% 70.2%
TOTALS 1721 40 1575 40 1,247 1,238 1,234 1,208 1,200 1,152 1,129 1,123 1,119 1,115 1,125 Over (Under) State Rated Capacity (514) (523) (527) (553) (561) (609) (632) (638) (642) (646) (636) Percent of STATE Capacity 70.8% 70.3% 70.1% 68.6% 68.1% 65.4% 64.1% 63.8% 63.5% 63.3% 63.9%Over (Under) Functional Capacity (368) (377) (381) (407) (415) (463) (486) (492) (496) (500) (490) Percent of Functional Capacity 77.2% 76.7% 76.4% 74.8% 74.3% 71.3% 69.9% 69.5% 69.3% 69.0% 69.7%
CapacityState Rated Functional

48
Carroll County Public Schools Actual & Projected EnrollmentEducational Facilities Master Plan - 2017-2026MIDDLE SCHOOLSWestern Area
Enrollment Enrollment EnrollmentActual Projected Projected
School 6-8 Spec Ed 6-8 Spec Ed 2016 2017 2018 2019 2020 2021 2022 2023 2024 2025 2026
Northwest 850 20 750 20 640 659 669 673 655 609 618 619 621 608 614 Over (Under) State Rated Capacity (230) (211) (201) (197) (215) (261) (252) (251) (249) (262) (256) Percent of STATE Capacity 73.6% 75.7% 76.9% 77.4% 75.3% 70.0% 71.0% 71.1% 71.4% 69.9% 70.6%Over (Under) Functional Capacity (130) (111) (101) (97) (115) (161) (152) (151) (149) (162) (156) Percent of Functional Capacity 83.1% 85.6% 86.9% 87.4% 85.1% 79.1% 80.3% 80.4% 80.6% 79.0% 79.7%
TOTALS 850 20 750 20 640 659 669 673 655 609 618 619 621 608 614 Over (Under) State Rated Capacity (230) (211) (201) (197) (215) (261) (252) (251) (249) (262) (256) Percent of STATE Capacity 73.6% 75.7% 76.9% 77.4% 75.3% 70.0% 71.0% 71.1% 71.4% 69.9% 70.6%Over (Under) Functional Capacity (130) (111) (101) (97) (115) (161) (152) (151) (149) (162) (156) Percent of Functional Capacity 83.1% 85.6% 86.9% 87.4% 85.1% 79.1% 80.3% 80.4% 80.6% 79.0% 79.7%
CapacityState Rated Functional

49
Carroll County Public Schools Actual & Projected EnrollmentEducational Facilities Master Plan - 2017-2026HIGH SCHOOLS
Enrollment Enrollment EnrollmentActual Projected Projected
School 9-12 Spec Ed Total 2016 2017 2018 2019 2020 2021 2022 2023 2024 2025 2026Century 1352 10 1362 1093 1153 1143 1121 1089 1063 1043 1010 1033 985 980
(269) (209) (219) (241) (273) (299) (319) (352) (329) (377) (382) 80.2% 84.7% 83.9% 82.3% 80.0% 78.0% 76.6% 74.2% 75.8% 72.3% 72.0%
Francis Scott Key 1224 30 1254 954 912 917 886 848 883 860 860 831 810 807(300) (342) (337) (368) (406) (371) (394) (394) (423) (444) (447)
76.1% 72.7% 73.1% 70.7% 67.6% 70.4% 68.6% 68.6% 66.3% 64.6% 64.4%
Liberty 1118 20 1138 1106 1112 1060 1059 1012 995 949 946 949 977 1005(32) (26) (78) (79) (126) (143) (189) (192) (189) (161) (133)
97.2% 97.7% 93.1% 93.1% 88.9% 87.4% 83.4% 83.1% 83.4% 85.9% 88.3%
Manchester Valley 1373 10 1383 1357 1344 1336 1385 1356 1372 1360 1335 1310 1278 1255(26) (39) (47) 2 (27) (11) (23) (48) (73) (105) (128)
98.1% 97.2% 96.6% 100.1% 98.0% 99.2% 98.3% 96.5% 94.7% 92.4% 90.7%
South Carroll 1309 30 1339 1053 1044 1033 1002 983 930 897 891 864 877 878(286) (295) (306) (337) (356) (409) (442) (448) (475) (462) (461)
78.6% 78.0% 77.1% 74.8% 73.4% 69.5% 67.0% 66.5% 64.5% 65.5% 65.6%
Westminster 1798 40 1838 1506 1537 1526 1520 1487 1427 1410 1334 1324 1303 1264(332) (301) (312) (318) (351) (411) (428) (504) (514) (535) (574)
81.9% 83.6% 83.0% 82.7% 80.9% 77.6% 76.7% 72.6% 72.0% 70.9% 68.8%
Winters Mill 1309 30 1339 1084 1113 1115 1088 1103 1104 1122 1133 1133 1114 1092(255) (226) (224) (251) (236) (235) (217) (206) (206) (225) (247)
81.0% 83.1% 83.3% 81.3% 82.4% 82.4% 83.8% 84.6% 84.6% 83.2% 81.6%TOTALS 9,483 170 9,653 8,153 8,215 8,130 8,061 7,878 7,774 7,641 7,509 7,444 7,344 7,281
(1,500) (1,438) (1,523) (1,592) (1,775) (1,879) (2,012) (2,144) (2,209) (2,309) (2,372) 84.5% 85.1% 84.2% 83.5% 81.6% 80.5% 79.2% 77.8% 77.1% 76.1% 75.4%
Comparisons are based on total State Rated capacity with FTE
Percent of STATE Capacity
Over (Under) State Rated Capacity
Over (Under) State Rated CapacityPercent of STATE Capacity
Percent of STATE Capacity
Percent of STATE Capacity
Over (Under) State Rated CapacityPercent of STATE Capacity
Capacity
Over (Under) State Rated CapacityPercent of STATE Capacity
Over (Under) State Rated Capacity
Over (Under) State Rated CapacityPercent of STATE Capacity
State Rated
Over (Under) State Rated CapacityPercent of STATE Capacity
Over (Under) State Rated Capacity
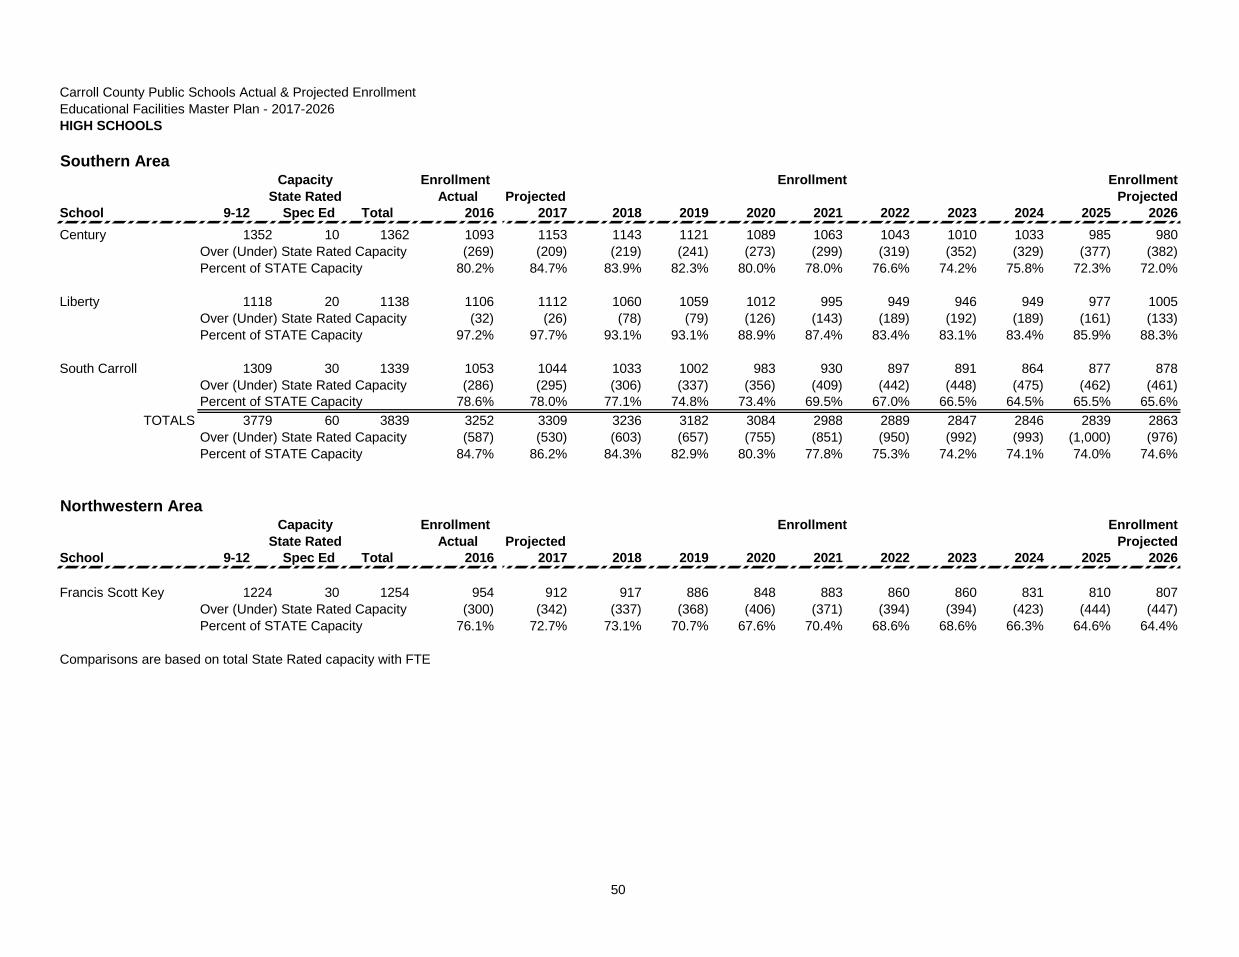
50
Carroll County Public Schools Actual & Projected EnrollmentEducational Facilities Master Plan - 2017-2026HIGH SCHOOLS
Southern AreaEnrollment Enrollment Enrollment
Actual Projected ProjectedSchool 9-12 Spec Ed Total 2016 2017 2018 2019 2020 2021 2022 2023 2024 2025 2026Century 1352 10 1362 1093 1153 1143 1121 1089 1063 1043 1010 1033 985 980
(269) (209) (219) (241) (273) (299) (319) (352) (329) (377) (382) 80.2% 84.7% 83.9% 82.3% 80.0% 78.0% 76.6% 74.2% 75.8% 72.3% 72.0%
Liberty 1118 20 1138 1106 1112 1060 1059 1012 995 949 946 949 977 1005(32) (26) (78) (79) (126) (143) (189) (192) (189) (161) (133)
97.2% 97.7% 93.1% 93.1% 88.9% 87.4% 83.4% 83.1% 83.4% 85.9% 88.3%
South Carroll 1309 30 1339 1053 1044 1033 1002 983 930 897 891 864 877 878(286) (295) (306) (337) (356) (409) (442) (448) (475) (462) (461)
78.6% 78.0% 77.1% 74.8% 73.4% 69.5% 67.0% 66.5% 64.5% 65.5% 65.6%TOTALS 3779 60 3839 3252 3309 3236 3182 3084 2988 2889 2847 2846 2839 2863
(587) (530) (603) (657) (755) (851) (950) (992) (993) (1,000) (976) 84.7% 86.2% 84.3% 82.9% 80.3% 77.8% 75.3% 74.2% 74.1% 74.0% 74.6%
Northwestern AreaEnrollment Enrollment Enrollment
Actual Projected ProjectedSchool 9-12 Spec Ed Total 2016 2017 2018 2019 2020 2021 2022 2023 2024 2025 2026
Francis Scott Key 1224 30 1254 954 912 917 886 848 883 860 860 831 810 807(300) (342) (337) (368) (406) (371) (394) (394) (423) (444) (447)
76.1% 72.7% 73.1% 70.7% 67.6% 70.4% 68.6% 68.6% 66.3% 64.6% 64.4%
Comparisons are based on total State Rated capacity with FTE
Over (Under) State Rated CapacityPercent of STATE Capacity
Over (Under) State Rated CapacityPercent of STATE Capacity
CapacityState Rated
Capacity
Over (Under) State Rated CapacityPercent of STATE Capacity
Over (Under) State Rated CapacityPercent of STATE Capacity
State Rated
Over (Under) State Rated CapacityPercent of STATE Capacity

51
Carroll County Public Schools Actual & Projected EnrollmentEducational Facilities Master Plan - 2017-2026HIGH SCHOOLS
Northeastern AreaEnrollment Enrollment Enrollment
Actual Projected ProjectedSchool 9-12 Spec Ed Total 2016 2017 2018 2019 2020 2021 2022 2023 2024 2025 2026
Manchester Valley 1373 10 1383 1357 1344 1336 1385 1356 1372 1360 1335 1310 1278 1255(26) (39) (47) 2 (27) (11) (23) (48) (73) (105) (128)
98.1% 97.2% 96.6% 100.1% 98.0% 99.2% 98.3% 96.5% 94.7% 92.4% 90.7%
TOTALS 1373 10 1383 1357 1344 1336 1385 1356 1372 1360 1335 1310 1278 1255
(26) (39) (47) 2 (27) (11) (23) (48) (73) (105) (128) 98.1% 97.2% 96.6% 100.1% 98.0% 99.2% 98.3% 96.5% 94.7% 92.4% 90.7%
Westminster AreaEnrollment Enrollment Enrollment
Actual Projected ProjectedSchool 9-12 Spec Ed Total 2016 2017 2018 2019 2020 2021 2022 2023 2024 2025 2026
Westminster 1798 40 1838 1506 1537 1526 1520 1487 1427 1410 1334 1324 1303 1264(332) (301) (312) (318) (351) (411) (428) (504) (514) (535) (574)
81.9% 83.6% 83.0% 82.7% 80.9% 77.6% 76.7% 72.6% 72.0% 70.9% 68.8%
Winters Mill 1309 30 1339 1084 1113 1115 1088 1103 1104 1122 1133 1133 1114 1092(255) (226) (224) (251) (236) (235) (217) (206) (206) (225) (247)
81.0% 83.1% 83.3% 81.3% 82.4% 82.4% 83.8% 84.6% 84.6% 83.2% 81.6%TOTALS 3107 70 3177 2590 2650 2641 2608 2590 2531 2532 2467 2457 2417 2356
(587) (527) (536) (569) (587) (646) (645) (710) (720) (760) (821) 81.5% 83.4% 83.1% 82.1% 81.5% 79.7% 79.7% 77.7% 77.3% 76.1% 74.2%
Comparisons are based on total State Rated capacity with FTE
Over (Under) State Rated CapacityPercent of STATE Capacity
CapacityState Rated
Over (Under) State Rated CapacityPercent of STATE Capacity
CapacityState Rated
Over (Under) State Rated CapacityPercent of STATE Capacity
Over (Under) State Rated CapacityPercent of STATE Capacity
Over (Under) State Rated CapacityPercent of STATE Capacity
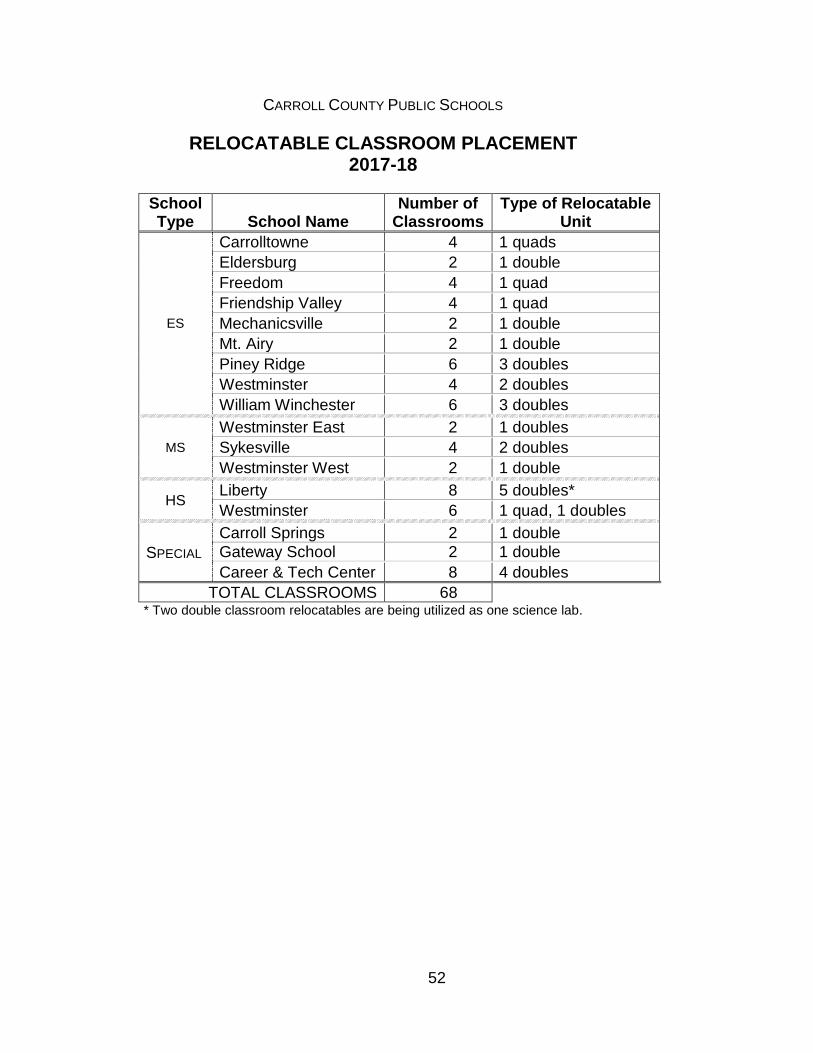
52
CARROLL COUNTY PUBLIC SCHOOLS RELOCATABLE CLASSROOM PLACEMENT 2017-18
School Type
School Name
Number of Classrooms
Type of Relocatable Unit
ES
Carrolltowne 4 1 quads Eldersburg 2 1 double Freedom 4 1 quad Friendship Valley 4 1 quad Mechanicsville 2 1 double Mt. Airy 2 1 double Piney Ridge 6 3 doubles Westminster 4 2 doubles William Winchester 6 3 doubles
MS Westminster East 2 1 doubles
Sykesville 4 2 doubles Westminster West 2 1 double
HS Liberty 8 5 doubles* Westminster 6 1 quad, 1 doubles
SPECIAL Carroll Springs 2 1 double
Gateway School 2 1 double Career & Tech Center 8 4 doubles TOTAL CLASSROOMS 68
* Two double classroom relocatables are being utilized as one science lab.