capillary electrochromatography: a versatile instrumental ... · capillary electrochromatography: a...
TRANSCRIPT
University of Helsinki
Department of Chemistry
Finland
CAPILLARY ELECTROCHROMATOGRAPHY:
A VERSATILE INSTRUMENTAL TECHNIQUE FORNANODOMAIN INTERACTION STUDIES
Lucia D’Ulivo
ACADEMIC DISSERTATION
To be presented, with the permission of
the Faculty of Science of the University of Helsinki
for public criticism in Chemicum, Auditorium A110,
(A.I. Virtasen aukio 1, Helsinki)
on January 29th, at 12 o’clock noon.
Helsinki 2010
Custos
Prof. Dr. Marja-Liisa Riekkola
Laboratory of Analytical Chemistry
Department of Chemistry
University of Helsinki
Finland
Reviewers
Prof. Dr. Pat Sandra
Pfizer Analytical Research Center
Department of Organic Chemistry
Ghent University
Belgium
and
Dr. Václav Ka ka
Institute of Organic Chemistry & Biochemistry
Academy of Science of the Czech Republic
Czech Republic
Opponent
Prof. Dr. Ernst Kenndler
Max F. Perutz Laboratories, Medical University of Vienna
Inst. Med. Biochem., Vienna Biocenter (VBC)
Vienna, Austria
ISBN 978-952-10-5968-1 (paperback)
ISBN 978-952-10-5969-8 (PDF)
http://ethesis.helsinki.fi/
Helsinki University Printing House, 2010
1
Table of Contents
Preface ........................................................................................................................................................5
Abstract ......................................................................................................................................................8
List of abbreviations...............................................................................................................................10
List of symbols.........................................................................................................................................14
List of original papers ............................................................................................................................16
1 Introduction..........................................................................................................................................18
2 Low-density lipoprotein particles and cardiovascular diseases ...................................................21
2.1 Atherosclerosis and cardiovascular diseases ................................................................................21
2.2 Low-density lipoprotein (LDL) .....................................................................................................21
2.3 Extracellular matrix ........................................................................................................................23
2.4 Interactions of LDL particles with extracellular matrix components, their retention and
modifications.........................................................................................................................................23
2.5 Modification of extracellular matrix components in diabetes .....................................................24
3 Techniques used in the studies ..........................................................................................................25
3.1 Capillary electromigration techniques...........................................................................................25
Principle of capillary electrochromatography................................................................................27
Instrumentation for capillary electromigration techniques ...........................................................28
3.2 Scanning electron microscopy .......................................................................................................29
3.3 Atomic force microscopy...............................................................................................................29
3.4 Quartz crystal microbalance technique .........................................................................................30
3.5 Field-flow fractionation..................................................................................................................31
4 Experimental ........................................................................................................................................32
4.1 Chemicals........................................................................................................................................32
2
4.2 Instruments and equipment ............................................................................................................32
4.3 Methods...........................................................................................................................................32
4.3.1 Isolation of human LDL..........................................................................................................32
4.3.2 Preparation of LDL-derived microemulsions (microemulsions) and microemulsions from
commercial lipids (SM mimics).......................................................................................................35
4.3.3 Buffer preparation....................................................................................................................36
4.3.4 Synthesis of apoB-100 peptide fragments..............................................................................37
4.3.5 Preparation and modification of coatings ..............................................................................37
4.3.6 Study of coatings and coating interactions.............................................................................39
Study of coating lifetime ...................................................................................................................40
Measurement of isoelectric point of the coating .............................................................................41
Asymmetrical flow field-flow fractionation studies ........................................................................41
Radioactivity measurements.............................................................................................................41
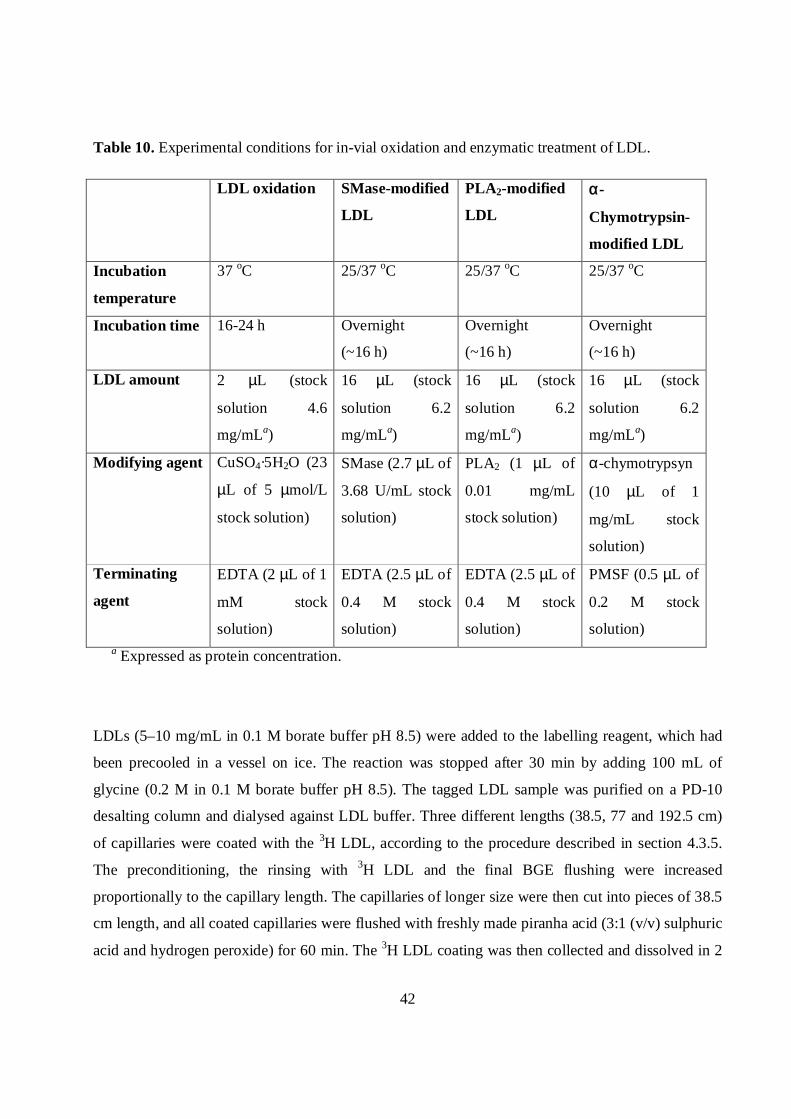
Scanning electron microscopy and atomic force microscopy studies ...........................................43
4.3.7 Quartz crystal microbalance studies.......................................................................................43
5 Results and discussion.........................................................................................................................46
5.1 Coating of capillaries with biomaterials........................................................................................46
5.1.1 Development of LDL and microemulsion coatings ..............................................................46
5.1.2 Development of collagen and collagen–decorin coatings.....................................................47
5.1.3 Stability and coating-to-coating reproducibility ....................................................................49
5.2 Development of methods for modification and in situ reactions of biomaterial coatings .........50
5.2.1 Oxidation of LDL coating.......................................................................................................50
5.2.2 Enzymatic modification of LDL coating ...............................................................................51
5.2.3 In situ delipidation of LDL .....................................................................................................51
5.2.4 In situ glycation of collagen I .................................................................................................51
3
5.2.5 Preparation of sensor chips in QCM ......................................................................................52
5.3 Measurements of EOF mobility.....................................................................................................53
5.3.1 Oxidized LDL coatings ...........................................................................................................54
5.3.2 LDL coatings after enzymatic modification ..........................................................................55
LDL modified with SMase ................................................................................................................55
LDL modified with PLA2...................................................................................................................56
LDL modified with α-chymotrypsin .................................................................................................57
Microemulsions modified with SMase .............................................................................................58
5.3.3 Delipidated LDL (apoB-100) coating ....................................................................................59
5.3.4 Collagen and collagen–decorin coatings................................................................................60
5.3.5 Glycated collagen I coating.....................................................................................................60
5.4 Measurements of retention factors (k) and distribution coefficients (KD) ..................................61
5.4.1 Unmodified and oxidized LDL coatings................................................................................62
5.4.2 LDL coatings after enzymatic modification ..........................................................................63
LDL modified with SMase ................................................................................................................63
LDL modified with PLA2...................................................................................................................64
LDL modified with α-chymotrypsin .................................................................................................65
Microemulsions modified with SMase .............................................................................................66
5.4.3 Delipidated LDL (apoB-100) coating and interaction with steroids ....................................67
5.4.4 Interactions of apoB-100 peptide fragments with collagen and collagen-decorin coatings68
5.4.5 Interactions of native and oxidized LDL and of PP with glycated collagen I coating........71
5.5 Determination of the isoelectric point...........................................................................................73
5.6. Supporting studies .........................................................................................................................73
5.6.1 Asymmetrical flow field-flow fractionation ..........................................................................73
5.6.2 Scanning electron microscopy and atomic force microscopy studies..................................74
4
Scanning electron microscopy .........................................................................................................75
Atomic force microscopy ..................................................................................................................76
5.6.3 ζ-Potential measurements .......................................................................................................78
5.6.4 Radioactivity measurements ...................................................................................................79
5.7 QMC studies: development of new biological surfaces for interaction studies .........................79
5.7.1 PP and PP2 sensor chips ..........................................................................................................79
5.7.2 Collagen and C6S sensor chips...............................................................................................81
6 Conclusions...........................................................................................................................................83
7 References .............................................................................................................................................85
APPENDICES: PAPERS I-VI
5
PrefaceThis thesis is based on research carried out in the Laboratory of Analytical Chemistry of the
Department of Chemistry, University of Helsinki, during the years 2005-2010. Funding was
provided by graduate School of Chemical Sensors and Microanalytical Systems (CHEMSEM) and
the Academy of Finland, Research Council for Natural Sciences and Engineering.
I would like to warmly thank Professor Marja-Liisa Riekkola to have believed in me and given me
the possibility to carry out my doctoral studies in the Laboratory of Analytical Chemistry. I’m
grateful to Professor Ernst Kenndler for accepting to act as opponent. I thank Dr. Václav Ka ka
and Professor Pat Sandra to have revised my doctoral thesis and supplied valuable comments. I’m
also in debit with Kathleen Ahonen for carefully and patiently revising the papers presented here as
well as the final thesis.
Then, I would like to thank my colleagues which whom I shared this period. I’m especially grateful
to Dr. Ruth Shimmo (formerly Kuldvee) that had patiently introduced me to the open tubular
capillary electrochromatography. A warm thank to Joanna Witos and Kati Vainikka, which shared
the office with me, and to Géraldine Cilpa for their positive characters and for making the working
days more pleasant. As a collegue, I’m also grateful for their help in the laboratory, for useful
discussions and for the great work in team.
I’m grateful to Matti Jussila and Pentti Jyske to fix all the problems occurred with the instruments
and/or the software. I thank Liisa Heino to provide the chemicals and the supplies needed for the
experiments. I’m also grateful to Merit Hortling for her effectiveness and for her help with several
bureaucratic procedures, about which I was often totally puzzled.
Also, a great thank to present and former laboratory staff and co-workers: Ai-Jun, Anne, Antti,
Arvind, Gebrenegus, Giovanni, Juhani, Jaakko, Jaana, Jana, Jari, Jaroslav, Jevgeni, Jie, Joonas, José,
Kari, Laura, Maria, Minna, Maarit, Nanyin, Pepe, Simo, Susanne, Tapio, Totti, Tuulia, Yi.
A special thank to Professor Petri T. Kovanen and Dr. Katariina Öörni, our collaborators from the
Wihuri Research Institute, that have provided the low-density lipoproteins needed for the studies.
Moreover, thanks for our stimulating meetings and for useful discussions, I learnt so much from you.

6
I would like to remember our collaborators from Attana AB, Stockholm, namely Dr. Björn
Ingemarsson and Dr. Julien Saint-Guirons. Thanks for introducing me to the quartz crystal
microbalance technique and for the valuable discussions during our joint project.
I’m also grateful to Dr. Kristoffer Meinander for helpful discussion concerning atomic force
microscopy images.
A warm thank to all the friends I met in Finland: Nadia, Silvia, Francesco, Felice, Andrea
Ambrosioni, Valentina, Rossella, Andrea Bacioccola, Francesca, Roberto, Simone, Anne, Tamara,
Harri, Katariina, Fanny, Marianna, Jan and Beatriz. Thanks to share this adventure with me and to
make my stay better! In particular, a special thought for Nadia, Silvia and Gigi that have been stood
by me during the toughest moments.
Then my dear, great friends Barbara and Laura: I think a whole book may not be long enough to tell
how much you count for me! Thanks for your friendship that has survived despite the distance and
the personal vicissitudes.
I cannot forget my friends in Italy: Francesca Aversa, Francesca Galli, Mariapia, and the others that
have supported me during this period abroad.
I would like to thank the persons working at the IPCF, in Pisa: Massimo, Roberto, Emanuela and, in
particular, Emilia that has taught me so much and has encouraged me during this experience abroad.
I cannot forget my lovely, big, family that I missed so much during these years. Mamma e papa’,
grazie per il vostro supporto, per il vostro amore, per avermi lasciata sempre libera di scegliere,
senza imposizione alcuna. Capisco che questi anni di lontananza siano stati duri anche per voi e ho
capito che lasciare crescere i propri figli e’ un mestiere difficile, ma per questo vi stimo ancora di
piu’. Per non parlare dei miei nonni, Piera, Moreno, Dora e Massimiliano, a cui sono legati i miei
piu’ cari ricordi d’infanzia. Mia zia Serena, una delle persone che meglio mi capisce, una seconda
madre con cui condivido una grande empatia. I miei cugini Gabriele, Simona e Mariapia: siete
come dei fratelli per me. Ed ancora: Manuela e Raffaello, siete stati e siete ancora parte integrante
della mia famiglia e della mia vita. You are all so dear to me!
Finally, last but not least, my beloved Nicola. Maybe, I do not need to say you how much you are for
me. Anyway, I think if I’m here, defending my thesis, it’s mostly because of you, supporting and

7
driving me with all your love and your optimism. I actually wonder if I would have been able to go
through these four years by myself. So, my dear Nicola, this thesis is also yours.
8
AbstractThis doctoral thesis describes the development of a miniaturized capillary electrochromatography
(CEC) technique suitable for the study of interactions between various nanodomains of biological
importance.
The particular focus of the study was low-density lipoprotein (LDL) particles and their interaction
with components of the extracellular matrix (ECM). LDL transports cholesterol to the tissues
through the blood circulation, but when the LDL level becomes too high the particles begin to
permeate and accumulate in the arteries. Through binding sites on apolipoprotein B-100 (apoB-100),
LDL interacts with components of the ECM, such as proteoglycans (PGs) and collagen, in what is
considered the key mechanism in the retention of lipoproteins and onset of atherosclerosis.
Hydrolytic enzymes and oxidizing agents in the ECM may later successively degrade the LDL
surface. Metabolic diseases such as diabetes may provoke damage of the ECM structure through the
non-enzymatic reaction of glucose with collagen.
In this work, fused silica capillaries of 50 µm i.d. were successfully coated with LDL and collagen,
and steroids and apoB-100 peptide fragments were introduced as model compounds for interaction
studies. The LDL coating was modified with copper sulphate or hydrolytic enzymes, and the
interactions of steroids with the native and oxidized lipoproteins were studied. Lipids were also
removed from the LDL particle coating leaving behind an apoB-100 surface for further studies. The
development of collagen and collagen–decorin coatings was helpful in the elucidation of the
interactions of apoB-100 peptide fragments with the primary ECM component, collagen.
Furthermore, the collagen I coating provided a good platform for glycation studies and for
clarification of LDL interactions with native and modified collagen.
All methods developed are inexpensive, requiring just small amounts of biomaterial. Moreover, the
experimental conditions in CEC are easily modified, and the analyses can be carried out in a
reasonable time frame.
Other techniques were employed to support and complement the CEC studies. Scanning electron
microscopy and atomic force microscopy provided crucial visual information about the native and
modified coatings. Asymmetrical flow field-flow fractionation enabled size measurements of the
modified lipoproteins. Finally, the CEC results were exploited to develop new sensor chips for a
9
continuous flow quartz crystal microbalance technique, which provided complementary information
about LDL–ECM interactions.
This thesis demonstrates the potential of CEC as a valuable and flexible technique for surface
interaction studies. Further, CEC can serve as a novel microreactor for the in situ modification of
LDL and collagen coatings. The coatings developed in this study provide useful platforms for a
diversity of future investigations on biological nanodomains.
10
List of abbreviationsAFM atomic force microscopy
AGE advanced glycation end product
ApoB-100 apolipoprotein B-100
AsFlFFF asymmetrical flow field-flow fractionation
BGE background electrolyte
BSA bovine serum albumin
CE capillary electrophoresis
CEC capillary electrochromatography
CGE capillary gel electrophoresis
CITP capillary isotachophoresis
C6S chondroitin 6-sulphate
DAG diacylglycerol
DIEA N,N-diisopropylethylamine
Dihydro-SM N-lauroyl-D-erythro-sphinganylphosphorylcholine
DLS dynamic light scattering
DMF N,N-dimethylformamide
DMSO dimethyl sulphoxide
ECM extracellular matrix
EDC 1-ethyl-3-(3-dimethylaminopropyl) carbodiimide hydrochloride
EDTA ethylenediaminetetraacetic acid
11
EOF electroosmotic flow
FFF field-flow fractionation
FlFFF flow field-flow fractionation
GAG glycoaminoglycans
HCTU O-(6-chlorobenzotriazol-1-yl)-N,N,N´,N´-tetramethyluronium
hexafluorophosphate
HDL high density lipoprotein
HEPES 4-(2-hydroxyethyl)-1-piperazineethanesulphoric acid
HPLC high pressure liquid chromatography
i.d. inner diameter
IDL intermediate-density lipoprotein
LC liquid chromatography
LDL low-density lipoprotein
LIF laser induced fluorescence
MALDI matrix-assisted laser desorption/ionization
MEEKC microemulsion electrokinetic chromatography
MEKC micellar electrokinetic chromatography
MS mass spectrometry
MWCO molecular weight cut-off
NeuP1 neutral peptide fragment of apolipoprotein B-100 with 12 amino acids
NeuP2 neutral peptide fragment of apolipoprotein B-100 with 11 amino acids
12
NHS N-hydroxysuccinimmide
NMM 4-methylmorpholine
NMR nuclear magnetic resonance
NP negative peptide fragment of apolipoprotein B-100 with 17 amino acids
o.d. outer diameter
PBS phosphate buffered saline
PC phosphatidylcholine
PG proteoglycan
PGm proteoglycan monomer
PLA2 phospholipase A2
PMSF phenylmethylsulphonyl fluoride
POPC 1-palmitoyl-2-oleyl-sn-glycero-3-phosphatidylcholine
PP positive peptide fragment of apolipoprotein B-100 with 19 amino acids
PP2 positive peptide fragment of apolipoprotein B-100 with 42 amino acids
PS polystyrene
QCM quartz crystal microbalance
SEM scanning electron microscopy
SM sphingomyelin
SMase sphingomyelinase
SM mimics microemulsions prepared from commercial lipids
SPR surface plasma resonance
13
Sulpho-NHS sulpho-N-hydroxysuccinimmide
TFA trifluoroacetic acid
TIS triisoprolylsilane
TOF time of flight
VLDL very-low-density lipoprotein

14
List of symbolsβ phase ratio
CM concentration of mobile phase
CS concentration of stationary phase
∆f frequency shift
E electric field strength
e elementary charge
ε permittivity in solution
df thickness of the stationary phase
k retention factor
KD distribution coefficient
Kd binding constant
kOT-CEC retention factor in open tubular capillary electrochromatography
Ldet detection length
Ltot total length
mM mass of the mobile phase
mS mass of the stationary phase
µeo electroosmotic mobility
µep electrophoretic mobility
µtot total mobility
η dynamic viscosity
15
r Stokes radius
rc column radius
teo migration time of the EOF marker
tm migration time of the analyte
V applied voltage
ve electrophoretic velocity
veo electroosmotic velocity
VM volume of the mobile phase
VS volume of the stationary phase
z number of elementary charges
ζ zeta potential
16
List of original papersThis doctoral thesis is based on the papers listed below, hereafter referred to by their Roman
numerals [I-VI].
I R. Kuldvee, L. D’Ulivo, G. Yohannes, P. W. Lindenburg, M. Laine, K. Öörni, P. Kovanen, M.-L.
Riekkola, Anal. Chem., 78 (2006) 2665-2671. Open tubular capillary electrochromatography:
technique for oxidation and interaction studies on human low-density lipoproteins. Copyright
American Chemical Society 2006
II L. D’Ulivo, G. Yohannes, K. Öörni, P. T. Kovanen, M.-L. Riekkola, Analyst, 132 (2007) 989-996.
Open tubular capillary electrochromatography: a new technique for in situ enzymatic modification of
low density lipoprotein particles and their protein-free derivatives. Copyright The Royal Society of
Chemistry 2007
III L. D’Ulivo, J. Chen, K. Meinander, K. Öörni, P. T. Kovanen, M.-L. Riekkola, Anal. Biochem.,
383 (2008) 38-43. In situ delipidation of low-density lipoproteins in capillary electrochromatography
yields apolipoprotein B-100-coated surfaces for interaction studies. Copyright Elsevier Science 2008
IV L. D’Ulivo, J. Witos, K. Öörni, P. T. Kovanen, M.-L. Riekkola, Electrophoresis, 30 (2009) 3838-
3845. Capillary electrochromatography: a tool for mimicking collagen surface interactions with
apolipoprotein B-100 peptides. Copyright Wiley-VCH 2009
V L. D’Ulivo, J. Witos, K. Öörni, P. T. Kovanen, M.-L. Riekkola, submitted for publication in Anal.
Chim. Acta, (2009). Capillary electrochromatography: useful microreactor for collagen I glycation
and interaction studies with low-density lipoprotein particles.
VI L. D’Ulivo, J. Saint-Guirons, B. Ingemarsson, M.-L. Riekkola, Anal. Bioanal. Chem. (2009) DOI
10.1007/s00216-009-3371-y. Quartz crystal microbalance, a valuable tool for elucidation of weak
interactions between biomolecules. Copyright Springer-Verlag 2009

17
The contribution of the author:
Paper I: part of the experimental work related to capillary electrochromatography
Paper II: experimental work related to capillary electrochromatography and writing of the article
Paper III: experimental work related to capillary electrochromatography and writing of the article
Paper IV: experimental work related to capillary electrochromatography and writing of the article
Paper V: experimental work related to capillary electrochromatography and writing of the article
Paper VI: experimental work and writing of the article

18
1 IntroductionThe emerging field of nanoscience and nanotechnologies is ushering in a new era of nanodevices
and nanodomain research. With the pressing need for miniaturized devices capable of carrying out
analyses in shorter time and with lower consumption of compounds, nanoscience is assuming an
important place alongside the conventional analytical techniques. In bioanalysis, in particular, where
only small amounts of analytes are available, miniaturized systems that minimize sample
consumption are essential. Miniaturized instruments are also finding important applications in
clinical analysis, vastly speeding up routine tests of physiological samples.
With atherosclerosis one of the main causes of morbidity and mortality in industrialized countries,
research on the disease has been increasing at a rapid pace. Close attention is being paid to
lipoproteins and, in particular, to low-density lipoproteins (LDL), which are imputed as the main
cause of atherosclerosis. Innumerable studies have been carried out with the aim of comprehending
their modality of accumulation and modification in the arteries.
Several procedures are available for lipoprotein isolation and characterization. Understanding of
lipoprotein structure is crucial for clarifying the modality of interaction of lipoproteins with the
arterial extracellular matrix (ECM) and with the enzymes located there. Slab gel electrophoresis was
one of the first techniques employed for the separation and characterization of LDL and other
plasma lipoproteins (1,2). Techniques such as liquid chromatography (LC) and asymmetrical flow
field-flow fractionation (AsFlFFF) have also made a great contribution to the separation of
lipoproteins. In addition, column microtiters have been helpful in the clarification of interactions
between LDL and ECM components such as proteoglycans. Fluorescence and UV spectrometers
have been employed for the determination of kinetics and the degree of LDL oxidation (3,4), while
AsFlFFF has proven useful for measuring the sizes of lipoproteins after their oxidation and
enzymatic modification (5) Although all these techniques have played an important role in LDL
isolation, and in providing reliable information about the modality of LDL interactions and
modifications, there are also a number of drawbacks. LDLs are huge molecules, and samples are
highly complex, which means that experienced staff is required for the task of isolation. In addition,
earlier studies have mostly been carried out in vials or with use of techniques that, although valuable,
require high consumption of material. For these reasons, there is a great need for faster and
miniaturized techniques that save time and sample material without sacrificing reliability. The size
19
of LDLs and their complex interactions with the ECM pose a challenging task for the developer of
new tools. The advent of capillary electrophoresis (CE) and microchip electrophoresis has opened up
new possibilities for miniaturization and for novel studies. (6,7)
In CE, analytes are separated in an electric field according to their charge, size and shape of their
molecules. In comparison with other separation techniques, such as high pressure liquid
chromatography (HPLC), CE has the advantage that runs are performed in shorter time and
resolution is better. CE is actually one of a family of techniques, of which micellar electrokinetic
chromatography (MEKC), microemulsion electrokinetic chromatography (MEEKC) and capillary
electrochromatography (CEC) also allow the separation of uncharged analytes. (8-14) CEC can
further be considered a special case of capillary liquid chromatography, where the movement of the
mobile phase through a capillary that is filled, packed or coated with a stationary phase is achieved
by electroosmotic flow. (15-18) Because the retention of the analyte on a stationary phase depends
upon both electrophoretic migration and chromatography, CEC offers great flexibility and potential
for elucidation of the interactions of nanodomains of biological importance.
The aim of this doctoral work was to develop microsystems that enable interaction studies between
biomaterials and biomarkers involved in the development of pathologies in human beings. Special
emphasis was put on the possibility of carrying out in situ studies with these miniaturized tools, with
the attached benefits of time saving, decreased sample consumption and enhanced reliability. CEC
was selected as the technique of choice because the presence of a stationary phase enhances its
versatility. CEC also allows easy and rapid changes in experimental parameters, such as pH,
temperature and background electrolyte composition.
LDL particles were used as stationary phase in CEC to understand how they are modified when
exposed to copper sulphate (I) or enzymes in the capillary (II). In addition, flushing of LDL coating
with non-ionic surfactant almost totally removed the lipids, leaving a fresh apolipoprotein apoB-100
surface suitable for further investigations (III). In studies I, II and III, neutral steroids that can
promote the development of atherosclerosis, were employed as model compounds. The interactions
between LDL and uncharged steroids are mainly based on hydrophobicity, and changes in the
coating charge density affect the affinity of the coating for the model compounds. Because LDL–
ECM interactions play an important role in the onset and progression of atherosclerosis, a method of
preparing collagen and collagen–decorin coatings was developed as well (IV). Selected apoB-100
20
peptide fragments were used as marker compounds for the evaluation of apoB-100 interactions with
collagens I and III. Calculated retention factors (k) employed to describe the strength of affinity
indicated the importance of decorin for the interactions and for the entrapment of LDL by the ECM.
Since atherosclerosis has frequently been linked to diabetes, capillaries coated with collagen I were
glycated in situ to provide a platform for interaction studies between native and oxidized LDL and
glycated collagen I (V). The results obtained by CEC were exploited in studies on a continuous flow
quartz crystal microbalance (QCM), which gave both supportive and complementary information on
LDL–ECM interactions (VI).
All methods employed required only small amounts of compounds and provided results in a
reasonable time period. The flexibility and versatility of CEC as a tool suitable for interaction studies
were clearly demonstrated.
Scanning electron microscopy (SEM), atomic force microscopy (AFM) and AsFlFFF were
employed as supportive and complementary techniques. The specific targets of my study were the
following:
• To develop a low-density lipoprotein (LDL) coating in a capillary for clarification, by CEC,
of modifications to LDL upon in situ oxidation with copper sulphate (I)
• To study the suitability of the LDL-coated capillary as a microreactor in in situ treatment of
LDL with hydrolytic enzymes (II)
• To delipidate in situ LDL particles acting as stationary phase in the capillary and so isolate
the apolipoprotein B-100 (apoB-100) surface for use in interaction studies with biological
marker compounds (III)
• To coat the capillaries with collagen I, collagen III, collagen I-decorin and collagen III-
decorin, and to clarify the interactions with selected apoB-100 peptide fragments (IV)
• To develop a method for in situ glycation of collagen I enabling interaction studies with
native and oxidized LDL (V)
• To apply the results obtained with the LDL and collagen coatings in CEC to studies on QCM
chip surfaces, and so calculate numerical values for the interactions (VI)
21
2 Low-density lipoprotein particles and cardiovascular diseasesRetention of low-density lipoprotein (LDL) particles in the arteries is considered the main cause of
atherosclerosis. In this chapter, the onset of atherosclerosis, the structure of LDLs and the modality
of LDL entrapment in the arteries are described.
2.1 Atherosclerosis and cardiovascular diseases
Atherosclerosis is a chronic inflammation of the arteries and a disorder of the lipid methabolism.
(19-21) The capillary wall consists of three concentric layers: intima, media and adventitia. The
intima is the inner layer of the capillary wall and lies in direct contact with the blood circulation.
Atherosclerosis, which is associated with high levels of cholesterol in the blood, originates from the
accumulation of LDL in the arteries. (22-24) LDL can then interact with the components of the
extracellular matrix (ECM) and become entrapped in the intima. (25-29) Later, it may be modified
by enzymes and/or oxidizing agents, with resultant aggregation and fusion. (30,31) These events
activate macrophages and may arouse a chronic inflammatory response. (32-34) After undergoing
modification, and possibly aggregation and fusion as well, LDLs have strengthened affinity for
arterial proteoglycans (PGs), and the retention of LDLs in the intima is enhanced. (35,36) Once
formed, the atherosclerotic plaque (atheroma) can continue to grow, with consequent thickening of
the arteries and narrowing of the lumen. The circulation becomes obstructed and blood pressure rises
as a compensatory response. The probability of tissue ischemia, ictus and infarct increases in pace.
Together with cancer, atherosclerosis is a primary cause of premature death in Western countries. A
sedentary life-style, reduced bodily activity and a fat-rich diet are considered to be the main triggers
of this disease. Genetic defects, such as mutation of the apoB-100 site, may contribute by impairing
the removal of LDL from the blood circulation, with consequent accumulation in the artery. (37-39)
For these reasons, clarification of the mechanisms leading to the formation of atherosclerotic plaques
has become a key concern of medical research.
2.2 Low-density lipoprotein (LDL)
Plasma LDLs are spherical particles with an estimated diameter of about 22 nm (40) and, like other
lipoproteins, they are involved in the transport of cholesterol in the blood circulation. LDLs originate
from the metabolism of chylomicrons and very-low-density lipoprotein (VLDL) particles, which are
synthesised by the intestine and the liver, respectively, and transport the lipids to the tissues. (41) As
lipids are released, the density of the lipoproteins increases; VLDLs are converted to intermediate-
22
density lipoproteins (IDL) and eventually to LDL. The conversion of IDLs to LDLs proceeds
particularly through the removal of triglycerides, performed by hepatic lipase. (22)
LDLs consist of a hydrophobic core of triglycerides and free and esterified cholesterol, which is
surrounded by a monolayer of phospholipids, mostly made up of phosphatidylcholine (PC) and
sphingomyelin (SM) (40,30). Unlike VLDLs, LDLs contain only one protein, namely,
apolipoprotein B-100 (apoB-100), which wraps the particle like a ribbon, while also taking contact
with the hydrophobic core. (42-44) The huge molecular mass (about 512 kDa) and the
hydrophobicity make the isolation and characterization of apoB-100 extremely challenging. (45-47)
ApoB-100, which contains the LDL receptor-binding domain, plays a crucial role in the reuptake of
the lipoproteins from the blood circulation, and defective apoB sequences are the cause of inherited
hypercholesterolemia. (39,48)
A high plasmatic level of LDL is considered a risk factor for the development of atherosclerosis and
cardiovascular diseases. In view of this, several methods have been developed to separate
lipoproteins and estimate their precise amount in the plasma. Slab gel electrophoresis (1,2) was one
of the first techniques for the separation and quantification of lipoproteins. Ultracentrifugation (49)
and, although low in accuracy, the Friedewald method (50) have routinely been used to separate and
to determine the cholesterol content of lipoproteins, respectively. Nuclear magnetic resonance
(NMR) spectroscopy has been proposed for the characterization and precise quantification of plasma
lipoproteins. (51) However, the drawbacks of relatively high cost, lengthy procedures and the large
amount of samples required, have pushed the quest for reasonably priced miniaturized techniques.
Flow field-flow fractionation (flow FFF) has been helpful in the separation and size determination of
lipoproteins in human plasma. (52) Moreover, important studies have been carried out by anion-
exchange HPLC, where lipoproteins are separated and the amounts of cholesterol determined by
enzymatic essay. (53) The advent of CE has opened doors for the development of miniaturized
techniques. Capillary gel electrophoresis (CGE) was used as long ago as 1986 for the separation of
serum lipoproteins, (54), and since then CE has been successfully coupled with mass spectrometry
for quantification of serum levels of apolipoproteins (3). In addition, capillary isotachophoresis
(CITP) has been beneficial for the identification of atherogenic LDL in the whole plasma. (55-60)
23
2.3 Extracellular matrix
The extracellular matrix (ECM) is a highly complex environment built up of several different
components, which, by forming a tight net, support the tissues and deliver nutrients to the cells. Of
the many ECM components, there are two main ones involved in the development of atherosclerosis:
PGs and collagen.
Proteoglycan monomer (PGm), consisting of a core protein with one or more glycosaminoglycan
(GAG) chains, comprises the basic unit of PGs. PGs can be distinguished into several families
according to the type of GAG that predominates in the monomer. (61,62) In our laboratory, we have
focused on decorin and chondroidin-6-sulphate (C6S) PGs, which, respectively, belong to the small
leucine-rich and chondroitin sulphate families.
Collagen is the most abundant protein in the human body. Although several types of collagen have
been classified, all of them share the common repetitive sequence Gly-X-Y, where X is usually
proline and Y hydroxyproline, and the triple helix structure where three polypeptide α-chains are
twisted around each other. (63-65) Collagen I and III are the most abundant types in the arteries, and
they are usually present in association with arterial PGs, in particular with decorin. (66,67) This
small leucine-rich PG seems to be involved in collagen fibril formation and organization, and its
absence appears to result in the formation of loose fibrils. (68-70)
2.4 Interactions of LDL particles with extracellular matrix components, their retention and
modifications
In the pathological condition of hypercholesterolemia, LDL particles diffuse through the endothelial
cell layer, interact with components of the ECM and become entrapped in the intima. A specific site
on apoB-100 (residues 3359-3377), particularly rich in lysine and arginine, probably mediates the
binding by interacting with the sulphate groups of PGs (71,72) and the negative charged residues of
collagen. Furthermore, it has been shown that decorin enhances the binding of LDLs to collagen, and
promotes their retention in the ECM. (73,25) The entrapped LDL particles may then be modified by
oxidizing agents, such as Cu2+ and Fe2+, or hydrolytic enzymes located in the intima. (74,75) The
major enzymes involved in LDL degradation are α-chymotrypsin, phospholipase A2 (PLA2) and
sphingomyelinase (SMase) (30,76,77). α-Chymotrypsin is a proteolytic enzyme that hydrolyses
apoB-100. (78) Since apoB-100 is important in maintaining LDL integrity, even partial loss of the
24
apolipoprotein can provoke significant rearrangements in the phospholipid monolayer and in the
lipid core, with possible aggregation and fusion of the particles. PLA2 and SMase are lipolytic
enzymes, catalysing the hydrolysis of phosphatidylcholine and SM, respectively. The degradation of
phosphatidylcholine yields lysophosphatidylcholine and fatty acids, which, in the presence of bovine
serum albumin (BSA), are removed from lipoprotein surfaces. The hydrolysis of SM produces
ceramide and phosphocholine, the latter polar enough to easily leave the LDL surface. SMase
provokes aggregation and then fusion of the LDL particles, PLA2 only aggregation. (30,79,80)
Oxidizing agents, such as Cu2+, are able to react with both the lipid and protein parts of LDL,
provoking aggregation and fusion. (30)
Modified LDL particles have increased affinity for arterial PG. The stronger LDL–PG interactions
appear to be related to the rearrangement of apoB-100 that occurs during modification, exposing
new binding sites with active lysine residues. (81,82)
2.5 Modification of extracellular matrix components in diabetes
Diabetes is a complex multifunctional disease, characterized by a high level of glucose in the blood
circulation. Diabetes has severe consequences: not least, diabetes increases the risk of atherosclerosis
and cardiovascular diseases. (83) The complications of diabetes are mostly associated with the
reaction of glucose with the long-lived proteins of the human body and the modification and loss of
functionality of these proteins. Like other structural proteins, those forming the ECM may be
modified. Glycation of collagen I has attracted special attention (84). The glycation reaction involves
an aldehydic group of the sugar and an amino group, usually of a lysine residue, of the protein. The
so-formed Schiff base may successively rearrange into an Amadori product, which further attacks
other amino groups and finally yields advanced glycation end-products (AGEs). AGEs, as reactive
molecules, can react further with proteins and have been imputed as the main cause of diabetes
complications. (85,86) AGEs can react with collagen I, with such severe consequences as decrease
in solubility, resistance to collagenase, and cross-link formation. (87,88) These structural changes
cause severe alterations of collagen functionality, which may affect the retention of LDLs in the
ECM. (89,90)
25
3 Techniques used in the studiesAlthough CEC was selected as the method of choice in this study, other techniques were employed
as well, to provide supporting or complementary information. A description of the techniques that
were used is given in the following sections.
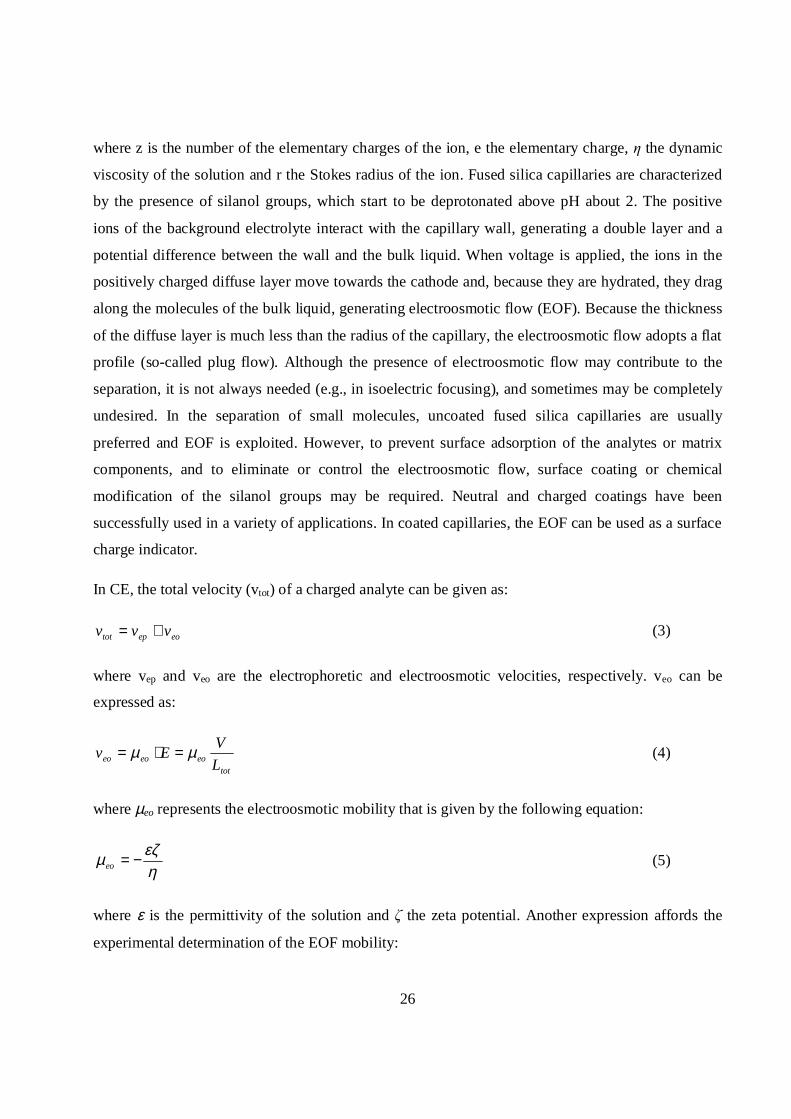
3.1 Capillary electromigration techniques
Separations in capillary electromigration techniques are achieved in narrow capillaries under high
electric field strength. Capillary electromigration techniques can be divided into two groups:
capillary electrophoretic techniques and electrically driven capillary chromatographic techniques.
The division is base on different separation principles, in some cases overlapping. A schematic
representation of capillary electromigration techniques is shown in the scheme below:
In electrophoresis, analytes migrate under the influence of an electric field and separation is based on
their different charges, sizes and molecular shape. The electrophoretic velocity of the analyte can be
expressed as:
totepepep L
VEv µµ =⋅= (1)
where E is the electric field strength, V the applied voltage, Ltot the total length of the capillary and
µep the electrophoretic mobility of the analyte, which is given by the following equation:
rze
ep πηµ
6= (2)
26
where z is the number of the elementary charges of the ion, e the elementary charge, the dynamic
viscosity of the solution and r the Stokes radius of the ion. Fused silica capillaries are characterized
by the presence of silanol groups, which start to be deprotonated above pH about 2. The positive
ions of the background electrolyte interact with the capillary wall, generating a double layer and a
potential difference between the wall and the bulk liquid. When voltage is applied, the ions in the
positively charged diffuse layer move towards the cathode and, because they are hydrated, they drag
along the molecules of the bulk liquid, generating electroosmotic flow (EOF). Because the thickness
of the diffuse layer is much less than the radius of the capillary, the electroosmotic flow adopts a flat
profile (so-called plug flow). Although the presence of electroosmotic flow may contribute to the
separation, it is not always needed (e.g., in isoelectric focusing), and sometimes may be completely
undesired. In the separation of small molecules, uncoated fused silica capillaries are usually
preferred and EOF is exploited. However, to prevent surface adsorption of the analytes or matrix
components, and to eliminate or control the electroosmotic flow, surface coating or chemical
modification of the silanol groups may be required. Neutral and charged coatings have been
successfully used in a variety of applications. In coated capillaries, the EOF can be used as a surface
charge indicator.
In CE, the total velocity (vtot) of a charged analyte can be given as:
eoeptot vvv += (3)
where vep and veo are the electrophoretic and electroosmotic velocities, respectively. veo can be
expressed as:
toteoeoeo L
VEv µµ =⋅= (4)
where µeo represents the electroosmotic mobility that is given by the following equation:
ηεζ
µ −=eo (5)
where ε is the permittivity of the solution and the zeta potential. Another expression affords the
experimental determination of the EOF mobility:
27
eo
toteo Vt
LL det=µ (6)
where teo is the migration time for the EOF marker, and Ltot and Ldet are the total and detection
lengths of the capillary, respectively. (91) In the case of an uncharged compound, the term µep is
equal to zero, and the uncharged analyte migrates together with the EOF. As evident from equation
(3) uncharged compounds cannot be separated by CE. Fortunately, electrically driven techniques,
such as micellar electrokinetic chromatography, microemulsion electrokinetic chromatography and
capillary electrochromatograpy, can then be employed.
Principle of capillary electrochromatographyIn capillary electrochromatography (CEC), the technique of interest in this work, the capillary is
either filled or coated with a stationary phase, and the retention time of the analytes depends on both
electrophoretic migration and chromatographic retention. The retention factor (k) of an uncharged
analyte can be evaluated with the same formula as used in LC:
eo
eom
tttk −
= (7)
where tm and teo are the migration times of the analyte and EOF marker, respectively. (92) When the
amount of immobilized stationary phase is known, the distribution coefficient (KD) can be calculated
according to the following equation:
βkVmVm
VmVm
CC
KSM
MS
MM
SS
M
SD =
⋅⋅
===//
(8)
where CM, mM and VM are the concentration, mass and volume of the mobile phase, while CS, mS
and VS are the concentration, mass and volume of the stationary phase. The phase ratio β can be
expressed as
f
c
dr
2=β (9)
where rc is the column radius and df the thickness of the stationary phase.
28
Because equation (7) is not valid in the case of charged analytes running in a coated capillary, the
following equation (93,94) must be applied:
eoep
ep
eoep
epCECOT vv
vk
vvv
k+
−
+−=− 1 (10)
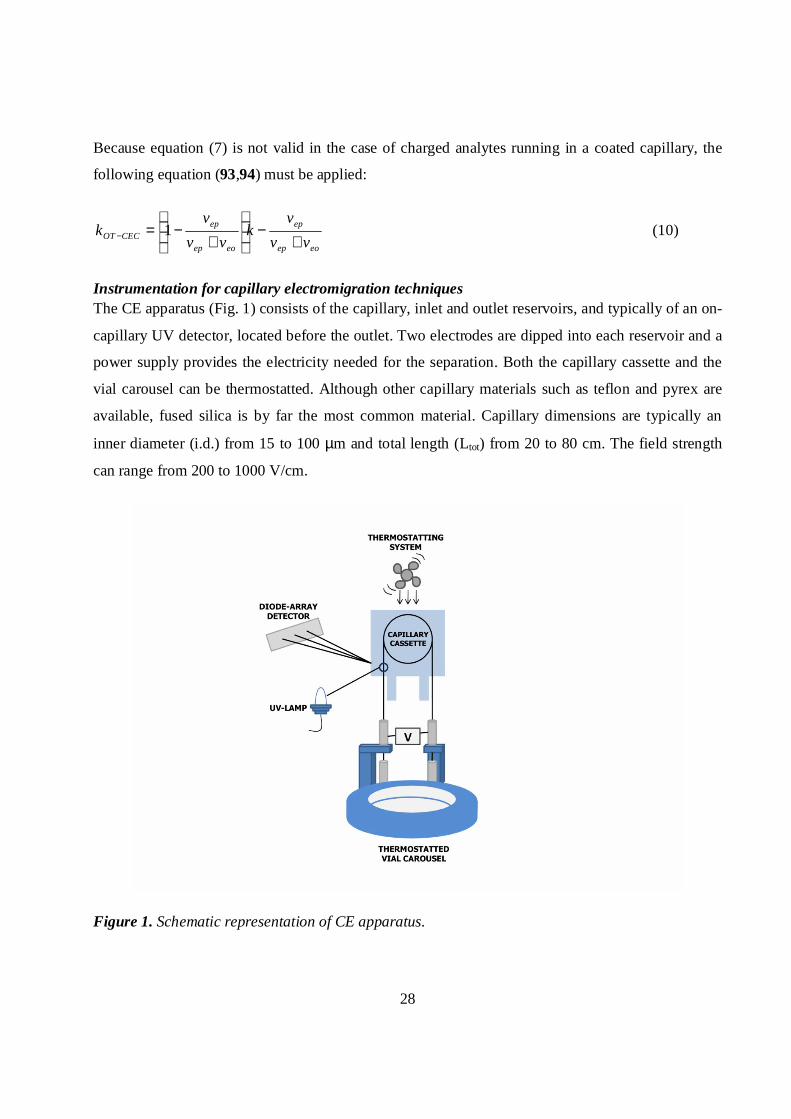
Instrumentation for capillary electromigration techniquesThe CE apparatus (Fig. 1) consists of the capillary, inlet and outlet reservoirs, and typically of an on-
capillary UV detector, located before the outlet. Two electrodes are dipped into each reservoir and a
power supply provides the electricity needed for the separation. Both the capillary cassette and the
vial carousel can be thermostatted. Although other capillary materials such as teflon and pyrex are
available, fused silica is by far the most common material. Capillary dimensions are typically an
inner diameter (i.d.) from 15 to 100 µm and total length (Ltot) from 20 to 80 cm. The field strength
can range from 200 to 1000 V/cm.
Figure 1. Schematic representation of CE apparatus.
29
Capillary electromigration instruments are versatile and can be coupled with any of several
detectors: UV/VIS, diode array, MS, laser induced fluorescence (LIF), NMR, dynamic light
scattering (DLS) and conductivity detector, to mention the most common ones. Several studies have
shown the applicability of capillary electromigration techniques to the analysis of biological
samples. Analyses of cell coatings, blood and urine are just a few examples of tasks that can be
performed with capillary electromigration techniques. (95-98)
3.2 Scanning electron microscopy
Scanning electron microscopy (SEM) can be employed to examine the external structure of almost
anything that can be viewed in a dissecting light microscope. Scanning electron microscopy
examines structures by bombarding the specimen with a scanning beam of electrons. The slow-
moving secondary electrons that the specimen generates are successively collected, amplified, and
displayed on a cathode ray tube. The electron beam and the cathode ray tube scan synchronously to
produce an image of the surface of the specimen. (99) Before the measurement, the sample must be
dried and made conductive to electricity, if it is not already.
3.3 Atomic force microscopy
Atomic force microscopy (AFM) measures forces between a probe and the surface of interest
through changes in the deflection of a flexible cantilever attached to the probe. Changes in sample
topography affect the probe–sample interaction profile and thereby the response of the cantilever.
(100-104)
The contact and tapping modes are the most widely applied of the several modes of operation. In the
contact mode the probe tip is in continuous contact with the surface, while in the tapping mode it
oscillates up and down as it scans over the surface. (104) The tapping mode is gentler than the
contact mode and is more suitable for the investigation of soft matter, such as polymers and
biological material. AFM offers the possibility to visualize the surface in 2D or 3D, and it can give
both qualitative and quantitative information on many physical properties including size,
morphology, surface texture and roughness. Information on size, surface area and volume
distributions can be obtained as well. A wide range of particle sizes can be characterized in the same
scan, from about 1 nanometer (nm) to about 8 micrometers (µm). AFM can also be employed under
different conditions (air, liquid, pH).
30
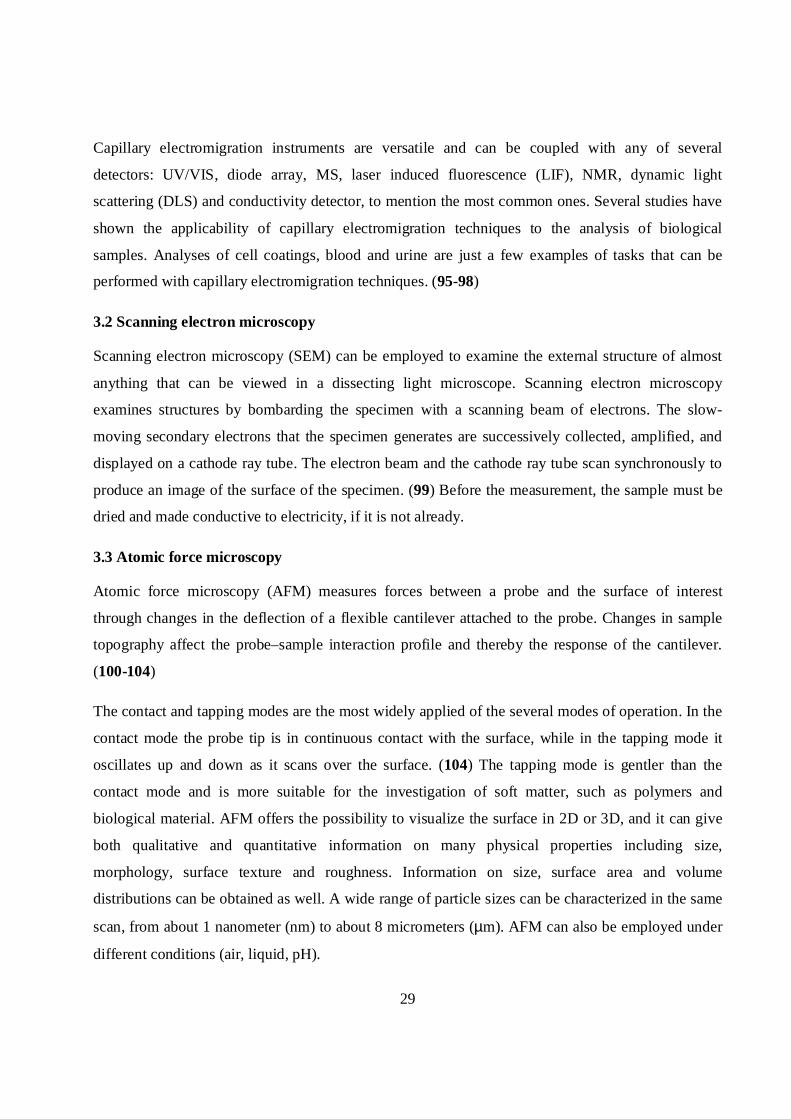
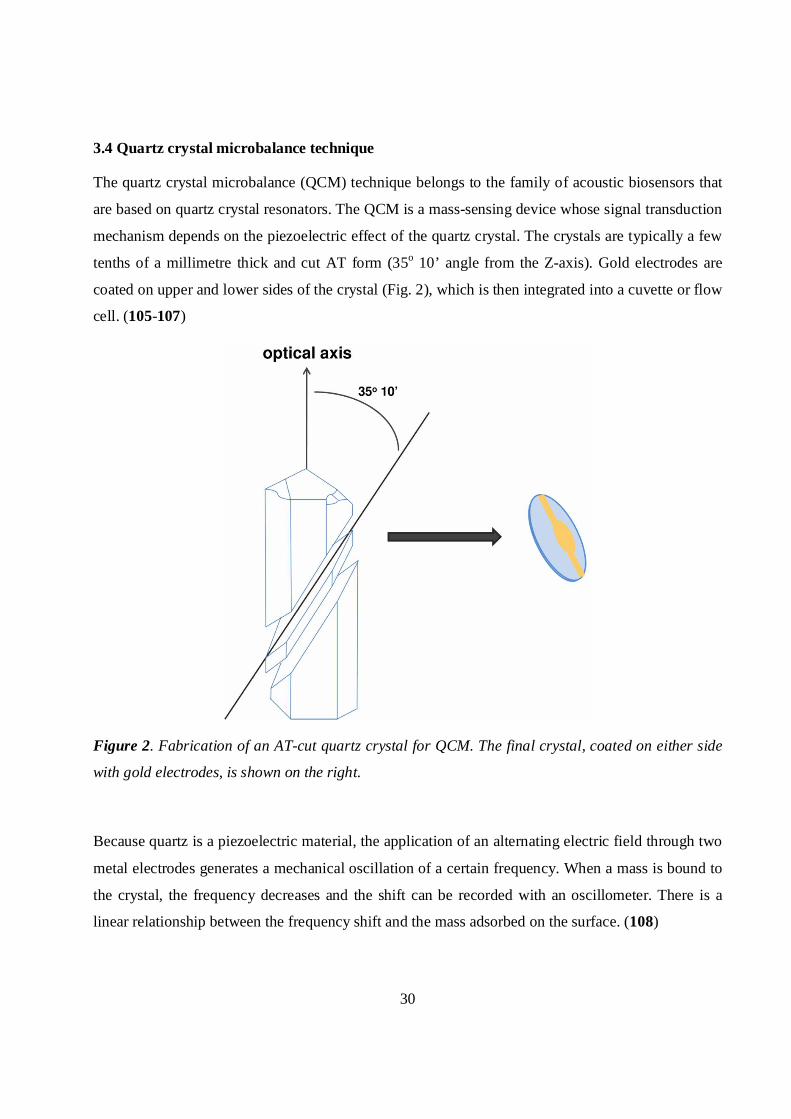
3.4 Quartz crystal microbalance technique
The quartz crystal microbalance (QCM) technique belongs to the family of acoustic biosensors that
are based on quartz crystal resonators. The QCM is a mass-sensing device whose signal transduction
mechanism depends on the piezoelectric effect of the quartz crystal. The crystals are typically a few
tenths of a millimetre thick and cut AT form (35o 10’ angle from the Z-axis). Gold electrodes are
coated on upper and lower sides of the crystal (Fig. 2), which is then integrated into a cuvette or flow
cell. (105-107)
Figure 2. Fabrication of an AT-cut quartz crystal for QCM. The final crystal, coated on either side
with gold electrodes, is shown on the right.
Because quartz is a piezoelectric material, the application of an alternating electric field through two
metal electrodes generates a mechanical oscillation of a certain frequency. When a mass is bound to
the crystal, the frequency decreases and the shift can be recorded with an oscillometer. There is a
linear relationship between the frequency shift and the mass adsorbed on the surface. (108)
31
The QCM has been widely applied to the study of biochemical processes and the development of
biomimetic systems and biosensors. (109-111) Molecules of interest (ligands) are directly
immobilized on the gold surface for study of the interactions with specific analytes. The gold surface
can also be modified with polystyrene, biotin, silicon dioxide or carboxyl group to promote the
immobilization of specific molecules.
Relative to optical biosensors, such as surface plasma resonance (SPR) sensors, QCM provides some
clear advantages. Since the acoustic sensor response is sensitive to the charge of receptor–ligand
complexes and the changes in visco-elastic properties, more detailed information is obtained about
interactions. (112,113) The QCM technique allows the direct injection of crude samples, which
usually provoke significant non-specific binding response in SPR devices. QCM also has higher
mass sensitivity (on the order of fg/mm2) than SPR (pg/mm2).
3.5 Field-flow fractionation
Field-flow fractionation (FFF) is a major analytical technique for the separation and characterization
of macromolecules and particles. Giddings (114) introduced field-flow fractionation (FFF) for the
separation of macromolecules and colloids. DNA, viruses and other macromolecules and complexes,
including lipoproteins, ribosomes and liposomes, have all been separated by FFF (5, 115).
In contrast to flow FFF (FlFFF), where two walls are permeable to the flow, in asymmetrical flow
FFF (AsFlFFF) only one wall is permeable. AsFlFFF has recently also been realized in miniaturized
scale. (5) Whereas in FlFFF the main and the cross flow enter the channel from two separate inlets,
in AsFlFFF the incoming flow from a single channel inlet is split into an axial component (the main
flow) and a perpendicular component (cross flow). Normal, steric and hyperlayer modes can be
applied in AsFlFFF.
In AsFlFFF, particles or macromolecules are separated on the basis of differences in diffusion
coefficients. The movement of the cross flow across the separation channel propels larger particles
with lower diffusion coefficients closer to the channel wall. In normal mode, the larger molecules
will therefore be eluted more slowly than the smaller ones.
32
4 ExperimentalThe chemicals, equipment and methods employed are briefly described in this chapter. The details
can be found in papers I-VI.
4.1 Chemicals
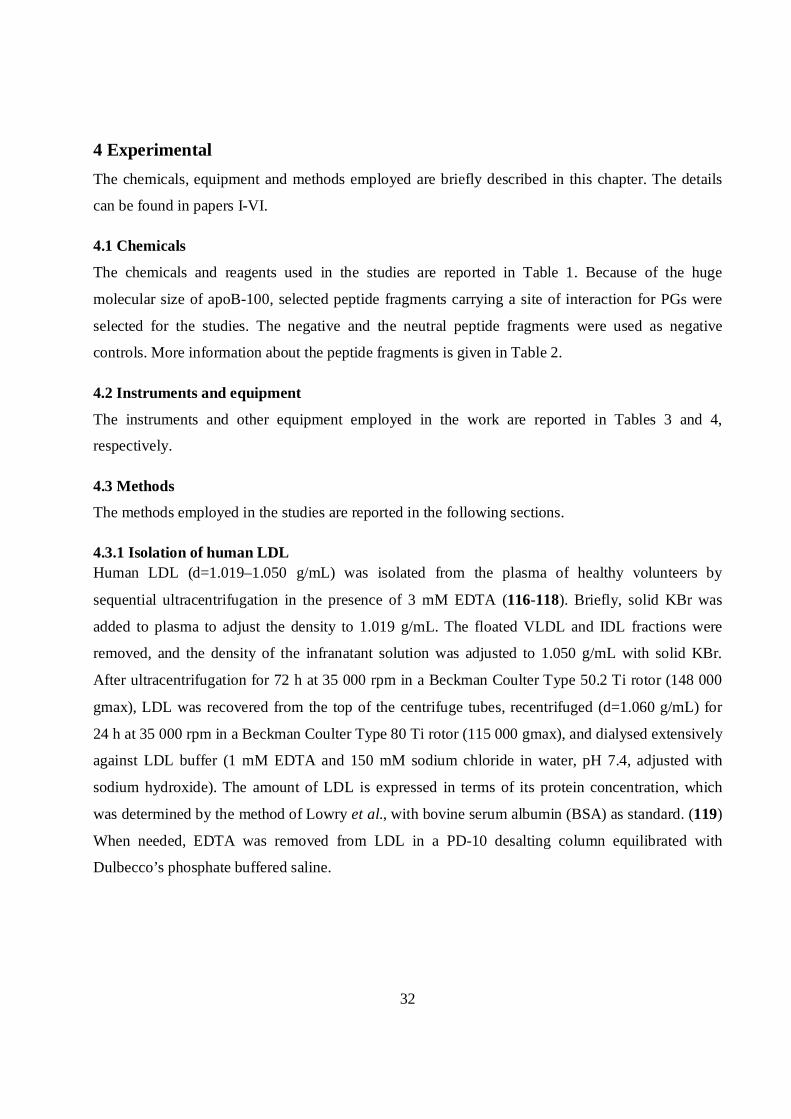
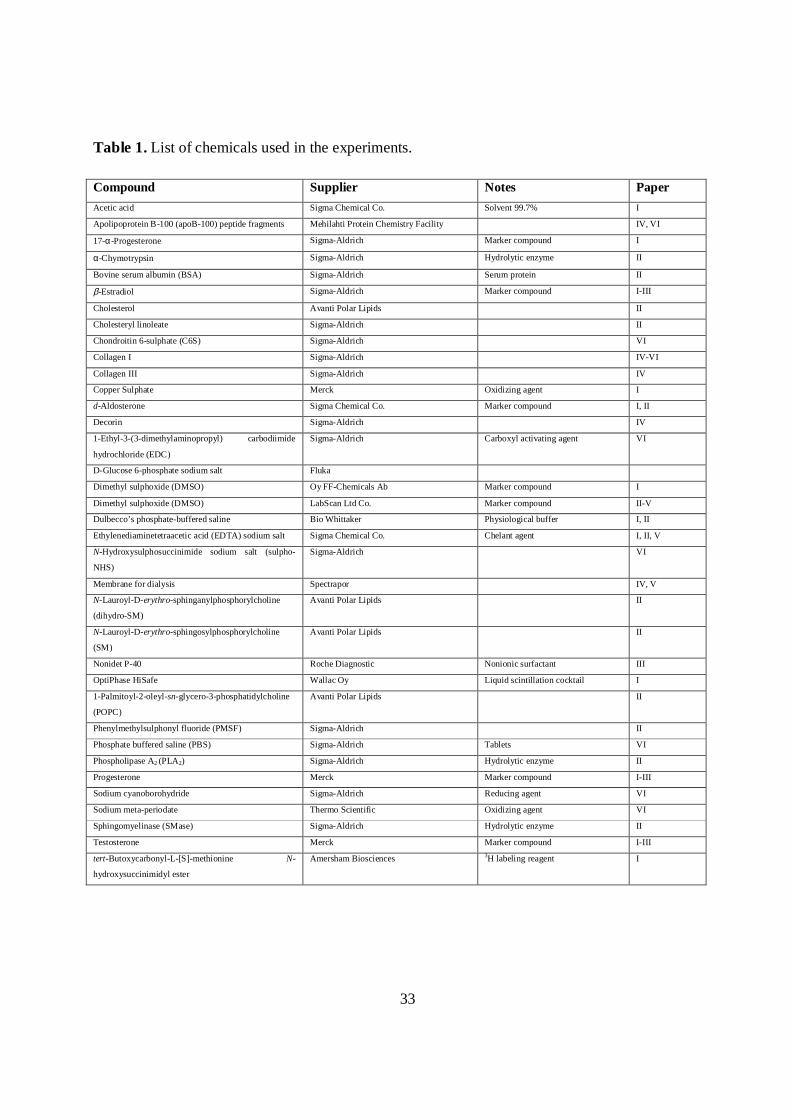
The chemicals and reagents used in the studies are reported in Table 1. Because of the huge
molecular size of apoB-100, selected peptide fragments carrying a site of interaction for PGs were
selected for the studies. The negative and the neutral peptide fragments were used as negative
controls. More information about the peptide fragments is given in Table 2.
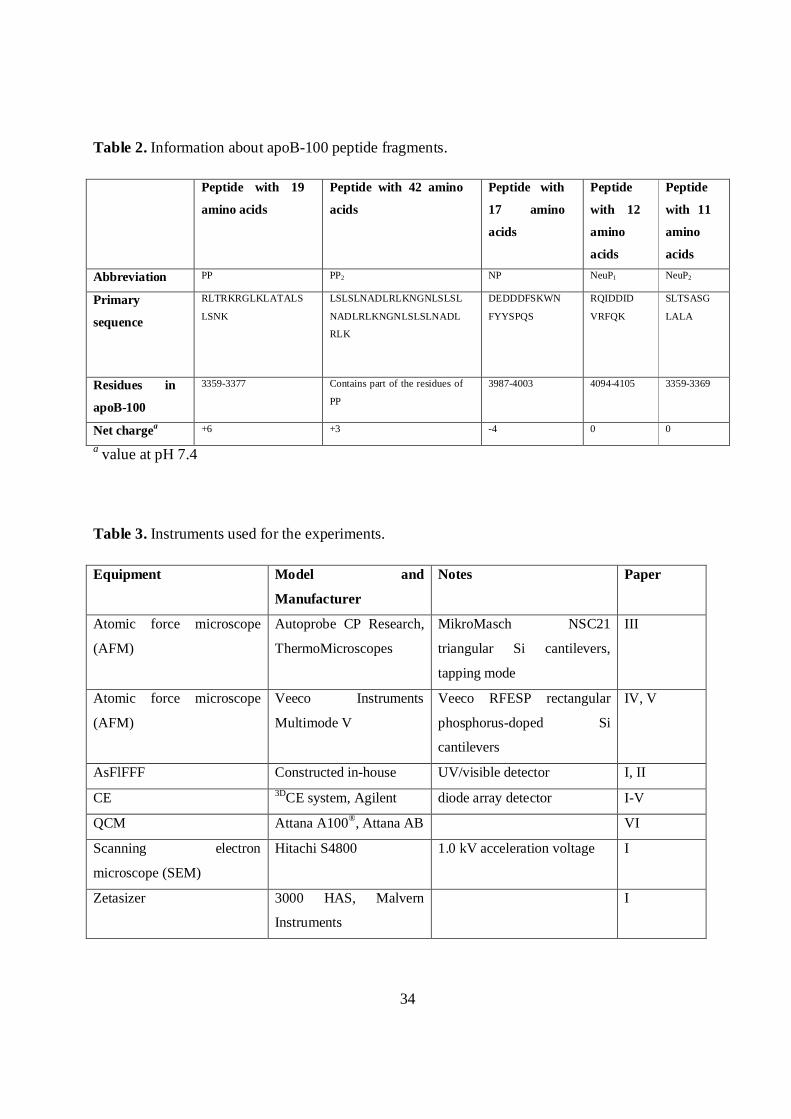
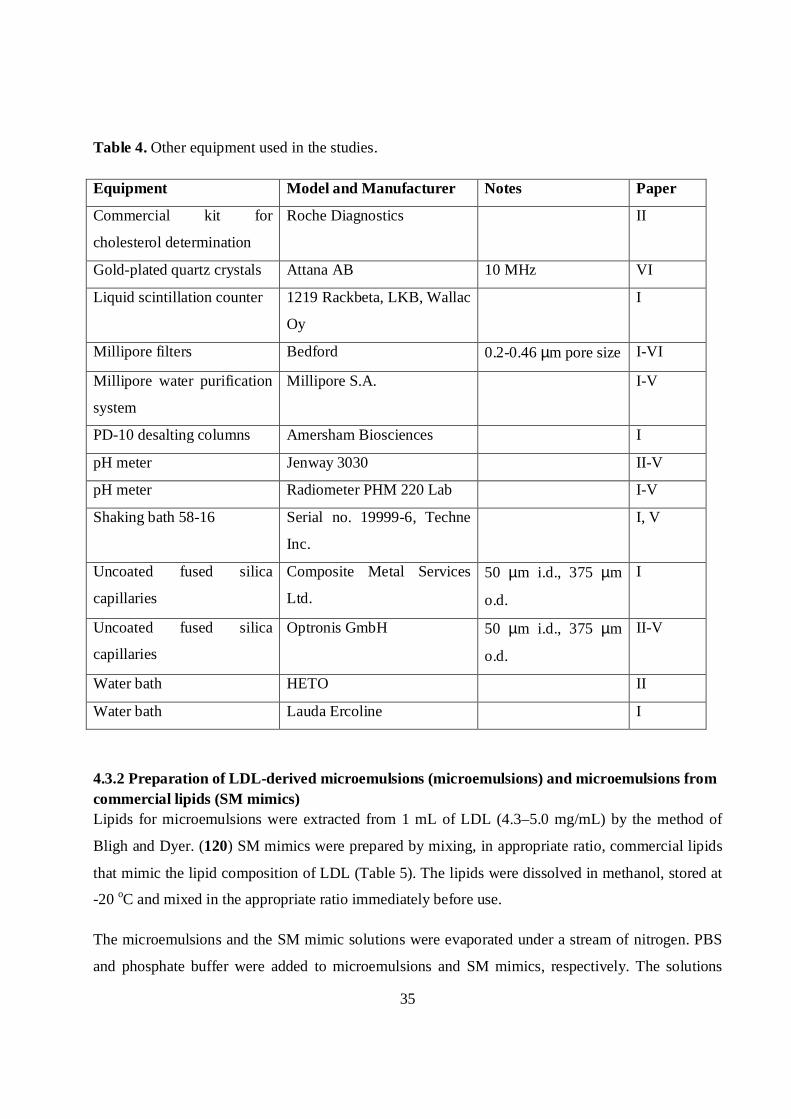
4.2 Instruments and equipment
The instruments and other equipment employed in the work are reported in Tables 3 and 4,
respectively.
4.3 Methods
The methods employed in the studies are reported in the following sections.
4.3.1 Isolation of human LDLHuman LDL (d=1.019–1.050 g/mL) was isolated from the plasma of healthy volunteers by
sequential ultracentrifugation in the presence of 3 mM EDTA (116-118). Briefly, solid KBr was
added to plasma to adjust the density to 1.019 g/mL. The floated VLDL and IDL fractions were
removed, and the density of the infranatant solution was adjusted to 1.050 g/mL with solid KBr.
After ultracentrifugation for 72 h at 35 000 rpm in a Beckman Coulter Type 50.2 Ti rotor (148 000
gmax), LDL was recovered from the top of the centrifuge tubes, recentrifuged (d=1.060 g/mL) for
24 h at 35 000 rpm in a Beckman Coulter Type 80 Ti rotor (115 000 gmax), and dialysed extensively
against LDL buffer (1 mM EDTA and 150 mM sodium chloride in water, pH 7.4, adjusted with
sodium hydroxide). The amount of LDL is expressed in terms of its protein concentration, which
was determined by the method of Lowry et al., with bovine serum albumin (BSA) as standard. (119)
When needed, EDTA was removed from LDL in a PD-10 desalting column equilibrated with
Dulbecco’s phosphate buffered saline.
33
Table 1. List of chemicals used in the experiments.
Compound Supplier Notes PaperAcetic acid Sigma Chemical Co. Solvent 99.7% I
Apolipoprotein B-100 (apoB-100) peptide fragments Mehilahti Protein Chemistry Facility IV, VI
17-α-Progesterone Sigma-Aldrich Marker compound I
α-Chymotrypsin Sigma-Aldrich Hydrolytic enzyme II
Bovine serum albumin (BSA) Sigma-Aldrich Serum protein II
β-Estradiol Sigma-Aldrich Marker compound I-III
Cholesterol Avanti Polar Lipids II
Cholesteryl linoleate Sigma-Aldrich II
Chondroitin 6-sulphate (C6S) Sigma-Aldrich VI
Collagen I Sigma-Aldrich IV-VI
Collagen III Sigma-Aldrich IV
Copper Sulphate Merck Oxidizing agent I
d-Aldosterone Sigma Chemical Co. Marker compound I, II
Decorin Sigma-Aldrich IV
1-Ethyl-3-(3-dimethylaminopropyl) carbodiimide
hydrochloride (EDC)
Sigma-Aldrich Carboxyl activating agent VI
D-Glucose 6-phosphate sodium salt Fluka
Dimethyl sulphoxide (DMSO) Oy FF-Chemicals Ab Marker compound I
Dimethyl sulphoxide (DMSO) LabScan Ltd Co. Marker compound II-V
Dulbecco’s phosphate-buffered saline Bio Whittaker Physiological buffer I, II
Ethylenediaminetetraacetic acid (EDTA) sodium salt Sigma Chemical Co. Chelant agent I, II, V
N-Hydroxysulphosuccinimide sodium salt (sulpho-
NHS)
Sigma-Aldrich VI
Membrane for dialysis Spectrapor IV, V
N-Lauroyl-D-erythro-sphinganylphosphorylcholine
(dihydro-SM)
Avanti Polar Lipids II
N-Lauroyl-D-erythro-sphingosylphosphorylcholine
(SM)
Avanti Polar Lipids II
Nonidet P-40 Roche Diagnostic Nonionic surfactant III
OptiPhase HiSafe Wallac Oy Liquid scintillation cocktail I
1-Palmitoyl-2-oleyl-sn-glycero-3-phosphatidylcholine
(POPC)
Avanti Polar Lipids II
Phenylmethylsulphonyl fluoride (PMSF) Sigma-Aldrich II
Phosphate buffered saline (PBS) Sigma-Aldrich Tablets VI
Phospholipase A2 (PLA2) Sigma-Aldrich Hydrolytic enzyme II
Progesterone Merck Marker compound I-III
Sodium cyanoborohydride Sigma-Aldrich Reducing agent VI
Sodium meta-periodate Thermo Scientific Oxidizing agent VI
Sphingomyelinase (SMase) Sigma-Aldrich Hydrolytic enzyme II
Testosterone Merck Marker compound I-III
tert-Butoxycarbonyl-L-[S]-methionine N-
hydroxysuccinimidyl ester
Amersham Biosciences 3H labeling reagent I
34
Table 2. Information about apoB-100 peptide fragments.
Peptide with 19
amino acids
Peptide with 42 amino
acids
Peptide with
17 amino
acids
Peptide
with 12
amino
acids
Peptide
with 11
amino
acids
Abbreviation PP PP2 NP NeuP1 NeuP2
Primary
sequence
RLTRKRGLKLATALS
LSNK
LSLSLNADLRLKNGNLSLSL
NADLRLKNGNLSLSLNADL
RLK
DEDDDFSKWN
FYYSPQS
RQIDDID
VRFQK
SLTSASG
LALA
Residues in
apoB-100
3359-3377 Contains part of the residues of
PP
3987-4003 4094-4105 3359-3369
Net chargea +6 +3 -4 0 0
a value at pH 7.4
Table 3. Instruments used for the experiments.
Equipment Model and
Manufacturer
Notes Paper
Atomic force microscope
(AFM)
Autoprobe CP Research,
ThermoMicroscopes
MikroMasch NSC21
triangular Si cantilevers,
tapping mode
III
Atomic force microscope
(AFM)
Veeco Instruments
Multimode V
Veeco RFESP rectangular
phosphorus-doped Si
cantilevers
IV, V
AsFlFFF Constructed in-house UV/visible detector I, II
CE 3DCE system, Agilent diode array detector I-V
QCM Attana A100®, Attana AB VI
Scanning electron
microscope (SEM)
Hitachi S4800 1.0 kV acceleration voltage I
Zetasizer 3000 HAS, Malvern
Instruments
I
35
Table 4. Other equipment used in the studies.
Equipment Model and Manufacturer Notes Paper
Commercial kit for
cholesterol determination
Roche Diagnostics II
Gold-plated quartz crystals Attana AB 10 MHz VI
Liquid scintillation counter 1219 Rackbeta, LKB, Wallac
Oy
I
Millipore filters Bedford 0.2-0.46 µm pore size I-VI
Millipore water purification
system
Millipore S.A. I-V
PD-10 desalting columns Amersham Biosciences I
pH meter Jenway 3030 II-V
pH meter Radiometer PHM 220 Lab I-V
Shaking bath 58-16 Serial no. 19999-6, Techne
Inc.
I, V
Uncoated fused silica
capillaries
Composite Metal Services
Ltd.
50 µm i.d., 375 µm
o.d.
I
Uncoated fused silica
capillaries
Optronis GmbH 50 µm i.d., 375 µm
o.d.
II-V
Water bath HETO II
Water bath Lauda Ercoline I
4.3.2 Preparation of LDL-derived microemulsions (microemulsions) and microemulsions fromcommercial lipids (SM mimics)Lipids for microemulsions were extracted from 1 mL of LDL (4.3–5.0 mg/mL) by the method of
Bligh and Dyer. (120) SM mimics were prepared by mixing, in appropriate ratio, commercial lipids
that mimic the lipid composition of LDL (Table 5). The lipids were dissolved in methanol, stored at
-20 oC and mixed in the appropriate ratio immediately before use.
The microemulsions and the SM mimic solutions were evaporated under a stream of nitrogen. PBS
and phosphate buffer were added to microemulsions and SM mimics, respectively. The solutions
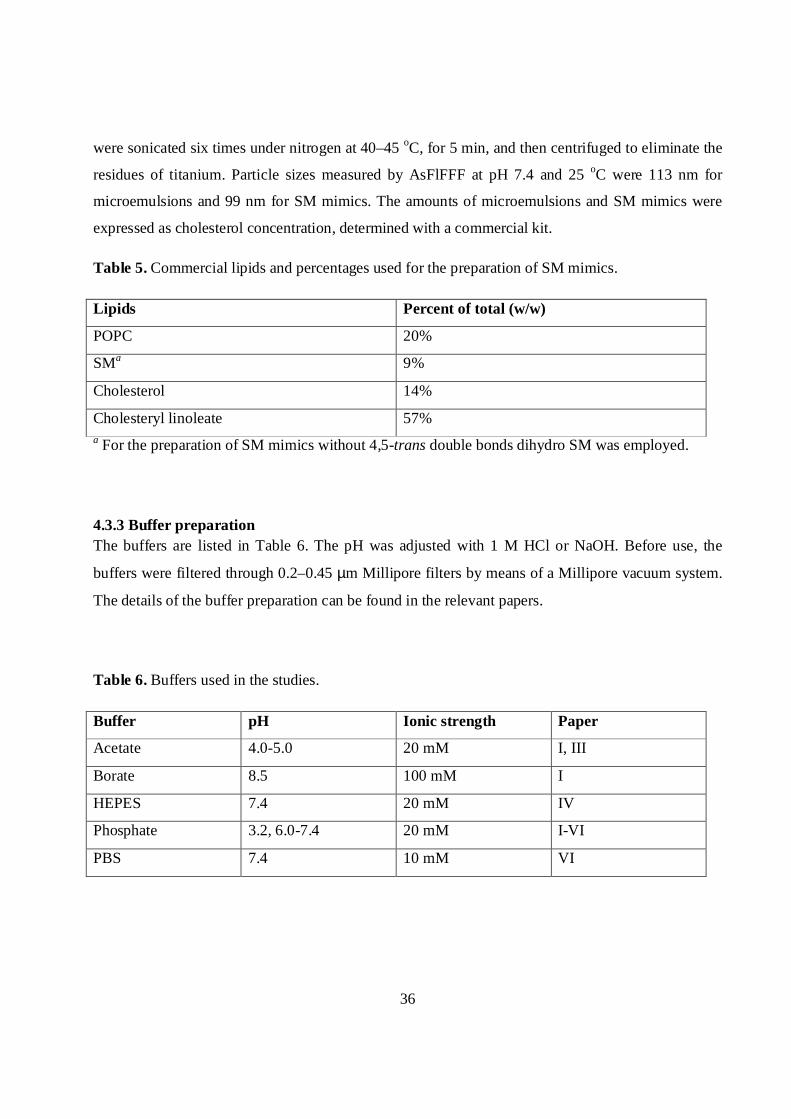
36
were sonicated six times under nitrogen at 40–45 oC, for 5 min, and then centrifuged to eliminate the
residues of titanium. Particle sizes measured by AsFlFFF at pH 7.4 and 25 oC were 113 nm for
microemulsions and 99 nm for SM mimics. The amounts of microemulsions and SM mimics were
expressed as cholesterol concentration, determined with a commercial kit.
Table 5. Commercial lipids and percentages used for the preparation of SM mimics.
Lipids Percent of total (w/w)
POPC 20%
SMa 9%
Cholesterol 14%
Cholesteryl linoleate 57%a For the preparation of SM mimics without 4,5-trans double bonds dihydro SM was employed.
4.3.3 Buffer preparationThe buffers are listed in Table 6. The pH was adjusted with 1 M HCl or NaOH. Before use, the
buffers were filtered through 0.2–0.45 µm Millipore filters by means of a Millipore vacuum system.
The details of the buffer preparation can be found in the relevant papers.
Table 6. Buffers used in the studies.
Buffer pH Ionic strength Paper
Acetate 4.0-5.0 20 mM I, III
Borate 8.5 100 mM I
HEPES 7.4 20 mM IV
Phosphate 3.2, 6.0-7.4 20 mM I-VI
PBS 7.4 10 mM VI
37
4.3.4 Synthesis of apoB-100 peptide fragmentsPP (RLTRKRGLKLATALSLSNK), PP2
(LSLSLNADLRLKNGNLSLSLNADLRLKNGNLSLSLNADLRLK), NP
(DEDDDFSKWNFYYSPQS), NeuP1 (RQIDDIDVRFQK) and NeuP2 (SLTSASGLALA) were
synthesised by standard solid-phase synthesis via Fmoc (9-fluorenylmethoxycarbonyl) chemistry on
Wang resin preloaded with C-terminal amino acid (Applied Biosystems). Synthesis was done in 25
mmol scale on a MultiPep synthesiser (Intavis Ag) using double coupling and activation with 1:1:2
amino acid / O-(6-chlorobenzotriazol-1-yl)-N,N,N´,N´-tetramethyluronium hexafluorophosphate
(HCTU) / 4-methylmorpholine (NMM). Amino acids with standard side chain protecting groups
(Novabiochem) were used in 4-fold excess to resin to ensure maximal coupling under the pre-
activation with 0.5 M HCTU / 4 M NMM (Fluka) in N,N-dimethylformamide (DMF, Rathburn
Chemicals). Peptide chains that were unreacted after the coupling and subsequent DMF wash cycles
were capped by acetylation in 50 mM acetic anhydride / 130 mM N,N-diisopropylethylamine
(DIEA) in DMF. Fmoc deprotection after each amino acid cycle was done twice with 25%
piperidine in DMF. The synthesis product was dried on resin and cleaved in 5 ml of cleavage mix:
95% trifluoroacetic acid (TFA) / 2.5% triisoprolylsilane (TIS) / 2.5% H2O to remove the side-chain
protecting groups and detach the peptide. After 2 h incubation at room temperature, the resin eluate
was filtered, and the solution containing the newly synthesised peptide was evaporated under
nitrogen flow (99.99%) to approximately 20% of the volume. Peptide was precipitated with 10-fold
volume of tert-butyl methyl ether, centrifuged in an explosion-proof centrifuge, washed once with
ether, solubilized in water, and lyophilized. Peptide powder was resolubilized in dimethylsulphoxide
(DMSO, Riedel-de Haën) and purified in a C18 reversed-phase column (Supelco Discovery wide-
pore) with 10 column volumes of 0–70% acetonitrile / H2O gradient. The purified peptide of interest
was quality controlled by MALDI-TOF/TOF mass spectrometry (AutoFlex III, Bruker). About 5
pmol of the solubilized peptide was mixed with saturated α-cyano-4-hydroxycinnamic acid matrix
solution (1 part of 0.1% trifluoro acetic acid in water to 2 parts of MS grade acetonitrile). If
necessary, each peptide was further de-novo sequenced by TOF/TOF.
4.3.5 Preparation and modification of coatingsBefore each coating, the capillary was preconditioned by flushing 20 min with 1 M HCl, 10 min
with 0.1 M HCl, 25 min with MilliQ water and 5 min with background electrolyte (BGE). The
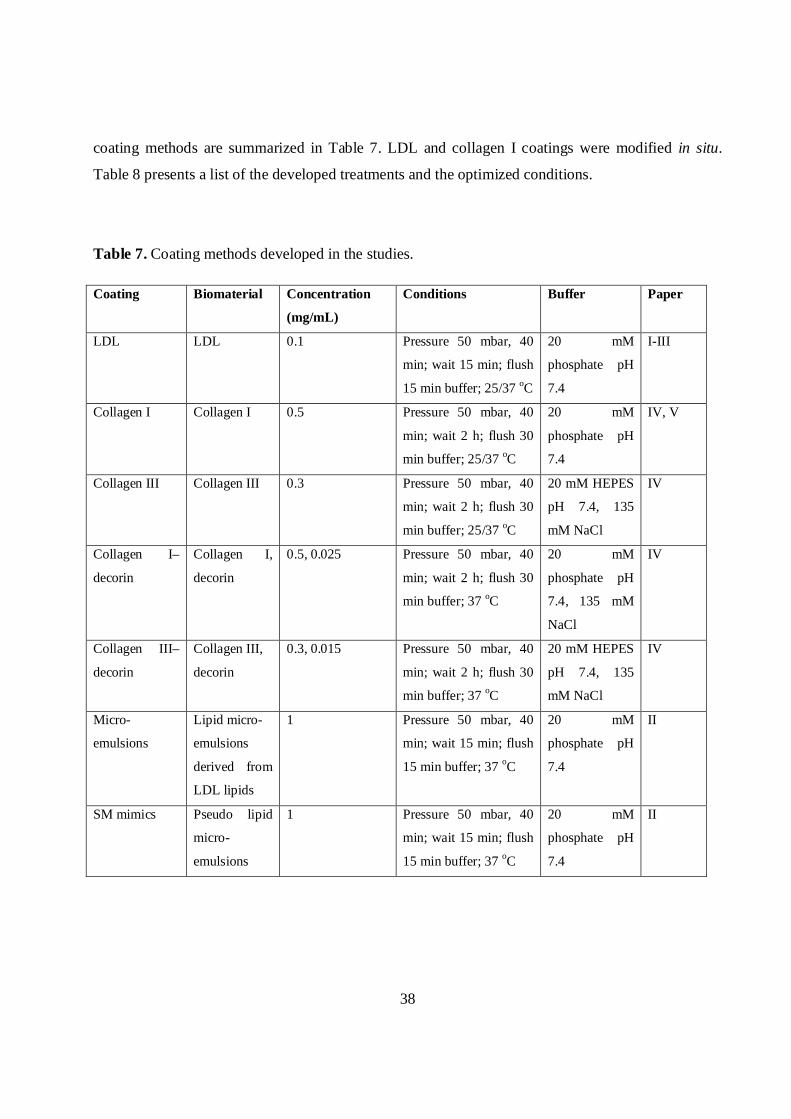
38
coating methods are summarized in Table 7. LDL and collagen I coatings were modified in situ.
Table 8 presents a list of the developed treatments and the optimized conditions.
Table 7. Coating methods developed in the studies.
Coating Biomaterial Concentration
(mg/mL)
Conditions Buffer Paper
LDL LDL 0.1 Pressure 50 mbar, 40
min; wait 15 min; flush
15 min buffer; 25/37 oC
20 mM
phosphate pH
7.4
I-III
Collagen I Collagen I 0.5 Pressure 50 mbar, 40
min; wait 2 h; flush 30
min buffer; 25/37 oC
20 mM
phosphate pH
7.4
IV, V
Collagen III Collagen III 0.3 Pressure 50 mbar, 40
min; wait 2 h; flush 30
min buffer; 25/37 oC
20 mM HEPES
pH 7.4, 135
mM NaCl
IV
Collagen I–
decorin
Collagen I,
decorin
0.5, 0.025 Pressure 50 mbar, 40
min; wait 2 h; flush 30
min buffer; 37 oC
20 mM
phosphate pH
7.4, 135 mM
NaCl
IV
Collagen III–
decorin
Collagen III,
decorin
0.3, 0.015 Pressure 50 mbar, 40
min; wait 2 h; flush 30
min buffer; 37 oC
20 mM HEPES
pH 7.4, 135
mM NaCl
IV
Micro-
emulsions
Lipid micro-
emulsions
derived from
LDL lipids
1 Pressure 50 mbar, 40
min; wait 15 min; flush
15 min buffer; 37 oC
20 mM
phosphate pH
7.4
II
SM mimics Pseudo lipid
micro-
emulsions
1 Pressure 50 mbar, 40
min; wait 15 min; flush
15 min buffer; 37 oC
20 mM
phosphate pH
7.4
II
39
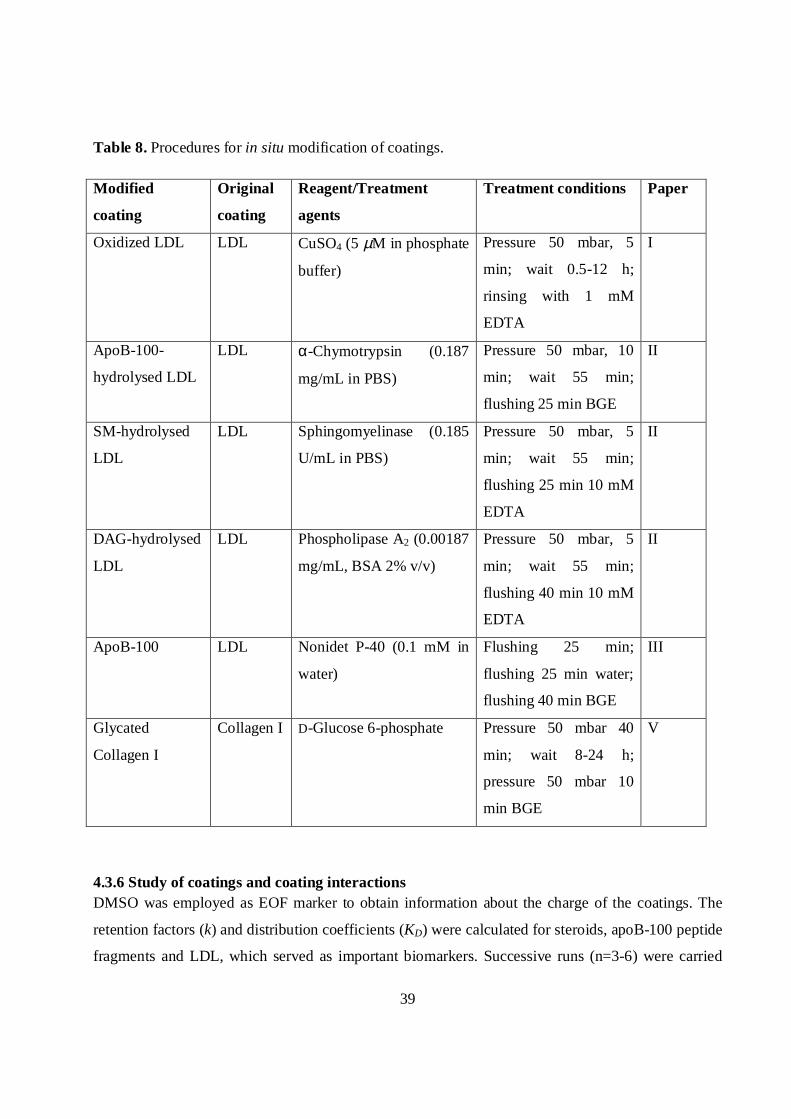
Table 8. Procedures for in situ modification of coatings.
Modified
coating
Original
coating
Reagent/Treatment
agents
Treatment conditions Paper
Oxidized LDL LDL CuSO4 (5 µM in phosphate
buffer)
Pressure 50 mbar, 5
min; wait 0.5-12 h;
rinsing with 1 mM
EDTA
I
ApoB-100-
hydrolysed LDL
LDL α-Chymotrypsin (0.187
mg/mL in PBS)
Pressure 50 mbar, 10
min; wait 55 min;
flushing 25 min BGE
II
SM-hydrolysed
LDL
LDL Sphingomyelinase (0.185
U/mL in PBS)
Pressure 50 mbar, 5
min; wait 55 min;
flushing 25 min 10 mM
EDTA
II
DAG-hydrolysed
LDL
LDL Phospholipase A2 (0.00187
mg/mL, BSA 2% v/v)
Pressure 50 mbar, 5
min; wait 55 min;
flushing 40 min 10 mM
EDTA
II
ApoB-100 LDL Nonidet P-40 (0.1 mM in
water)
Flushing 25 min;
flushing 25 min water;
flushing 40 min BGE
III
Glycated
Collagen I
Collagen I D-Glucose 6-phosphate Pressure 50 mbar 40
min; wait 8-24 h;
pressure 50 mbar 10
min BGE
V
4.3.6 Study of coatings and coating interactionsDMSO was employed as EOF marker to obtain information about the charge of the coatings. The
retention factors (k) and distribution coefficients (KD) were calculated for steroids, apoB-100 peptide
fragments and LDL, which served as important biomarkers. Successive runs (n=3-6) were carried
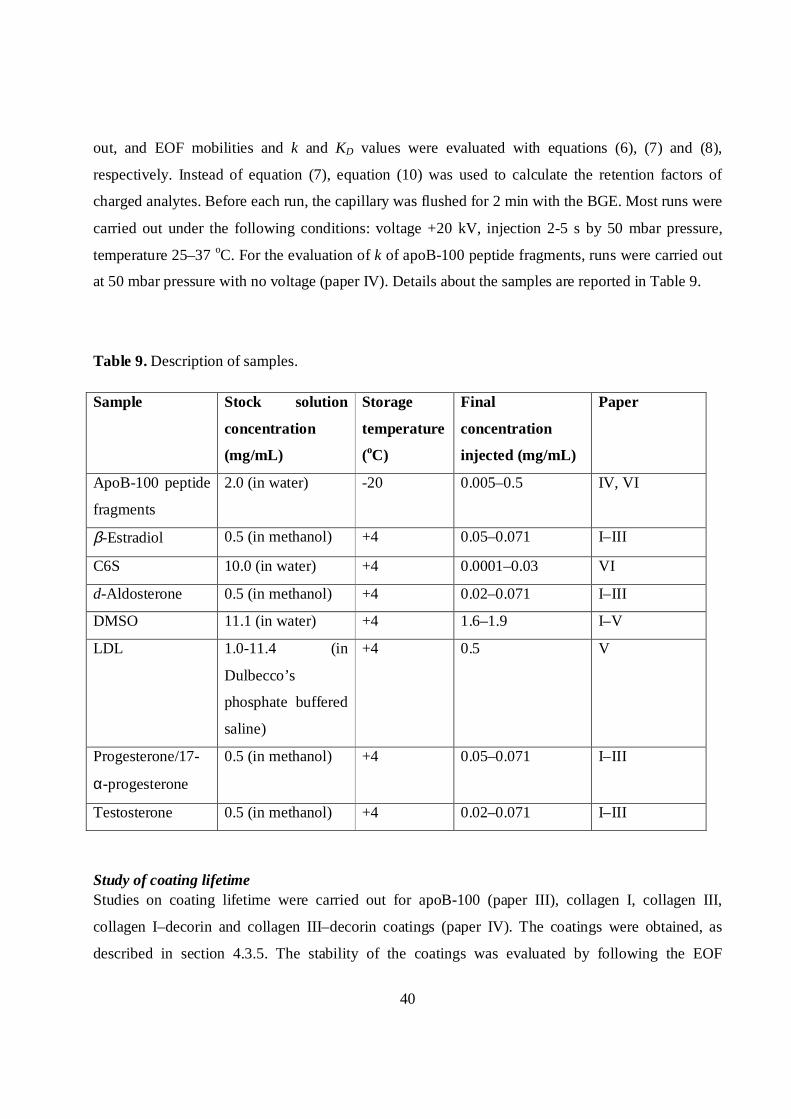
40
out, and EOF mobilities and k and KD values were evaluated with equations (6), (7) and (8),
respectively. Instead of equation (7), equation (10) was used to calculate the retention factors of
charged analytes. Before each run, the capillary was flushed for 2 min with the BGE. Most runs were
carried out under the following conditions: voltage +20 kV, injection 2-5 s by 50 mbar pressure,
temperature 25–37 oC. For the evaluation of k of apoB-100 peptide fragments, runs were carried out
at 50 mbar pressure with no voltage (paper IV). Details about the samples are reported in Table 9.
Table 9. Description of samples.
Sample Stock solution
concentration
(mg/mL)
Storage
temperature
(oC)
Final
concentration
injected (mg/mL)
Paper
ApoB-100 peptide
fragments
2.0 (in water) -20 0.005–0.5 IV, VI
β-Estradiol 0.5 (in methanol) +4 0.05–0.071 I–III
C6S 10.0 (in water) +4 0.0001–0.03 VI
d-Aldosterone 0.5 (in methanol) +4 0.02–0.071 I–III
DMSO 11.1 (in water) +4 1.6–1.9 I–V
LDL 1.0-11.4 (in
Dulbecco’s
phosphate buffered
saline)
+4 0.5 V
Progesterone/17-
α-progesterone
0.5 (in methanol) +4 0.05–0.071 I–III
Testosterone 0.5 (in methanol) +4 0.02–0.071 I–III
Study of coating lifetimeStudies on coating lifetime were carried out for apoB-100 (paper III), collagen I, collagen III,
collagen I–decorin and collagen III–decorin coatings (paper IV). The coatings were obtained, as
described in section 4.3.5. The stability of the coatings was evaluated by following the EOF
41
repeatability daily and the EOF reproducibility during 7–8 days. For the repeatability and
reproducibility studies, six and three successive runs, respectively, were carried out by injecting
DMSO as EOF marker. For apoB-100 coatings, the repeatability and reproducibility of k values of
steroids were evaluated as well. The running conditions were the following: +20 kV, injection 2 s at
50 mbar pressure, temperature 25 or 37 oC, BGE 20 mM phosphate or HEPES pH 7.4.
Measurement of isoelectric point of the coatingIsoelectric points were determined only for apoB-100 coatings (paper III). Coating of the capillary
with apoB-100 was carried out as explained in section 4.3.5. The capillary was then flushed for 10
min with the BGE at different pH values. The buffers were 20 mM phosphate (pH 6.0, 6.5, 7.4) and
acetate (pH 4.0, 4.5, 5.0). DMSO was used as EOF marker. Running conditions were the following:
±20 kV, injection 2 s at 50 mbar pressure, temperature 25 oC.
Asymmetrical flow field-flow fractionation studiesAsFlFFF was used to determine the size of LDL after oxidative or enzymatic modifications. The
carrier liquid used in AsFlFFF was 20 mM phosphate (pH 3.2, 6.5, 7.4) and acetate (pH 4.0, 5.0)
buffer. The actual channel thickness was calculated at 20 oC, from BSA solution in 8.5 mM
phosphate buffer with 150 mM NaCl solution. The BSA solution had a diffusion coefficient of
6.21x10⁻⁷ cm2/s. (121) The main and cross-flow rates were 1.8 and 1.4 mL/min, respectively.
In-vial oxidation (paper I) and enzymatic treatment (paper II) of LDL for AsFlFFF experiments were
performed in an Eppendorf plastic container and EDTA-free PBS, and incubation was done in a
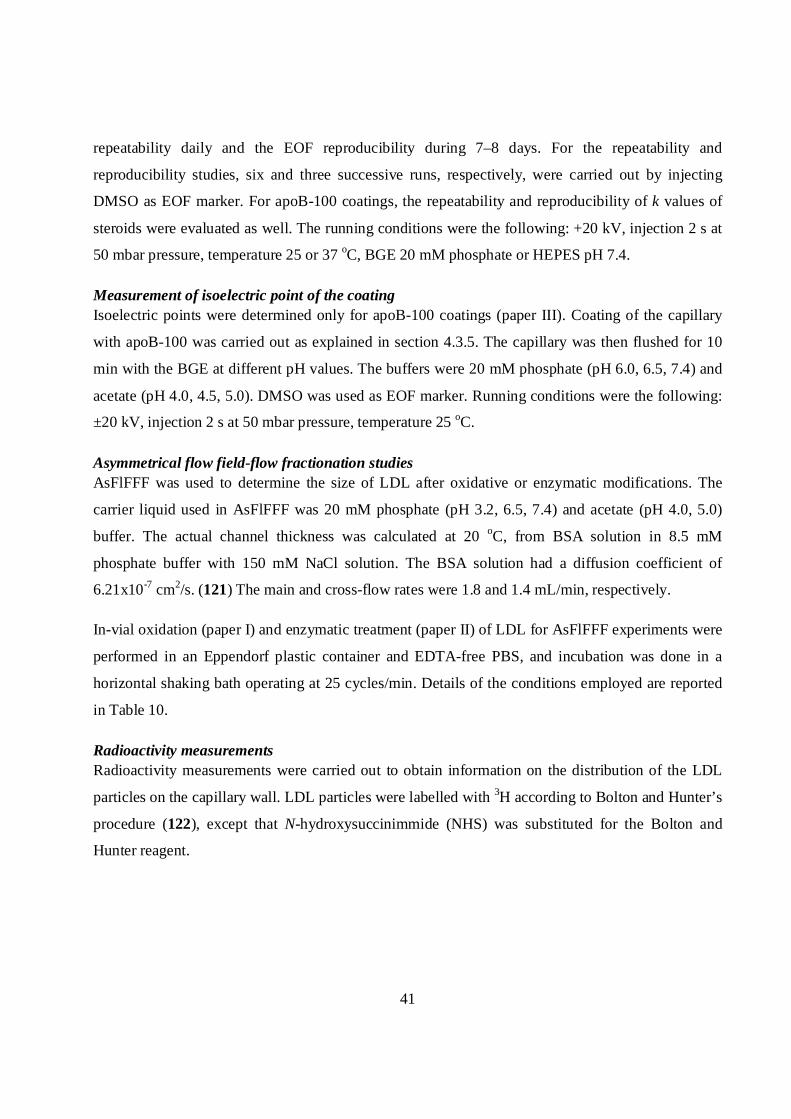
horizontal shaking bath operating at 25 cycles/min. Details of the conditions employed are reported
in Table 10.
Radioactivity measurementsRadioactivity measurements were carried out to obtain information on the distribution of the LDL
particles on the capillary wall. LDL particles were labelled with 3H according to Bolton and Hunter’s
procedure (122), except that N-hydroxysuccinimmide (NHS) was substituted for the Bolton and
Hunter reagent.
42
Table 10. Experimental conditions for in-vial oxidation and enzymatic treatment of LDL.
LDL oxidation SMase-modified
LDL
PLA2-modified
LDL
α-
Chymotrypsin-
modified LDL
Incubation
temperature
37 oC 25/37 oC 25/37 oC 25/37 oC
Incubation time 16-24 h Overnight
(~16 h)
Overnight
(~16 h)
Overnight
(~16 h)
LDL amount 2 µL (stock
solution 4.6
mg/mLa)
16 µL (stock
solution 6.2
mg/mLa)
16 µL (stock
solution 6.2
mg/mLa)
16 µL (stock
solution 6.2
mg/mLa)
Modifying agent CuSO4·5H2O (23
µL of 5 µmol/L
stock solution)
SMase (2.7 µL of
3.68 U/mL stock
solution)
PLA2 (1 µL of
0.01 mg/mL
stock solution)
α-chymotrypsyn
(10 µL of 1
mg/mL stock
solution)
Terminating
agent
EDTA (2 µL of 1
mM stock
solution)
EDTA (2.5 µL of
0.4 M stock
solution)
EDTA (2.5 µL of
0.4 M stock
solution)
PMSF (0.5 µL of
0.2 M stock
solution)a Expressed as protein concentration.
LDLs (5–10 mg/mL in 0.1 M borate buffer pH 8.5) were added to the labelling reagent, which had
been precooled in a vessel on ice. The reaction was stopped after 30 min by adding 100 mL of
glycine (0.2 M in 0.1 M borate buffer pH 8.5). The tagged LDL sample was purified on a PD-10
desalting column and dialysed against LDL buffer. Three different lengths (38.5, 77 and 192.5 cm)
of capillaries were coated with the 3H LDL, according to the procedure described in section 4.3.5.
The preconditioning, the rinsing with 3H LDL and the final BGE flushing were increased
proportionally to the capillary length. The capillaries of longer size were then cut into pieces of 38.5
cm length, and all coated capillaries were flushed with freshly made piranha acid (3:1 (v/v) sulphuric
acid and hydrogen peroxide) for 60 min. The 3H LDL coating was then collected and dissolved in 2
43
mL of MilliQ and 3 mL of OptiPhase HiSafe 3 scintillation cocktail and left for at least 1 h.
Radioactivity was measured with a liquid scintillation counter (3H window: channels 5–364) over a
period of 10 min. The counting efficiency of the 3H standard was estimated at 22.6 %.
Scanning electron microscopy and atomic force microscopy studiesFor the SEM and AFM studies of coatings, the polyimide layer of the outside of the fused silica
capillary was burned off and the underlying surface was cleaned with methanol and treated with
acid. After that, the surface was coated with the material of interest as described in section 4.3.4.
Modification of the surface was carried out according to the procedure described in the relative
paper (see also section 4.3.5). Capillaries were stored in either 20 phosphate or HEPES buffer pH 7.4
until the AFM measurements. Details of the types of coating submitted to SEM and AFM studies are
given in the sketch below.
4.3.7 Quartz crystal microbalance studiesQCM experiments were carried out only in study VI. Gold-plated QCM polystyrene (PS) crystals
were coated with positive apoB-100 peptide fragments (PP and PP2) of 19 and 42 amino acids and
carboxyl-derivatized collagen I and C6S.

44
For the experiments with polystyrene sensor chip, solutions of PP, BSA and NeuP2 were prepared in
10 mM PBS, pH 7.4, at concentrations of 0.8 mg/ml, 1 mg/ml and 0.8 mg/ml, respectively. A volume
of 20 µl of PP, BSA or NeuP2 solution was deposited on the polystyrene surface and left to incubate
for 16 hours at + 4 oC to permit maximum adsorption of the ligands. A different adsorption protocol
was used for PP2. The peptide solution was prepared in DMSO to a concentration of 1 mg/ml,
deposited on the polystyrene surface and left to incubate for 1 h at room temperature. Before
measurement, the chips were rinsed with running buffer. For the experiments with carboxyl sensor
chips (Attana AB, Stockholm, Sweden), collagen I or C6S were immobilized by amine or aldehyde
coupling according to the manufacturer’s recommendations.
Briefly, before the immobilization of collagen I, the sensor was pre-wetted ex situ with 20 µl of MilliQ
water, inserted into an Attana A100® QCM biosensor (Attana AB, Stockholm, Sweden) and left to
stabilize. The immobilization was performed at a flow rate of 25 µl/min in running buffer (10 mM
HEPES pH 7.4, 150 mM NaCl, 0.005% Tween™). The surface was activated by making three
consecutive injections of a freshly-prepared mixture of 0.2 M 1-ethyl-3-(3-dimethylaminopropyl)
carbodiimide hydrochloride (EDC) and 0.05 M sulpho-NHS (1:1), each for 400 s. The amine coupling
was then carried out by performing two or three injections of collagen I solution (0.050 mg/mL in 10
mM acetate buffer pH 4) for 200 sec. Finally, the remaining activated carboxyl groups on the surface
were deactivated with two injections of 1 M ethylene diamine pH 8.5 (400 s/ each).
C6S was immobilized on carboxyl sensor chips (Attana AB) by aldehyde coupling. cis-Diols of C6S
were first oxidized into aldehyde groups using sodium meta-periodate according to the supplier’s
recommendations (Thermo Scientific) in order to enable efficient coupling. Oxidized C6S was then
immobilized on carboxyl sensor chip via aldehyde coupling according to the manufacturer’s
recommendations (Attana AB). Briefly, the immobilization was carried out at a flow rate of 10
µL/min in HEPES buffer. Activation of the surface was performed by injecting a freshly made
mixture of 0.2 M EDC and 0.05 M sulpho-NHS (1:1) for 300 s. Carbohydrazide (5 mM) was
coupled to the activated surface prior to injection of the aldehyde-containing C6S. C6S (0.5 mg/mL)
was covalently bound to carbohydrazide; this was further stabilized by injection of
cyanoborohydride (0.1 M in acetate buffer pH 4.0).
45
Binding of the analyte to the sensor was monitored by frequency logging, and the frequency shifts
(∆f) were recorded with the Attester™ software (Attana AB, Stockholm, Sweden). The experiments
were carried out at room temperature.
Before the measurements, the derivatized PS and carboxyl crystals were equilibrated with the
running buffer (PBS, HEPES or phosphate buffer pH 7.4) in the flow-through QCM system. With
the exception of the BSA control and collagen I–derivatized chips, the surfaces were blocked with
BSA (2 mg/mL in PBS). A continuous flow of running buffer (PBS or phosphate pH 7.4) was
employed in all experiments (flow rate 25 µL/min). The selected analytes were C6S (max
concentration 30 µg/mL) for the PS-derivatized chips, and PP and NeuP2 (max concentration 250
µg/mL) for the carboxyl–derivatized chips.
For the evaluation of the dissociation constant (Kd), increasing concentrations of PP and C6S were
injected over the surfaces and ∆f values recorded with the Attester™ software. The kinetic data were
then analysed with the software ClampXP (123).
46
5 Results and discussionThe starting point for all research described in this thesis was the discovery, made in the Laboratory
of Analytical Chemistry, that capillaries for electrochromatography can be coated with lipoproteins.
(124) In addition to lipoproteins, coating methods were developed and optimized for
microemulsions, collagen and collagen–decorin. The suitability of these biomaterial-based stationary
phases for in situ oxidation, delipidation, glycation and interaction studies was then explored. The
results and discussion presented below summarize the results of the work. Capillary
electrochromatographic results were supported and complemented with scanning electron
microscopy, asymmetrical flow field flow fractionation and atomic force microscopy studies. The
results obtained by CEC were exploited in continuous flow quartz crystal microbalance studies to
obtain further information on the interactions between selected extracellular components and low-
density lipoproteins.
5.1 Coating of capillaries with biomaterials
The development of stable biomaterial coatings was the first step in the studies. The good and
repeatable results laid the basis for in situ studies. Figure 3 shows a schematic representation of the
immobilization of biomaterials on the inner surface of a fused silica capillary. As already mentioned,
the inner surface of a fused silica capillary is covered with silanol groups that start to be dissociated
at above pH about 2 and make the capillary wall negatively charged. Negative charges attract basic
proteins and other positively charged analytes causing them to adsorb on the capillary wall. Since the
fused silica surface is hydrophobic in nature, it also favours the adsorption of hydrophobic parts of
proteins and other biological materials. These features were exploited for the immobilization of
biological materials, namely, LDL, microemulsions, collagen I, collagen III, collagen I–decorin and
collagen III–decorin, on the inner surface of the silica capillary. The variety of biomaterials studied,
differing in chemical nature and properties, presented a challenge for the development of suitable
coating procedures.
5.1.1 Development of LDL and microemulsion coatingsAs shown in Table 7, LDL and microemulsions required a shorter coating time than did collagen and
collagen–decorin. LDL and microemulsions are spherical particles that have electrostatic and
hydrophobic interactions with the capillary wall.
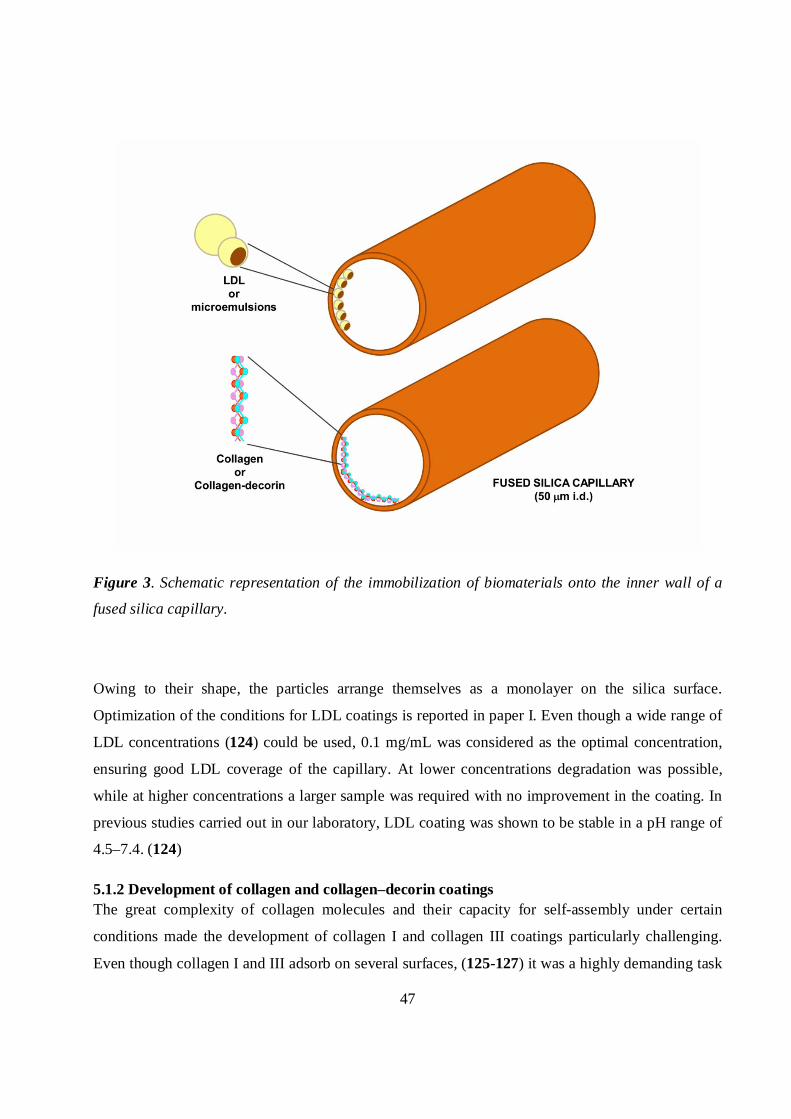
47
Figure 3. Schematic representation of the immobilization of biomaterials onto the inner wall of a
fused silica capillary.
Owing to their shape, the particles arrange themselves as a monolayer on the silica surface.
Optimization of the conditions for LDL coatings is reported in paper I. Even though a wide range of
LDL concentrations (124) could be used, 0.1 mg/mL was considered as the optimal concentration,
ensuring good LDL coverage of the capillary. At lower concentrations degradation was possible,
while at higher concentrations a larger sample was required with no improvement in the coating. In
previous studies carried out in our laboratory, LDL coating was shown to be stable in a pH range of
4.5–7.4. (124)
5.1.2 Development of collagen and collagen–decorin coatingsThe great complexity of collagen molecules and their capacity for self-assembly under certain
conditions made the development of collagen I and collagen III coatings particularly challenging.
Even though collagen I and III adsorb on several surfaces, (125-127) it was a highly demanding task
48
to develop a stable and repeatable coatings on the fused silica wall of a capillary. First, dialysis was
crucial for obtaining a homogeneous collagen solution. The buffer had to be carefully selected and
the time required for coating preparation optimized. As a rule, the buffer used for the dialysis had to
be the same as that in the coating solution. Phosphate buffer pH 7.4 was selected for collagen I,
while HEPES with 135 mM NaCl was more suitable for collagen III. For both buffers, the pH was
7.4 and the ionic strength 20 mM. The addition of NaCl was essential for the stabilization of the
collagen III coating, but NaCl completely destabilized the collagen I coating. A possible explanation
is the difference in the structure of collagen I and III. Type I is less hydrophilic than type III and
easily interacts with the hydrophobic fused silica capillary. Collagen I also interacts through
electrostatic interactions, which may be suppressed by the presence of salt. Collagen III contains a
higher degree of hydroxyproline and, being more hydrophilic than type I, adsorbs less readily on
hydrophobic surfaces. We assume, therefore, that collagen III can form salt bridges with the
negatively charged silica wall when NaCl is present in the medium. (128,129). In addition, just as in
the phospholipid coatings, protonation of the amines of HEPES probably enhances the formation and
stability of collagen III coatings. (130) A final important detail was the choice of the membrane
molecular weight cut-off (MWCO) used in the dialysis. A MWCO of 12–24 kDa was selected to
ensure that the dialysis would be completed in a reasonable time frame. A lower MWCO was tested,
but the dialysis process was less repeatable and much more time consuming. The time required for
dialysis depended on the type of collagen (3 h for collagen I and overnight for collagen III) and
could be related to structural differences. Furthermore, since collagen self-assembly commences at
about 25 oC, (131) the dialysis was carried out at 4 oC to avoid any monomer aggregation. On the
other hand, the temperature selected for the coating was 25 or 37 oC, in order to ensure monomer
assembly and fibril formation. During the coating process, the capillary was not simply rinsed with
the collagen solution but left filled for a certain time. Thus, the waiting interval was optimized to 2
h, during which the collagen monomers had sufficient time to adsorb on the capillary wall and self-
assemble into fibrils.
The development of collagen–decorin coatings was less challenging, once the collagen coatings had
been optimized. First, the capillary coated with collagen was simply rinsed with decorin, and the
capillary was left filled for several hours (e.g., overnight). Although a stable coating was achieved,
note was taken of the observation of Bierbaum and coworkers that premixing of collagen with
decorin results in tight and ordered fibrils. (69) Further requirements for stable collagen–decorin
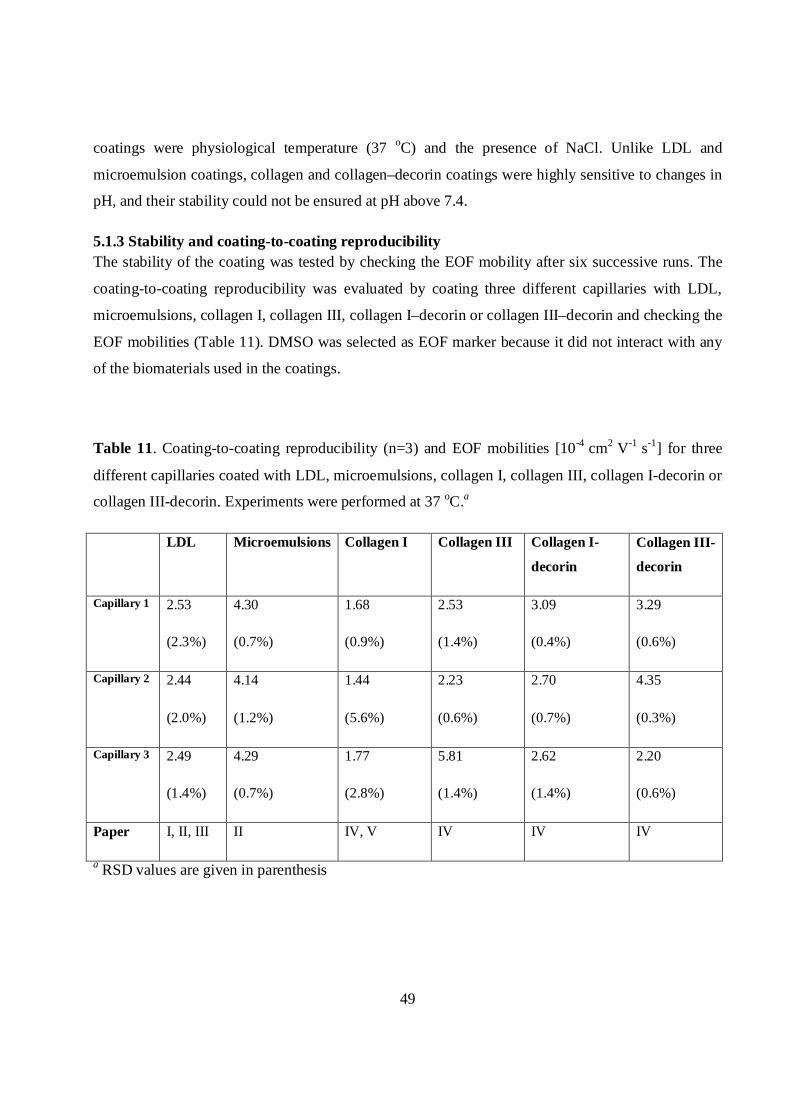
49
coatings were physiological temperature (37 oC) and the presence of NaCl. Unlike LDL and
microemulsion coatings, collagen and collagen–decorin coatings were highly sensitive to changes in
pH, and their stability could not be ensured at pH above 7.4.
5.1.3 Stability and coating-to-coating reproducibilityThe stability of the coating was tested by checking the EOF mobility after six successive runs. The
coating-to-coating reproducibility was evaluated by coating three different capillaries with LDL,
microemulsions, collagen I, collagen III, collagen I–decorin or collagen III–decorin and checking the
EOF mobilities (Table 11). DMSO was selected as EOF marker because it did not interact with any
of the biomaterials used in the coatings.
Table 11. Coating-to-coating reproducibility (n=3) and EOF mobilities [10-4 cm2 V-1 s-1] for three
different capillaries coated with LDL, microemulsions, collagen I, collagen III, collagen I-decorin or
collagen III-decorin. Experiments were performed at 37 oC.a
LDL Microemulsions Collagen I Collagen III Collagen I-
decorin
Collagen III-
decorin
Capillary 1 2.53
(2.3%)
4.30
(0.7%)
1.68
(0.9%)
2.53
(1.4%)
3.09
(0.4%)
3.29
(0.6%)
Capillary 2 2.44
(2.0%)
4.14
(1.2%)
1.44
(5.6%)
2.23
(0.6%)
2.70
(0.7%)
4.35
(0.3%)
Capillary 3 2.49
(1.4%)
4.29
(0.7%)
1.77
(2.8%)
5.81
(1.4%)
2.62
(1.4%)
2.20
(0.6%)
Paper I, II, III II IV, V IV IV IV
a RSD values are given in parenthesis
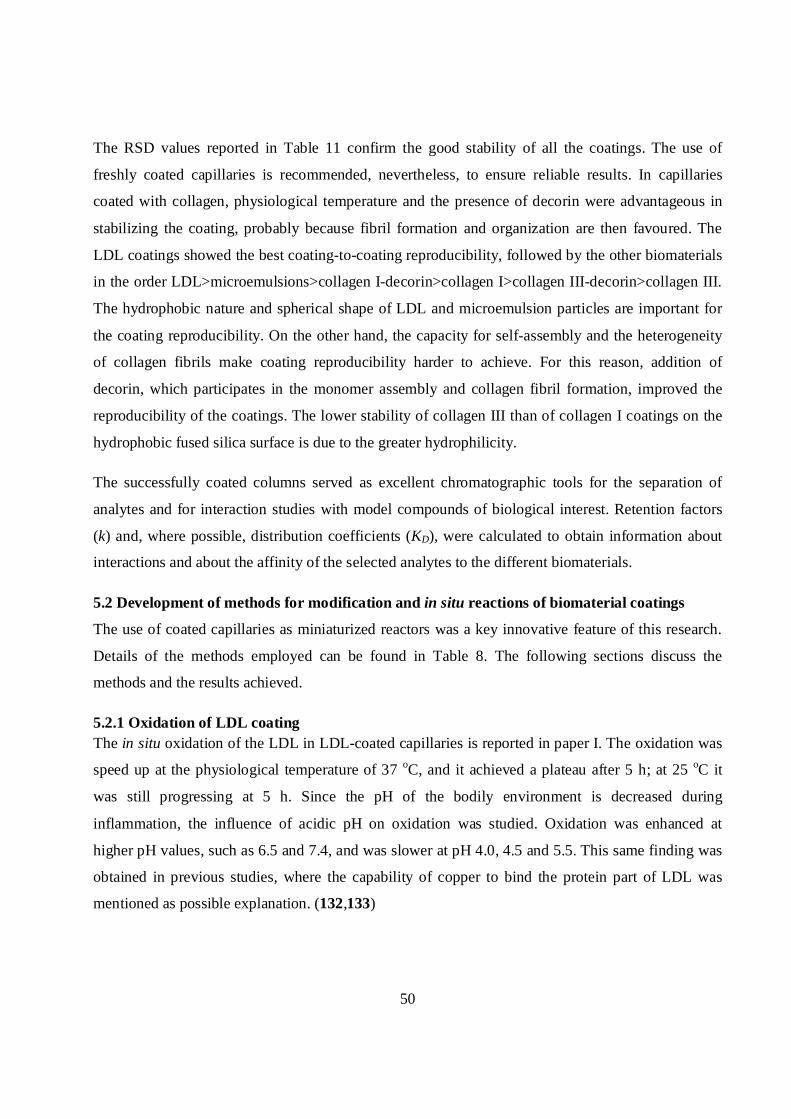
50
The RSD values reported in Table 11 confirm the good stability of all the coatings. The use of
freshly coated capillaries is recommended, nevertheless, to ensure reliable results. In capillaries
coated with collagen, physiological temperature and the presence of decorin were advantageous in
stabilizing the coating, probably because fibril formation and organization are then favoured. The
LDL coatings showed the best coating-to-coating reproducibility, followed by the other biomaterials
in the order LDL>microemulsions>collagen I-decorin>collagen I>collagen III-decorin>collagen III.
The hydrophobic nature and spherical shape of LDL and microemulsion particles are important for
the coating reproducibility. On the other hand, the capacity for self-assembly and the heterogeneity
of collagen fibrils make coating reproducibility harder to achieve. For this reason, addition of
decorin, which participates in the monomer assembly and collagen fibril formation, improved the
reproducibility of the coatings. The lower stability of collagen III than of collagen I coatings on the
hydrophobic fused silica surface is due to the greater hydrophilicity.
The successfully coated columns served as excellent chromatographic tools for the separation of
analytes and for interaction studies with model compounds of biological interest. Retention factors
(k) and, where possible, distribution coefficients (KD), were calculated to obtain information about
interactions and about the affinity of the selected analytes to the different biomaterials.
5.2 Development of methods for modification and in situ reactions of biomaterial coatings
The use of coated capillaries as miniaturized reactors was a key innovative feature of this research.
Details of the methods employed can be found in Table 8. The following sections discuss the
methods and the results achieved.
5.2.1 Oxidation of LDL coatingThe in situ oxidation of the LDL in LDL-coated capillaries is reported in paper I. The oxidation was
speed up at the physiological temperature of 37 oC, and it achieved a plateau after 5 h; at 25 oC it
was still progressing at 5 h. Since the pH of the bodily environment is decreased during
inflammation, the influence of acidic pH on oxidation was studied. Oxidation was enhanced at
higher pH values, such as 6.5 and 7.4, and was slower at pH 4.0, 4.5 and 5.5. This same finding was
obtained in previous studies, where the capability of copper to bind the protein part of LDL was
mentioned as possible explanation. (132,133)
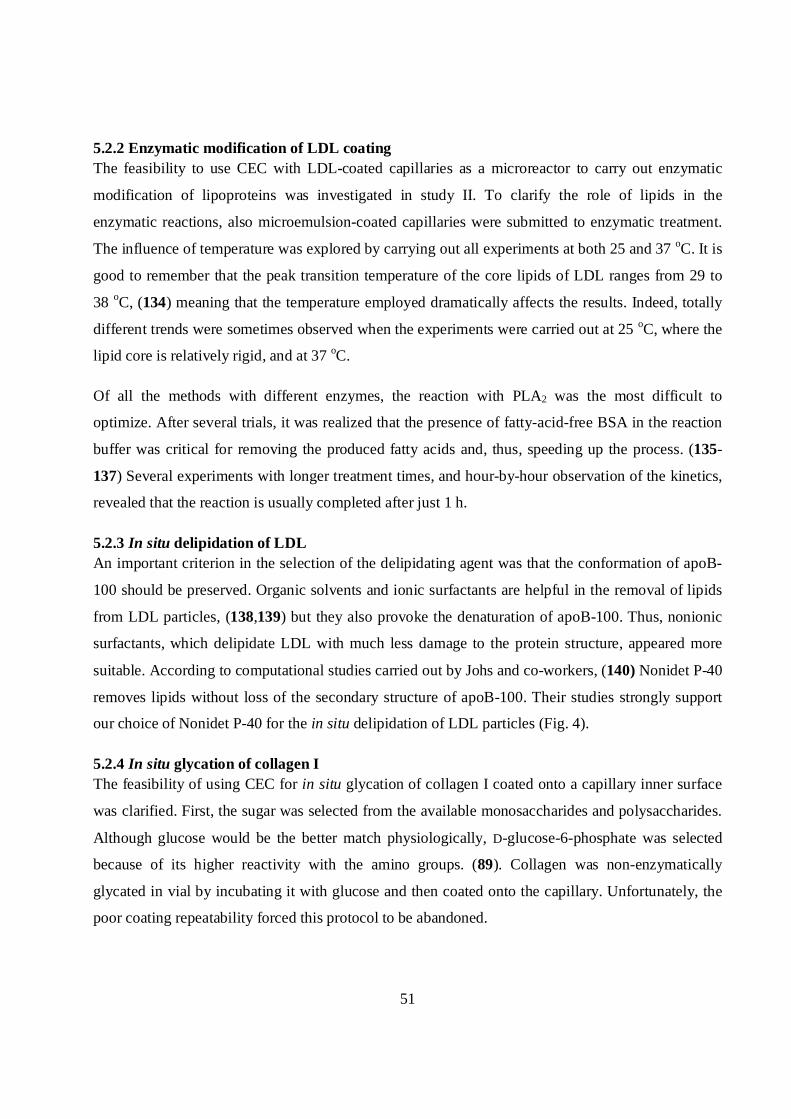
51
5.2.2 Enzymatic modification of LDL coatingThe feasibility to use CEC with LDL-coated capillaries as a microreactor to carry out enzymatic
modification of lipoproteins was investigated in study II. To clarify the role of lipids in the
enzymatic reactions, also microemulsion-coated capillaries were submitted to enzymatic treatment.
The influence of temperature was explored by carrying out all experiments at both 25 and 37 oC. It is
good to remember that the peak transition temperature of the core lipids of LDL ranges from 29 to
38 oC, (134) meaning that the temperature employed dramatically affects the results. Indeed, totally
different trends were sometimes observed when the experiments were carried out at 25 oC, where the
lipid core is relatively rigid, and at 37 oC.
Of all the methods with different enzymes, the reaction with PLA2 was the most difficult to
optimize. After several trials, it was realized that the presence of fatty-acid-free BSA in the reaction
buffer was critical for removing the produced fatty acids and, thus, speeding up the process. (135-
137) Several experiments with longer treatment times, and hour-by-hour observation of the kinetics,
revealed that the reaction is usually completed after just 1 h.
5.2.3 In situ delipidation of LDLAn important criterion in the selection of the delipidating agent was that the conformation of apoB-
100 should be preserved. Organic solvents and ionic surfactants are helpful in the removal of lipids
from LDL particles, (138,139) but they also provoke the denaturation of apoB-100. Thus, nonionic
surfactants, which delipidate LDL with much less damage to the protein structure, appeared more
suitable. According to computational studies carried out by Johs and co-workers, (140) Nonidet P-40
removes lipids without loss of the secondary structure of apoB-100. Their studies strongly support
our choice of Nonidet P-40 for the in situ delipidation of LDL particles (Fig. 4).
5.2.4 In situ glycation of collagen IThe feasibility of using CEC for in situ glycation of collagen I coated onto a capillary inner surface
was clarified. First, the sugar was selected from the available monosaccharides and polysaccharides.
Although glucose would be the better match physiologically, D-glucose-6-phosphate was selected
because of its higher reactivity with the amino groups. (89). Collagen was non-enzymatically
glycated in vial by incubating it with glucose and then coated onto the capillary. Unfortunately, the
poor coating repeatability forced this protocol to be abandoned.
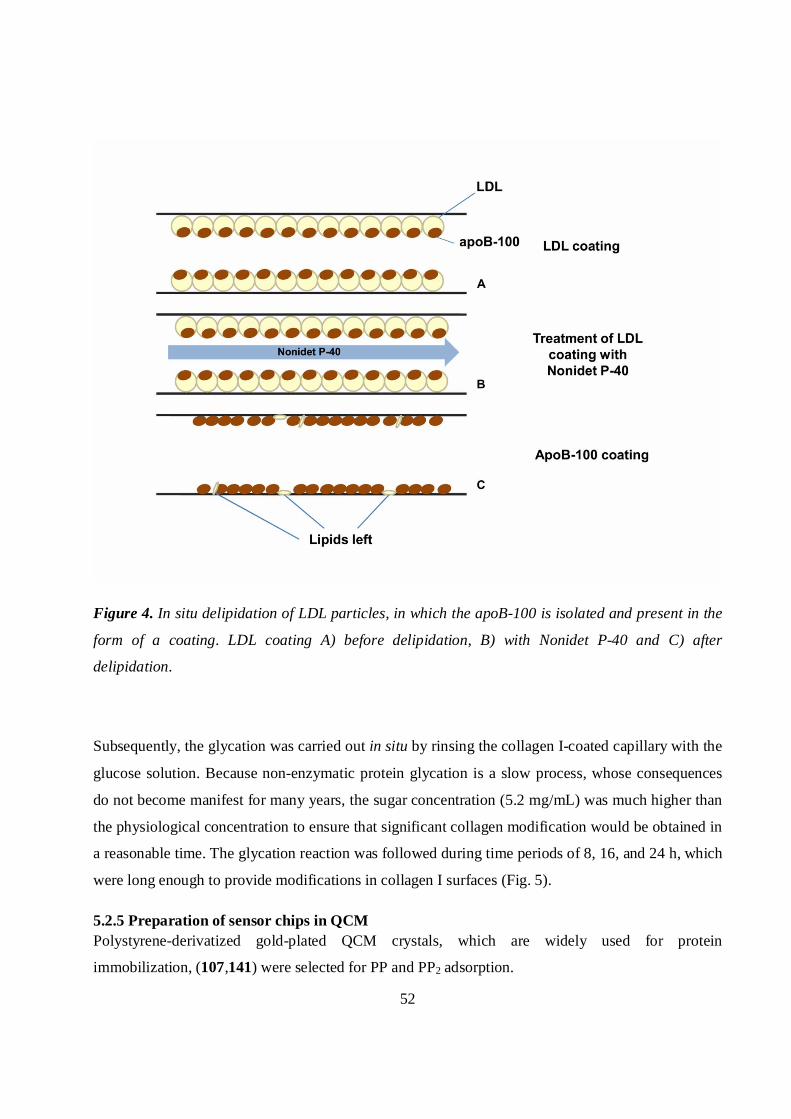
52
Figure 4. In situ delipidation of LDL particles, in which the apoB-100 is isolated and present in the
form of a coating. LDL coating A) before delipidation, B) with Nonidet P-40 and C) after
delipidation.
Subsequently, the glycation was carried out in situ by rinsing the collagen I-coated capillary with the
glucose solution. Because non-enzymatic protein glycation is a slow process, whose consequences
do not become manifest for many years, the sugar concentration (5.2 mg/mL) was much higher than
the physiological concentration to ensure that significant collagen modification would be obtained in
a reasonable time. The glycation reaction was followed during time periods of 8, 16, and 24 h, which
were long enough to provide modifications in collagen I surfaces (Fig. 5).
5.2.5 Preparation of sensor chips in QCMPolystyrene-derivatized gold-plated QCM crystals, which are widely used for protein
immobilization, (107,141) were selected for PP and PP2 adsorption.
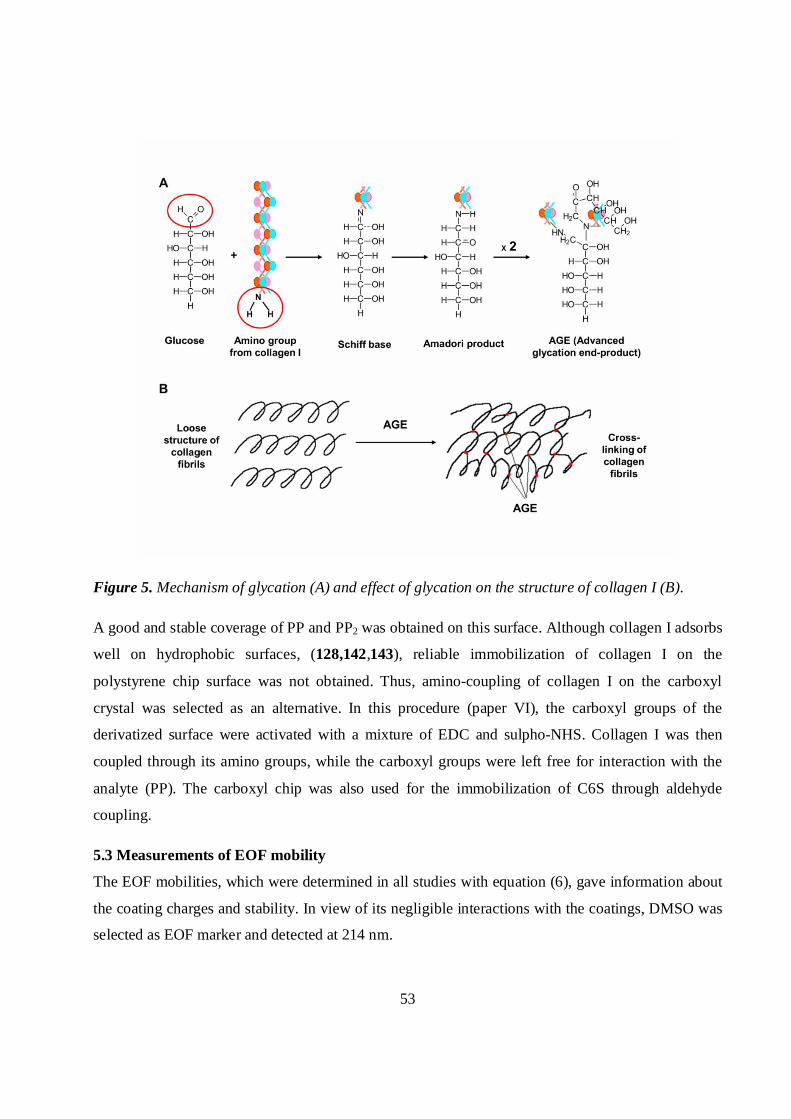
53
Figure 5. Mechanism of glycation (A) and effect of glycation on the structure of collagen I (B).
A good and stable coverage of PP and PP2 was obtained on this surface. Although collagen I adsorbs
well on hydrophobic surfaces, (128,142,143), reliable immobilization of collagen I on the
polystyrene chip surface was not obtained. Thus, amino-coupling of collagen I on the carboxyl
crystal was selected as an alternative. In this procedure (paper VI), the carboxyl groups of the
derivatized surface were activated with a mixture of EDC and sulpho-NHS. Collagen I was then
coupled through its amino groups, while the carboxyl groups were left free for interaction with the
analyte (PP). The carboxyl chip was also used for the immobilization of C6S through aldehyde
coupling.
5.3 Measurements of EOF mobility
The EOF mobilities, which were determined in all studies with equation (6), gave information about
the coating charges and stability. In view of its negligible interactions with the coatings, DMSO was
selected as EOF marker and detected at 214 nm.
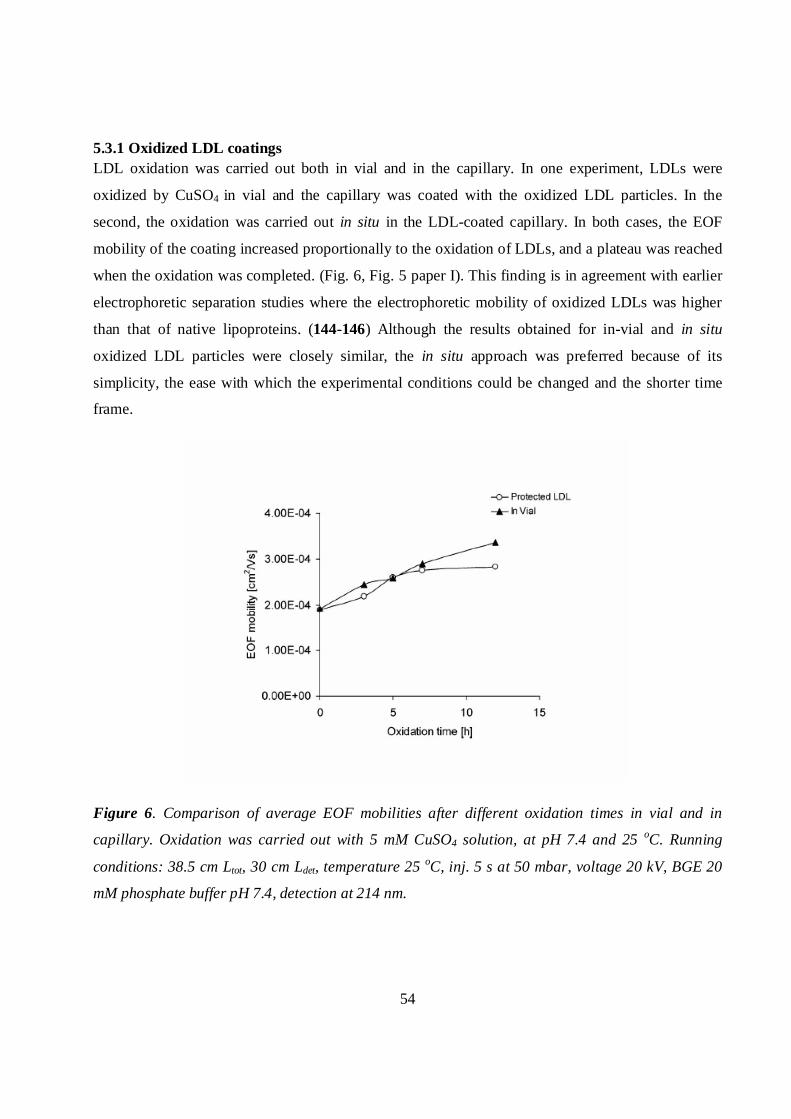
54
5.3.1 Oxidized LDL coatingsLDL oxidation was carried out both in vial and in the capillary. In one experiment, LDLs were
oxidized by CuSO4 in vial and the capillary was coated with the oxidized LDL particles. In the
second, the oxidation was carried out in situ in the LDL-coated capillary. In both cases, the EOF
mobility of the coating increased proportionally to the oxidation of LDLs, and a plateau was reached
when the oxidation was completed. (Fig. 6, Fig. 5 paper I). This finding is in agreement with earlier
electrophoretic separation studies where the electrophoretic mobility of oxidized LDLs was higher
than that of native lipoproteins. (144-146) Although the results obtained for in-vial and in situ
oxidized LDL particles were closely similar, the in situ approach was preferred because of its
simplicity, the ease with which the experimental conditions could be changed and the shorter time
frame.
Figure 6. Comparison of average EOF mobilities after different oxidation times in vial and in
capillary. Oxidation was carried out with 5 mM CuSO4 solution, at pH 7.4 and 25 oC. Running
conditions: 38.5 cm Ltot, 30 cm Ldet, temperature 25 oC, inj. 5 s at 50 mbar, voltage 20 kV, BGE 20
mM phosphate buffer pH 7.4, detection at 214 nm.
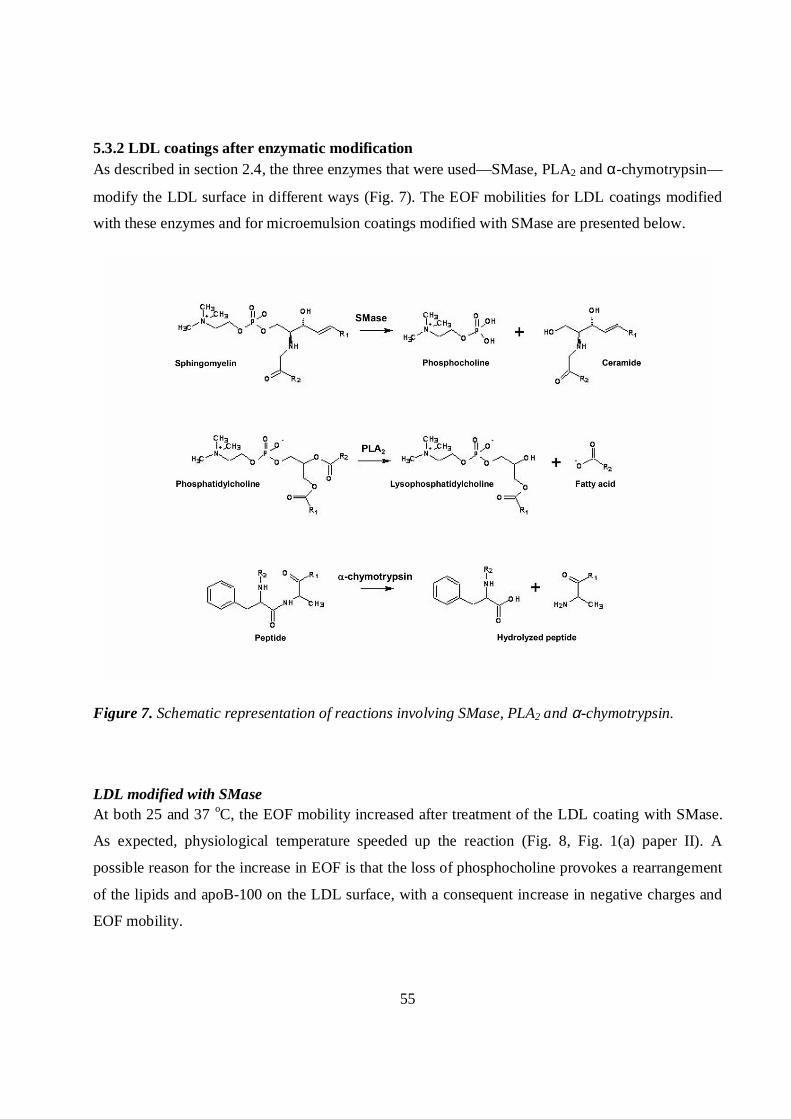
55
5.3.2 LDL coatings after enzymatic modificationAs described in section 2.4, the three enzymes that were used—SMase, PLA2 and α-chymotrypsin—
modify the LDL surface in different ways (Fig. 7). The EOF mobilities for LDL coatings modified
with these enzymes and for microemulsion coatings modified with SMase are presented below.
Figure 7. Schematic representation of reactions involving SMase, PLA2 and α-chymotrypsin.
LDL modified with SMaseAt both 25 and 37 oC, the EOF mobility increased after treatment of the LDL coating with SMase.
As expected, physiological temperature speeded up the reaction (Fig. 8, Fig. 1(a) paper II). A
possible reason for the increase in EOF is that the loss of phosphocholine provokes a rearrangement
of the lipids and apoB-100 on the LDL surface, with a consequent increase in negative charges and
EOF mobility.
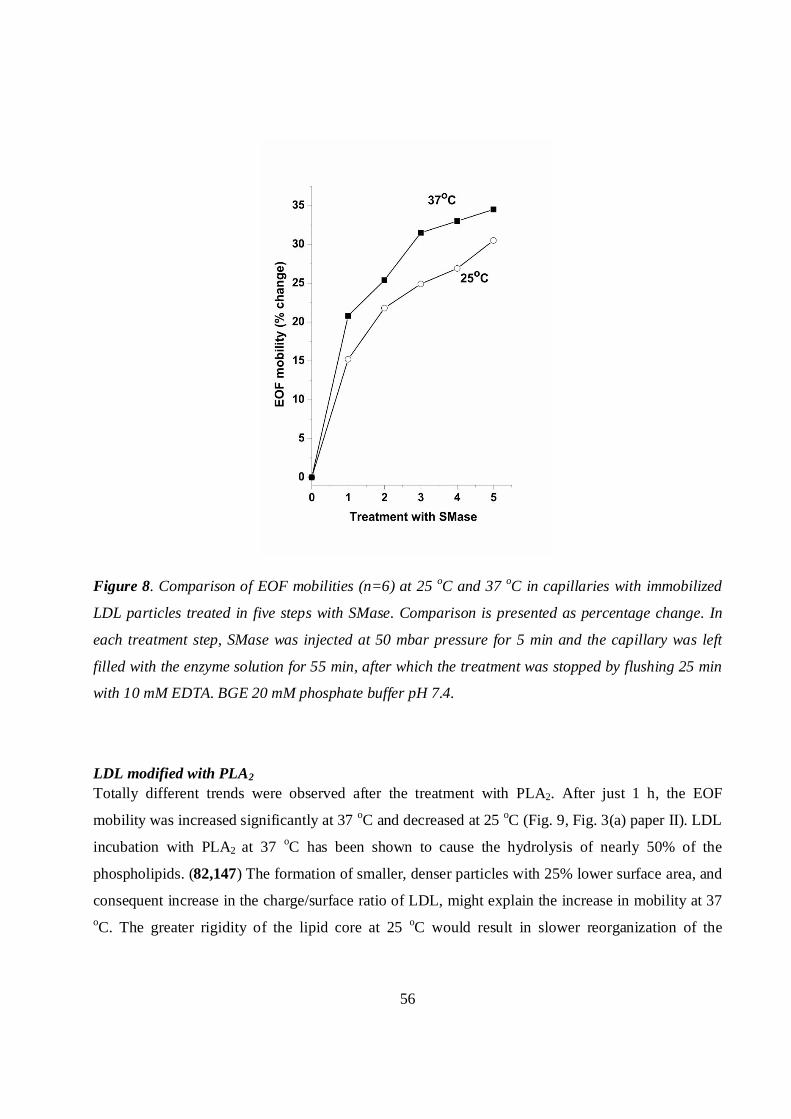
56
Figure 8. Comparison of EOF mobilities (n=6) at 25 oC and 37 oC in capillaries with immobilized
LDL particles treated in five steps with SMase. Comparison is presented as percentage change. In
each treatment step, SMase was injected at 50 mbar pressure for 5 min and the capillary was left
filled with the enzyme solution for 55 min, after which the treatment was stopped by flushing 25 min
with 10 mM EDTA. BGE 20 mM phosphate buffer pH 7.4.
LDL modified with PLA2
Totally different trends were observed after the treatment with PLA2. After just 1 h, the EOF
mobility was increased significantly at 37 oC and decreased at 25 oC (Fig. 9, Fig. 3(a) paper II). LDL
incubation with PLA2 at 37 oC has been shown to cause the hydrolysis of nearly 50% of the
phospholipids. (82,147) The formation of smaller, denser particles with 25% lower surface area, and
consequent increase in the charge/surface ratio of LDL, might explain the increase in mobility at 37oC. The greater rigidity of the lipid core at 25 oC would result in slower reorganization of the
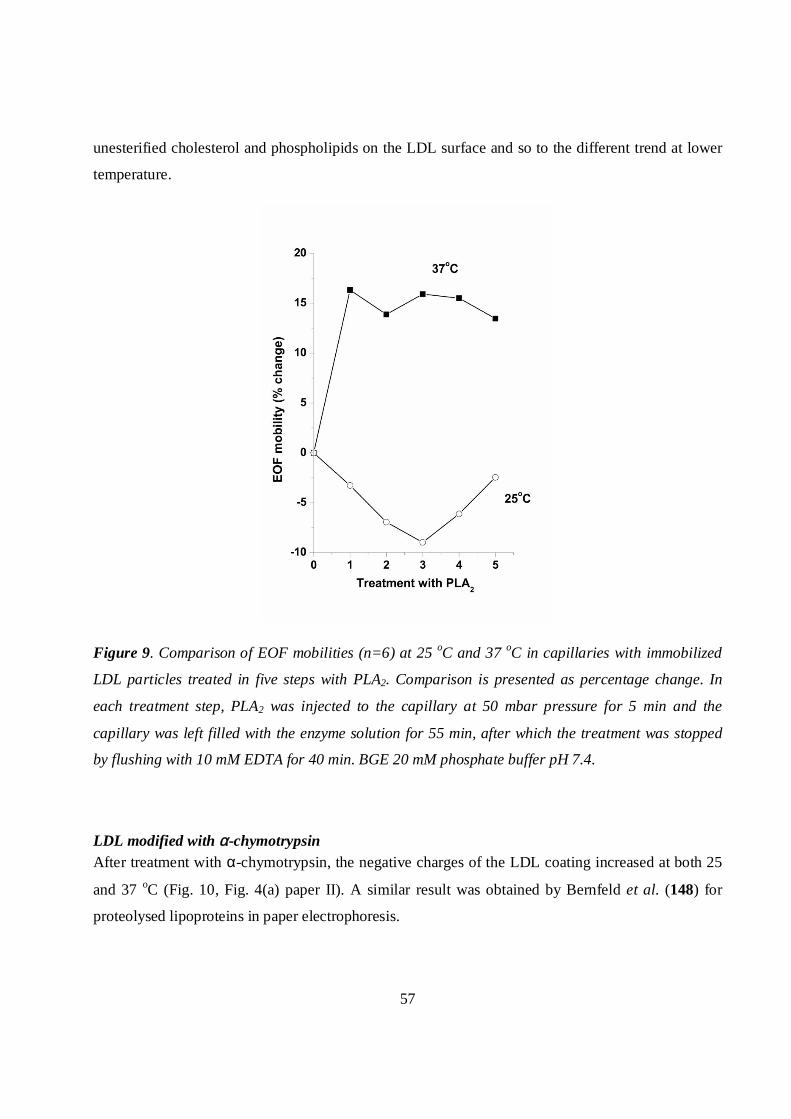
57
unesterified cholesterol and phospholipids on the LDL surface and so to the different trend at lower
temperature.
Figure 9. Comparison of EOF mobilities (n=6) at 25 oC and 37 oC in capillaries with immobilized
LDL particles treated in five steps with PLA2. Comparison is presented as percentage change. In
each treatment step, PLA2 was injected to the capillary at 50 mbar pressure for 5 min and the
capillary was left filled with the enzyme solution for 55 min, after which the treatment was stopped
by flushing with 10 mM EDTA for 40 min. BGE 20 mM phosphate buffer pH 7.4.
LDL modified with α-chymotrypsinAfter treatment with α-chymotrypsin, the negative charges of the LDL coating increased at both 25
and 37 oC (Fig. 10, Fig. 4(a) paper II). A similar result was obtained by Bernfeld et al. (148) for
proteolysed lipoproteins in paper electrophoresis.
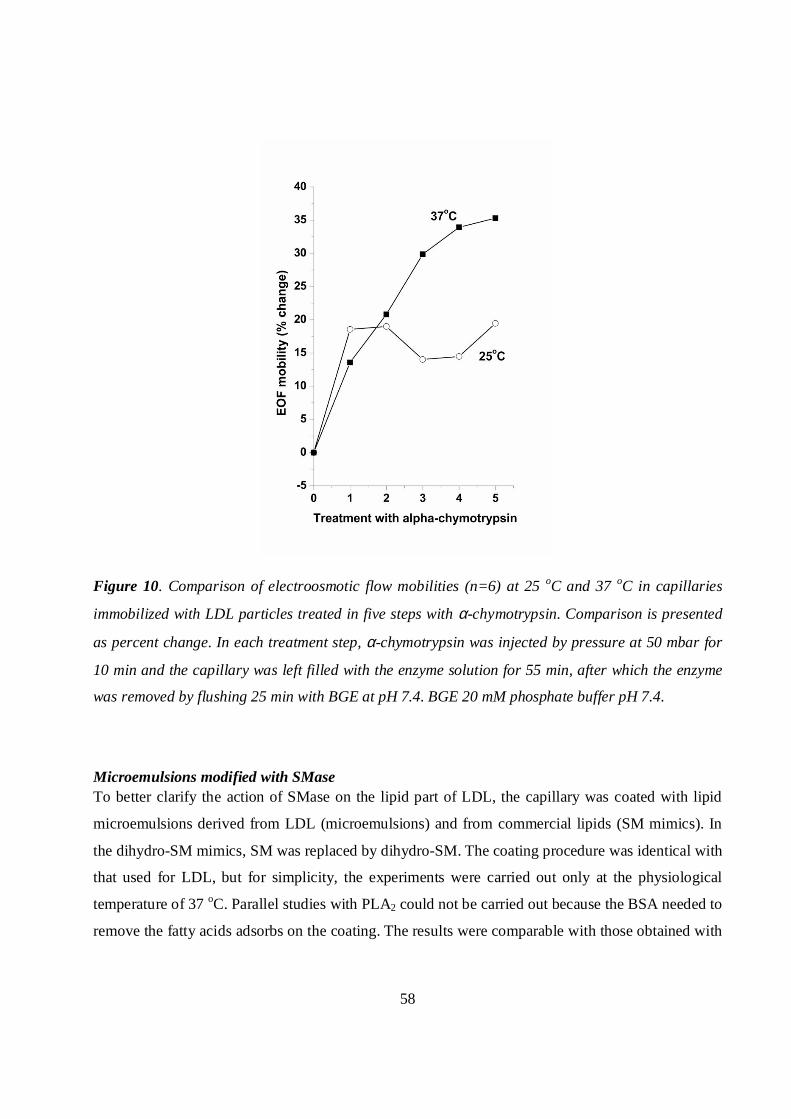
58
Figure 10. Comparison of electroosmotic flow mobilities (n=6) at 25 oC and 37 oC in capillaries
immobilized with LDL particles treated in five steps with α-chymotrypsin. Comparison is presented
as percent change. In each treatment step, α-chymotrypsin was injected by pressure at 50 mbar for
10 min and the capillary was left filled with the enzyme solution for 55 min, after which the enzyme
was removed by flushing 25 min with BGE at pH 7.4. BGE 20 mM phosphate buffer pH 7.4.
Microemulsions modified with SMaseTo better clarify the action of SMase on the lipid part of LDL, the capillary was coated with lipid
microemulsions derived from LDL (microemulsions) and from commercial lipids (SM mimics). In
the dihydro-SM mimics, SM was replaced by dihydro-SM. The coating procedure was identical with
that used for LDL, but for simplicity, the experiments were carried out only at the physiological
temperature of 37 oC. Parallel studies with PLA2 could not be carried out because the BSA needed to
remove the fatty acids adsorbs on the coating. The results were comparable with those obtained with
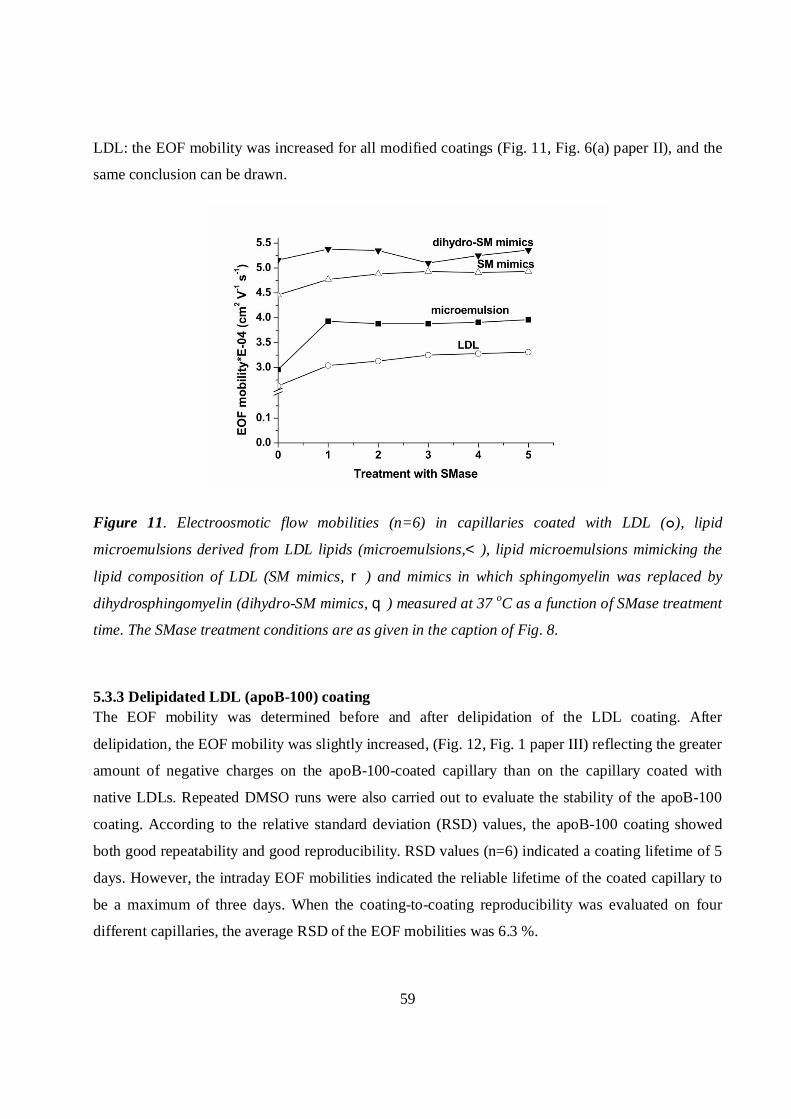
59
LDL: the EOF mobility was increased for all modified coatings (Fig. 11, Fig. 6(a) paper II), and the
same conclusion can be drawn.
Figure 11. Electroosmotic flow mobilities (n=6) in capillaries coated with LDL ( ), lipid
microemulsions derived from LDL lipids (microemulsions,<), lipid microemulsions mimicking the
lipid composition of LDL (SM mimics, r) and mimics in which sphingomyelin was replaced by
dihydrosphingomyelin (dihydro-SM mimics,q) measured at 37 oC as a function of SMase treatment
time. The SMase treatment conditions are as given in the caption of Fig. 8.
5.3.3 Delipidated LDL (apoB-100) coatingThe EOF mobility was determined before and after delipidation of the LDL coating. After
delipidation, the EOF mobility was slightly increased, (Fig. 12, Fig. 1 paper III) reflecting the greater
amount of negative charges on the apoB-100-coated capillary than on the capillary coated with
native LDLs. Repeated DMSO runs were also carried out to evaluate the stability of the apoB-100
coating. According to the relative standard deviation (RSD) values, the apoB-100 coating showed
both good repeatability and good reproducibility. RSD values (n=6) indicated a coating lifetime of 5
days. However, the intraday EOF mobilities indicated the reliable lifetime of the coated capillary to
be a maximum of three days. When the coating-to-coating reproducibility was evaluated on four
different capillaries, the average RSD of the EOF mobilities was 6.3 %.
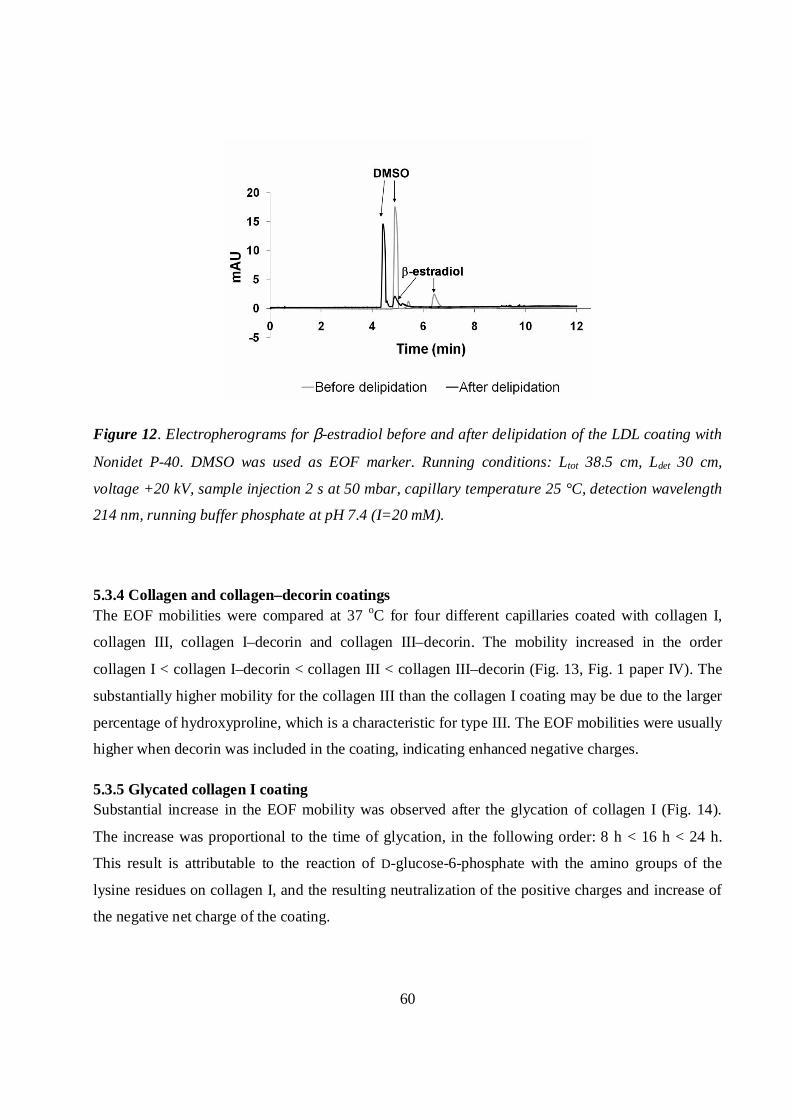
60
Figure 12. Electropherograms for β-estradiol before and after delipidation of the LDL coating with
Nonidet P-40. DMSO was used as EOF marker. Running conditions: Ltot 38.5 cm, Ldet 30 cm,
voltage +20 kV, sample injection 2 s at 50 mbar, capillary temperature 25 °C, detection wavelength
214 nm, running buffer phosphate at pH 7.4 (I=20 mM).
5.3.4 Collagen and collagen–decorin coatingsThe EOF mobilities were compared at 37 oC for four different capillaries coated with collagen I,
collagen III, collagen I–decorin and collagen III–decorin. The mobility increased in the order
collagen I < collagen I–decorin < collagen III < collagen III–decorin (Fig. 13, Fig. 1 paper IV). The
substantially higher mobility for the collagen III than the collagen I coating may be due to the larger
percentage of hydroxyproline, which is a characteristic for type III. The EOF mobilities were usually
higher when decorin was included in the coating, indicating enhanced negative charges.
5.3.5 Glycated collagen I coatingSubstantial increase in the EOF mobility was observed after the glycation of collagen I (Fig. 14).
The increase was proportional to the time of glycation, in the following order: 8 h < 16 h < 24 h.
This result is attributable to the reaction of D-glucose-6-phosphate with the amino groups of the
lysine residues on collagen I, and the resulting neutralization of the positive charges and increase of
the negative net charge of the coating.
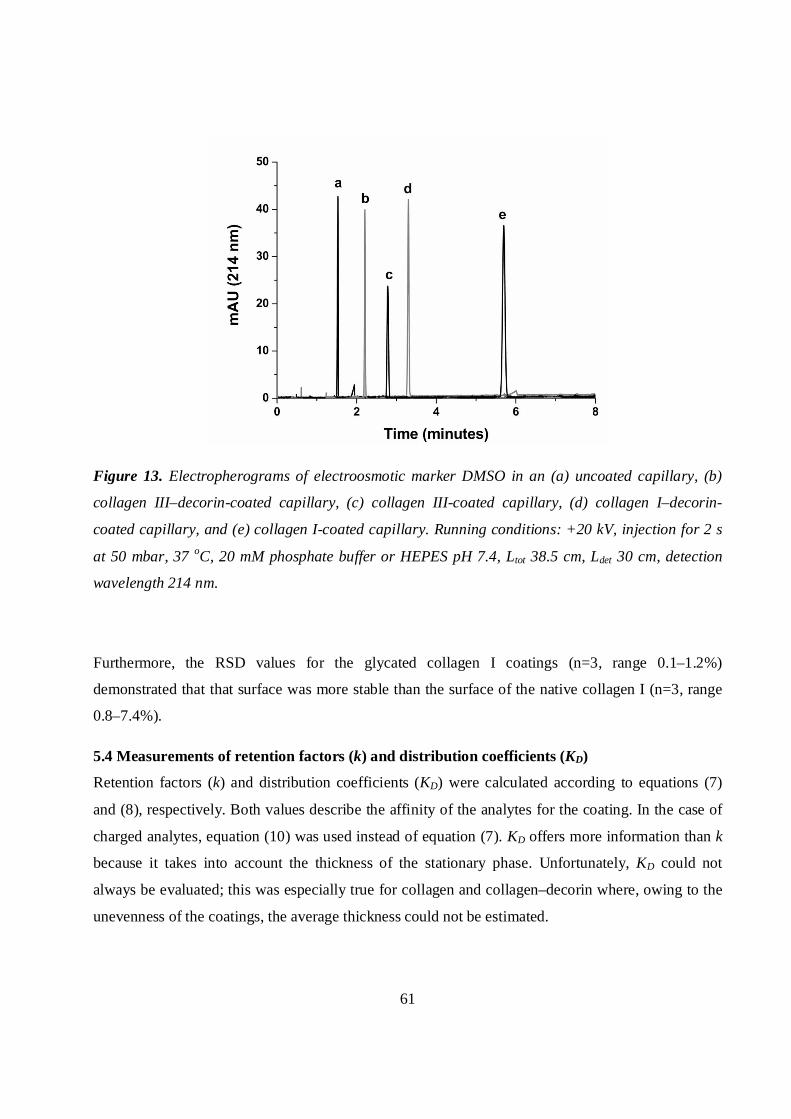
61
Figure 13. Electropherograms of electroosmotic marker DMSO in an (a) uncoated capillary, (b)
collagen III–decorin-coated capillary, (c) collagen III-coated capillary, (d) collagen I–decorin-
coated capillary, and (e) collagen I-coated capillary. Running conditions: +20 kV, injection for 2 s
at 50 mbar, 37 oC, 20 mM phosphate buffer or HEPES pH 7.4, Ltot 38.5 cm, Ldet 30 cm, detection
wavelength 214 nm.
Furthermore, the RSD values for the glycated collagen I coatings (n=3, range 0.1–1.2%)
demonstrated that that surface was more stable than the surface of the native collagen I (n=3, range
0.8–7.4%).
5.4 Measurements of retention factors (k) and distribution coefficients (KD)
Retention factors (k) and distribution coefficients (KD) were calculated according to equations (7)
and (8), respectively. Both values describe the affinity of the analytes for the coating. In the case of
charged analytes, equation (10) was used instead of equation (7). KD offers more information than k
because it takes into account the thickness of the stationary phase. Unfortunately, KD could not
always be evaluated; this was especially true for collagen and collagen–decorin where, owing to the
unevenness of the coatings, the average thickness could not be estimated.
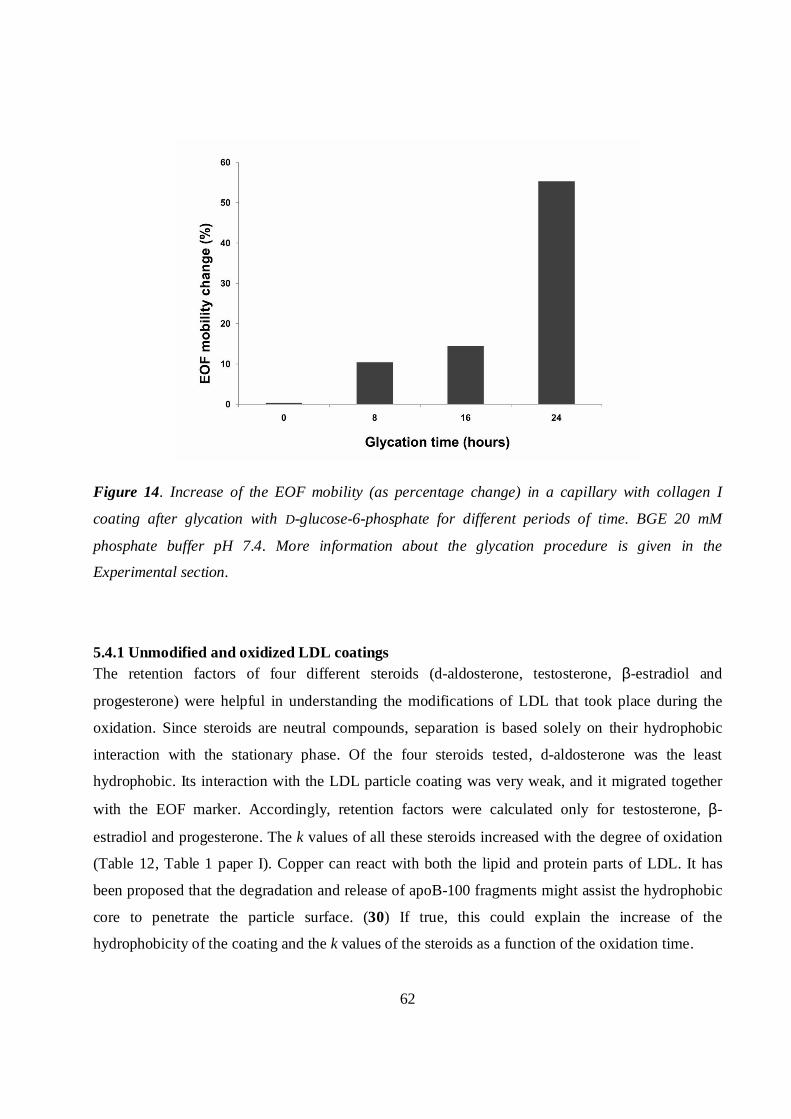
62
Figure 14. Increase of the EOF mobility (as percentage change) in a capillary with collagen I
coating after glycation with D-glucose-6-phosphate for different periods of time. BGE 20 mM
phosphate buffer pH 7.4. More information about the glycation procedure is given in the
Experimental section.
5.4.1 Unmodified and oxidized LDL coatingsThe retention factors of four different steroids (d-aldosterone, testosterone, β-estradiol and
progesterone) were helpful in understanding the modifications of LDL that took place during the
oxidation. Since steroids are neutral compounds, separation is based solely on their hydrophobic
interaction with the stationary phase. Of the four steroids tested, d-aldosterone was the least
hydrophobic. Its interaction with the LDL particle coating was very weak, and it migrated together
with the EOF marker. Accordingly, retention factors were calculated only for testosterone, β-
estradiol and progesterone. The k values of all these steroids increased with the degree of oxidation
(Table 12, Table 1 paper I). Copper can react with both the lipid and protein parts of LDL. It has
been proposed that the degradation and release of apoB-100 fragments might assist the hydrophobic
core to penetrate the particle surface. (30) If true, this could explain the increase of the
hydrophobicity of the coating and the k values of the steroids as a function of the oxidation time.
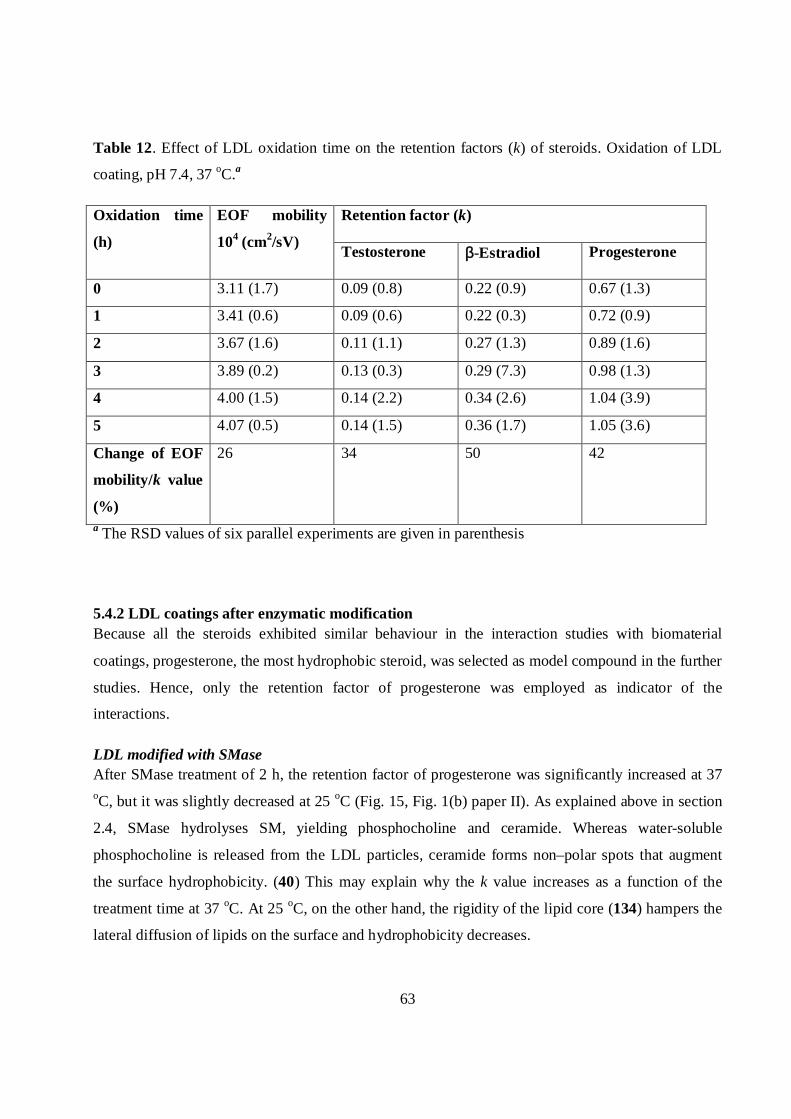
63
Table 12. Effect of LDL oxidation time on the retention factors (k) of steroids. Oxidation of LDL
coating, pH 7.4, 37 oC.a
Retention factor (k)Oxidation time
(h)
EOF mobility
104 (cm2/sV) Testosterone β-Estradiol Progesterone
0 3.11 (1.7) 0.09 (0.8) 0.22 (0.9) 0.67 (1.3)
1 3.41 (0.6) 0.09 (0.6) 0.22 (0.3) 0.72 (0.9)
2 3.67 (1.6) 0.11 (1.1) 0.27 (1.3) 0.89 (1.6)
3 3.89 (0.2) 0.13 (0.3) 0.29 (7.3) 0.98 (1.3)
4 4.00 (1.5) 0.14 (2.2) 0.34 (2.6) 1.04 (3.9)
5 4.07 (0.5) 0.14 (1.5) 0.36 (1.7) 1.05 (3.6)
Change of EOF
mobility/k value
(%)
26 34 50 42
a The RSD values of six parallel experiments are given in parenthesis
5.4.2 LDL coatings after enzymatic modificationBecause all the steroids exhibited similar behaviour in the interaction studies with biomaterial
coatings, progesterone, the most hydrophobic steroid, was selected as model compound in the further
studies. Hence, only the retention factor of progesterone was employed as indicator of the
interactions.
LDL modified with SMaseAfter SMase treatment of 2 h, the retention factor of progesterone was significantly increased at 37oC, but it was slightly decreased at 25 oC (Fig. 15, Fig. 1(b) paper II). As explained above in section
2.4, SMase hydrolyses SM, yielding phosphocholine and ceramide. Whereas water-soluble
phosphocholine is released from the LDL particles, ceramide forms non–polar spots that augment
the surface hydrophobicity. (40) This may explain why the k value increases as a function of the
treatment time at 37 oC. At 25 oC, on the other hand, the rigidity of the lipid core (134) hampers the
lateral diffusion of lipids on the surface and hydrophobicity decreases.
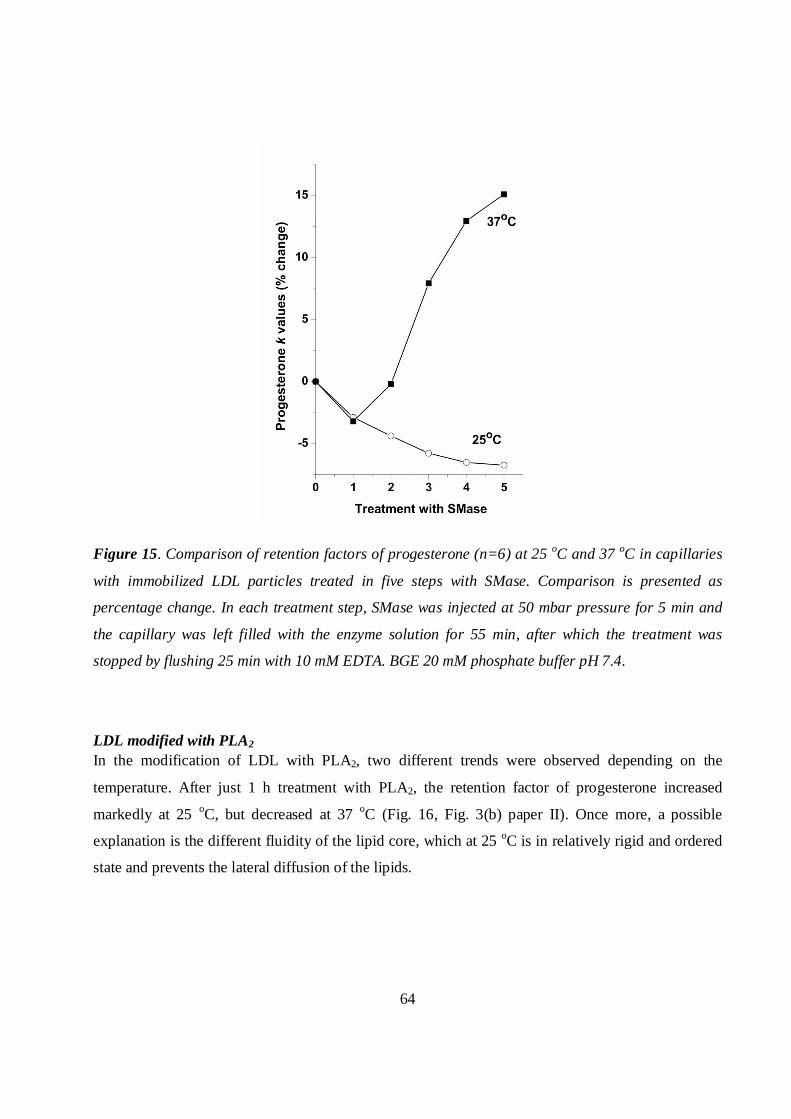
64
Figure 15. Comparison of retention factors of progesterone (n=6) at 25 oC and 37 oC in capillaries
with immobilized LDL particles treated in five steps with SMase. Comparison is presented as
percentage change. In each treatment step, SMase was injected at 50 mbar pressure for 5 min and
the capillary was left filled with the enzyme solution for 55 min, after which the treatment was
stopped by flushing 25 min with 10 mM EDTA. BGE 20 mM phosphate buffer pH 7.4.
LDL modified with PLA2
In the modification of LDL with PLA2, two different trends were observed depending on the
temperature. After just 1 h treatment with PLA2, the retention factor of progesterone increased
markedly at 25 oC, but decreased at 37 oC (Fig. 16, Fig. 3(b) paper II). Once more, a possible
explanation is the different fluidity of the lipid core, which at 25 oC is in relatively rigid and ordered
state and prevents the lateral diffusion of the lipids.
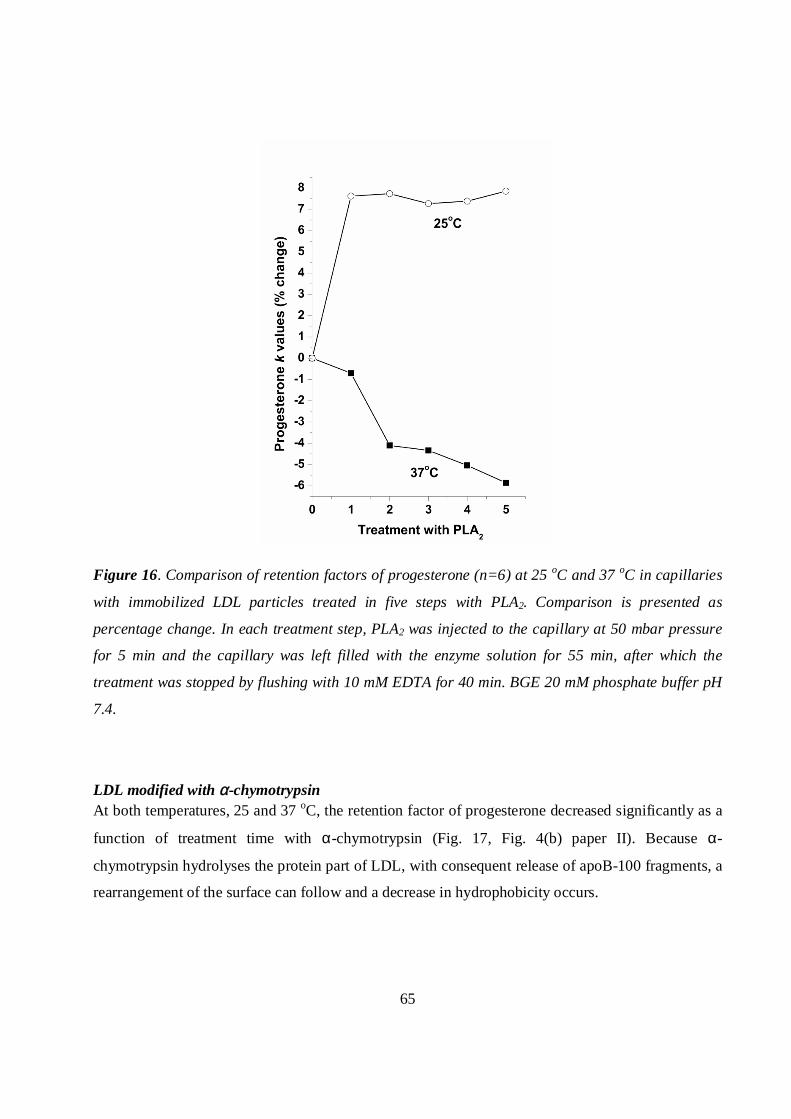
65
Figure 16. Comparison of retention factors of progesterone (n=6) at 25 oC and 37 oC in capillaries
with immobilized LDL particles treated in five steps with PLA2. Comparison is presented as
percentage change. In each treatment step, PLA2 was injected to the capillary at 50 mbar pressure
for 5 min and the capillary was left filled with the enzyme solution for 55 min, after which the
treatment was stopped by flushing with 10 mM EDTA for 40 min. BGE 20 mM phosphate buffer pH
7.4.
LDL modified with α-chymotrypsinAt both temperatures, 25 and 37 oC, the retention factor of progesterone decreased significantly as a
function of treatment time with α-chymotrypsin (Fig. 17, Fig. 4(b) paper II). Because α-
chymotrypsin hydrolyses the protein part of LDL, with consequent release of apoB-100 fragments, a
rearrangement of the surface can follow and a decrease in hydrophobicity occurs.
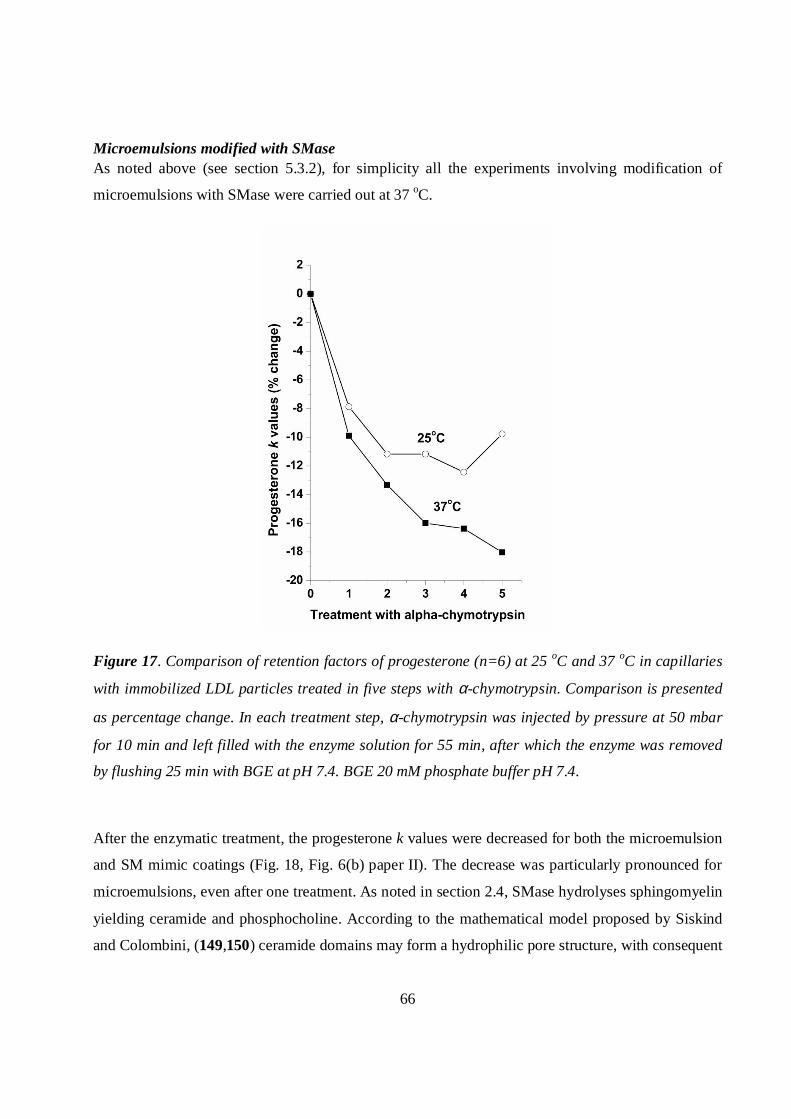
66
Microemulsions modified with SMaseAs noted above (see section 5.3.2), for simplicity all the experiments involving modification of
microemulsions with SMase were carried out at 37 oC.
Figure 17. Comparison of retention factors of progesterone (n=6) at 25 oC and 37 oC in capillaries
with immobilized LDL particles treated in five steps with α-chymotrypsin. Comparison is presented
as percentage change. In each treatment step, α-chymotrypsin was injected by pressure at 50 mbar
for 10 min and left filled with the enzyme solution for 55 min, after which the enzyme was removed
by flushing 25 min with BGE at pH 7.4. BGE 20 mM phosphate buffer pH 7.4.
After the enzymatic treatment, the progesterone k values were decreased for both the microemulsion
and SM mimic coatings (Fig. 18, Fig. 6(b) paper II). The decrease was particularly pronounced for
microemulsions, even after one treatment. As noted in section 2.4, SMase hydrolyses sphingomyelin
yielding ceramide and phosphocholine. According to the mathematical model proposed by Siskind
and Colombini, (149,150) ceramide domains may form a hydrophilic pore structure, with consequent
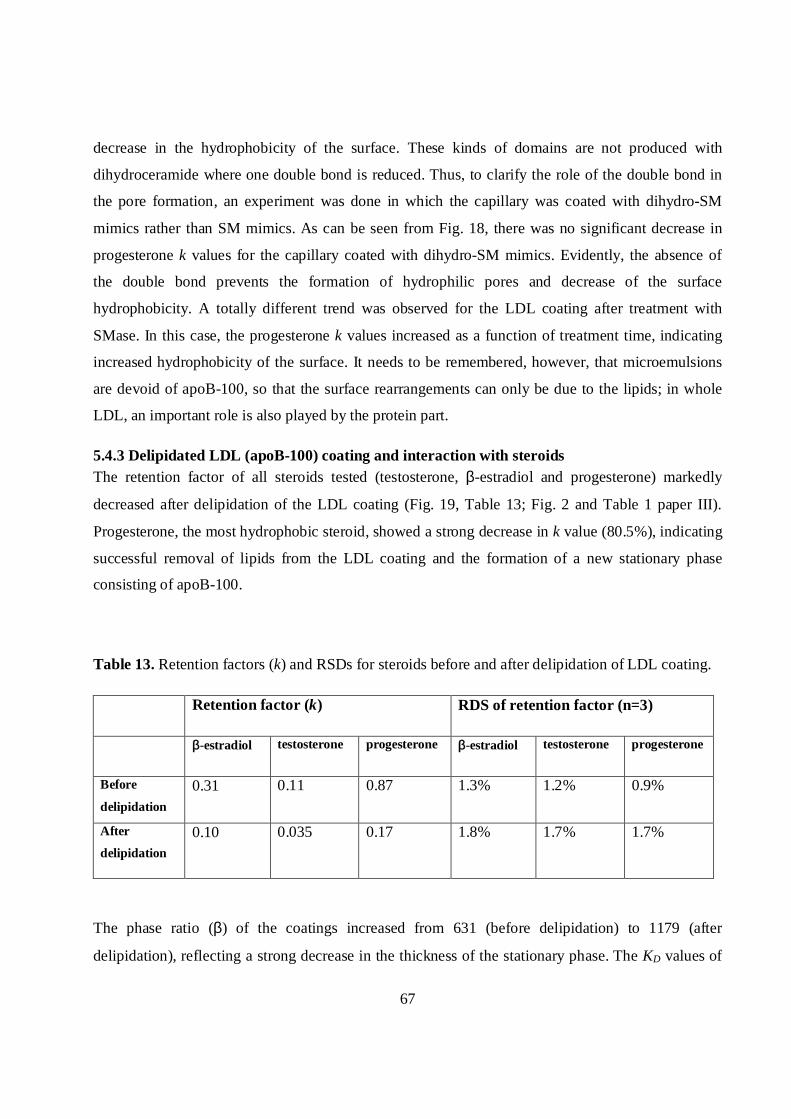
67
decrease in the hydrophobicity of the surface. These kinds of domains are not produced with
dihydroceramide where one double bond is reduced. Thus, to clarify the role of the double bond in
the pore formation, an experiment was done in which the capillary was coated with dihydro-SM
mimics rather than SM mimics. As can be seen from Fig. 18, there was no significant decrease in
progesterone k values for the capillary coated with dihydro-SM mimics. Evidently, the absence of
the double bond prevents the formation of hydrophilic pores and decrease of the surface
hydrophobicity. A totally different trend was observed for the LDL coating after treatment with
SMase. In this case, the progesterone k values increased as a function of treatment time, indicating
increased hydrophobicity of the surface. It needs to be remembered, however, that microemulsions
are devoid of apoB-100, so that the surface rearrangements can only be due to the lipids; in whole
LDL, an important role is also played by the protein part.
5.4.3 Delipidated LDL (apoB-100) coating and interaction with steroidsThe retention factor of all steroids tested (testosterone, β-estradiol and progesterone) markedly
decreased after delipidation of the LDL coating (Fig. 19, Table 13; Fig. 2 and Table 1 paper III).
Progesterone, the most hydrophobic steroid, showed a strong decrease in k value (80.5%), indicating
successful removal of lipids from the LDL coating and the formation of a new stationary phase
consisting of apoB-100.
Table 13. Retention factors (k) and RSDs for steroids before and after delipidation of LDL coating.
Retention factor (k) RDS of retention factor (n=3)
β-estradiol testosterone progesterone β-estradiol testosterone progesterone
Before
delipidation0.31 0.11 0.87 1.3% 1.2% 0.9%
After
delipidation0.10 0.035 0.17 1.8% 1.7% 1.7%
The phase ratio (β) of the coatings increased from 631 (before delipidation) to 1179 (after
delipidation), reflecting a strong decrease in the thickness of the stationary phase. The KD values of
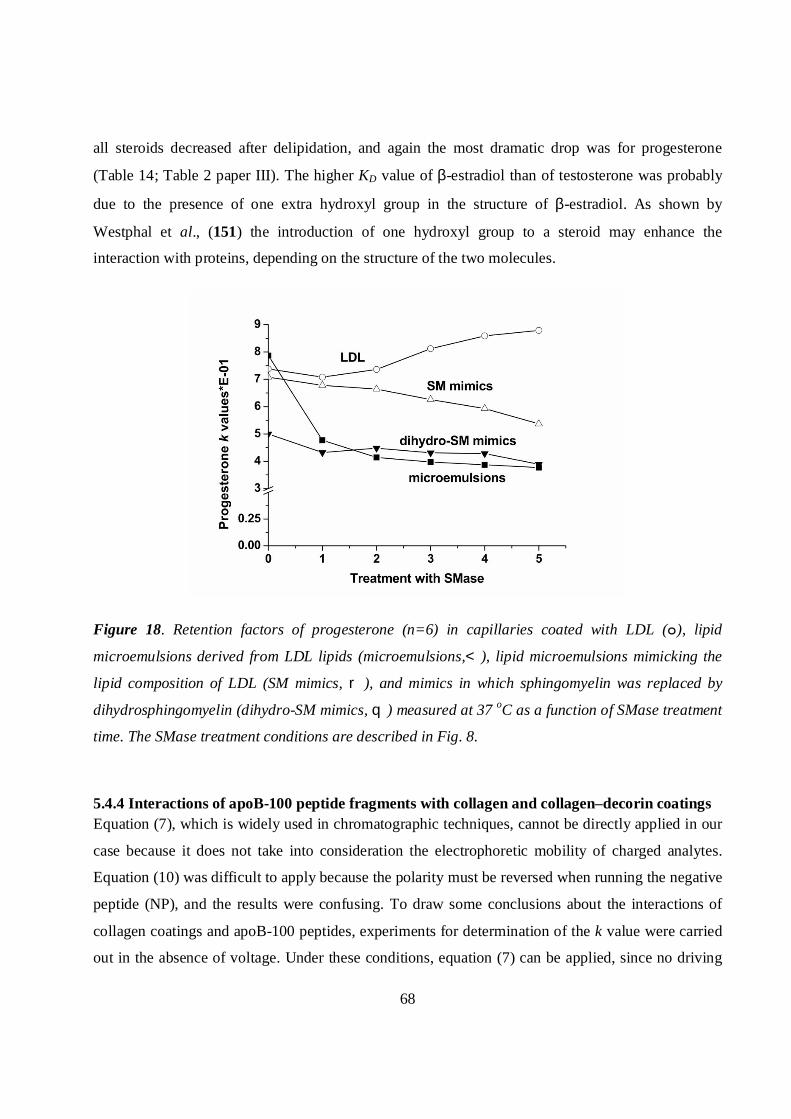
68
all steroids decreased after delipidation, and again the most dramatic drop was for progesterone
(Table 14; Table 2 paper III). The higher KD value of β-estradiol than of testosterone was probably
due to the presence of one extra hydroxyl group in the structure of β-estradiol. As shown by
Westphal et al., (151) the introduction of one hydroxyl group to a steroid may enhance the
interaction with proteins, depending on the structure of the two molecules.
Figure 18. Retention factors of progesterone (n=6) in capillaries coated with LDL ( ), lipid
microemulsions derived from LDL lipids (microemulsions,<), lipid microemulsions mimicking the
lipid composition of LDL (SM mimics, r), and mimics in which sphingomyelin was replaced by
dihydrosphingomyelin (dihydro-SM mimics,q) measured at 37 oC as a function of SMase treatment
time. The SMase treatment conditions are described in Fig. 8.
5.4.4 Interactions of apoB-100 peptide fragments with collagen and collagen–decorin coatingsEquation (7), which is widely used in chromatographic techniques, cannot be directly applied in our
case because it does not take into consideration the electrophoretic mobility of charged analytes.
Equation (10) was difficult to apply because the polarity must be reversed when running the negative
peptide (NP), and the results were confusing. To draw some conclusions about the interactions of
collagen coatings and apoB-100 peptides, experiments for determination of the k value were carried
out in the absence of voltage. Under these conditions, equation (7) can be applied, since no driving
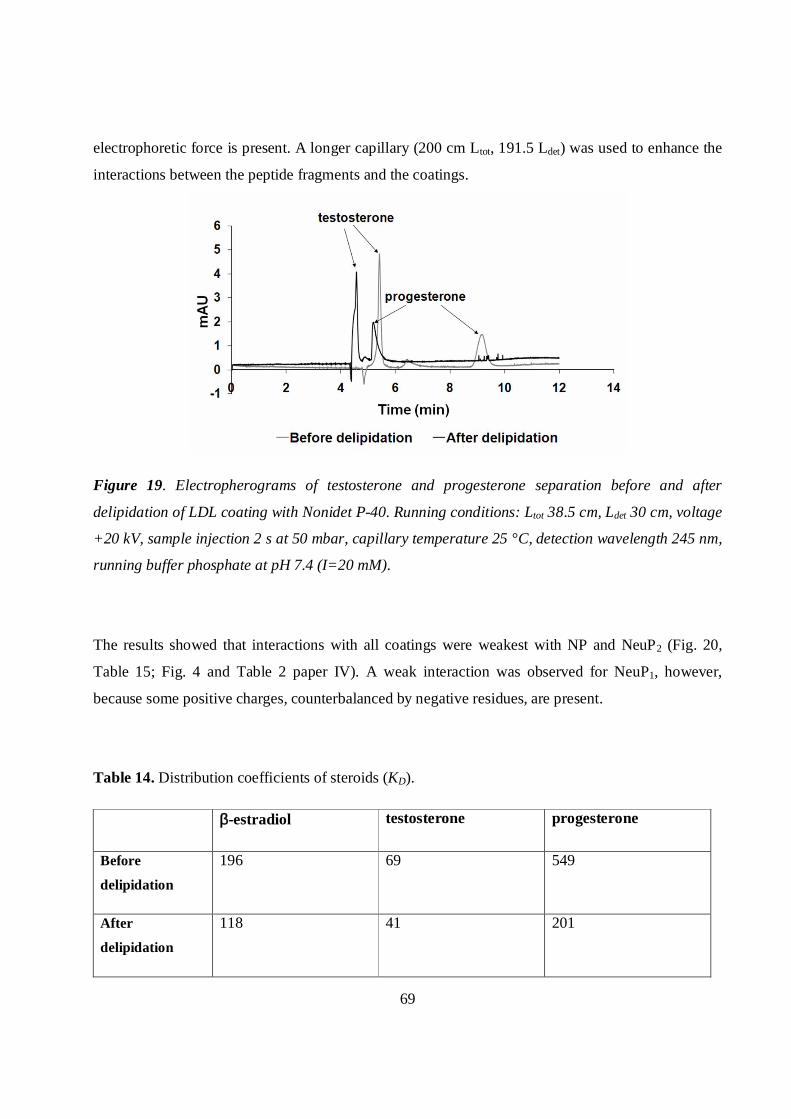
69
electrophoretic force is present. A longer capillary (200 cm Ltot, 191.5 Ldet) was used to enhance the
interactions between the peptide fragments and the coatings.
Figure 19. Electropherograms of testosterone and progesterone separation before and after
delipidation of LDL coating with Nonidet P-40. Running conditions: Ltot 38.5 cm, Ldet 30 cm, voltage
+20 kV, sample injection 2 s at 50 mbar, capillary temperature 25 °C, detection wavelength 245 nm,
running buffer phosphate at pH 7.4 (I=20 mM).
The results showed that interactions with all coatings were weakest with NP and NeuP2 (Fig. 20,
Table 15; Fig. 4 and Table 2 paper IV). A weak interaction was observed for NeuP1, however,
because some positive charges, counterbalanced by negative residues, are present.
Table 14. Distribution coefficients of steroids (KD).
β-estradiol testosterone progesterone
Before
delipidation
196 69 549
After
delipidation
118 41 201
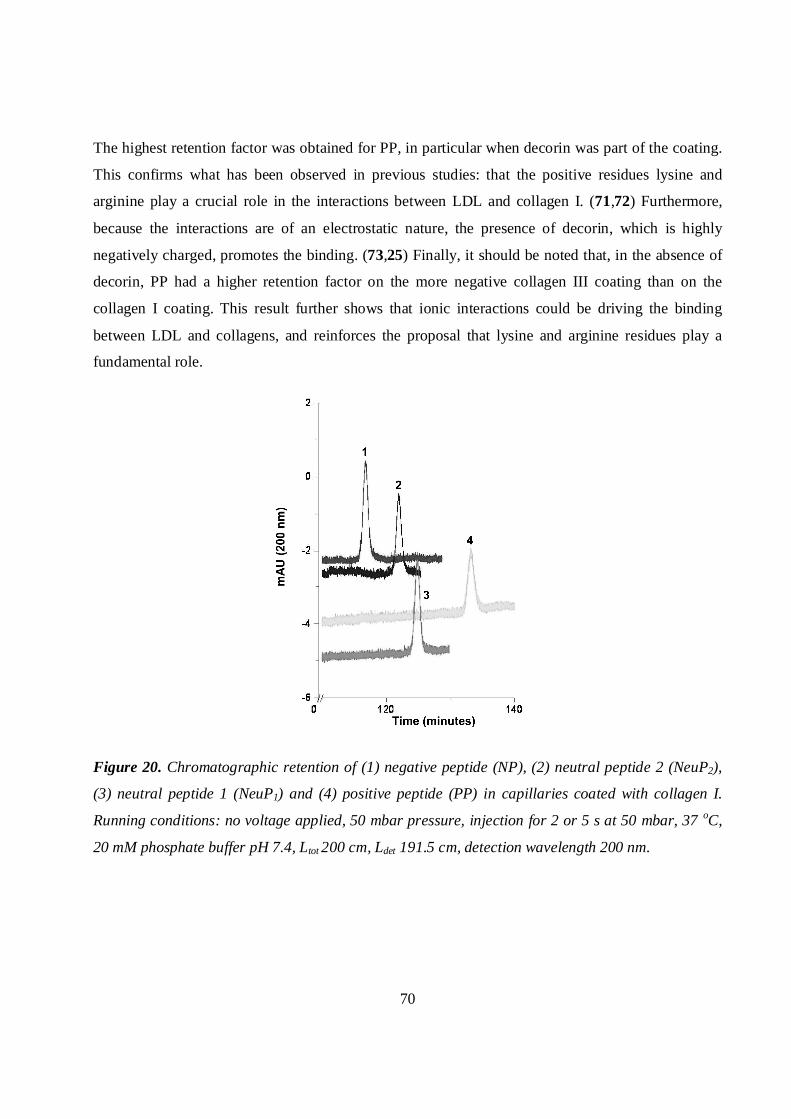
70
The highest retention factor was obtained for PP, in particular when decorin was part of the coating.
This confirms what has been observed in previous studies: that the positive residues lysine and
arginine play a crucial role in the interactions between LDL and collagen I. (71,72) Furthermore,
because the interactions are of an electrostatic nature, the presence of decorin, which is highly
negatively charged, promotes the binding. (73,25) Finally, it should be noted that, in the absence of
decorin, PP had a higher retention factor on the more negative collagen III coating than on the
collagen I coating. This result further shows that ionic interactions could be driving the binding
between LDL and collagens, and reinforces the proposal that lysine and arginine residues play a
fundamental role.
Figure 20. Chromatographic retention of (1) negative peptide (NP), (2) neutral peptide 2 (NeuP2),
(3) neutral peptide 1 (NeuP1) and (4) positive peptide (PP) in capillaries coated with collagen I.
Running conditions: no voltage applied, 50 mbar pressure, injection for 2 or 5 s at 50 mbar, 37 oC,
20 mM phosphate buffer pH 7.4, Ltot 200 cm, Ldet 191.5 cm, detection wavelength 200 nm.
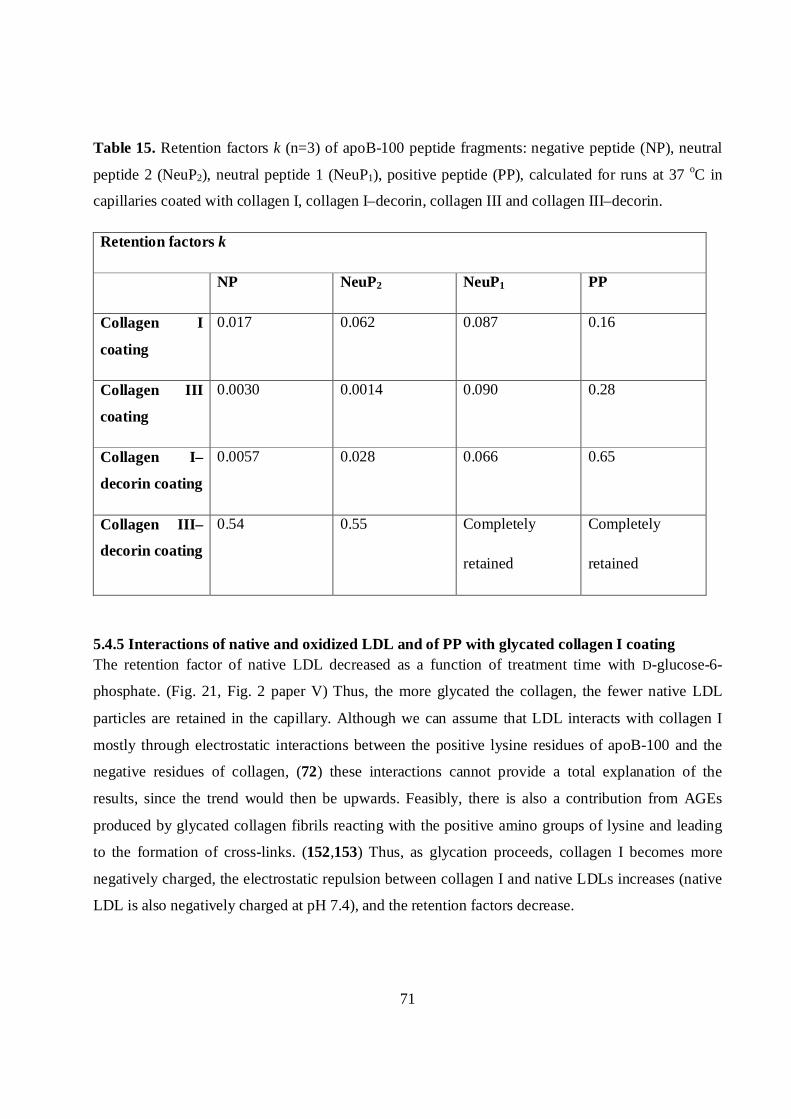
71
Table 15. Retention factors k (n=3) of apoB-100 peptide fragments: negative peptide (NP), neutral
peptide 2 (NeuP2), neutral peptide 1 (NeuP1), positive peptide (PP), calculated for runs at 37 oC in
capillaries coated with collagen I, collagen I–decorin, collagen III and collagen III–decorin.
Retention factors k
NP NeuP2 NeuP1 PP
Collagen I
coating
0.017 0.062 0.087 0.16
Collagen III
coating
0.0030 0.0014 0.090 0.28
Collagen I–
decorin coating
0.0057 0.028 0.066 0.65
Collagen III–
decorin coating
0.54 0.55 Completely
retained
Completely
retained
5.4.5 Interactions of native and oxidized LDL and of PP with glycated collagen I coatingThe retention factor of native LDL decreased as a function of treatment time with D-glucose-6-
phosphate. (Fig. 21, Fig. 2 paper V) Thus, the more glycated the collagen, the fewer native LDL
particles are retained in the capillary. Although we can assume that LDL interacts with collagen I
mostly through electrostatic interactions between the positive lysine residues of apoB-100 and the
negative residues of collagen, (72) these interactions cannot provide a total explanation of the
results, since the trend would then be upwards. Feasibly, there is also a contribution from AGEs
produced by glycated collagen fibrils reacting with the positive amino groups of lysine and leading
to the formation of cross-links. (152,153) Thus, as glycation proceeds, collagen I becomes more
negatively charged, the electrostatic repulsion between collagen I and native LDLs increases (native
LDL is also negatively charged at pH 7.4), and the retention factors decrease.
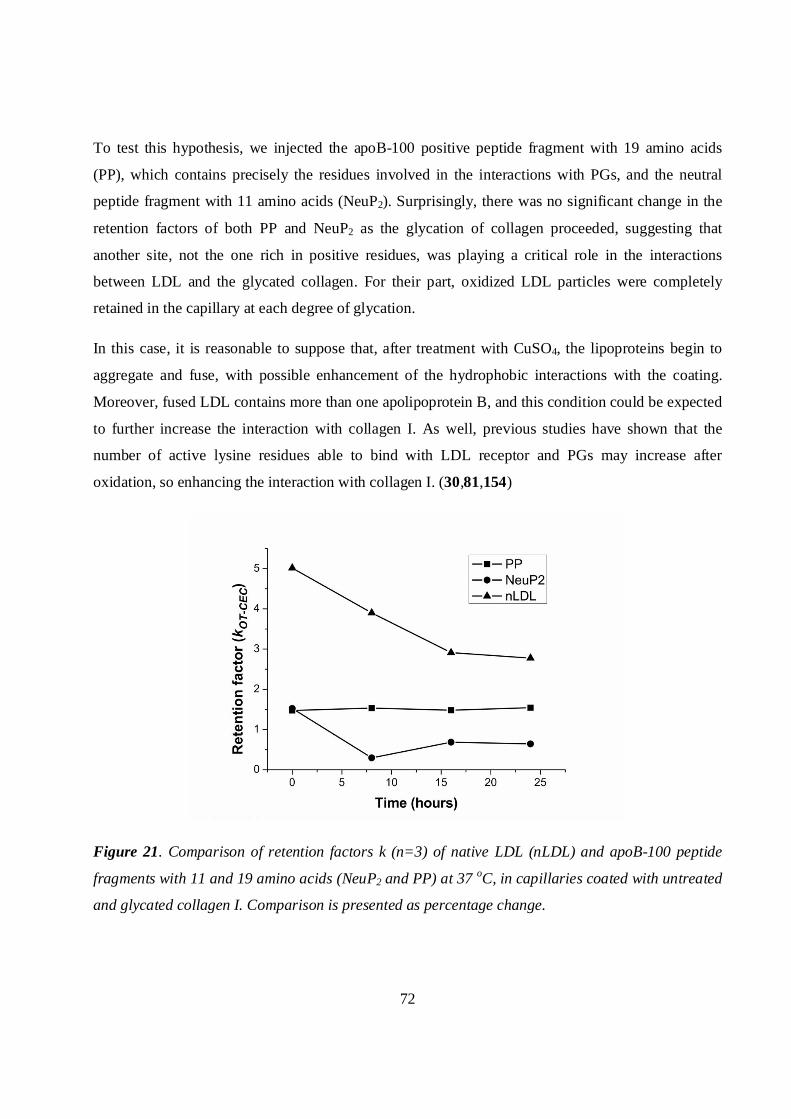
72
To test this hypothesis, we injected the apoB-100 positive peptide fragment with 19 amino acids
(PP), which contains precisely the residues involved in the interactions with PGs, and the neutral
peptide fragment with 11 amino acids (NeuP2). Surprisingly, there was no significant change in the
retention factors of both PP and NeuP2 as the glycation of collagen proceeded, suggesting that
another site, not the one rich in positive residues, was playing a critical role in the interactions
between LDL and the glycated collagen. For their part, oxidized LDL particles were completely
retained in the capillary at each degree of glycation.
In this case, it is reasonable to suppose that, after treatment with CuSO4, the lipoproteins begin to
aggregate and fuse, with possible enhancement of the hydrophobic interactions with the coating.
Moreover, fused LDL contains more than one apolipoprotein B, and this condition could be expected
to further increase the interaction with collagen I. As well, previous studies have shown that the
number of active lysine residues able to bind with LDL receptor and PGs may increase after
oxidation, so enhancing the interaction with collagen I. (30,81,154)
Figure 21. Comparison of retention factors k (n=3) of native LDL (nLDL) and apoB-100 peptide
fragments with 11 and 19 amino acids (NeuP2 and PP) at 37 oC, in capillaries coated with untreated
and glycated collagen I. Comparison is presented as percentage change.
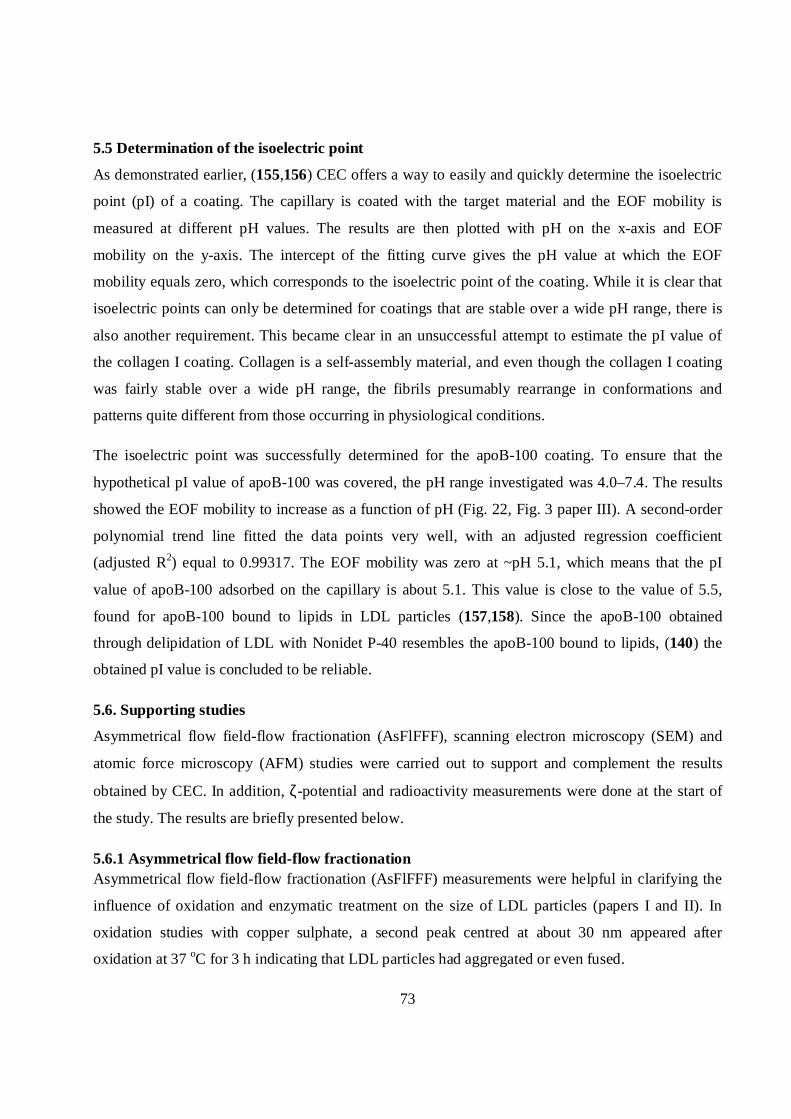
73
5.5 Determination of the isoelectric point
As demonstrated earlier, (155,156) CEC offers a way to easily and quickly determine the isoelectric
point (pI) of a coating. The capillary is coated with the target material and the EOF mobility is
measured at different pH values. The results are then plotted with pH on the x-axis and EOF
mobility on the y-axis. The intercept of the fitting curve gives the pH value at which the EOF
mobility equals zero, which corresponds to the isoelectric point of the coating. While it is clear that
isoelectric points can only be determined for coatings that are stable over a wide pH range, there is
also another requirement. This became clear in an unsuccessful attempt to estimate the pI value of
the collagen I coating. Collagen is a self-assembly material, and even though the collagen I coating
was fairly stable over a wide pH range, the fibrils presumably rearrange in conformations and
patterns quite different from those occurring in physiological conditions.
The isoelectric point was successfully determined for the apoB-100 coating. To ensure that the
hypothetical pI value of apoB-100 was covered, the pH range investigated was 4.0–7.4. The results
showed the EOF mobility to increase as a function of pH (Fig. 22, Fig. 3 paper III). A second-order
polynomial trend line fitted the data points very well, with an adjusted regression coefficient
(adjusted R2) equal to 0.99317. The EOF mobility was zero at ~pH 5.1, which means that the pI
value of apoB-100 adsorbed on the capillary is about 5.1. This value is close to the value of 5.5,
found for apoB-100 bound to lipids in LDL particles (157,158). Since the apoB-100 obtained
through delipidation of LDL with Nonidet P-40 resembles the apoB-100 bound to lipids, (140) the
obtained pI value is concluded to be reliable.
5.6. Supporting studies
Asymmetrical flow field-flow fractionation (AsFlFFF), scanning electron microscopy (SEM) and
atomic force microscopy (AFM) studies were carried out to support and complement the results
obtained by CEC. In addition, ζ-potential and radioactivity measurements were done at the start of
the study. The results are briefly presented below.
5.6.1 Asymmetrical flow field-flow fractionationAsymmetrical flow field-flow fractionation (AsFlFFF) measurements were helpful in clarifying the
influence of oxidation and enzymatic treatment on the size of LDL particles (papers I and II). In
oxidation studies with copper sulphate, a second peak centred at about 30 nm appeared after
oxidation at 37 oC for 3 h indicating that LDL particles had aggregated or even fused.
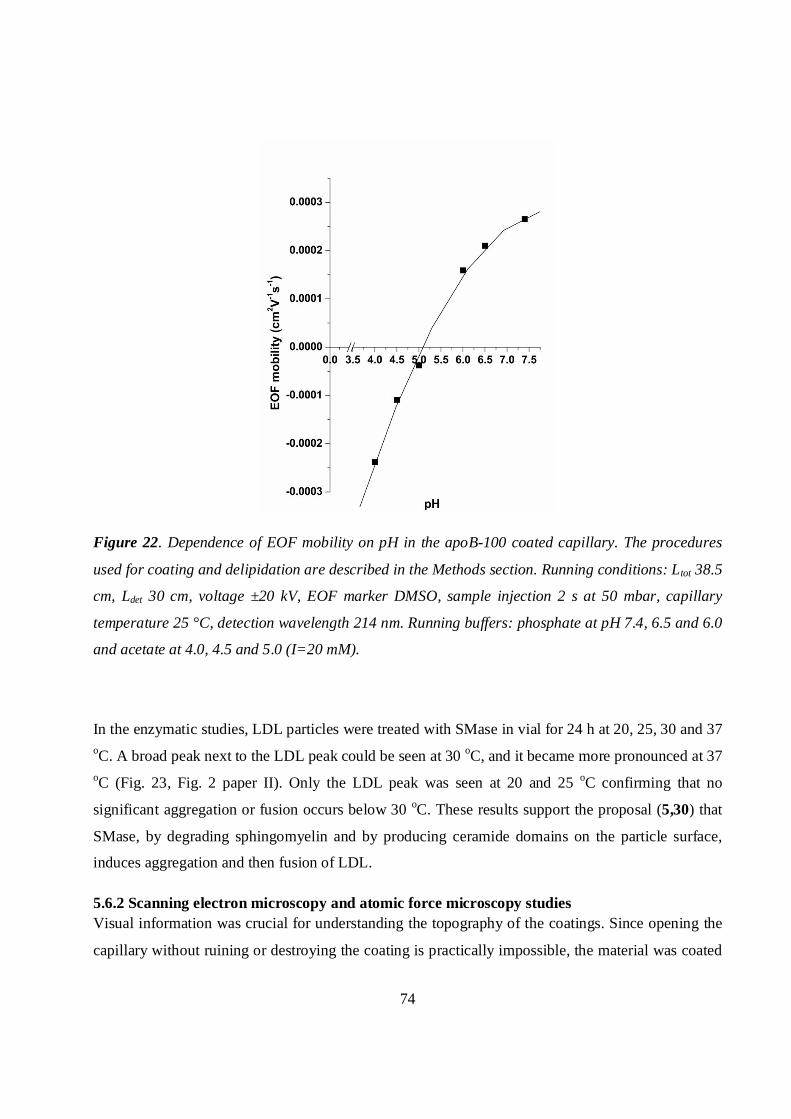
74
Figure 22. Dependence of EOF mobility on pH in the apoB-100 coated capillary. The procedures
used for coating and delipidation are described in the Methods section. Running conditions: Ltot 38.5
cm, Ldet 30 cm, voltage ±20 kV, EOF marker DMSO, sample injection 2 s at 50 mbar, capillary
temperature 25 °C, detection wavelength 214 nm. Running buffers: phosphate at pH 7.4, 6.5 and 6.0
and acetate at 4.0, 4.5 and 5.0 (I=20 mM).
In the enzymatic studies, LDL particles were treated with SMase in vial for 24 h at 20, 25, 30 and 37oC. A broad peak next to the LDL peak could be seen at 30 oC, and it became more pronounced at 37oC (Fig. 23, Fig. 2 paper II). Only the LDL peak was seen at 20 and 25 oC confirming that no
significant aggregation or fusion occurs below 30 oC. These results support the proposal (5,30) that
SMase, by degrading sphingomyelin and by producing ceramide domains on the particle surface,
induces aggregation and then fusion of LDL.
5.6.2 Scanning electron microscopy and atomic force microscopy studiesVisual information was crucial for understanding the topography of the coatings. Since opening the
capillary without ruining or destroying the coating is practically impossible, the material was coated
75
on the outside of the silica capillary, and SEM and AFM images were recorded from the outer
surface (see Experimental).
Figure 23. Particle size distributions measured by AsFlFFF for LDL particles treated with SMase at
pH 7.4. The incubations were carried out at various temperatures for 24 h (A) LDL 25 oC, (B) LDL-
SMase 25 oC, (C) LDL-SMase 30 oC, and (D) LDL-Smase 37 oC. Carrier solution: 8.5 mM
phosphate buffer, 0.02% NaN3, 150 mM NaCl, pH 7.4, I 20 mM due to buffer. Relaxation focusing:
frontal flow rate 0.1 mL min-1, flow inward from outlet 3.2 mL min-1, injection 1.0 mL min-1for 5 min,
relaxation time 12 min. Flow rates during elution: 1.0 and 2.0 mL min-1 for the main and cross-flow
rates; UV detection at 280 nm.
Scanning electron microscopySEM was used to obtain images of the LDL coating on the silica wall (paper I). Appreciable
differences were noticed between the coated and uncoated capillaries, but the resolution was too low
to determine the number of particles bound. Radioactivity measurements were employed to
determine the number of particles (see section 5.6.4).
76
Atomic force microscopyAFM was employed to obtain visual information about LDL, apoB-100, collagen, collagen–decorin
and glycated collagen I coatings (papers III, IV, V).
Atomic force microscopy images of LDL and apoB-100 coatings
For study of LDL and apoB-100 coatings (paper III), three different capillaries were coated on the
outside and the coating was delipidated according to the procedure described in the Experimental
section. The surfaces examined were a) an LDL-coated capillary, b) a delipidated LDL (apoB-100)-
coated capillary, c) and d) an apoB-100-coated capillary after treatment with NaOH (Fig. 24, Fig. 4
paper III). Figure 24a shows a 4x4 µm area coated with particles of fairly broad size distribution.
The calculated average thickness of the coating was 19.8±2.3 nm, which is close to the average
diameter of LDL. Figure 24b shows a 4x4 µm area coated with particles of smaller average size than
particles of LDL. The average thickness was just 10.6±0.9 nm. This reduction in thickness supports
the conclusion that delipidation of LDL particles results in a successful apoB-100 coating. In the
experiments corresponding to Fig. 24c (height image) and 24d (phase image), capillaries were rinsed
with NaOH to remove the apoB-100 coating obtained via the delipidation. A few features of average
height 4.3±0.4 nm were still present after NaOH rinsing.
Atomic force microscopy images of collagen and collagen–decorin coatings
As shown in Fig. 25 (Fig. 3 paper IV), 2D-AFM images were recorded for collagen I (a), collagen I-
decorin (b) and collagen III (c). Again, the outside of the capillary was coated as described in the
Experimental section. Fibrils in the collagen I and collagen III images vary in thickness and are
randomly distributed on the silica surface. Collagen III fibrils appear to be much thinner than those
of collagen I. The higher hydrophilicity of collagen III than of collagen I (108) may explain the
different degree of coverage on the hydrophobic fused silica. As can be seen in Fig. 25b, when
decorin is part of the coating, the fibrils are thinner and the coating more even. According to some
previous studies, decorin takes part in the collagen monomer assembly and prevents lateral fusion of
the fibrils. (50,51,141)
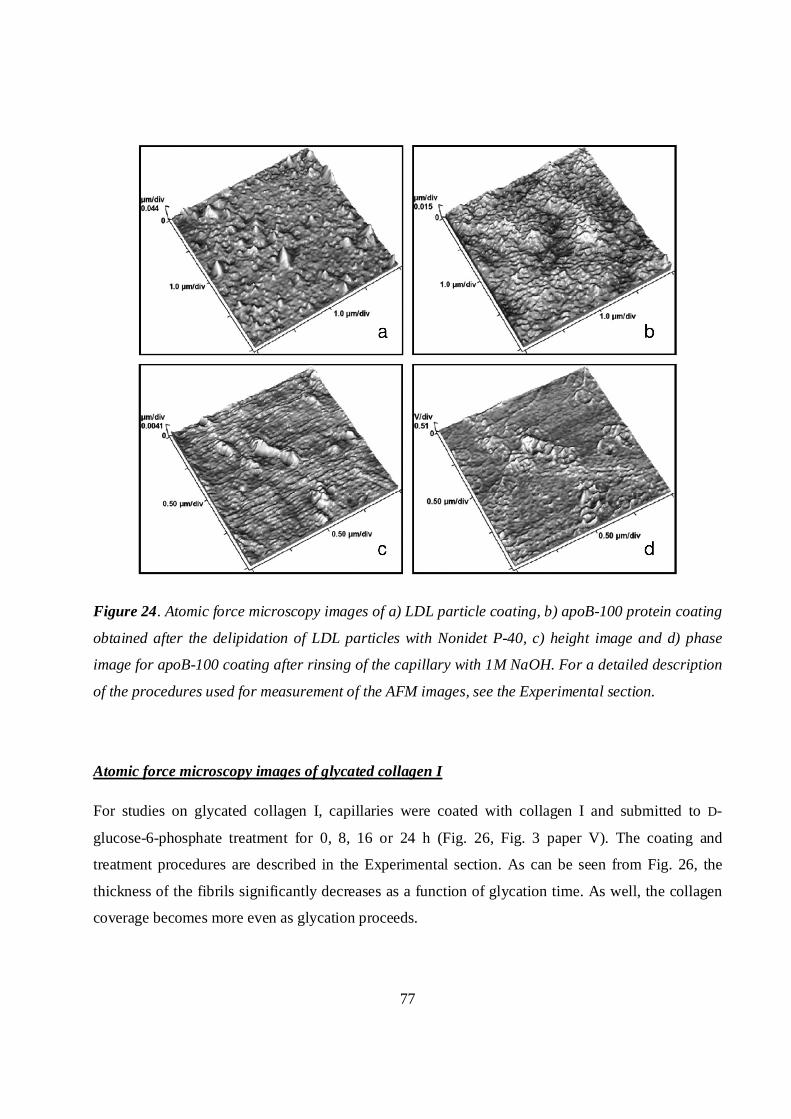
77
Figure 24. Atomic force microscopy images of a) LDL particle coating, b) apoB-100 protein coating
obtained after the delipidation of LDL particles with Nonidet P-40, c) height image and d) phase
image for apoB-100 coating after rinsing of the capillary with 1M NaOH. For a detailed description
of the procedures used for measurement of the AFM images, see the Experimental section.
Atomic force microscopy images of glycated collagen I
For studies on glycated collagen I, capillaries were coated with collagen I and submitted to D-
glucose-6-phosphate treatment for 0, 8, 16 or 24 h (Fig. 26, Fig. 3 paper V). The coating and
treatment procedures are described in the Experimental section. As can be seen from Fig. 26, the
thickness of the fibrils significantly decreases as a function of glycation time. As well, the collagen
coverage becomes more even as glycation proceeds.
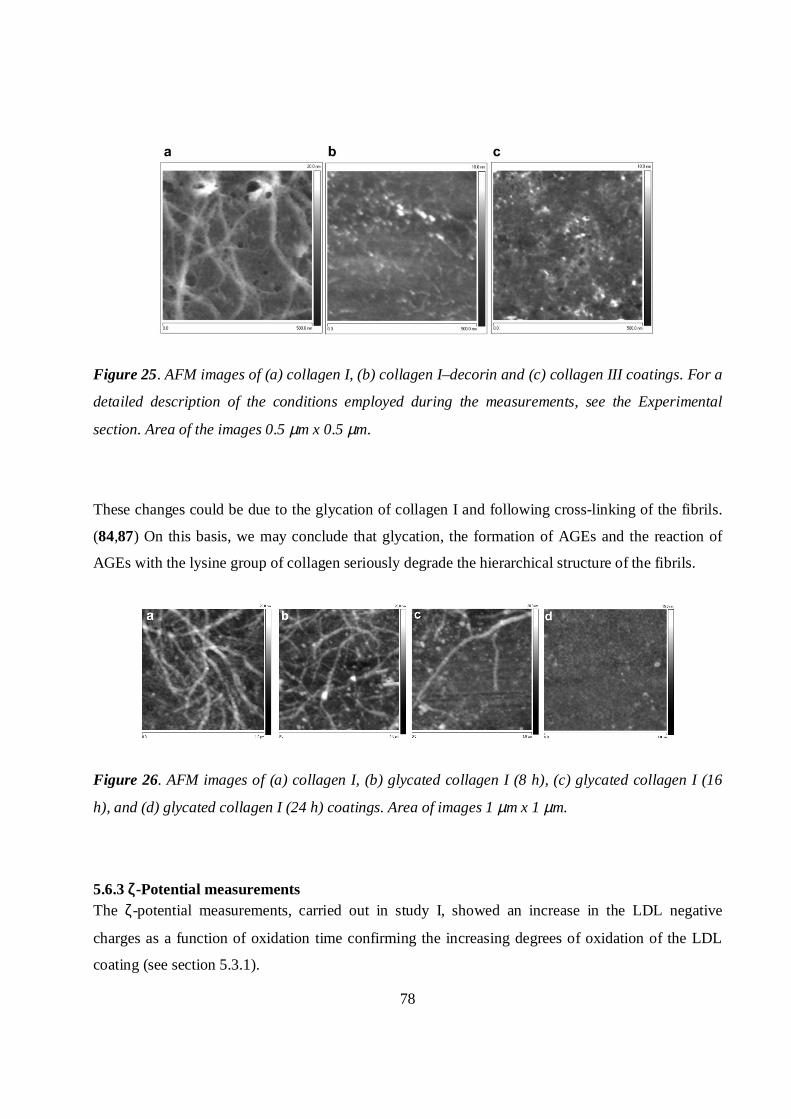
78
Figure 25. AFM images of (a) collagen I, (b) collagen I–decorin and (c) collagen III coatings. For a
detailed description of the conditions employed during the measurements, see the Experimental
section. Area of the images 0.5 µm x 0.5 µm.
These changes could be due to the glycation of collagen I and following cross-linking of the fibrils.
(84,87) On this basis, we may conclude that glycation, the formation of AGEs and the reaction of
AGEs with the lysine group of collagen seriously degrade the hierarchical structure of the fibrils.
Figure 26. AFM images of (a) collagen I, (b) glycated collagen I (8 h), (c) glycated collagen I (16
h), and (d) glycated collagen I (24 h) coatings. Area of images 1 µm x 1 µm.
5.6.3 ζ-Potential measurementsThe ζ-potential measurements, carried out in study I, showed an increase in the LDL negative
charges as a function of oxidation time confirming the increasing degrees of oxidation of the LDL
coating (see section 5.3.1).
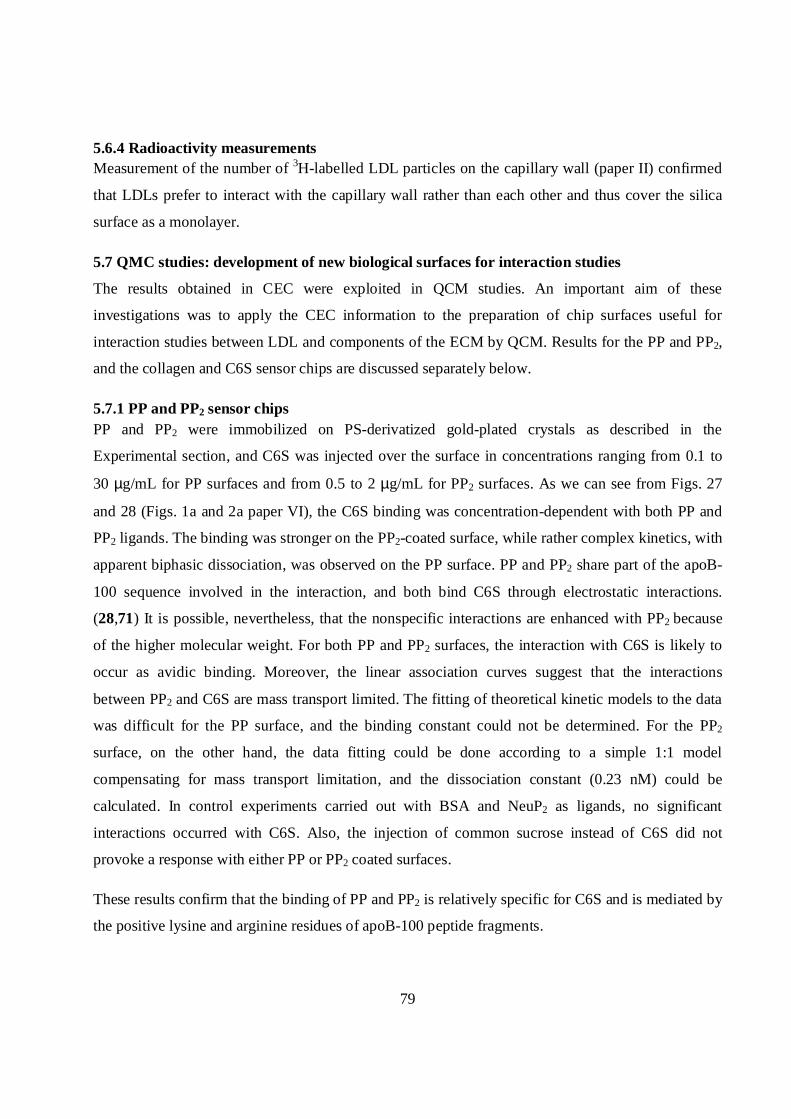
79
5.6.4 Radioactivity measurementsMeasurement of the number of 3H-labelled LDL particles on the capillary wall (paper II) confirmed
that LDLs prefer to interact with the capillary wall rather than each other and thus cover the silica
surface as a monolayer.
5.7 QMC studies: development of new biological surfaces for interaction studies
The results obtained in CEC were exploited in QCM studies. An important aim of these
investigations was to apply the CEC information to the preparation of chip surfaces useful for
interaction studies between LDL and components of the ECM by QCM. Results for the PP and PP2,
and the collagen and C6S sensor chips are discussed separately below.
5.7.1 PP and PP2 sensor chipsPP and PP2 were immobilized on PS-derivatized gold-plated crystals as described in the
Experimental section, and C6S was injected over the surface in concentrations ranging from 0.1 to
30 µg/mL for PP surfaces and from 0.5 to 2 µg/mL for PP2 surfaces. As we can see from Figs. 27
and 28 (Figs. 1a and 2a paper VI), the C6S binding was concentration-dependent with both PP and
PP2 ligands. The binding was stronger on the PP2-coated surface, while rather complex kinetics, with
apparent biphasic dissociation, was observed on the PP surface. PP and PP2 share part of the apoB-
100 sequence involved in the interaction, and both bind C6S through electrostatic interactions.
(28,71) It is possible, nevertheless, that the nonspecific interactions are enhanced with PP2 because
of the higher molecular weight. For both PP and PP2 surfaces, the interaction with C6S is likely to
occur as avidic binding. Moreover, the linear association curves suggest that the interactions
between PP2 and C6S are mass transport limited. The fitting of theoretical kinetic models to the data
was difficult for the PP surface, and the binding constant could not be determined. For the PP2
surface, on the other hand, the data fitting could be done according to a simple 1:1 model
compensating for mass transport limitation, and the dissociation constant (0.23 nM) could be
calculated. In control experiments carried out with BSA and NeuP2 as ligands, no significant
interactions occurred with C6S. Also, the injection of common sucrose instead of C6S did not
provoke a response with either PP or PP2 coated surfaces.
These results confirm that the binding of PP and PP2 is relatively specific for C6S and is mediated by
the positive lysine and arginine residues of apoB-100 peptide fragments.
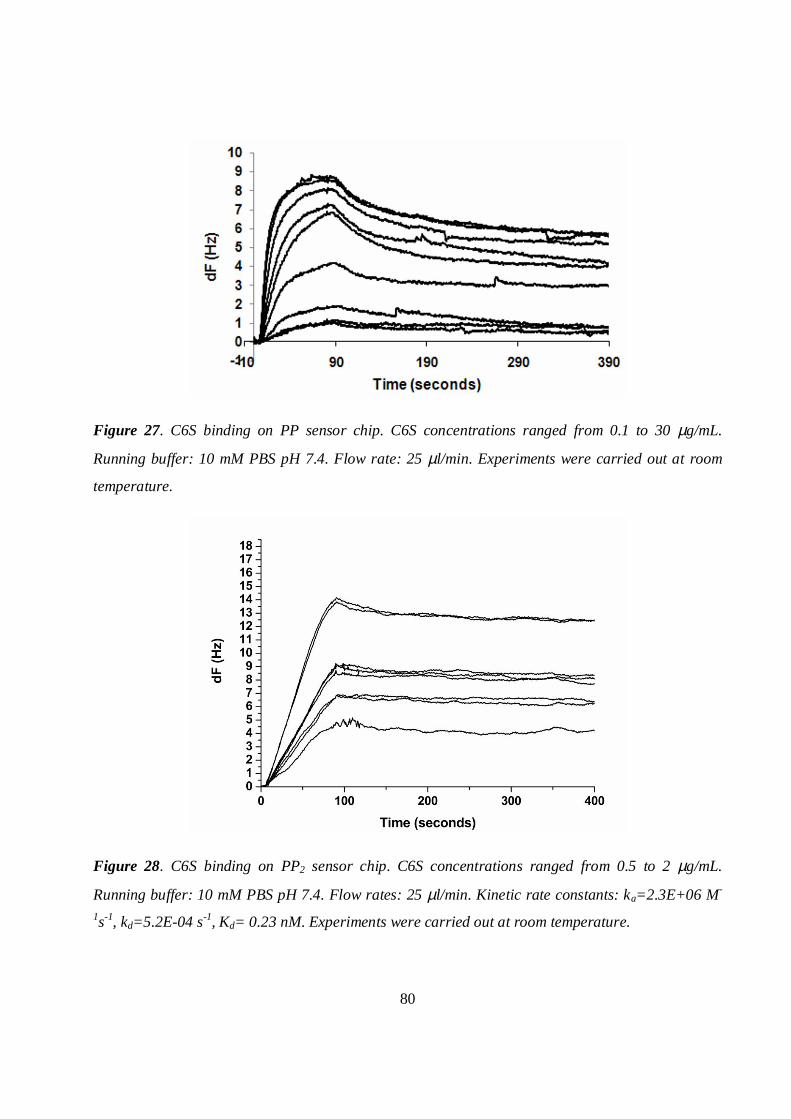
80
Figure 27. C6S binding on PP sensor chip. C6S concentrations ranged from 0.1 to 30 µg/mL.
Running buffer: 10 mM PBS pH 7.4. Flow rate: 25 µl/min. Experiments were carried out at room
temperature.
Figure 28. C6S binding on PP2 sensor chip. C6S concentrations ranged from 0.5 to 2 µg/mL.
Running buffer: 10 mM PBS pH 7.4. Flow rates: 25 µl/min. Kinetic rate constants: ka=2.3E+06 M-
1s-1, kd=5.2E-04 s-1, Kd= 0.23 nM. Experiments were carried out at room temperature.
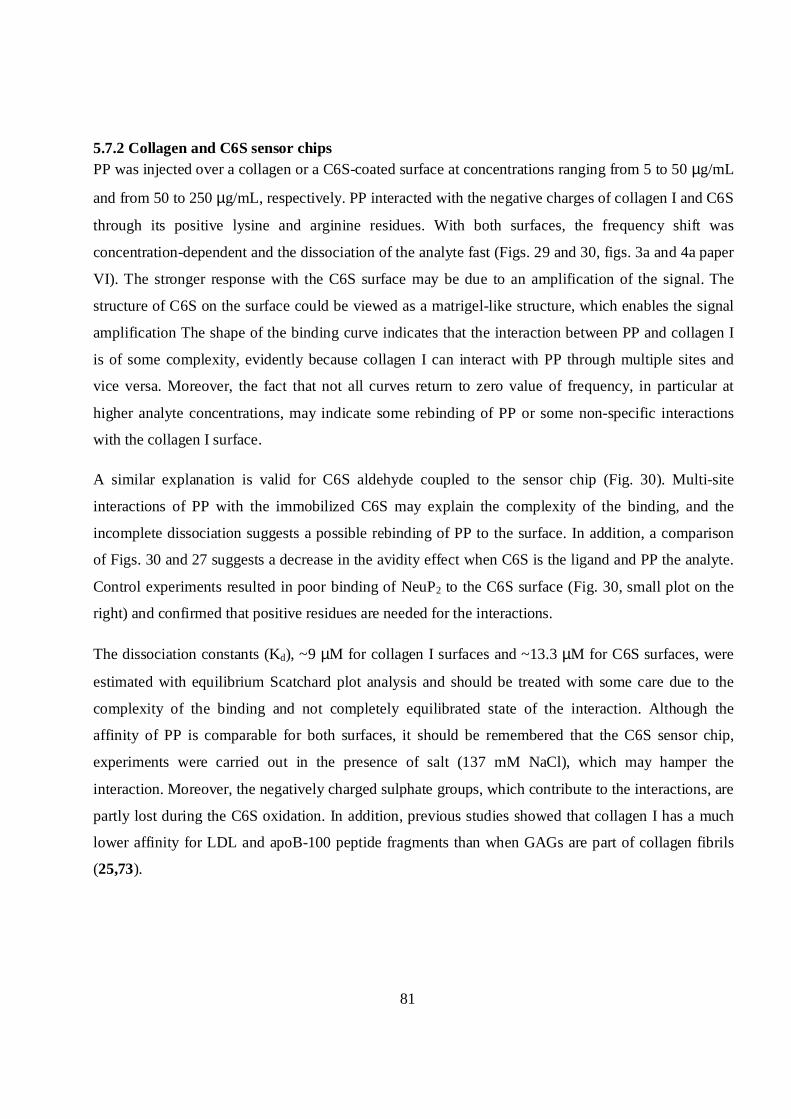
81
5.7.2 Collagen and C6S sensor chipsPP was injected over a collagen or a C6S-coated surface at concentrations ranging from 5 to 50 µg/mL
and from 50 to 250 µg/mL, respectively. PP interacted with the negative charges of collagen I and C6S
through its positive lysine and arginine residues. With both surfaces, the frequency shift was
concentration-dependent and the dissociation of the analyte fast (Figs. 29 and 30, figs. 3a and 4a paper
VI). The stronger response with the C6S surface may be due to an amplification of the signal. The
structure of C6S on the surface could be viewed as a matrigel-like structure, which enables the signal
amplification The shape of the binding curve indicates that the interaction between PP and collagen I
is of some complexity, evidently because collagen I can interact with PP through multiple sites and
vice versa. Moreover, the fact that not all curves return to zero value of frequency, in particular at
higher analyte concentrations, may indicate some rebinding of PP or some non-specific interactions
with the collagen I surface.
A similar explanation is valid for C6S aldehyde coupled to the sensor chip (Fig. 30). Multi-site
interactions of PP with the immobilized C6S may explain the complexity of the binding, and the
incomplete dissociation suggests a possible rebinding of PP to the surface. In addition, a comparison
of Figs. 30 and 27 suggests a decrease in the avidity effect when C6S is the ligand and PP the analyte.
Control experiments resulted in poor binding of NeuP2 to the C6S surface (Fig. 30, small plot on the
right) and confirmed that positive residues are needed for the interactions.
The dissociation constants (Kd), ~9 µM for collagen I surfaces and ~13.3 µM for C6S surfaces, were
estimated with equilibrium Scatchard plot analysis and should be treated with some care due to the
complexity of the binding and not completely equilibrated state of the interaction. Although the
affinity of PP is comparable for both surfaces, it should be remembered that the C6S sensor chip,
experiments were carried out in the presence of salt (137 mM NaCl), which may hamper the
interaction. Moreover, the negatively charged sulphate groups, which contribute to the interactions, are
partly lost during the C6S oxidation. In addition, previous studies showed that collagen I has a much
lower affinity for LDL and apoB-100 peptide fragments than when GAGs are part of collagen fibrils
(25,73).
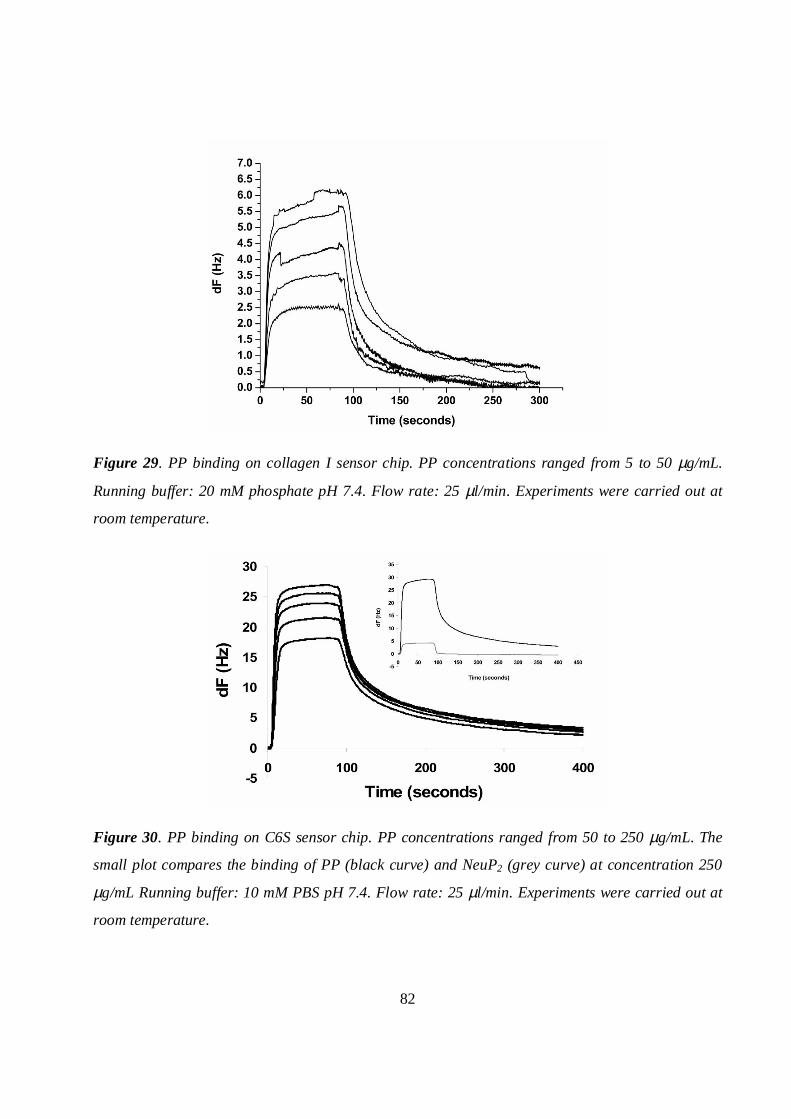
82
Figure 29. PP binding on collagen I sensor chip. PP concentrations ranged from 5 to 50 µg/mL.
Running buffer: 20 mM phosphate pH 7.4. Flow rate: 25 µl/min. Experiments were carried out at
room temperature.
Figure 30. PP binding on C6S sensor chip. PP concentrations ranged from 50 to 250 µg/mL. The
small plot compares the binding of PP (black curve) and NeuP2 (grey curve) at concentration 250
µg/mL Running buffer: 10 mM PBS pH 7.4. Flow rate: 25 µl/min. Experiments were carried out at
room temperature.
83
6 ConclusionsThe goal of this doctoral research was to develop miniaturized analytical tools enabling interaction
studies between nanodomains of biological importance. The primary technique investigated was
capillary electrochromatography with diode array detection.
The focus of the investigations was modifications of LDL and the interactions of LDL with
components of the extracellular matrix. Both processes are considered important in the development
of atherosclerotic plaques. In the course of the work, methods were developed for coating of the
fused silica capillary wall with lipoproteins or components of the ECM.
The first step was to optimize a procedure for coating LDL on the capillary wall. Although
lipoproteins can interact with the capillary wall both electrostatically and hydrophobically, it is
proposed here that the hydrophobic interactions play the major role in the adsorption. The optimized
LDL coating was oxidized in situ, under various conditions, by flushing the capillary with copper
sulphate. Neutral steroids, which interact hydrophobically with LDL particles, were introduced to
the CE instrument as marker compounds, and their retention factors provided information about the
modifications occurring in the LDL particle coating after oxidation.
The LDL coating was also treated in situ with selected enzymes present in the ECM: SMase, PLA2
and α-chymotrypsin. The retention factors of steroids, indicating the affinity of the steroids towards
modified LDL particles, gave information about the modification of LDL.
Capillary electrochromatography provided a useful platform for the removal of lipids from LDL
particles resulting in a apolipoprotein B-100 surface suitable for interaction studies. ApoB-100 is the
major apolipoprotein of LDL, and also the largest and most hydrophobic protein known. In this part
of the work, both retention factors and distribution coefficients of steroids provided numerical
information on interactions.
Since components of the ECM play a crucial role in the progression of atherosclerosis, collagen and
collagen–decorin coatings were developed and optimized. Collagen types I and III were investigated,
while selected apoB-100 peptide fragments acted as marker compounds. The retention factors of the
peptides showed that interactions were strongest with the positive peptide (PP), including lysine and
arginine groups, and that the interactions were enhanced by the presence of decorin.
84
The collagen I coating was then subjected to in situ glycation in CEC. The coating was treated with
D-glucose-6-phosphate for different time periods, and native LDL, oxidized LDL, PP and NeuP2
were introduced to evaluate their interactions with the modified collagen I coating. Oxidized LDL
was completely retained on the collagen I, while the affinity of native LDL decreased with the
degree of glycation of the coating. The negligible variation of the retention factor of PP and NeuP2
suggested that another binding site, in addition to the positive one, mediates the interactions between
LDL and glycated collagen.
Finally, QCM technique was introduced to provide complementary information on interactions
between ECM components and LDL. Biosensor surfaces were derivatized with PP, PP2 collagen I or
C6S. The selected analytes were C6S for PP and PP2 ligands, and PP for collagen I and C6S ligand.
The sensitivity of this technique allowed very small amounts of analytes and biomaterials to be
adsorbed onto the QCM chips. The results showed PP to have higher affinity for C6S than for
collagen I, and the strongest binding was achieved for the sensor chip on which PP2 was adsorbed.
All the methods developed in this work share some common features. They are suitable for surface
interaction studies, they are easy to carry out, and, since just a small amount of material is required,
they are relatively inexpensive. The flexibility and versatility of CEC make it a useful technique for
miniaturization and for mimicking the physiological or pathological conditions that lead to the
formation of atheroma. In addition, as a separation technique with high resolution, CEC can provide,
within a single run, information about the interactions between several analytes and a biomaterial
used as stationary phase. QCM, an excellent miniaturized technique, requires even smaller amounts
of ligands and analytes than CEC. Although information is achieved for the interaction of only one
analyte at a time, QCM allows quick changes in the experimental conditions. Despite the high mass
sensitivity, however, QCM does not allow coupling with other detectors as CEC does. Most
importantly, CEC has been shown to make an excellent microreactor for interaction studies, and the
analytical CEC tools that were developed can easily be exploited in investigations on the interactions
of many other biological nanodomains.
85
7 References1) D. L. Sparks, M. C. Phillips, J. Lipid Res., 33 (1992) 123-130. Quantitative measurement
of lipoprotein surface charge by agarose gel electrophoresis
2) E. Florentin, L. Lagrost, C. Lallemant, P. Gambert, Anal. Biochem., 216 (1994) 352-357.
Polyacrylamide gradient gel electrophoresis as a method to measure transfers of
radiolabeled cholesteryl esters between several plasma lipoprotein fractions
3) R. D. Macfarlane, P. V. Bondarenko, S. L. Cockrill, I. D. Cruzado, W. Koss, C. J.
McNeal, A. M. Spiekerman, L. K. Watkins, Electrophoresis, 18 (1997) 1796-1806.
Development of a lipoprotein profile using capillary electrophoresis and mass
spectrometry
4) H. Esterbauer, G. Striegl, H. Puhl, M. Rotheneder, Free Radic. Res., 6 (1989) 67-75.
Continuous monitoring of in vitro oxidation of human low density lipoprotein
5) G. Yohannes, M. Sneck, S.Varjo, M. Jussila, S. K. Wiedmer, P. T. Kovanen, K. Öörni
and M.-L. Riekkola, Anal. Biochem. 354 (2006) 255-265. Miniaturisation of
asymmetrical flow-field flow fractionation and application to aggregation and fusion
studies of lipoproteins
6) J. W. Jorgenson, K. D. Lukacs, Anal. Chem. 53 (1981) 1298-1302. Zone electrophoresis
in open-tubular glass-capillaries;
7) A. Manz, D. J. Harrison, E. M. J. Verpoorte, J. C. Fettinger, A. Paulus, H. Ludi, H. M.
Widmer, J. Chromatogr. 593 (1992) 253-258. Planar chips technology for
miniaturization and integration of separation techniques into monitoring systems-
capillary electrophoresis on a chip
8) S. Terabe, K. Otsuka, K. Ichikawa, A. Tsuchiya, T. Ando, Anal. Chem. 56 (1984) 111-
113. Electrokinetic separations with micellar solutions and open-tubular capillaries
9) S. Terabe, Annu. Rev. Anal. Chem. 2 (2009) 99-120. Capillary separation: micellar
electrokinetic chromatography
10) H. Watarai, Chem. Lett. 20 (1991) 391-394. Microemulsion capillary electrophoresis
86
11) R. Ryan, S. Donegan, J. Power, E. McEvoy, K. Altria, Electrophoresis, 30 (2009) 65-82.
Recent advantages in methodology, optimization and application of MEEKC
12) J. W. Jorgenson, K. D. Lukacs, J. Chromatogr. 218 (1981) 209-216. High-resolution
separations based on electrophoresis and electroosmosis
13) T. Tsuda, K. Nomura, G. Nakagawa, J. Chromatogr. 248 (1982) 241-247. Open-tubular
microcapillary liquid chromatography with electroosmosis flow using a UV detector
14) K. Jinno, H. Sawada, Trends Anal. Chem. 19 (2000) 664-675. Recent trends in open-
tubular capillary electrochromatography
15) IUPAC: M.-L. Riekkola, J. Å. Jönsson and R. M. Smith, Pure Appl. Chem. 76 (2004)
443-451. Terminology for analytical capillary electromigration techniques
16) M. G. Khaledi, John Willey&Sons Inc., (1998). Hih-performance capillary
electrophoresis: theory, techniques, and applications
17) Z. Deyl, F. Svec, Elsevier (2001). Capillary electrochromatography
18) J. P. Landers, CRC Press, Tailor and Francis group (2008). Capillary and microchip
electrophoresis and associated microtechniques
19) K. W. J. Wahle, S. D. Heys, Curr. Opin. Lipidol., 19 (2008) 435-437. Atherosclerosis:
cell biology and lipoproteins
20) V. Z. Rocha, P. Libby, Nat. Rev. Cardiol., 6 (2009) 399-409. Obesity, inflammation, and
atherosclerosis
21) W. Khovidhunkit, M.-S. Kim, R. A. Memon, J. K. Shigenaga, A. H. Moser, K. R.
Feingold, C. Grunfeld, J. Lipid Res., 45 (2004) 1169-1196. Effects of infection and
inflammation on lipid and lipoprotein metabolism: mechanisms and consequences to the
host
22) W. J. Castellani, Nutr. Res., 24 (2004) 681-693. Metabolic and nutritional aspects of the
atherogenic atypical lipoproteins: lipoprotein(a), remnant lipoproteins, and oxidized low-
density lipoprotein
87
23) R. Albertini, R. Moratti, G. De Luca, Curr. Mol. Med., 2 (2002) 579-592. Oxidation of
low-density lipoprotein in atherosclerosis from basic biochemistry to clinical studies
24) J. L. Goldstein, M. S. Brown, Ann. Rev. Biochem., 46 (1977) 897-930. The low-density
lipoprotein pathway and its relation to atherosclerosis
25) P. T. Kovanen, M. O. Pentikäinen, Trends Cardiovasc. Med., 9 (1999) 86-91. Decorin
links low-density lipoproteins (LDL) to collagen: a novel mechanism for retention of
LDL in the atherosclerotic plaque
26) I. J. Goldberg, W. D. Wagner, L. Pang, L. Paka, L. K. Curtiss, J. A. DeLozier, G. S.
Shelness, C. S. H. Young, S. Pillarisetti, J. Biol. Chem., 273 (1998) 35355-35361. The
NH2-terminal region of apolipoprotein B is sufficient for lipoprotein association with
glycosaminoglycans
27) G. Camejo, E. Hurt-Camejo, O. Wiklund, G. Bondjers, Atherosclerosis, 139 (1998) 205-
222. Association of apo B lipoproteins with arterial proteoglycans: pathological
significance and molecular basis
28) G. Camejo, S. O. Olofsson, F. Lopez, P. Carlsson, G. Bondjers, Arterioscler. Thromb.
Vasc. Biol., 8 (1988) 368-377. Identification of Apo B-100 segments mediating the
interaction of low density lipoproteins with arterial proteoglycans
29) E. Hurt-Camejo, U. Olsson, O. Wiklund, G. Bondjers, G. Camejo, Arterioscler. Thromb.
Vasc. Biol., 17 (1997) 1011-1017. Cellular consequences of the association of apoB
lipoproteins with proteoglycans
30) K. Öörni, M. O. Pentikäinen, M. Ala-Korpela, P. T. Kovanen, J. Lipid Res., 41 (2000)
1703-1714. Aggregation, fusion, and vesicle formation of modified low density
lipoprotein particles: molecular mechanism and effects on matrix interactions
31) G. M. Chisolm, D. Steinberg, Free Radic. Biol. Med., 28 (2000) 1815-1826. The
oxidative modification hypothesis of atherogenesis: an overview
32) H. M. Wilson, R. N. Barker, L.-P. Erwig, Curr. Vasc. Pharmacol., 7 (2009) 234-243.
Macrophages: promising targets for the treatment of atherosclerosis
88
33) P. Saha, B. Modarai, J. Humphries, K. Mattock, M. Waltham, K. G. Burnand, A. Smith,
Curr. Opin. Pharmacol., 9 (2009) 109-118. The monocyte/macrophage as a therapeutic
target in atherosclerosis
34) N. Shibata, C. K. Glass, J. Lipid Res., 50 (2009) S277-S281. Regulation of macrophage
function in inflammation and atherosclerosis
35) K. J. Williams, I. Tabas, Curr. Opin. Lipidol., 9 (1998) 471-474. The response to
retention hypothesis of atherogenesis reinforced
36) C. Flood, M. Gustafsson, R. E. Pitas, L. Arnaboldi, R. L. Walzem, J. Borén, Arterioscler.
Thromb. Vasc. Biol., 24 (2004) 564-570
37) T. L. Innerarity, K. H. Weisgraber, K. S. Arnold, R. W. Mahley, R. M. Krauss, G. L.
Vega, S. M. Grundy, Proc. Natl. Acad. Sci., 84 (1987) 6919-6923. Familial defective
apolipoprotein B-100: low density lipoproteins with abnormal receptor binding
38) N. B. Myant, J. J. Gallagher, B. L. Knight, S. N. McCarthy, J. Frostegard, J. Nilsson, A.
Hamsten, P. Talmud, S. E. Humphries, Arterioscler. Thromb. Vasc. Biol., 11 (1991) 691-
703. Clinical signs of familial hypercholesterolemia in patients with familial defective
apolipoprotein B-100 and normal low density lipoprotein receptor function
39) A. J. Whitfield, P. H. R. Barrett, F. M. van Bockxmeer, J. R. Burnett, Clin. Chem., 50
(2004) 1725-1732. Lipid disorders and mutations in the APOB gene
40) T. Hevonoja, M. O. Pentikäinen, M. T. Hyvönen, P. T. Kovanen, M. Ala-Korpela,
Biochim. Biophys. Acta, 1488 (2000) 189-210. Structure of low density lipoprotein
(LDL) particles: basis for understanding molecular changes in modified LDL
41) K. D. Biggerstaff, J. S. Wooten, Adv. Physiol. Educ., 28 (2004) 105-106. Understanding
lipoproteins as transporters of cholesterol and other lipids
42) J. P. Kane, Ann. Rev. Physiol., 45 (1983) 637-650. Apolipoprotein B: structural and
metabolic heterogeneity
89
43) J. P. Segrest, M. K. Jones, H. De Loof, N. Dashti, J. Lipid Res., 42 (2001) 1346-1367.
Structure of apolipoprotein B-100 in low density lipoproteins
44) L. Chan, J. Biol. Chem., 267 (1992) 25621-25624. Apolipoprotein B, the major protein
component of triglyceride-rich and low density lipoproteins
45) A. Elenius, K. Simons, Biochemistry, 10 (1971) 2542-2547. Removal of lipids from
human plasma low-density lipoprotein by detergents
46) L. Socorro, G. Camejo, J. Lipid Res., 20 (1979) 631-638. Preparation and properties of
soluble, immunoreactive apoLDL
47) L. L. Kilgore, B. W. Patterson, W. R. Fisher, J. Biol. Chem., 261 (1986) 8842-8848.
Immunologic comparison of the conformations of apolipoprotein B
48) C.-Y. Yang, S.-H. Chen, S. H. Gianturco, W. A. Bradley, J. T. Sparrow, M. Tanimura,
W.-H. Li, D. A. Sparrow, H. Deloof, M. Rosseneu, F.-S. Lee, Z.-W. Gu, A. M. Gotto Jr.,
L. Chan, Nature, 323 (1986) 738-742. Sequence, structure, receptor-binding domains
and internal repeats of human apolipoprotein B-100
49) J. R. McNamara, G. R. Warnick, G. R. Cooper, Clin. Chim. Acta, 369 (2006) 158-167. A
brief history of lipid and lipoprotein measurements and their contribution to clinical
chemistry
50) W. T. Friedewald, R. I. Levy, D. S. Fredrickson, Clin. Chem., 18 (1972) 499-502.
Estimation of the concentration of low-density lipoprotein cholesterol in plasma, without
use of the preparative ultracentrifuge
51) J. D. Otvos, E. J. Jeyarajah, D. W. Benett, Clin. Chem., 37 (1991) 377-386.
Quantification of plasma lipoproteins by proton nuclear magnetic resonance
spectroscopy
52) P. Li, M. Hansen, J. C. Giddings, J. Liq. Chrom. & Rel. Technol., 20 (1997) 2777-2802.
Separation of lipoproteins from human plasma by flow field-flow fractionation
90
53) H. Kurosawa, H. Yoshida, H. Yanai, Y. Ogura, Y. Hirowatari, N. Tada, Clin. Biochem.,
40 (2007) 1291-1296. Comparative study between anion-exchange HPLC and
homogeneous assay methods in regard to the accuracy of high- and low-density
lipoprotein cholesterol measurement
54) T. Manabe, S. Visvikis, J. Steinmetz, M. M. Galteau, T. Okuyama, G. Siest, Electrophor.
’86, Proc. Meet. Int. Electrophor. Soc., 5th (1986) 579-582. Combined technique of
micro 2-D electrophoresis for analysis of serum lipoproteins and apolipoproteins
55) G. Bittolo-Bon, G. Cazzolato, J. Lipid Res., 40 (1999) 170-177. Analytical capillary
isotachophoresis of total plasma lipoproteins: a new tool to identify atherogenic low
density lipoproteins
56) G. Nowicka, T. Bruning, B. Grothaus, G. Kahl, G. Schmitz, J. Lipid Res. 31 (1990)
1173-1186. Characterization of apolipoprotein B-containing lipoproteins separated by
preparative free low isotachophoresis
57) G. Schmitz, C. Mollers, Electrophoresis 15 (1994) 31-39. Analysis of lipoproteins with
analytical capillary electrophoresis
58) G. Schmitz, C. Mollers, V. Richter, Electrophoresis 18 (1997) 1807-1813. Analytical
capillary isotachophoresis of human serum lipoproteins
59) A Bottcher, J. Schlosser, F. Kronenberg, H. Dieplinger, G. Knipping, K. J. Lackner, G.
Schmitz, J. Lipid Res. 41 (2000) 905-915. Preparative free-solution isotachophoresis for
separation of human plasma lipoproteins: apolipoprotein and lipid composition of HDL
subfractions
60) A. D. Dergunov, A Hoy, E. A. Smirnova, S. Visvikis, G. Siest, Int. J. Biochem. Cell
Biol. 35 (2003) 530-543. Charged-based heterogeneity of human plasma lipoproteins at
hypertriglyceridemia: capillary isotachophoresis study
61) T. N. Wight, Arteriosclerosis, 9 (1989) 1-20. Cell biology of arterial proteoglycans
91
62) R. V. Iozzo, A. D. Murdoch, FASEB J., 10 (1996) 598-614. Proteoglycans of
extracellular environment: clues from the gene and the protein side offer novel
perspectives in molecular diversity and function
63) J. Engel, H. P. Bächinger, Top. Curr. Chem., 247 (2005) 7-33. Structure, stability and
folding of the collagen triple helix
64) S. E. Paramonov, J. D. Hartgerink, in: C. S. S. R. Kumar, J. Hormes, C. Leuschner,
(Eds.), Nanofabrication towards biomedical applications, Wiley-VCH (2005) 95-117
65) M. G. Venugopal, J. A. M. Ramshaw, E. Braswell, D. Zhu, B. Brodsky, Biochemistry,
33 (1994) 7948-7956. Electrostatic interaction in collagen-like triple-helical peptides
66) E. Schönherr, H. Hausser, L. Beavan, H. Kresse, J. Biol. Chem., 270 (1995) 8877-8883.
Decorin-type I collagen interaction. Presence of separate core protein–binding domains
67) M. Raspanti, A. Alessandrini, V. Ottani, A. Ruggeri, J. Struct. Biol., 119 (1997) 118-122.
Direct visualization of collagen-bound proteoglycans by tapping-mode atomic force
microscopy
68) T. Douglas, S. Heinemann, S. Bierbaum, D. Scharnweber, H. Worch,
Biomacromolecules, 7 (2006) 2388-2393. Fibrillogenesis of collagen types I, II, and III
with small leucine-rich proteoglycans decorin and biglycan
69) S. Bierbaum, T. Douglas, T. Hanke, D. Scharnweber, S. Tippelt, T. K. Monsees, R. H.
W. Funk, H. Worch, J. Biomed. Mater. Res., 77A (2006) 551-562. Collageneous matrix
coatings on titanium implants modified with decorin and chondroitin sulfate:
characterization and influence on the osteoblastic cells
70) M. Raspanti, M. Viola, M. Sonaggere, M. E. Tira, R. Tenni, Biomacromolecules, 8
(2007) 2087-2091. Collagen fibril structure is affected by collagen concentration and
decorin
71) K. Skålen, M. Gustafsson, E. K. Rydberg, L. M. Hultén, O. Wiklund, T. L. Innerarity, J,
Borén, Nature, 417 (2002) 750-754. Subendothelial retention of atherogenic lipoproteins
in early atherosclerosis
92
72) G. Camejo, U. Olosson, E. Hurt-Camejo, N. Baharamian, G. Bondiers, Atheroscler.
Suppl., 3 (2002) 3-9. The extracellular matrix on atherogenesis and diabetes-associated
vascular disease
73) M. O. Pentikäinen, K. Öörni, R. Lassila, P. T. Kovanen, J. Biol. Chem., 272 (1997)
7633-7638. The proteoglycan decorin links low density lipoproteins with collagen type I
74) H. Esterbauer, M. Dieber-Rotheneber, G. Waeg, G. Striegl, G. Jürgens, Chem. Res.
Toxicol., 3 (1990) 77-92. Biochemical, structural, and functional properties of oxidized
low-density lipoprotein
75) M. Torzewski, K. J. Lackner, Clin. Chem. Lab. Med., 44 (2006) 1389-1394. Initiation
and progression of atherosclerosis enzymatic or oxidative modification of low-density
lipoprotein?
76) K. Öörni, P. Posio, M. Ala-Korpela, M. Jauhiainen, P. T. Kovanen, Arteroscl. Thromb.
Vasc. Biol., 25 (2005) 1678-1683. Sphingomyelinase induces aggregation and fusion of
small very low-density lipoprotein and intermediate-density lipoprotein particles and
increases their retention to human arterial proteoglycans
77) P. Sartipy, E. Hurt-Camejo, Trends Cardiovasc. Med., 9 (1999) 232-238. Modification
of plasma lipoproteins by group IIA phospholipase A2. Possible implication for
atherogenesis
78) M. Piha, L. Lindstedt, P. T. Kovanen, Biochemistry, 34 (1995) 10120-10129. Fusion of
proteolyzed low-density lipoprotein in the fluid phase: a novel mechanism generating
atherogenic lipoprotein particles
79) K. Öörni, J. K. Hakala, A. Annila, M. Ala-Korpela, P. T. Kovanen, J. Biol. Chem., 273
(1998) 29127-29134. Sphingomyelinase induces aggregation and fusion, but
phospholipase A2 only aggregation, of low density lipoprotein (LDL) particles
80) A. J. Guarino, S. P. Lee, T. N. Tulenko, S. P. Wrenn, J. Colloid Interface Sci., 279
(2004) 109-116. Aggregation kinetics of low density lipoproteins upon exposure to
sphingomyelinase
93
81) K. Paananen, J. Saarinen, A. Annila, P. T. Kovanen, J. Biol. Chem., 270 (1995) 12257-
12262. Proteolysis and fusion of low density lipoprotein particles strengthen their
binding to human aortic proteoglycans
82) P. Sartipy, G. Camejo, L. Svensson, E. Hurt-Camejo, J. Biol. Chem., 274, (1999) 25913-
25920. Phospholipase A2 modification of low density lipoproteins forms small high
density particles with increased affinity for proteoglycans and glycosaminoglycans
83) J. van Asten, B. O. Bingen, E. A. B. J. Broeders, E. S. Hoogeveen, F. van Hout, V. A.
Kwee, B. Laman, F. Malgo, M. Mohammadi, M. Nijenhuis, M. Rijkée, M. M. van
Tellingen, M. Tromp, Q. Tummers, L. de Vries, Eur. J. Intern. Med., 20 (2009) 253-260.
The role of inflammation on atherosclerosis, intermediate and clinical cardiovascular
endpoints in type 2 diabetes mellitus
84) R. G. Paul, A. J. Bailey, Int. J. Biochem. Cell. Biol., 28 (1996) 1297-1310. Glycation of
collagen: the basis of its central role in the late complications of ageing and diabetes
85) A. G. Huebschmann, J. G. Regensteiner, H. Vlassara, J. E. B. Reusch, Diabetes Care, 29
(2006) 1420-1432. Diabetes and advanced glycoxidation end products
86) N. Ahmed, Diabetes Res. Clin. Pract., 67 (2005) 3-21. Advanced glycation endproducts-
role in pathology of diabetic complications
87) V. M. Monnier, M. Glomb, A. Elgawish, D. R. Sell, Diabetes, 45, 1996, S67-72. The
mechanism of collagen cross-linking in diabetes: a puzzle nearing resolution
88) M-X. Fu, K. J. Knecht, S. R. Thorpe, J. W. Baynes, Diabetes, 41 (1992) 42-48. Role of
oxygen in cross-linking and chemical modification of collagen by glucose
89) M. Brownlee, H. Vlassara, A. Cerami, Diabetes, 34 (1985) 936-941. Nonenzymatic
glycosylation products on collagen covalently trap low-density lipoprotein
90) S. Jimi, N. Sakata, A. Matunaga, S. Takebayashi, Atherosclerosis, 107 (1994) 109-116.
Low density lipoproteins bind more to type I and III collagens by negative charge-
dependent mechanisms than to type IV and V collagens
94
91) E. Kenndler, Theory of capillary zone electrophoresis, in: High-performance capillary
electrophoresis, Wiley-VHC (1998), 25-76)
92) A. S. Rathore, C. Horváth, Electrophoresis, 23 (2002) 1211-1216. Chromatographic and
electrophoretic migration parameters in capillary electrochromatography
93) S. K. Wiedmer, M. Jussila, R. M. S. Hakala, K.-H. Pystynen, M.-L. Riekkola,
Electrophoresis, 26 (2005) 1920-1927. Piperazine-based buffers for liposome coating of
capillaries for electrophoresis
94) Karin Walhagen, Klaus K. Unger, Milton T. W. Hearn, Anal. Chem. 73 (2001) 4924-
4936. Capillary electrochromatography analysis of hormonal cyclic and linear peptides
95) J. Chen, A. Fallarero, A. Mättänen, M. Sandberg, J. Peltonen, P. M. Vuorela, M.-L.
Riekkola, Anal. Chem., 80 (2008) 5103-5109. Living cells of staphylococcus aureus
immobilized onto the capillary surface in electrochromatography: a tool for screening of
biofilm
96) E. Nemutlu, N. Özaltin, Anal. Bioanal. Chem., 383 (2005) 833-838. Determination of
magnesium, calcium, sodium, and potassium in blood plasma by capillary zone
electrophoresis
97) A.-C. Servais, J. Crommen, M. Fillet, Electrophoresis, 27 (2006) 2616-2629. Capillary
electrophoresis-mass spectrometry, an attractive tool for drug bioanalysis and biomarker
discovery
98) J. R. Petersen, A. O. Okorodudu, A. Mohammad, D. A. Payne, Clin. Chim. Acta, 330
(2003) 1-30. Capillary electrophoresis and its application in the clinical laboratory
99) P. W. Hawkes, (ed.)., Adv. Elec. Elec. Phys. Suppl. 16, Academic Press, London 1985,
pp 1-21
100) G. Binnig, C. F. Quate, Ch. Gerber, Phys. Rev. Lett. 56 (1986) 930-933. Atomic force
microscope;

95
101) M. Radmacher, R. W. Tillamnn, M. Fritz, H. E. Gaub, Science 257 (1992) 1900-1905.
From molecules to cells: imaging soft samples with the atomic force microscope
102) S. Magonov, Handbook of Surfaces and Interfaces of Materials, 2 (2001) 393
103) T. W. Kelley, P. A. Schorr, K. D. Johnson, M. Tirrell. C. D. Frisbie, Macromolecules, 31
(1998) 4297-4300. Direct force measurement at polymer brush surfaces by atomic force
microscopy
104) P. K. Hansma, J. P. Cleveland, M. Radmacher, D. A. Walters, P. E. Hillner, M.
Bezanilla, M. Fritz, D. Vie, H. G. Hansma, C. B. Prater, J. Massie, L. Fukunage, J.
Gurley, V. Elings, Appl. Phys. Lett., 64 (1994) 1738-1740. Tapping mode atomic force
microscopy in liquids
105) M. A. Cooper, Anal. Bioanal. Chem., 377 (2003) 834-842. Label-free screening of bio-
molecolar interactions
106) M. Muratsugu, F. Ohta, Y. Miya, T. Hosokawa, S. Kurosawa, N. Kamo, H. Ikeda, Anal.
Chem., 65 (1993) 2933-2937. Quartz crystal microbalance for the detection of
microgram quantities of human serum albumin: relationship between the frequency
change and the mass of protein adsorbed
107) K. A. Marx, Biomacromolecules, 4 (2003) 1099-1120, Quartz crystal microbalance: a
useful tool for studying thin polymer films complex biomolecular systems at the
solution-surface interface
108) G. Z. Sauerbrey, Z. Phys., 155 (1959) 206-222. The use of quartz crystal oscillators for
weighing thin layers and for micro-weighing
109) M. Johnsson, N. Bergstrand, K. Edwards, J. J. R. Stålgren, Langmuir, 17 (2001) 3902-
3911. Adsorption of a PEO-PPO-PEO triblock copolymer on small unilamellar vesicles:
equilibrium and kinetic properties and correlation with membrane permeability
110) F. Höök, B. Kasemo, T. Nylander, C. Fant, K. Sott, H. Elwing, Anal. Chem., 73 (2001)
5796-5804. Variations in coupled water, viscoelastic properties, and film thickness of a
96
Mefp-1 protein film during adsorption and cross-linking: a quartz crystal microbalance
with dissipation monitoring, ellipsometry, and surface plasmon resonance study
111) Y. S. Fung, Y. Y. Wong, Anal. Chem., 73 (2001) 5302-5309. Self-assembled monolayers
as the coating in a quartz piezoelectric crystal immunosensor to detect salmonella in
aqueos solution
112) M. Thompson, G. L. Hayward, IEEE Int. Frequency Control Symposium (1997)
113) A. Janshoff, H. J. Galla, C. Steinem, Angew. Chem. Int. Ed., 39 (2000) 4004-4032.
Piezoelectric mass-sensing devices as biosensor—an alternative to optical biosensors?
114) J. C. Giddings, Sep. Sci., 1 (1966) 123-125. New separation concept based on a coupling
of concentration and flow nonuniformities
115) B. Roda, A. Zattoni, P. Reschiglian, M. H. Moon, M. Mirasoli, E. Michelini, A. Roda,
Anal. Chim. Acta, 635 (2009) 132-143. Field flow fractionation in bioanalysis: a review
of recent trends
116) K. H. Weisgraber, S. C. Rall, Jr., J. Biol. Chem., 262 (1987) 11097-11103. Human
apolipoprotein B-100 heparin-binding sites
117) C. M. Radding, D. Steinberg, J. Clin. Invest., 39 (1960) 1560-1569. Studies on the
synthesis and secretion of serum lipoproteins by rat liver slices
118) R. J. Havel, H. A. Eder, J. H. Bragdon, J. Clin. Invest., 34 (1955) 1345-1353. The
distribution and chemical composition of ultracentrifugally separated lipoproteins in
human serum
119) O. H. Lowry, N. J. Rosebrough, A. L. Farr, R. J. Randall, J. Biol. Chem., 193 (1951)
265-275. Protein measurement with the folin phenol reagent
120) E. G. Bligh, W. J. Dyer, Biochem. Cell Biol., 37 (1959) 911-917. A rapid method of total
lipid extraction and purification
97
121) N. Meechai, A. M. Jamieson, J. Blackwell, J. Colloid Interface Sci., 218 (1999) 167-175.
Translational diffusion coefficients of bovine serum albumin in aqueous solution at high
ionic strength
122) A. E. Bolton, W. M. Hunter, Biochem. J., 133 (1973) 529-539. The labeling of proteins
to high specific radioactivities by conjugation to a 125I-containing acylating agent
123) D. G. Myszka, T. A. Morton, Trends Biochem. Sci., 23 (1998) 149-150. Clamp: a
biosensor kinetic data analysis program
124) R. Kuldvee, S. K. Wiedmer, K. Öörni, M.-L. Riekkola, Anal. Chem., 77 (2005) 3401-
3405. Human low-density lipoprotein-coated capillaries in electrochromatography
125) C. C. Dupont-Gillain, E. Pamula, F. A. Denis, V. M. De Cupere, Y. F. Dufrene, P. G.
Rouxhet, J. Mater. Sci. Mater. Med., 15 (2004) 347-353. Controlling the supramolecular
organization of adsorbed collagen layers
126) R. Müller, J. Abke, E. Schnell, D. Scharnweber, R. Kujat, C. Englert, D. Taheri, M.
Nerlich, P. Angele, Biomaterials, 27 (2006) 4059-4068. Influence of surface
pretreatment of titanium- and cobalt-based biomaterials on covalent immobilization of
fibrillar collagen
127) M. Morra, C. Cassinelli, G. Cascardo, L. Mazzucco, P. Borzini, M. Fini, G. Giavaresi, R.
Giardino, J. Biomed. Mater. Res., 78A (2006) 449-458. Collagen I-coated titanium
surfaces: mesenchymal cell adhesion and in vivo evaluation in trabecular bone implants
128) S. E. Woodcock, W. C. Johnson, Z. Chen, J. Colloid. Interface Sci., 292 (2005) 99-107.
Collagen adsorption and structure on polymer surfaces observed by atomic force
microscopy
129) E. Gurdak, P. G. Rouxhet, C. C. Dupont-Gillain, Colloids Surf. B. Biointerfaces, 52
(2006) 76-88. Factors and mechanisms determining the formation of fibrillar collagen
structures in adsorbed phases
98
130) J. T. Hautala, M. V. Lindén, S. K. Wiedmer, S. J. Ryhänen, M. J. Säily, P. K. J.
Kinnunen, M.-L. Riekkola, J. Chromatogr. A, 1004 (2003) 81-90. Simple coating of
capillaries with anionic liposomes in capillary electrophoresis
131) B. R. Williams, R. A. Gelman, D. C. Poppke, K. A. Piez, J. Biol. Chem., 253 (1978)
6578-6585. Collagen fibril formation
132) A. J. Rodríguez-Malaver, D. S. Leake, C. A. Rice-Evans, FEBS Lett., 406 (1997) 37-41.
The effect of pH on the oxidation of low-density lipoprotein by copper and
metmyoglobin are different
133) B. Kalyanaraman, W. E. Antholine, S. Parthasarathy, Biochim. Biophys. Acta, 1990,
1035, 286-292. Oxidation of low-density lipoprotein by Cu2+ and lipoxygenase: an
electron spin resonance study
134) R. J. Deckelbaum, G. G. Shipley, D. M. Small, J. Biol. Chem., 252 (1977) 744-754.
Structure and interactions of lipids in human plasma low density lipoproteins
135) M. Sneck, P. T. Kovanen, K. Öörni, J. Biol. Chem., 280 (2005) 37449-37454. Decrease
in pH strongly enhances binding of native, proteolyzed, lipolyzed, and oxidized low
density lipoprotein particles to human aortic proteoglycans
136) F. Ghomashchi, S. Schüttel, M. K. Jain, M. H. Gelb, Biochemistry, 31 (1992) 3814-3824.
Kinetic analysis of a high molecular weight phospholipase A2 from rat kidney: divalent
metal-dependent trapping of enzyme on product-containing vesicles
137) R. R. Baker, H. Y. Chang, Biochem. Cell Biol., 69 (1991) 358-365. Properties of
phospholipase A2 isolated from rat serum
138) R. Shireman, L. L. Kilgore, W. R. Fisher, Proc. Natl. Acad. Sci. USA, 74 (1977) 5150-
5154. Solubilization of apolipoprotein B and its specific binding by the cellular receptor
for low density lipoprotein
139) I. D. Cruzado, S. L. Cockrill, C. J. McNeal, J. Lipid Res., 39 (1998) 205-217.
Characterization and quantitation of apolipoprotein B-100 by capillary electrophoresis
99
140) A. Johs, M. Hammel, I. Waldner, R. P. May, P. Laggner, J. Biol. Chem., 281 (2006)
19732-19739. Modular structure of solubilized human apolipoprotein B-100
141) Z. Pei, H. Anderson, T. Aastrup, O. Ramström, Biosens. Bioelectron., 21 (2005) 60-66.
Study of real-time lectin-carbohydrate interactions on the surface of a quartz crystal
microbalance
142) I. Jacquemart, E. Pamula, V. M. De Cupere, P. G. Rouxhet, C. C. Dupont-Gillain, J.
Colloid Interface Sci., 278 (2004) 63-70. Nanostructured collagen layers obtained by
adsorption and drying;
143) J. T. Elliott, M. Halter, A. L. Plant, J. T. Woodward, K. J. Langenbach, A. Tona,
Biointerphases, 3 (2008) 19-28. Evaluating the performance of fibrillar collagen films
formed at polystyrene surfaces as cell culture substrates
144) U. P. Steinbrecher, J. Biol. Chem., 262 (1987) 3603-3608. Oxidation of human low
density lipoprotein results in derivatization of lysine residues of apolipoprotein B by
lipid peroxide decomposition products
145) I. Jialal, S. Devaraj, Clin. Chem., 42 (1996) 498-506. Low-density lipoprotein oxidation,
antioxidants, and atherosclerosis: a clinical biochemistry perspective
146) J. Stocks, N. E. Miller, J. Lipid Res., 39 (1998) 1305-1309. Capillary electrophoresis to
monitor the oxidative modification of low density lipoproteins
147) E. Hurt-Camejo, G. Camejo, P. Sartipy, Curr. Opin. Lipidol., 11 (2000) 465-471.
Phospholipase A2 and small dense low-density lipoprotein
148) P. Bernfeld, T. F. Kelley, J. Biol. Chem., 239 (1964) 3341-3346. Proteolysis of human
serum β-lipoprotein
149) L. J. Siskind, M. Colombini, J. Biol. Chem., 275 (2000) 38640-38644. The lipids C2- and
C16-ceramide form large stable channels
100
150) L. J. Siskind, R. N. Kolesnick, M. Colombini, J. Biol. Chem., 277 (2002) 26796-26803.
Ceramide channels increase the permeability of the mitochondrial outer membrane to
small proteins
151) U. Westphal, B. D. Ashley, J. Biol. Chem., 233 (1958) 57-62. Steroid-protein
interactions: IV. Influence of functional groups in ∆4-3-ketosteroids on interaction with
serum and β-lactoglobulin
152) T. J. Berg, O. Snorgaard, J. Faber, P. A. Torjesen, P. Hildebrandt, J. Mehlsen, K. F.
Hanssen, Diabetes Care, 22 (1999) 1186-1190. Serum levels of advanced glycation end
products are associated with left ventricular diastolic function in patients with type 1
diabetes
153) D. A. Slatter, R. G. Paul, M. Murray, A. J. Bailey, J. Biol. Chem., 274 (1999) 19661-
19669. Reactions of lipid-derived malondialdehyde with collagen
154) S. Lund-Katz, J. A. Ibdah, J. Y. Letizia, M. T. Thomas, M. C. Phillips, J. Biol. Chem.,
263 (1988) 13831-13838. A 13C NMR characterization of lysine residues in
apolipoprotein B and their role in binding to low density lipoprotein receptor
155) J. Ruiz-Jimenez, R. Kuldvee, J. Chen, K. Öörni, P. Kovanen, M.-L. Riekkola,
Electrophoresis, 28 (2007) 779-788. Open tubular CE for in vitro oxidation studies of
human very-low-density lipoprotein particles
156) K. Vainikka, J. Chen, J. Metso, M. Jauhiainen, M.-L. Riekkola, Electrophoresis, 28
(2007) 2267-2274. Coating of open tubular capillaries with discoidal and spherical high-
density lipoprotein particles in electrochromatography
157) S. Ghosh, M. K. Basu, J. S. Schweppe, Anal. Biochem., 50 (1972) 592-601. Agarose gel
electrophoresis of serum lipoproteins: determination of true mobility, isoelectric point,
and molecular size
158) E. Hurt-Camejo, G. Camejo, B. Rosengren, F. Lopez, O. Wiklund, G. Bondjers, J. Lipid
Res., 31 (1990) 1387-1398. Differential uptake of proteoglycan-selected subfractions of
low density lipoprotein by human macrophages