method development and validation of capillary ... · modifiers, additives, etc.) and instrumental...
TRANSCRIPT

Method development and validation of capillary electrophoresis: A practical aspect L. Suntornsuk
Department of Pharmaceutical Chemistry, Faculty of Pharmacy, Mahidol University, 447 Sri-Ayudhaya Rd., Rajathevee, Bangkok 10400, Thailand [email protected]
The current review illustrates the method development and validation of capillary
electrophoresis (CE) from experiences of the author research group. Various examples including
drug monitoring, pharmaceutical, and natural product analyses are described. The author
emphasizes that no specific CE condition is applicable for all problems. Analytes’ physico-
chemical properties (e.g., solubility, dissociation constant, polarity, absorptivity, etc.) and their
stability are major consideration. Sample matrices (e.g., biological fluid and tissues, foods,
medicinal plants, etc.) can usually complicate an analysis and should be accounted for before a
method is developed. Consequently, sample pretreatment/preparation procedures have to be
carefully optimized as well. Successes in CE separation involve adjustments of both chemical
(e.g., background electrolyte concentrations and pH, organic solvents, electro-osmotic flow
modifiers, additives, etc.) and instrumental (e.g., sample loading techniques, temperature,
voltage, capillary dimension, detectors, etc.) factors. Optimization of these factors can be
achieved by univariate approach or statistical experimental design. The final optimum CE
condition should be justified by acceptable analytical parameters (e.g., resolution, tailing factor,
number of theoretical plate, total analysis time, etc.). Method validation is a follow up process,
which should be carried out according to the predetermined protocol and criteria of performance.
These criteria normally include specificity, linearity and range, accuracy, precision, and
robustness. BGE and sample solution stability may be required in certain cases and system
suitability should be carried out for method transfer.
1. INTRODUCTION
Capillary electrophoresis (CE) is now a well
established analytical method, which has
numerous applications in separation science
(Marina, 2005; Altria, 1998; Landers and Oda,
1997; Westan and Brown, 1997; Kuhn and
Hoffstetter-Kuhn, 1993; Altria et al., 2006;
Morzunoval, 2006). The method has a long
history of developments since 1886 by
integrating unique features of different
techniques such as the principle of gel
electrophoresis, the fused silica capillary of gas
chromatography (GC) and the high sensitive
detectors of high performance liquid
chromatography (HPLC) (Landers and Oda,
1997). The first commercial CE instrument was
available in 1989 (Landers and Oda, 1997) and
since then, this technique has played important
roles in solving analytical problems, especially
in the human genome project (HGP) (Dovichi
and Zhang, 2000; Collins et al., 1998).
CE separation is based on different
migration of solutes in an electric field and
electrophoresis is performed in narrow-bore
capillaries filled with background electrolyte

(BGE) (Fig. 1). In contrast to paper, agarose
and polyacrylamide gel, electrophoresis in a
capillary can use high voltage (up to 800 V/cm)
due to physical properties of fused silica
capillaries. Additionally, a large surface area to
volume ratio of a capillary provides efficient
heat dissipation than other separating media.
Small amounts of samples and BGE (nanoliter
per injection) are usually required due to the
small dimension of a capillary (typically 25-75
cm long x 25-75 µm inner diameter). CE
instrument can be fully automated with on-
capillary detection, which consumes less time
and labor compared to gel electrophoresis.
Importantly, CE provides high separation
efficiency with number of theoretical plate (N)
> 10,000 and various modes that enable the
analyses of different classes of compounds.
In principle, when analytes are separated by
CE, they migrate with different mobilities under
an electric field. Their mobilities are influenced
by their sizes, charges and degree of ionization,
viscosity, temperature and dielectric constant of
the BGE. In addition to the electrophoretic
migration, electro-osmotic flow (EOF) is a
main driving force in CE that enables the
migration of analytes along the capillary. The
EOF is generated by the multiple ionization of
silanol groups on the inner surface of a silica
capillary. These silanol groups possess
isoelectric point (pI) of 1.5 that makes them
easily ionized at any pHs above 3.0 (Righett et
al., 2001; Camilleri, 1998). Controlling EOF
has pronounced effects on the separation
efficiency and selectivity. Several factors (e.g.,
pH, concentration/ ionic strength of the BGE,
additives, capillary coatings, electric field,
temperature, etc.) can influence the magnitude
and direction of the EOF (Pancorbo et al.,
2005). Advantages of the EOF include a flat
flow profile which provides narrow peaks with
high symmetry and number of theoretical
plates, and simultaneous separation of cationic,
anionic and neutral species. Similar to HPLC,
resolution, efficiency, selectivity and peak
dispersion are considered as important
analytical parameters in CE. These parameters
can be improved by manipulating the electrode
polarity, voltage, temperature, capillary
dimension, BGE properties, temperature,
sample preparation and loading.
2. MATERIALS AND METHODS
2.1. Instrumentation
The setup of a CE instrument generally
consists of a capillary, a voltage supply,
electrodes, sample and liquid handling system,
cooling system and a detector (Fig. 2).
Capillaries are mainly made of fused silica or
teflon with a dimension of 20-100 cm in length
x 20-200 µm inner diameter and an outer
diameter of 300-400 µm. Capillaries should be
regularly pre-conditioned or washed to remove
residual adsorbates from the capillary wall and
to prevent sample cross contamination.
Voltage supply can be operated in a positive or
negative polarity, in a range of 15-30 kV. An
autosampler is used for delivery of samples and
BGE. Samples can be introduced to the
capillary by hydrodynamic or electrokinetic
injection. Hydrodynamic injection is achieved
by applying pressure at the inlet or vacuum at
the outlet or by siphon effect (elevating the
inlet). Electrokinetic injection is also
performed for sample introduction by applying
a low voltage (3-5 times lower than the
separating voltage, for example 5-10 kV)
during an injection (Olechno and Nolan, 1996).
In cases of low concentration samples,
isotachophoresis injection or sample stacking is
recommended prior to CE separation in order to
enhance the sensitivity. Cooling system either
air or liquid cooling, is an integral part of the
CE instrument to maintain a constant
temperature (± 0.1°C) during an analysis.
UV/diode array (DAD) spectrophotometer,
spectrofluorometer and electrochemical
detector are commonly used as on-capillary
detectors in CE, whereas mass spectrometer
(MS) can be used as an external detector. On-
capillary detection provides sharp and
symmetric peak shape since sample band
broadening is minimal.
2.2. Modes of Separation
A major advantage of CE is that various
modes are available for the analyses of different
analytes (Weston and Brown, 1997; Kuhn and
Hoffstetter-Kuhn, 1993). Capillary zone
electrophoresis (CZE) is the simplest and most
versatile CE mode, which is based on distinct
mobilities of analytes under an electric field.
CZE can be applied for the analyses of organic
and inorganic species, amino acids, peptides,
proteins and enantiomers. Micellar
electrokinetic chromatography (MEKC) is a
hybrid of electrophoresis and chromatography.
Surfactants at above critical micelle
concentrations (CMC) are added into the BGE
to form micelles and are employed as
separating media. MEKC enables the
simultaneous separation of neutral as well as
ionic species. Thus, this mode has numerous
applications in pharmaceutical analysis and
other small organic molecules. Capillary gel
electrophoresis (CGE) is well known for the
separation of biopolymers such as proteins and
nucleic acids. In this mode, capillaries are
filled with gel (either cross-linked
polyacrylamide or agarose), which acts as
molecular sieve. Consequently, biopolymers
are separated according to their size. Capillary
isoelectric focusing (CIEF) is useful for
separation of zwitter ions (e.g. amino acids,
peptides and proteins) which contain both
positive and negative charges in their
molecules. Separation mechanism depends on
different isoelectric points of analytes.
Capillary isotachophoresis (CITP) is known as
“moving boundary” where analytes are
separated as continuous zones that migrate at
the same velocity. Migration of analytes is
based on differences in their conductivity
according to the conductivity of the leading
electrolyte (high conductivity at the outlet) and
the terminating electrolyte (low conductivity at
the inlet). CITP normally serves as pre-
concentration step prior CE separation.
Most of the mentioned CE modes employ
aqueous buffer as the BGE. However, non-
aqueous BGE can also be used. Non-aqueous
CE (NACE) has been developed for separation
of non-polar and water-insoluble compounds
which can be easily absorbed on the capillary
wall. Organic solvents such as acetonitrile,
methanol, ethanol and mixtures of these
solvents are used for BGE preparation. Due to
the physico-chemical properties of these
solvents, separation selectivity and analyte
solubility and stability can be improved.
Microemulsion electrokinetic chromatography
(MEEKC) is another CE mode that can be an
alternative method for the separation of a wide
range of compounds. In MEEKC,
microemulsion droplets consisting of oil and the
aqueous phase stabilized by surfactants and co-
surfactants, are used as the pseudo-stationary
phase. MEEKC offers a chromatographic
partition of analytes between the pseudo-
stationary phases and the aqueous BGE which
allows the simultaneous separation of neutral
and ionic species. Chiral capillary
electrophoresis (CCE) is a valuable mode for
separation of chiral drugs of which different
enantiomers possess different pharmacological
activities or toxicity. Indirect CCE can be
simply performed by adding chiral selectors
into the BGE to sterioselectively interact with
each enantiomer. Separation mechanism in
indirect CCE depends upon the chiral selectors
used. For example, inclusion complex occurs
when cyclodextrin or chiral crown ether are
employed. Other mechanisms include ligand
exchange, chiral micelles and affinity
interaction.
2.3. Method Development
The ultimate gold in the method
development is to obtain an efficient and
reliable method that provides baseline
separation of all analytes with high resolution
(Rs), theoretical plate (N) and symmetric peaks
in reasonable times. Rs indicates how well the
two closest peaks are separated from each other
and the value should be greater than 1.5. N
represents the separation efficiency and, for CE,
N is generally in the range of 104-10
5. Tailing
factor (TF) shows the peak symmetry and,

ideally, it should close to 1.0. Rs, N and TF are
calculated from equations 1-3.
Rs =
2(t2-t1) (1)
w1 + w2
T = w0.05 (2) 2f
N = 5.54( t
)2 (3) w1/2
where tx is migration time and wx is baseline
peak width (in time) of analyte x, w0.05 and w1/2
is peak width at 5% and at half height,
respectively, and f is peak width from the
leading edge of peak to the intercept of a
perpendicular line dropped from the peak
maximum to the base.
Developments of a CE method involve
several factors including electrode polarity,
BGE (e.g., type, concentration and pH),
voltage, temperature, capillary dimension and
sample loading method. Varying these factors
causes either unidirectional change or
bidirectional change in analytical parameters
(e.g., resolution (Rs), number of theoretical
plate (N), tailing factor (TF), migration time
(tm), etc). For instance, increasing the voltage
elevates temperature and current, enhances
EOF, but might decrease/increase resolution
and sensitivity. While increasing of BGE
viscosity reduces EOF and mobilities, hence,
increase the migration time.
Optimization of CE condition can be
performed by univariate approach or statistical
experimental designs (SED). The first
approach, in which each factor is varied one at a
time is simple but can be time consuming. In
addition, interaction of the factors can not be
determined by this approach. SED increasingly
plays an important role in analytical method
development. Effects of different factors can be
simultaneously optimized and interaction of
each factor can be inferred; thus, time and the
number of experiments are greatly reduced.
Central composite design (CCD), factorial
design (FD) and fractional factorial design
(FFD) are common tools for SED in CE
optimization.
FD was employed for the development of
NACE for the separation of three β-agonists
(i.e., clenbuterol, salbutamol and terbutaline)
(Anurukvorakun et al., 2006). Effects of BGE
ionic strength, amount of acetonitrile, injection
time, voltage and temperature on key responses
(i.e., Rs, N, TF and total tm) were investigated.
Model equations for the responses could be
derived from the data of 32 experiments and
revealed that BGE had impacts on Rs, TF and
total tm; whereas, the amount of acetonitrile
influenced N, TF and total tm. Importantly,
BGE and acetonitrile had strong interaction
with each other more than other factors. The
final optimization offered the baseline
separation of the three analytes in less than 12
min (Fig. 3). Other examples include the use of
full FD for the analysis of antihistamine
(Capella-Peiro et al., 2006), angiotensin-
converting enzyme inhibitors (Hillaert et al.,
2002) zinc, sodium, calcium and magnesium in
water (Jurado-Gonzalae et al., 2003), Plackett-
Burman full FD and CCD for determination of
impurities in peptide (Brunnkvist et al., 2004)
and CCD for analysis of flavonoids in
Epimedium (Liu et al., 2001).
2.4. Components and Processes of Method
Development
Prior to development of an analytical
method, physico-chemical properties of
analytes, including dissociation constants,
isoelectric point, solubility, purity and stability,
should be determined. Additional information
of analytes, including sample matrices,
interferences, UV absorptivity and whether the
analyte is a major or minor component in the
sample, should be acquired to facilitate the
development process. Last but not least,
successes of development of an analytical
method require competent analysts, proper uses
of reference standards, reference materials or
certified reference materials, suitable selection
of methods and well maintained equipment and
instrument.

Rules of thumb for development processes
of CE methods include selection of appropriate
BGE composition, capillary dimension,
temperature, voltage and detection technique.
Despite these variables, general guidelines of
CE condition for analysis of small molecules,
peptide, protein and nucleic acid are well
suggested in Ref. 3. In summary, the
development a CE method should be carefully
and systematically investigated for different
kind of analytes since one recipe can not fit all.
2.5. Method Validation
Method validation is a testing procedure to
check whether a method is appropriate for its
intended uses. The testing is performed
according to the predetermined protocol and the
results must meet the predetermined criteria of
performance. Method validation of a CE
method and HPLC is performed in a similar
manner in order to verify that the method has
acceptable precision and accuracy. For method
transfer, robustness, injection precision as well
as stability of BGE and sample solution should
be tested. Following are recommended criteria
of performance when a CE method is validated.
This is adapted from the International
Conference on Harmonization of Technical
Requirements for Registration of
Pharmaceutical for Human Use (ICH
Harmonized Tripartite Guideline, 2005).
2.5.1. Specificity
Specificity indicates whether a method can
differentiate the analyte of interest from other
interferences. This criterion is a very important
for the analysis of impurities in pharmaceuticals
and for chiral drug, which should be performed
during identification, impurity testing and
assay. This test is usually carried out by
spiking samples with suitable amounts of
impurities or matrices. Resolution of the
impurities and matrices and the major
components should be demonstrated and the
assay results should not be affected by these
substances compared with the unspiked
samples. Additionally, degradation products
obtained from stress conditions (e.g., light, heat,
humidity acid/base hydrolysis and oxidation)
may be included in the specificity testing.
2.5.2. Linearity and range
Linearity reveals the relationship of signals
and analyte’s concentrations. A minimum of
five concentrations in a range of 80-120% of
the test concentration is recommended. This
relationship is expressed by a regression line
calculated from least square methods
accompanied with correlation coefficient, y-
intercept, slope of the regression line and
residual sum of squares. Generally, signals
calculated from peak area provide better a
linearity range than those from peak height
since the latter is highly influenced by peak
shape.
2.5.3. Accuracy
Accuracy implies the closeness of the
analytical results to the true values. Accuracy
can be performed by spiking know amounts of
analytes into samples and percent recoveries are
evaluated. Accuracy should be carried out
across the specific range of the method, i.e.,
normally, nine determinations over a minimum
of three concentrations. Otherwise, accuracy
can be assessed by comparing the results of the
proposed method with a well-established
method.
2.5.4. Precision
Precision represents the closeness of the
analytical results of an analytical method. This
is expressed as percent relative standard
deviation, standard deviation, variance or
confidence interval. Precision is performed in
three levels: repeatability, intermediate
precision and reproducibility. For repeatability,
a minimum of nine determinations over three
concentrations is recommended. Intermediate
precision includes closeness of results from
different days, analysts or instruments, whereas
reproducibility refers to the results from
different laboratories/environment.

2.5.5. Detection and quantitation limits
Detection (DL) and quantitation limits (QL)
represent method sensitivity. DL is the lowest
amount of the analyte, which can be detected,
while QL is the lowest amount that can be
quantitatively determined with acceptable
precision and accuracy. DL and QL can be
calculated based on: a) signal to noise ratios
(S/N), b) standard deviation of the response and
the slope, c) standard deviation of the blank or
d) the calibration curve. S/N of 3:1 or 2:1 is
generally used for DL, while S/N of 10:1 is
typical for QL.
2.5.6. Robustness
Robustness is a criterion that indicates the
validity of a method among small, but
deliberate variations in experimental factors.
Examples of these variations are pH, BGE
composition, capillary, temperature, voltage,
etc. If any of these variations significantly
influences the analytical results, appropriate
precautions should be mentioned in the
analytical procedures.
2.5.7. Solution stability
During the method validation process,
stability of sample or standard solutions and
BGE composition should be monitored in order
to obtain shelf lives information. This test
indicates whether the solutions and BGE are
stable and do not produce any degradations
during an analysis. Most BGE have shelf-lives
of 3 months, except BGE containing
cyclodextrin, which tends to show bacterial
growth during storage. Stability of stored
solutions should be compared with the freshly
prepared solutions or should be analyzed after
certain storage times. No impurity, degradation
or contaminated peaks should be observed in
the stored solutions.
2.5.8. Peak purity
Peak purity testing is recommended in CE
since co-migrated peaks can be observed in a
analysis. This test is performed in a similar
manner as in HPLC, usually by comparison of
spectral characteristics with standard peaks.
DAD is preferred since the spectra can
monitored at different wavelengths
simultaneously.
2.5.9. System suitability
System suitability is intended to test
whether an instrument or method is suitable and
in good agreement with the predetermined
criteria prior the application of a method.
System suitability criteria include Rs, N and TF.
Other criteria may be included depending upon
application, for example, LOD and resolution
are recommended for enantiomeric separation
of drug impurities and injection precision is
required for assay of active pharmaceutical
ingredients.
3. RESULTS AND DISCUSSION
3.1. Case studies
Development and validation of CE methods
for the monitoring of drugs in serum level, for
quality control of pharmaceutical formulations
and phytochemical substances are illustrated in
case studies 1-4, respectively.
3.1.1. Case study 1
Drug monitoring is one of the essential
tasks in pharmaceutical care in order to achieve
the therapeutic efficacy and safety. This
example reveals a MEKC method developed for
the analysis of mycophenolic acid (MPA) from
serum of transplant recipients (Meyer et al.,
2004). MPA is a metabolite of mycophenolate
mofetil, an immuno suppressive agent, which is
used to prevent tissue rejection. Monitoring of
serum MPA level is essential for dose
adjustment to avoid side effects. In this work,
sample pre-treatment (i.e., solid phase
extraction, SPE) greatly influenced the method
accuracy. Adjusting the serum pH to 1.0 and
using 100 µL methanol to reconstitute the drug
residue were key steps in SPE that enabled the
recoveries of 80.0-100.8 % with % relative
standard deviations (%RSDs) of 8.5-23.9%.
Factors affecting MEKC of MPA were injection
time (20 mbar x 0.1-0.2 min) and detection
wavelengths (217, 254 and 251 nm). Increasing
of injection time enhanced method precision
since an accurate volume of sample was more
controllable compared to the results of a short
injection time. Applying the injection time of
0.2 min provided the lowest %RSDs and a
maximum recovery of 93.0%. The appropriate
detection wavelength for MPA was at 217 nm,
which gave the highest absorbance and lowest
%RSDs. Optimum MEKC condition for the
analysis of MPA was in 20 mM phosphate-
borate buffer (pH 8.0) consisting of 50 mM
sodium dodecyl sulfate (SDS) and 16% v/v
acetonitrile, using hydrodynamic injection of 20
mbar x 0.2 min, a capillary effective length of
49.5 cm with an inner diameter of 50 µm,
voltage and temperature of 25 kV and 20 °C,
respectively, and a detection wavelength at 217
nm (Fig. 4).
The method showed good linearity in a
range of 1.0-5.0 µg/mL with a linear regression
y = 0.1456x + 0.018 (r2 = 0/9964). Precision
calculated from %RSDs of peak height was
within 17.8% and the LOD calculated from S/N
of 3 was 1.0 µg/mL. This validation data
indicated that the method could be applied for
the analysis of MPA serum level in transplant
patients.
3.1.2. Case study 2
CE becomes a valuable tool for
pharmaceutical quality control as described in
the previous review (Suntornsuk, 2007).
Common cold ingredients (Fig. 5) are the most
widely used drug in various countries. Quality
control of these drugs is, therefore, essential for
consumer protection. In 2001, the research
group optimized CZE and MEKC for the
analysis of PPA, CPM, DEX and PARA
(Suntornsuk, 2001). CZE offered baseline
separation of PPA, CPM and DEX, however,
the method was not suitable for PARA PARA
is a neutral compound and co-migrated as a
broad peak with the EOF. MEKC was more
efficient when non-ionic species is included. In
this study, effects of pH of BGE (4.0-6.0),
concentrations of BGE (10-20 mM phosphate-
borate) and surfactant (10-50 mM SDS) and
organic solvent (2.5-20% v/v methanol) on the
separation of PPA, CPM, DEX and PARA were
investigated. The optimum condition was in 10
mM phosphate-borate buffer (pH 9.0)
consisting of 50 mM SDS and 10% v/v
methanol, using voltage of 25 kV, which
provided the separation of all compounds in
11.4 min with a Rs of 1.2.
In 2003, the research group had continued
its work in the separation of nine common cold
ingredients using MEKC (Suntornsuk et al.,
2003b). Further optimization was performed by
varying types (i.e., methanol, ethanol,
isopropanol and acetonitrile) and amount (0-
40% v/v) of organic solvents, pH (4.0-10.0)
and concentrations (5-30 mM) of phosphate-
borate buffer, temperature (25-35 °C) and
voltage (10-25 kV). Organic solvents greatly
affected MEKC separation efficiency and
selectivity by enlarging the separating window,
enhancing analytes’ solubility and reducing
analytes’ mobilities and diffusion. BGE
concentration influenced the EOF and current,
whereas pH impacted migration order of the
analytes. Increasing of temperature and voltage
affected the separation in the same direction
resulting in the decreasing of BGE viscosity
and migration time. Optimum MEKC
condition for the analysis of the nine common
cold ingredients was in 10 mM phosphate-
borate buffer (pH 9.0) consisting of 50 mM
SDS and 26% v/v methanol, using
hydrodynamic injection of 50 mbar x 10 s, a
capillary effective length of 50 cm, voltage and
temperature of 15 kV and 30 °C, respectively.
Baseline separation was obtained in 25.5 min
with a Rs of 3.0 (Fig. 6).
The developed MEKC was validated in
terms of linearity, precision, accuracy LOD and
LOQ for the determination of PARA and CPM
in pharmaceutical formulations. The regression
lines over the range of 10-250 µg/mL were y =
4.29x + 18.12 (r2 = 0.999) and y = 6.00x +
18.33 (r2 = 0.999) for PARA and CPM,
respectively. The %RSDs of the slopes and
intercepts were in the range of 0.2 and 11.3% (n
= 3), respectively. The injection precision (n =
10) calculated from the %RSDs of peak area
were 1.7 and 2.4% for PARA and CPM,
respectively. The different day precision (n =
6) were within 2 and 3% for the migration time
and peak area for both compounds. Recovery
experiments from spiking 50-150% of the label
amount (500 mg and 2.5 mg per tablet for
PARA and CPM, respectively) showed the
mean recoveries of 100.6 and 99.5% for PARA
and CPM, respectively, with the %RSDs of <
2.7% (n = 3). The LOD based on S/N = 3 were
0.4 and 0.5 µg/mL and the LOQ based on the
S/N = 10 were 2 and 4 µg/mL, for PARA and
CPM, respectively. The linearity, precision,
accuracy LOD and LOQ data showed that the
MEKC method was valid for the assay of
PARA and CPM in pharmaceutical
formulations.
3.1.3. Case study 3
Analysis of phytochemical substances is
another focused research by the research group
(Suntornsuk, 2002; Suntornsuk et al., 2003a;
Suntornsuk and Anurukvorakun, 2005). An
example of CZE of aglycone quercetin in
Morus alba L., mulberry leaves is described
herein (Suntornsuk et al., 2003a). This was the
first Thai application of CE on the analysis of
flavonoids. Flavonoids have attracted attention
due to their several pharmacological activities
such as anticancer, antibacterial, antiviral and
antioxidant. The investigated flavonoids
included rutin, quercetin, kaempferol, quercetin,
cathecin and gallic acid (Fig. 7). Both chemical
(i.e., pH and concentrations of boric acid as the
BGE, concentration of SDS and amounts of
methanol) and instrumental (i.e., temperature
and voltage) factors were varied to obtain the
optimum condition for the separation of the six
flavonoids. Increasing boric acid concentration
lengthened the migration time due to the
reduction of EOF (Fig. 8). The EOF reduction
stemmed from the decrease of zeta potential at
the interface of inner surface of the capillary
wall and the sample. Varying of pH of the
BGE greatly affected the selectivity/ migration
order of the flavonoids since they were weak
acidic and were ionized in basic condition. The
migration time was longer at high pH because
more negative net charges were obtained and
they were attracted toward the anode. Adding
5% v/v methanol into the BGE enhanced the
resolution of the separation due to the increase
of the separating window. However, when 10-
20 %v/v was added, overlapped peaks and
migration time of more than 30 min were
observed. This was due to the decrease of
analyte solubility in the presence of high
amount of organic solvent. Addition of SDS
into the BGE changed to CE from CZE to
MEKC modes, which caused peak broadening
due to the borate complex formation of the
BGE and the flavonoids. Thus, for these
flavonoids, CZE was more suitable. Increasing
temperature and voltage decreased the BGE
viscosity which subsequently increased the
EOF and analytes’ mobility and reduced the
migration time. Results indicated that all six
flavonoids were well separated in 16.5 min in
150 mM boric acid (pH 10.0) using a capillary
effective length of 42.5 cm, voltage and
temperature of 18 kV and 32 °C, respectively
(Fig. 8 (150 mM)).
For analysis of phytochemical substances,
which are present in complex matrices (i.e.,
plants), an internal standard (IS) usually benefit
the method precision. In this work, rutin was
employed as an IS for the quantitation of
aglycone quercetin in mulberry leaves.
Standard addition method was selected for
method validation and applications. Linearity
regression of aglycone quercetin, in a range of
40-160 µg/mL, calculated from peak height
ratio gave the best r2 (Table 1). Intra- and inter-
day precision calculated from the use of IS
provided the %RSDs of less than 2.5%,
whereas those without an IS was between 2.3-
4.5% (Table 2). LOD and LOQ of the method,
calculated from S/N = 3 and 10, were 0.86 and
3.16 (%RSD = 1.8%) µg/mL, respectively.
Mean recovery of the method was 100%
(%RSD < 0.8%, Table 3). Validation data
indicated the method was suitable for the
quantitative analysis of aglycone quercetin in
mulberry leaves.

3.1.4. Case study 4
In 2005, the research group optimized a
CZE method for the precision improvement and
for the analysis of flavonoids (i.e., rutin,
kaempferol, quercetin, myricetin and apigenin)
in selected Thai medicinal plants (i.e., Centella
asiatica, Rosa hybrids and Chromolaena
odorata) (Suntornsuk and Anurukvorakun,
2005). Additionally, organic carboxylic acids
(i.e., ethacrynic acid (E) and xanthene-9-
carboxylic acid (X)) were included as internal
standards (IS) or markers. CZE using 10 mM
sodium dihydrogen phosphate-disodium
hydrogen phosphate (pH 8.0) was chosen as a
starting condition for the separation of the
seven analytes. Under this condition, the
analytes were partially separated. Further
optimization was investigated by varying types
and amounts of organic modifiers (methanol
and acetonitrile), concentrations of the BGE
(i.e. 10 and 20 mM), temperature (20-30 °C)
and voltage (15-30 kV). Importantly, the final
optimization was achieved by adding a second
organic modifier (e.g. methanol and
acetonitrile) into the BGE. The optimum CZE
condition was in the BGE consisting of 20 mM
sodium dihydrogen phosphate and disodium
hydrogen phosphate (pH 8.0), 10% v/v
acetonitrile and 6% v/v methanol, using voltage
and temperature of 25 kV and 30 °C,
respectively (Fig. 9). All analytes were
baseline separated in 10 min with a Rs of 2.8.
Interestingly, two different organic solvents
were employed as additives in the BGE to
improve the analytes’ solubility, enhance
separation selectivity and efficiency.
This work first applied the corrected
migration time (tc), using a single marker or two
markers, and marker index (MI) to improve
method precision. Normally, migration time in
CE can deviate from1-2% due to the varied
EOF resulted from the unstable inner capillary
wall surface. Furthermore, migration times of
analyte depend on BGE concentration and pH
and sample matrices, which can be varied from
those of standard solutions. For example,
migration times of flavonoids in medicinal
plants usually differ from those in standard
solutions, which make their identification
difficult. Tc and MI can simplify this problem
by using the well separated compounds as
markers (i.e., E and X). In tc technique, E was
appropriate as a single marker, where as EOF
and E were suitable two markers. For MI
technique, both E and X were selected as
markers. Equations for the calculation of
corrected migration time and marker index were
described in detail in the original paper (27).
%RSDs of migration times of the flavonoids
decreased from 1.88-14.67% to 0.65, 0.82 and
1.28% for tc(E), tc(E/EOF) and MI(E/X), respectively.
Among them, MI gave the lowest %RSDs, a
99-fold of precision was obtained in the
identification of kaempferol in roses. Fig. 10
shows the migrations time of flavonoids in the
plant extracts compared to those calculated
from tc using E as a single marker.
The method was validated for the analysis
of kaempferol in C. asiatica and rose and rutin
in Ch. odorata. Linearity of the CZE method
was performed in spiked samples to avoid
interference from sample matrices over a range
of 40-160 µg/mL. Peak area ratio using E as an
IS showed good linearity for the analysis of the
flavonoids in all three plants (r2 > 0.999) (Table
4). Precision of migration time greatly reduced
from 1.88-14.67% to less than 0.65% when tc(E)
was employed (Table 5). Peak area ratios using
E as and IS also provided the smallest %RSDs
of 0.30-1.66% (Table 5). Recoveries from
standard addition method were between 95.6-
102.0% for all plants and the LOD and LOQ
calculated from S/N were within 2.23 and 7.14
µg/mL, respectively (Table 6). The method
was applicable for the determination of
kaempferol in C. asiatica and rose and rutin in
Ch. odorata.
4. CONCLUSION
The development of a CE method should be
systematically investigated since several factors
including chemical and instrumental parameters
are involved. An optimum condition for each
analyte depends upon the analyte’s physico-

chemical properties and sample’s complexity.
CE separation of analytes in standard solution
can be varied from sample matrices. Thus,
sample pretreatment and using of an IS are
always recommended to improve method
precision. The optimized CE condition is
usually a compromise of analytical parameters
such as the separation efficiency, analysis time,
resolution and peak symmetry. Prior
applications of a CE method, validation of the
method should be evaluated according to the
predetermined criteria, for instance, linearity
and range, accuracy, precision, detection and
quantitation limits, and robustness. In certain
cases, these criteria are extended to solution
stability, peak purity and system suitability.
Although an individual analyte in a sample has
unique characteristics, case studies presented in
this review can serve as guideline for
development and validation of CE method for
analysis of various analytes in different sample
matrices.
REFERENCES
Altria, K.D., (1998). Quantitative analysis of
pharmaceuticals by capillary electro-
phoresis, Vieweg, Wiesbaden.
Altria, K.D., Marsh, A., & Sänger-van de
Griend, C. (2006). Capillary electrophoresis
for the analysis of small-molecule
pharmaceuticals. Electrophoresis, 27, 2263-
2282.
Anurukvorakun O., Suntornsuk W., &
Suntornsuk L. (2006). Factorial design
applied to a non-aqueous capillary
electrophoresis method for the separation of
β-agonists. J. Chromatogr. A, 1134, 326-
332.
Brunnkvist, H., Karlberg, B., Astervik, A., &
Granelli, I. (2004). Experimental design-
based development of a rapid capillary
electrophoresis method for determining
impurities in the tetrapeptide H-Tyr-(D)
Arg-Phe-Phe-NH2. J. Chromatogr. B., 807,
293-300.
Camilleri, P., History and development of
capillary electrophoresis, 1998. Camilleri,
P. (editor) in Capillary electrophoresis:
Theory and practice, (pp. 1-22). CRC Press,
New York, NY.
Capella-Peiro, M.E., Bossi, A., & Esteve-
Romero, J. (2006). Optimization by
factorial design of a capillary zone
electrophoresis method for the simultaneous
separation of antihistamines. Anal.
Biochem., 352, 41-49.
Collins, F., Patrinos, A., Jordan, E.,
Chakravarti, A., Gesterland, R., & Walters
L. (1998). New Goals for the U.S. Human
Genome Project: 1998-2003. Science, 282,
682-689.
Dovichi, N.J., & Zhang, J. (2000). How
capillary electrophoresis sequenced the
human genome. Angew. Chem. Int. Ed.
Engl., 39, 4463-4468.
Gelfi, P.G., Verzola, B., & Castelleti, L. (2001).
The state of the art of dynamic coatings.
Electrophoresis 22, 603-611.
Hillaert, S., Heyden, V.Y., & Van den Bossche,
W. (2002). Optimisation by experimental
design of a capillary electrophoretic method
for the separation of several inhibitors of
angiotensin-converting enzyme using
alkylsulphonates. J. Chromatogr. A, 978,
231-242.
International Conference on Harmonization of
Technical Requirements for Registration of
Pharmaceuticals for Human use. (Nov
2005). ICH Harmonized Tripartite
Guideline: Validation of analytical
procedure: Text and Methodology Q2(R1).
Jurado-Gonzalez, A.J, Galindo-Riano, D.M., &
Garcia Vargas, M. (2003). Factorial designs
applied to the development of a capillary
electrophoresis method for the analysis of
zinc, sodium, calcium and magnesium in
water samples. Talanta, 59, 775-7783.
Kuhn, R., & Hoffstetter-Kuhn, S., (1993).
Capillary electrophoresis: Principles and
practice. Springer-Verlag, New York, NY.

Landers, J.P., & Oda, R.P., (1997). Introduction
to capillary electrophoresis, Landers J.P.
(editors). In Handbook of capillary
electrophoresis. (pp. 1-47). CRC Press, New
York, NY.
Liu, J.J., Li, S.P., & Wang, Y.T. (2001).
Optimization for quantitative determination
of four flavonoids in Epimedium by
capillary zone electrophoresis coupled with
diode array detection using central
composite design. J. Chromatogr. A, 1103,
344-349.
Marina, M.L., Rios, A., & Valcarcel, M.,
(2005). Analysis and detection by capillary
electrophoresis, Elsevier, Amsterdam.
Meyer, Th., Suntornsuk, L., Lindgren, A., &
Frahm, A.W. (2004). A MEKC method for
monitoring mycophenolic acid in serum of
transplant recipients. Pharmazie, 60, 115-
119.
Morzunova1, T. G. (2006). Capillary
electrophoresis in pharmaceutical analysis
(A review). Pharm. Chem. J., 40, 158-170.
Olechno, J.D., & Nolan J.A. Injection methods
in capillary electrophoresis. (1996).
Capillary electrophoresis in analytical
biotechnology, Righetti P.G. (editor). (pp.
61-100). CRC Press, New York, NY.
Pancorbo, A.C., Carretero, A.S., & Gutierrez,
A.F. (2005). Co-electroosmotic capillary
electrophoresis determination of phenolic
acids in commercial olive oil. J. Sep. Sci.
28, 925-934.
Suntornsuk, L., & Anurukvorakun, O. (2005).
Precision improvement for the analysis of
flavonoids in selected Thai plants by
capillary zone electrophoresis.
Electrophoresis, 26, 648-660.
Suntornsuk, L. (2001). Separation of cold
medicine ingredients by capillary
electrophoresis. Electrophoresis, 22, 139-
143.
Suntornsuk, L. (2002). Capillary electrophoresis
of phytochemical substances. J. Pharm.
Biomed. Anal., 27, 679-698.
Suntornsuk, L. (2007). Capillary electrophoresis
in pharmaceutical analysis: A survey on
recent applications. J. Chromatogr. Sci., 45,
559-577.
Suntornsuk, L., Kasemsook, S., & Wongyai, S.
(2003a). Quantitative analysis of aglycone
quercetin in mulberry leaves (Morus alba
L.) by capillary zone electrophoresis.
Electrophoresis, 24, 1236-1241.
Suntornsuk, L., Pipitharome, O., & Wilairat, P.
(2003b). Simultaneous determination of
paracetamol and chlorpheniramine maleate
by micellar electrokinetic chromatography.
J. Pharm. Biomed. Anal., 33, 441-449.
Weston, A., & Brown P.R., (1997). HPLC and
CE: Principles and practice. Academic
Press, New York, NY.
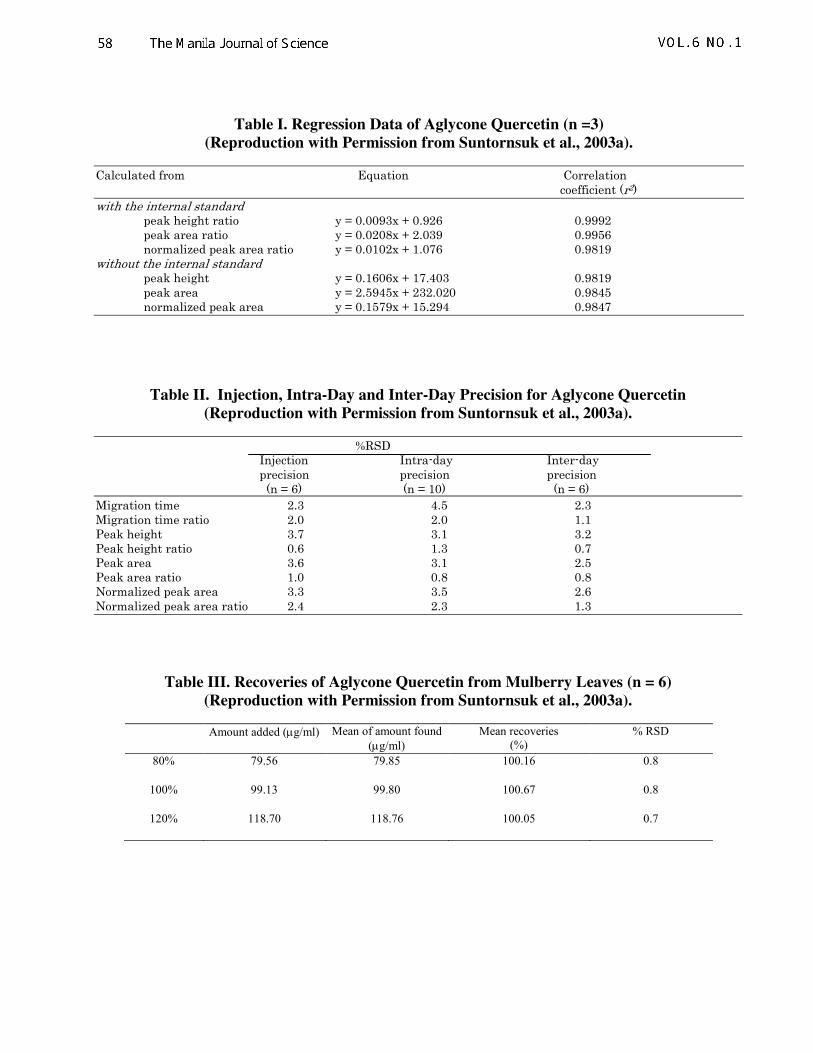
Table I. Regression Data of Aglycone Quercetin (n =3)
(Reproduction with Permission from Suntornsuk et al., 2003a).
Calculated from Equation Correlation coefficient (r2) with the internal standard peak height ratio y = 0.0093x + 0.926 0.9992 peak area ratio y = 0.0208x + 2.039 0.9956 normalized peak area ratio y = 0.0102x + 1.076 0.9819 without the internal standard peak height y = 0.1606x + 17.403 0.9819 peak area y = 2.5945x + 232.020 0.9845 normalized peak area y = 0.1579x + 15.294 0.9847
Table II. Injection, Intra-Day and Inter-Day Precision for Aglycone Quercetin
(Reproduction with Permission from Suntornsuk et al., 2003a).
%RSD Injection Intra-day Inter-day precision precision precision (n = 6) (n = 10) (n = 6)
Migration time 2.3 4.5 2.3 Migration time ratio 2.0 2.0 1.1 Peak height 3.7 3.1 3.2 Peak height ratio 0.6 1.3 0.7 Peak area 3.6 3.1 2.5 Peak area ratio 1.0 0.8 0.8 Normalized peak area 3.3 3.5 2.6 Normalized peak area ratio 2.4 2.3 1.3
Table III. Recoveries of Aglycone Quercetin from Mulberry Leaves (n = 6)
(Reproduction with Permission from Suntornsuk et al., 2003a).
Amount added (µg/ml) Mean of amount found
(µg/ml)
Mean recoveries
(%)
% RSD
80% 79.56 79.85 100.16 0.8
100% 99.13 99.80 100.67 0.8
120% 118.70 118.76 100.05 0.7

Table IV. Regression Data of the Flavonoids in Plant Extracts
(Reproduction with Permission from Suntornsuk and Anurukvorakun, 2005).
Calculated from Linear equation Standard error Correlation coefficient
Slope Intercept (r2)
Kaempferol in C. asiaticaa
Peak area ratio (E) y = 0.0186x + 0.1513 0.031 2.719 0.9997
Peak area ratio (X) y = 0.0071x + 0.1734 0.014 1.228 0.9809
Peak height ratio (E) y = 0.0097x + 0.5312 0.024 2.211 0.9703
Peak height ratio (X) y = 0.0054x + 0.3329 0.013 1.259 0.9684
Normalized peak area ratio (E) y = 0.0215x + 0.1584 0.035 3.105 0.9996
Normalized peak area ratio (X) y = 0.0094x + 0.2086 0.018 1.587 0.9829
Kaempferol in R. hybridsa
Peak area ratio (E) y = 0.0420x + 0.3957 0.067 6.010 0.9995
Peak height ratio (E) y = 0.0323x + 0.0391 0.047 4.094 0.9902
Normalized peak area ratio (E) y = 0.0498x + 0.2058 0.079 6.973 0.9996
Rutin in Ch. odorataa
Peak area ratio (E) y = 0.0106x + 0.5639 0.025 2.309 0.9994
Peak area ratio (X) y = 0.0053x + 0.3573 0.014 1.319 0.9958
Peakheight ratio (E) y = 0.0045x + 0.6777 0.018 1.712 0.9908
Peak height ratio (X) y = 0.0012x + 0.4842 0.010 0.958 0.9909
Normalized peak area ratio (E) y = 0.0137x + 0.6858 0.032 2.940 0.9903
Normalized peak area ratio (X) y = 0.0079x + 0.4669 0.020 1.851 0.993 aLetter in parenthesis represents the internal standard used. Identification: E = ethacrynic acid, X = xanthene-9-carboxylic acid

Table V. %RSDs of Migration Times and Marker Indices of the Standard Flavonoids
(Reproduction with Permission from Suntornsuk and Anurukvorakun, 2005).
R K Q M A
%RSDs of tma 1.37 1.42 1.43 1.47 1.52 %RSDs of tc1b tc(EOF) 0.79 0.93 1.00 1.05 1.04
tc(E) 0.15 0.08 0.09 0.12 0.06
tc(X) 0.20 0.18 0.17 0.14 0.19 %RSDs of tc2c tc(EOF/E) 0.20 0.18 0.20 0.20 0.12
tc(EOF/X) 0.22 0.24 0.26 0.25 0.22
tc(E,X) 0.44 0.30 0.27 0.27 0.17
%RSDs of MId
MI(EOF/E) 0.53 0.60 0.66 0.70 0.67
MI(EOF,X) 0.50 0.57 0.63 0.67 0.64
MI(E,X) 0.30 0.24 0.23 0.22 0.14 atm = uncorrected migration time
btc1 = corrected migration time using single-marker, letters in parentheses represent the markers
ctc2 = corrected migration time using two-marker, letters in parentheses represent the markers
dMI = migration indices letters in parentheses represent the markers
Identification: R= rutin and K= kaempferol
Table VI. Recoveries, LOD and LOQ of the Flavonoids in the Plant Extracts (n = 6)
(Reproduction with Permission from Suntornsuk and Anurukvorakun, 2005).
K. in C. asiatica K. in R. hybrids R.in Ch. odorata Amount added (µg/mL) 80.0 100.0 120.0 84.0 105.0 126.0 80.8 101.0 121.2 Mean of amount found (µg/mL) 80.0 102.0 119.2 80.7 100.4 120.4 79.9 98.3 119.4 Mean recoveries (%) 100.0 102.0 99.4 96.1 95.7 95.6 98.8 97.3 98.5
%RSD 1.70 1.41 0.52 0.35 0.43 0.55 0.40 0.59 1.56
LOD (µg/mL) 0.44 2.23 1.76
LOQ (µg/mL) 1.45 7.14 4.39 Identification: R = rutin, K= kaempferol
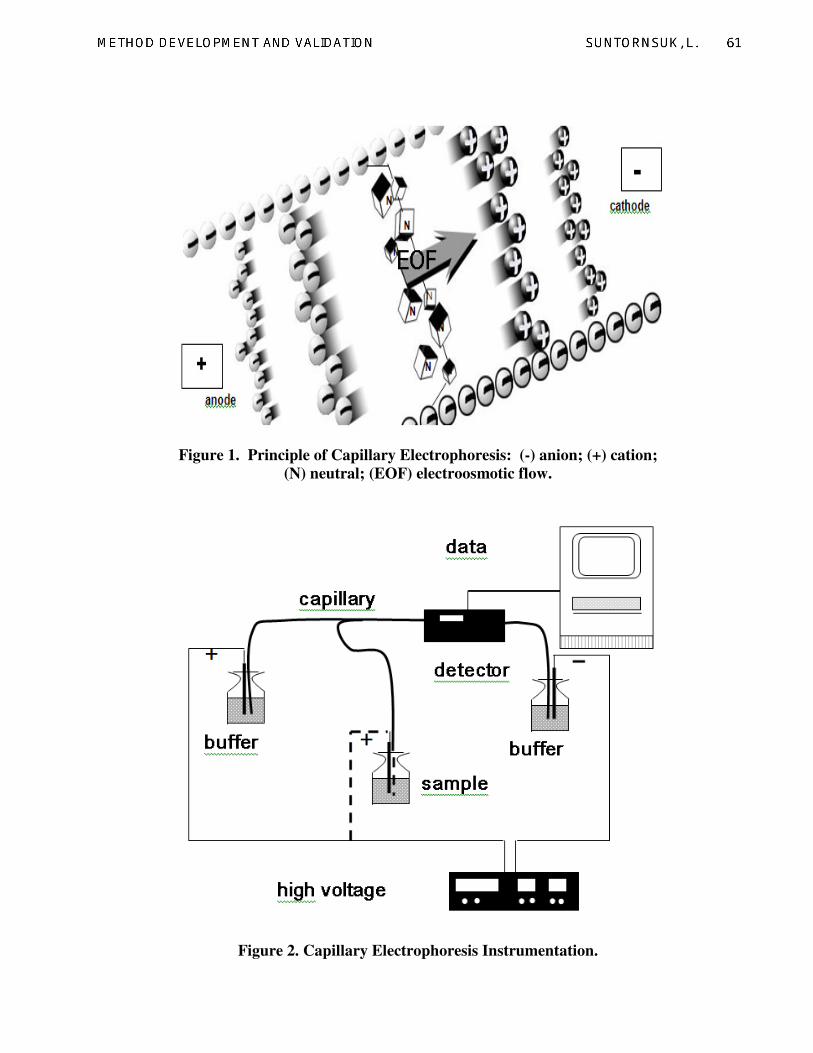
Figure 1. Principle of Capillary Electrophoresis: (-) anion; (+) cation;
(N) neutral; (EOF) electroosmotic flow.
Figure 2. Capillary Electrophoresis Instrumentation.
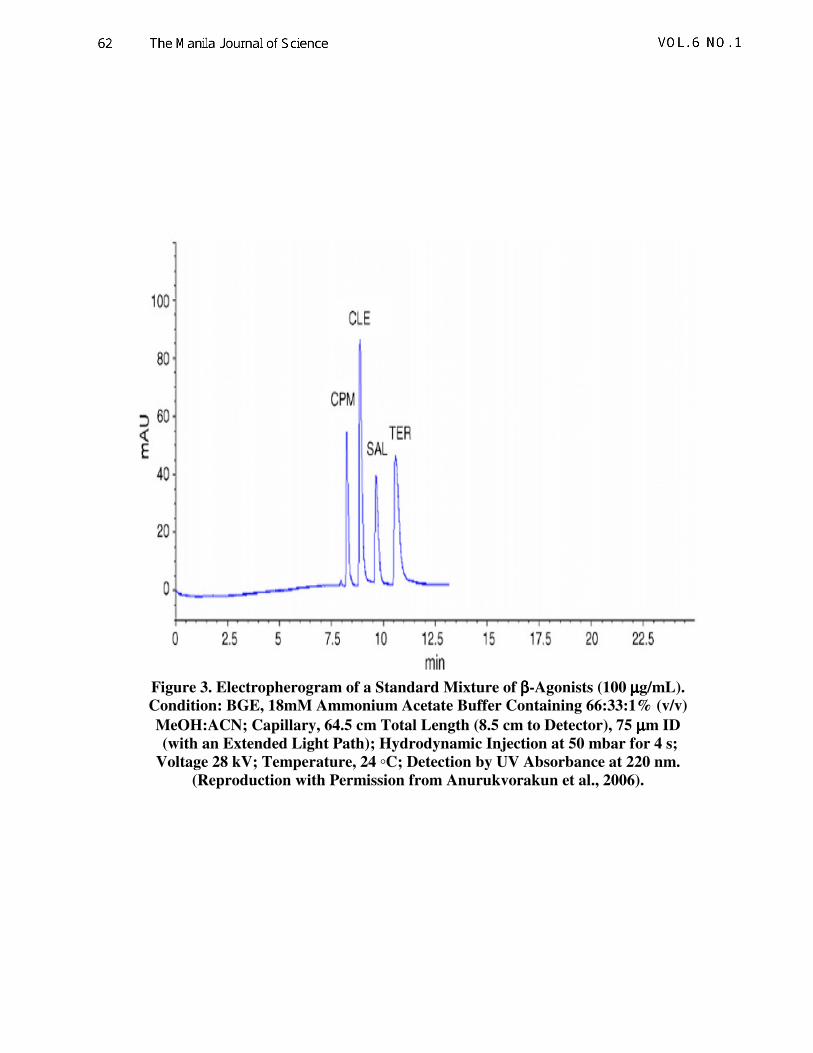
Figure 3. Electropherogram of a Standard Mixture of ββββ-Agonists (100 µµµµg/mL).
Condition: BGE, 18mM Ammonium Acetate Buffer Containing 66:33:1% (v/v)
MeOH:ACN; Capillary, 64.5 cm Total Length (8.5 cm to Detector), 75 µµµµm ID
(with an Extended Light Path); Hydrodynamic Injection at 50 mbar for 4 s;
Voltage 28 kV; Temperature, 24 ◦C; Detection by UV Absorbance at 220 nm.
(Reproduction with Permission from Anurukvorakun et al., 2006).
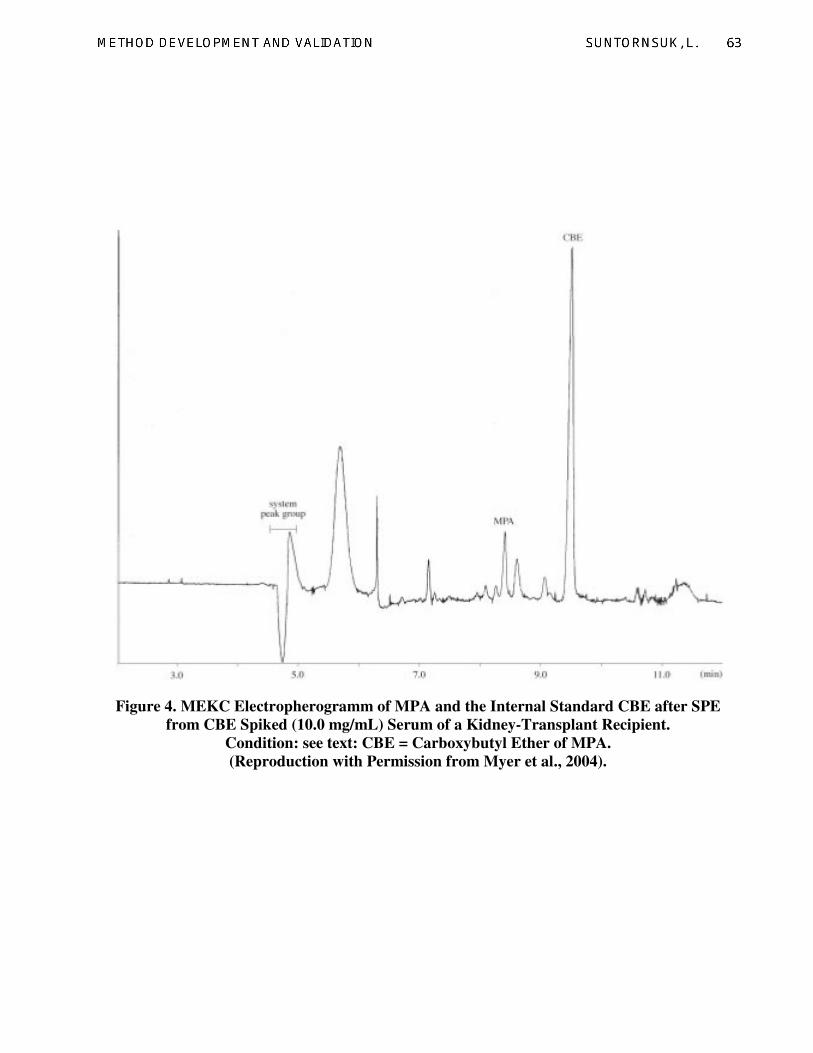
Figure 4. MEKC Electropherogramm of MPA and the Internal Standard CBE after SPE
from CBE Spiked (10.0 mg/mL) Serum of a Kidney-Transplant Recipient.
Condition: see text: CBE = Carboxybutyl Ether of MPA.
(Reproduction with Permission from Myer et al., 2004).
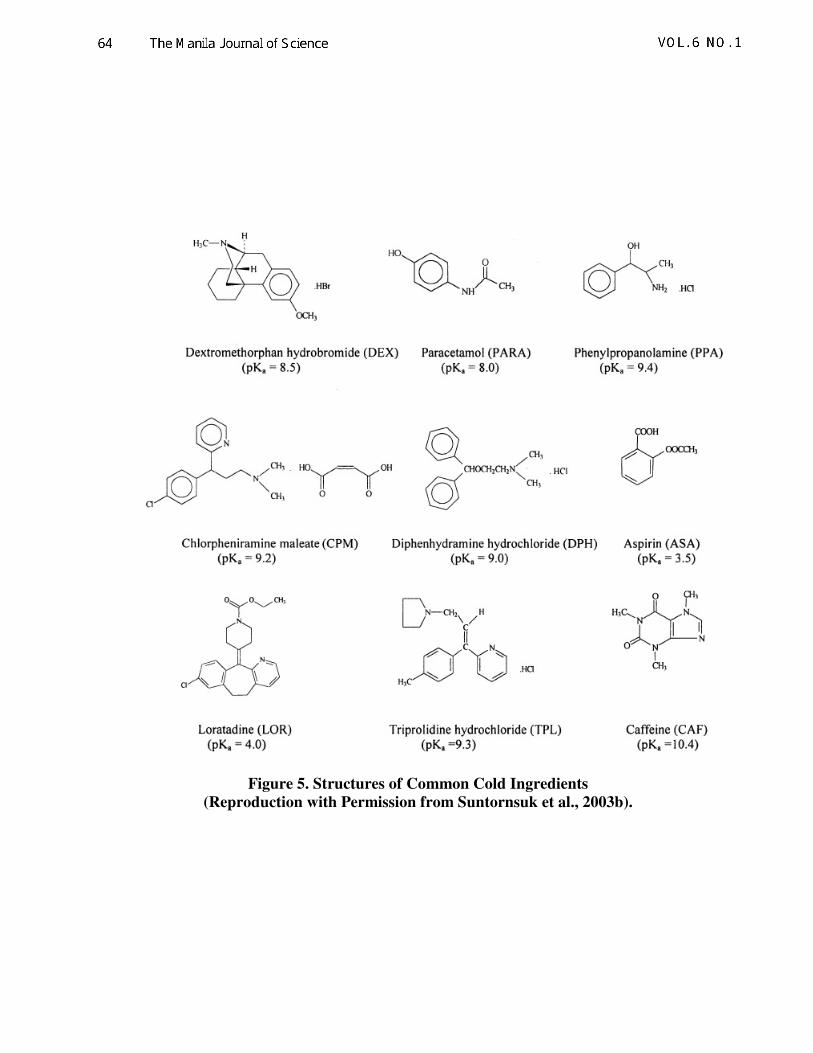
Figure 5. Structures of Common Cold Ingredients
(Reproduction with Permission from Suntornsuk et al., 2003b).

Fig. 6: A Typical Electropherogram of the Standard Mixture Solution (100 mg/ml)
under the Optimum Condition (see text). Peak Identification: (1) PPA; (2) CAF;
(3) PARA; (4) CPM; (5) DPH; (6) DEX; (7) TPL; (8) LOR; (9) ASA.
(Reproduction with Permission from Suntornsuk et al., 2003b).

Fig. 7: Structures of the Flavonoids.
(Reproduction with Permission from Suntornsuk et al., 2003a).
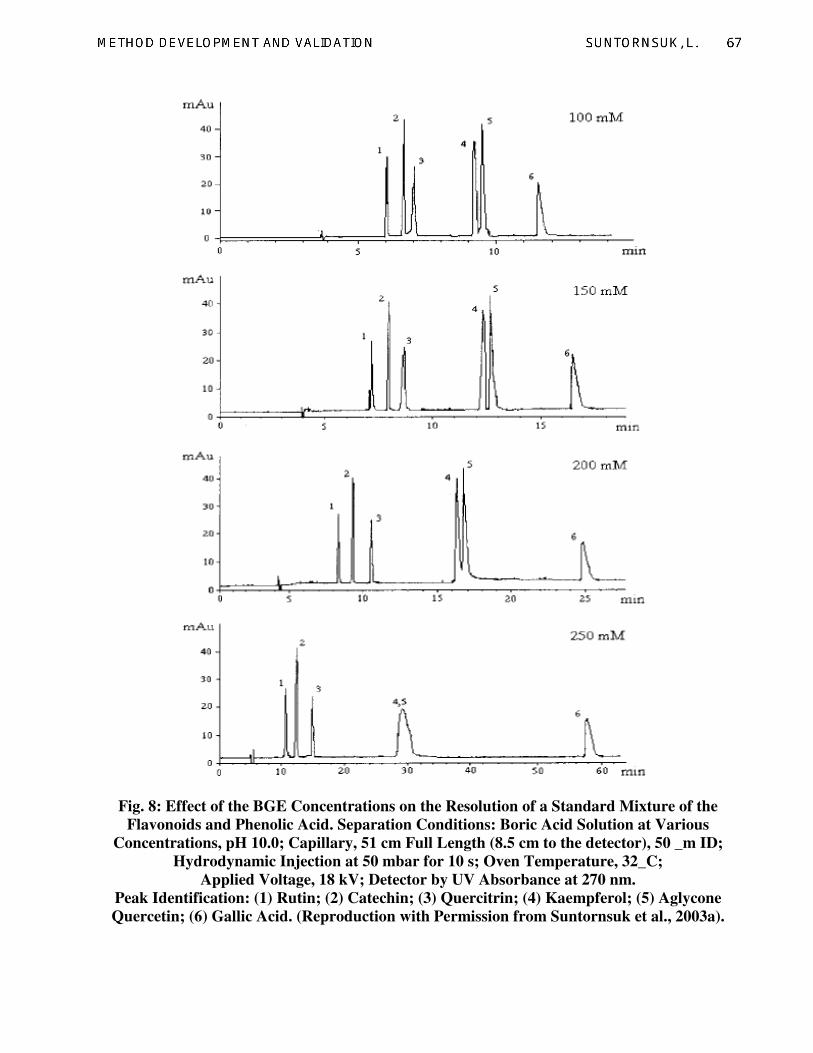
Fig. 8: Effect of the BGE Concentrations on the Resolution of a Standard Mixture of the
Flavonoids and Phenolic Acid. Separation Conditions: Boric Acid Solution at Various
Concentrations, pH 10.0; Capillary, 51 cm Full Length (8.5 cm to the detector), 50 _m ID;
Hydrodynamic Injection at 50 mbar for 10 s; Oven Temperature, 32_C;
Applied Voltage, 18 kV; Detector by UV Absorbance at 270 nm.
Peak Identification: (1) Rutin; (2) Catechin; (3) Quercitrin; (4) Kaempferol; (5) Aglycone
Quercetin; (6) Gallic Acid. (Reproduction with Permission from Suntornsuk et al., 2003a).

Fig. 9: Electropherogram of a Standard Mixture of the Flavonoids and Organic Carboxylic
Acids under the Optimized Conditions (see text). Peak Identification: (R) Rutin;
(K) Kaempferol; (Q) Quercetin; (M) Myricetin; (A) Apigenin;
(E) Ethacrynic Acid; (X) Xanthene-9-Carboxylic Acid.
(Reproduction with Permission from Suntornsuk and Anurukvorakun, 2005).

Fig. 10: Migration Times of the Flavonoids within 6 days. tm and tc1(E) are Uncorrected
Migration Times and Corrected Migration Times using E as a Marker.
(Reproduction with Permission from Suntornsuk and Anurukvorakun, 2005).