capabilities and limitations of gel electrophoresis for ... · capabilities and limitations of gel...
TRANSCRIPT
91
Pure Appl. Chem., Vol. 78, No. 1, pp. 91–103, 2006.doi:10.1351/pac200678010091© 2006 IUPAC
Capabilities and limitations of gelelectrophoresis for elemental speciation:A laboratory’s experience*
Cyrille C. Chéry†, Luc Moens, Rita Cornelis, and Frank Vanhaecke‡
Laboratory of Analytical Chemistry, Ghent University, Proeftuinstraat 86,B-9000 Ghent, Belgium
Abstract: Gel electrophoresis is a fractionation/separation technique that yields valuable in-formation in the field of metalloproteomics, often referred to as metallomics. This paper isbased on four years of practical experience of the authors’ lab in this domain and highlightsthe capabilities and limitations of gel electrophoresis. Pitfalls of the technique were recog-nized by identifying the origin of artefacts in the separation, species degradation being themost important. Gel electrophoresis can be accomplished under either native or denaturingconditions. The speciation of vanadium and selenium among serum and yeast proteins, re-spectively, is used to illustrate these two major modes. The most powerful approach is two-dimensional denaturing gel electrophoresis. This review of the methods used in our labora-tory also describes the application of the two major detection techniques, autoradiography onthe one hand and electrothermal vaporization—or laser ablation (LA)—inductively coupledplasma–mass spectrometry (ICP–MS) on the other.
Keywords: gel electrophoresis; electrothermal vaporization; laser ablation; autoradiography;vanadium; selenium; ICP–mass spectrometry; speciation.
INTRODUCTION
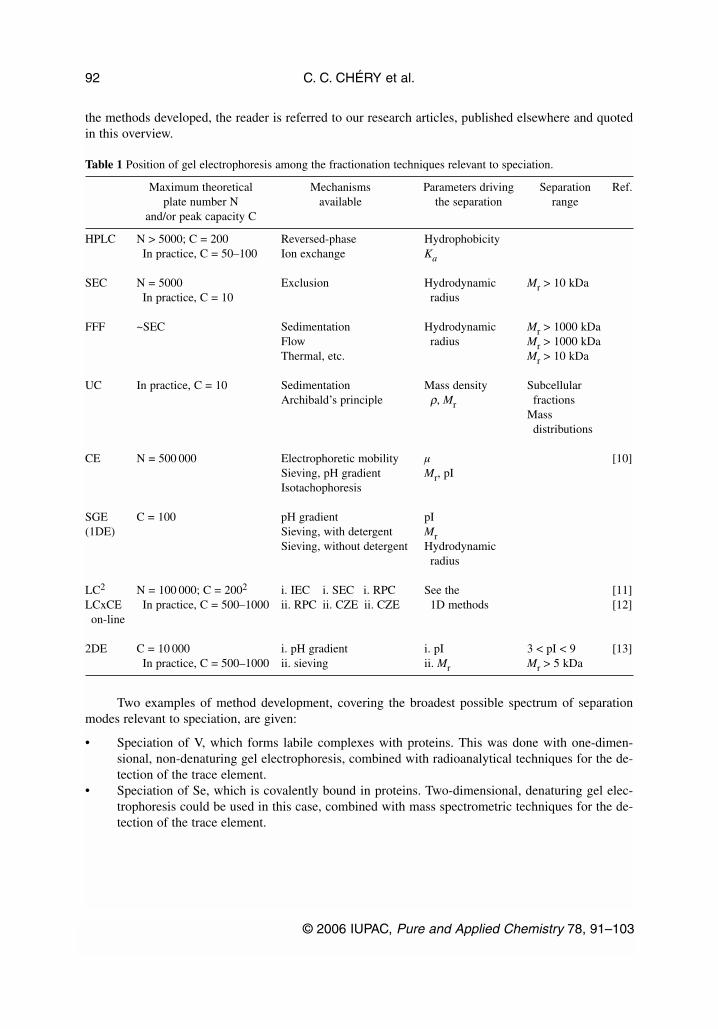
Slab gel electrophoresis (SGE), especially its two-dimensional variant, is a widely used technique in thefield of proteomics. One can speak of a real separation technique because of the high resolutionachieved with two-dimensional gel electrophoresis (2DE). To better assess the position of gel electro-phoresis amongst the fractionation techniques relevant for speciation, some characteristics of thesemethods have been summarized in Table 1. This table shows that only two-dimensional liquid chro-matography can compete with gel electrophoresis. Moreover, the former still has to be further devel-oped to be a serious alternative to 2DE in the field of proteomics.
The present article concentrates on the rationale of method development and the associated pit-falls and techniques available for detection of the trace elements in the gels. This article does not pre-tend to be an exhaustive review of gel electrophoresis for speciation nor a very detailed description ofthe work carried out at the authors’ lab. For a more detailed description of the SGE techniques andmethods available for speciation, the reader is referred to refs. [1,2] and the publications cited therein.For more comprehensive information on the research carried out at our laboratory and the validation of
*Paper based on a presentation at the 2nd International Symposium on Trace Elements in Food (TEF-2), Brussels, Belgium, 7–8October 2004. Other presentations are published in this issue, pp. 65–143.†Current address: N.V. Organon, Department of Pharmaceutics, P.O. Box 20, NL-5340 BH Oss, The Netherlands‡Corresponding author: E-mail: [email protected]
the methods developed, the reader is referred to our research articles, published elsewhere and quotedin this overview.
Table 1 Position of gel electrophoresis among the fractionation techniques relevant to speciation.
Maximum theoretical Mechanisms Parameters driving Separation Ref.plate number N available the separation range
and/or peak capacity C
HPLC N > 5000; C = 200 Reversed-phase HydrophobicityIn practice, C = 50–100 Ion exchange Ka
SEC N = 5000 Exclusion Hydrodynamic Mr > 10 kDaIn practice, C = 10 radius
FFF ~SEC Sedimentation Hydrodynamic Mr > 1000 kDaFlow radius Mr > 1000 kDaThermal, etc. Mr > 10 kDa
UC In practice, C = 10 Sedimentation Mass density Subcellular Archibald’s principle ρ, Mr fractions
Mass distributions
CE N = 500 000 Electrophoretic mobility µ [10]Sieving, pH gradient Mr, pIIsotachophoresis
SGE C = 100 pH gradient pI(1DE) Sieving, with detergent Mr
Sieving, without detergent Hydrodynamic radius
LC2 N = 100 000; C = 2002 i. IEC i. SEC i. RPC See the [11]LCxCE In practice, C = 500–1000 ii. RPC ii. CZE ii. CZE 1D methods [12]on-line
2DE C = 10 000 i. pH gradient i. pI 3 < pI < 9 [13]In practice, C = 500–1000 ii. sieving ii. Mr Mr > 5 kDa
Two examples of method development, covering the broadest possible spectrum of separationmodes relevant to speciation, are given:
• Speciation of V, which forms labile complexes with proteins. This was done with one-dimen-sional, non-denaturing gel electrophoresis, combined with radioanalytical techniques for the de-tection of the trace element.
• Speciation of Se, which is covalently bound in proteins. Two-dimensional, denaturing gel elec-trophoresis could be used in this case, combined with mass spectrometric techniques for the de-tection of the trace element.
C. C. CHÉRY et al.
© 2006 IUPAC, Pure and Applied Chemistry 78, 91–103
92
METHOD DEVELOPMENT
The importance of the first steps of the method development can hardly be overestimated. If some pre-cautions are not taken to guarantee the quality of the separation, a totally erroneous picture of the dis-tribution of the trace element can be obtained.
Contamination [3]
Although our study was not exhaustive and did not have the intention of being representative for allcommercially available gels and ready-to-use buffers and strips, a gel submitted to a “blank” separationin a clean room, with all chemicals necessary for the separation (without the staining step), was sub-jected to panoramic trace analysis via pneumatic nebulization—ICP–MS. None of the elements moni-tored (Li, V, Cr, Mn, Ni, Cu, Zn, As, Se, Mo, Pd, Ag, Cd, Pt, Tl, Pb) were found to be present abovethe detection limit. Contamination was hence not considered a limiting factor if the separation is per-formed in a strictly monitored environment, as a clean room, and with chemicals of the highest purity.Yet, it seems obvious that if the separation is not performed according to these standards or if othermore widely encountered elements, such as Ca or Fe, are considered, results should be scrutinized forcontamination.
Vanadium [4]
Native gel electrophoresis is a widely used technique, in which the tertiary structure of the proteins ispreserved. Hence, it is often applied if an enzyme has to retain its activity after separation. This is whyit is a possible separation technique for metal–protein complexes, which would be disturbed in the pres-ence of denaturing chemicals. Unfortunately, the state-of-the-art 2DE protocols rely on the use of de-naturing chemicals, which cannot be used for such complexes. For this reason, native gel electrophore-sis is limited to one-dimensional separations.
As proof-of-concept, the fractionation of serum proteins incubated with V was selected. At basalconcentration, V is transported by transferrin, forming one of the most labile metal complexes of thisprotein. However, if transferrin, previously incubated with 48V as vanadate, was submitted to native gelelectrophoresis, V was detected at the anode and was hence no longer bound to transferrin, as depictedin Fig. 1. To ensure this was not an artefact stemming from the sample preparation, the samples weresubmitted to ultrafiltration. As expected, the main V fraction was detected in the solution containingtransferrin, and not as an unbound, low-molecular-mass species.
The complex can be further stabilized during the separation, using the blue native protocol. Bluenative gel electrophoresis is a technique used for, for example, labile protein associations, reminiscentof the fragile association between metals and proteins. This was not yet sufficient to ensure a success-ful separation, since the other components of the buffers readily complexate V, disturbing the equilib-rium between bound and unbound species. At last, if all the chemicals present in the buffers were care-fully chosen for their low affinity for V-species, V was detected at the migration distance of transferrin,as shown in Fig. 2. The same distribution between bound and unbound V is found as with ultrafiltra-tion, namely, a low amount of unbound V. When applied to serum, the same result was obtained.
The lesson to be learned from this kind of experiment is that a separation protocol for proteinsalone cannot be directly extrapolated to metal–protein complexes: a careful assessment of the separa-tion parameters and especially of the chemicals used, has to take place.
© 2006 IUPAC, Pure and Applied Chemistry 78, 91–103
Speciation by gel electrophoresis 93

C. C. CHÉRY et al.
© 2006 IUPAC, Pure and Applied Chemistry 78, 91–103
94
Fig. 1 Autoradiogram of a gel obtained after the separation of a sample containing 48V as a transferrin-complex.Anode at the bottom. Although the expected species is a V-transferrin complex (marked Tf), nearly all V is detectedas low-molecular-mass species at the front. Reproduced by permission of Wiley–VCH [4].
Fig. 2 Autoradiogram of a gel obtained after blue native electrophoresis of serum (lanes S) and a sample onlycontaining transferrin (lanes Tf). In both cases, 48V is detected in combination with transferrin. Anode at thebottom, samples applied in wells, the position of which is indicated by the bold line. The same gel was later silver-stained to confirm the identity of the protein bands. Reproduced by permission of Wiley–VCH [4].
Selenium
Covalent bonding of the trace element to the protein is no assurance of stability during electrophoresiseither. Let us examine the example of Se and 2DE. Yeast was grown in the presence of 75Se-containingselenate, in a sulfur-poor medium. It is expected that Se is incorporated instead of sulfur, in a nonse-lective manner, so that it is incorporated in proteins that normally contain methionine or cysteine, thetwo sulfur-containing amino acids. After lysis of the yeast cells and purification of the proteins thus ob-tained, the proteins were submitted to the first dimension of 2DE, isoelectric focusing (IEF), a separa-tion according to pI. For the details of the experiment, the reader is referred to [5]. This separation wasdone in an immobilized pH gradient (IPG) strip, showing a linear pH gradient from pH 3 to 10.
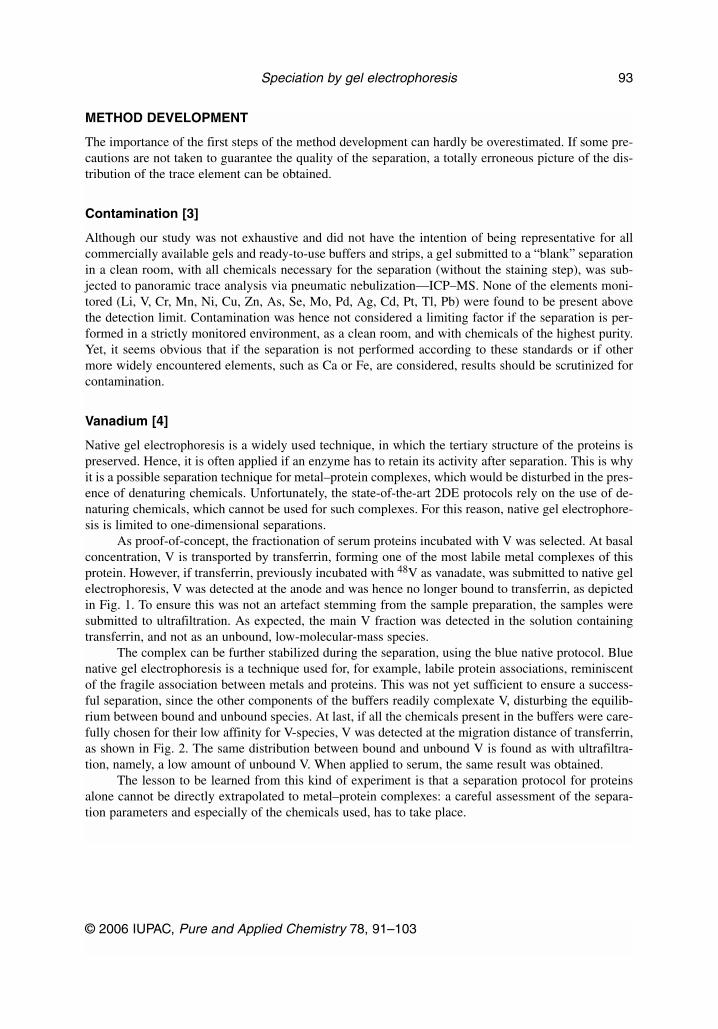
A homogeneous distribution of proteins containing 75Se is expected, which was confirmed by fil-tration and size exclusion. Yet, after separation by IEF, all radioactivity was detected at the anode (byautoradiography, see further), as shown in Fig. 3. The long separation time is probably responsible forthe acid decomposition of the side chain, leading to the formation of negatively charged inorganic Se,attracted to the anode.
In order to protect the Se side chain, a derivatization step with iodo-acetic acid was required priorto separation. This time, Se-containing proteins were detected at all pIs. The second dimension con-firmed the existence of Se-containing proteins (see autoradiography).
Conclusions on method development
The results obtained with a gel electrophoresis method should not be trusted if not previously validated.Confirmatory experiments are necessary to ensure that results yielded by gel electrophoresis are trust-worthy. It should not be overlooked that, in comparison with high-performance liquid chromatography(HPLC) or capillary electrophoresis (CE), such a separation is a lengthy process and this long durationcan jeopardize the stability of the species. A further problem, which is hardly addressed in the litera-ture, is contamination of the gels or chemicals. But this risk is often easy to avoid if precautionarymeasures are taken.
DETECTION
Two methods of detection were implemented in our laboratory: autoradiography and solid samplingICP–MS.
Autoradiography
Although some users may be scared by the implementation of a radioanalytical method, some advan-tages of autoradiography are undeniable. First, contamination is surely not an issue, unless an excess of“cold” element is present, which could disturb the distribution of the element. Second, a whole picture
© 2006 IUPAC, Pure and Applied Chemistry 78, 91–103
Speciation by gel electrophoresis 95
Fig. 3 Autoradiogram of IPG strips. Linear gradient, left pH 10, right pH 3. Above: without derivatization byiodoacetic acid, Se is detected at the anode. Underneath: after carboxymethylation using iodo-acetic acid, Se isdistributed among all proteins.
of the gel is obtained without further treatment or revelation. Further, autoradiography can be performedat low temperatures, allowing the detection of metals in a frozen gel. This can be particularly useful ifthe metal is not covalently bound to the protein and would not resist a chemical fixation (e.g., the firststeps of silver- or coomassie blue-staining) of the proteins to prevent their diffusion after separation.The relatively high spatial resolution (a pixel typically has a size of 0.5 mm2) is also interesting.
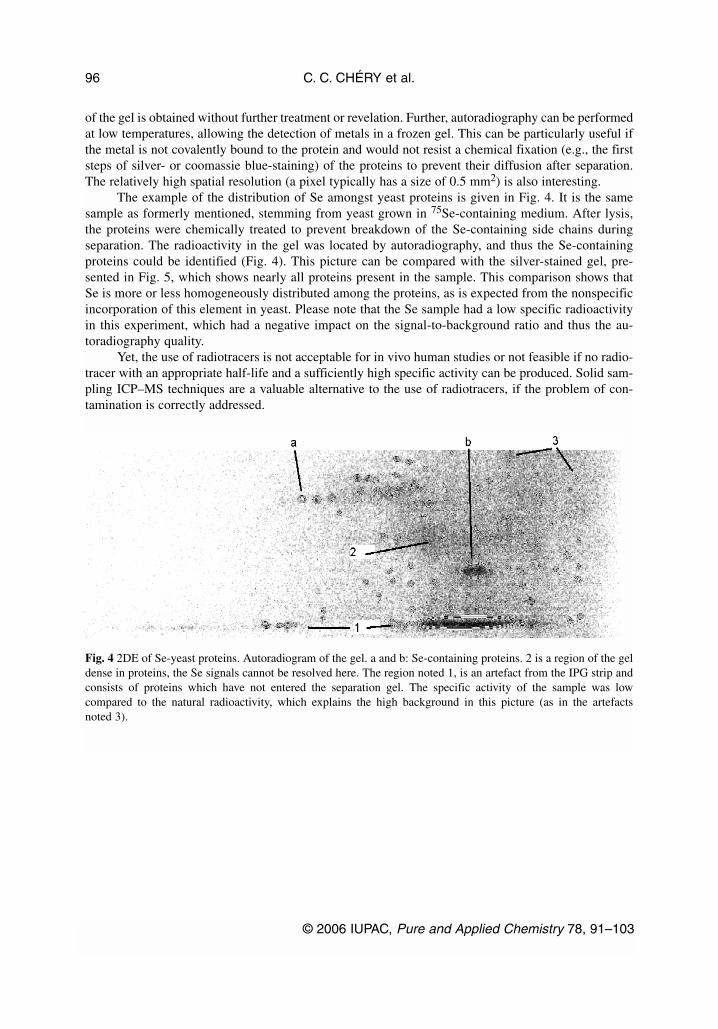
The example of the distribution of Se amongst yeast proteins is given in Fig. 4. It is the samesample as formerly mentioned, stemming from yeast grown in 75Se-containing medium. After lysis,the proteins were chemically treated to prevent breakdown of the Se-containing side chains duringseparation. The radioactivity in the gel was located by autoradiography, and thus the Se-containingproteins could be identified (Fig. 4). This picture can be compared with the silver-stained gel, pre-sented in Fig. 5, which shows nearly all proteins present in the sample. This comparison shows thatSe is more or less homogeneously distributed among the proteins, as is expected from the nonspecificincorporation of this element in yeast. Please note that the Se sample had a low specific radioactivityin this experiment, which had a negative impact on the signal-to-background ratio and thus the au-toradiography quality.
Yet, the use of radiotracers is not acceptable for in vivo human studies or not feasible if no radio-tracer with an appropriate half-life and a sufficiently high specific activity can be produced. Solid sam-pling ICP–MS techniques are a valuable alternative to the use of radiotracers, if the problem of con-tamination is correctly addressed.
C. C. CHÉRY et al.
© 2006 IUPAC, Pure and Applied Chemistry 78, 91–103
96
Fig. 4 2DE of Se-yeast proteins. Autoradiogram of the gel. a and b: Se-containing proteins. 2 is a region of the geldense in proteins, the Se signals cannot be resolved here. The region noted 1, is an artefact from the IPG strip andconsists of proteins which have not entered the separation gel. The specific activity of the sample was lowcompared to the natural radioactivity, which explains the high background in this picture (as in the artefactsnoted 3).

Electrothermal vaporization–ICP–MS [6,7]
Electrothermal vaporization (ETV)–ICP–MS is the first technique that was explored in our laboratorybecause of its excellent limits of detection, but also because it offers truly quantitative results. The avail-ability of a real blank, the gel itself, is an important advantage. With it, a real procedural limit of de-tection (LoD) can, for example, be determined. The blank model can even be further refined by usinga piece of gel hydrated with a protein solution (e.g., albumin) and subsequently stained. All chemicalsare then present, and perfectly matrix-matched standards can be used for external calibration.
The sampling strategy for ETV–ICP–MS is depicted in Fig. 6. A gel lane, in this case obtainedafter one-dimensional SDS–PAGE (sodium dodecyl sulfate–polyacrylamide gel electrophoresis) of Seyeast, is first silver-stained to reveal the protein spots. A gel lane can then be cut in two halves, paral-lel to the migration direction: one half is used for elemental analysis, the other for protein analysis. Thehalf kept for elemental analysis is then cut into subsamples in the direction of migration. This meansthat an ETV sample is one protein band, if the resolution of the SDS–PAGE is high enough. Each pro-tein band is introduced into the graphite furnace of the ETV–ICP–MS set-up for the determination ofits trace element content. The total profile can then be reconstructed from the various band measure-ments and, once again, compared with the protein profile obtained after staining. In the case of Se, itcould be proved that the method was sensitive enough for Se yeast (see Fig. 7) or even human serum(LoD: 40 pg Se per band) and offered a quantitative recovery.
This approach is sensible for a gel lane, where 20 to 30 bands are detected. The analysis lasts 2to 3 h in this case. Yet, it is not a solution for a two-dimensional gel, which should be divided into atleast hundreds of spots. For this kind of gel, laser ablation (LA) was implemented. Nonetheless, itshould be kept in mind that ETV–ICP–MS can offer quantitative results for a couple of spots even after2DE.
© 2006 IUPAC, Pure and Applied Chemistry 78, 91–103
Speciation by gel electrophoresis 97
Fig. 5 2DE of Se-yeast proteins, protein map obtained upon silver-staining of the gel depicted in Fig. 4. Only theregion of pH 3–7.7 is shown. Three protein spots were marked to facilitate comparison: a, b, and c. Proteins c areabsent from the Se map (Fig. 4) and thus are not Se-containing proteins.

Laser ablation–ICP–MS [3,8]
Compared to ETV–ICP–MS, LA–ICP–MS is a more versatile solid sampling technique. In combina-tion with gel electrophoresis, two approaches can be distinguished.
• After one-dimensional gel electrophoresis (1DE), a gel lane can be scanned in the migration di-rection. The lane is translated under the laser beam, while the trace element is monitored and thecorresponding signal intensity plotted as a function of the migration distance. In this way, an elec-tropherogram is obtained for the trace element and the data obtained can be compared with thestained gel.
• For a two-dimensional gel, single spots can be investigated. This is no longer a systematic scan-ning, but each protein spot is selectively analyzed. The analysis time for one spot is no longer than10 s, the translation to the following spot and the optical focusing on the spot takes less than 20 s,so that a typical analysis time per spot is 30 s. This allows the analysis of a whole two-dimen-sional gel in less than one day. A further advantage is that, if necessary, with the proper patternrecognition software automation is thinkable, as has been done with matrix-assisted laser desorp-tion ionization (MALDI)–MS in combination with 2DE.
C. C. CHÉRY et al.
© 2006 IUPAC, Pure and Applied Chemistry 78, 91–103
98
Fig. 6 Sampling strategy: Preparation of a gel after SDS–PAGE for solid sampling ETV–ICP–MS. Reproduced bypermission of the Royal Society of Chemistry [6].
Fig. 7 Detection of Se by ETV–ICP–MS after 1DE (SDS–PAGE) of the water-soluble fraction of Se-yeast proteins.The lanes after silver-staining of the yeast proteins (lower lane) and molecular mass markers (upper lane) are alsogiven. Cathode and application point at the left. Reproduced by permission of the Royal Society of Chemistry [6].
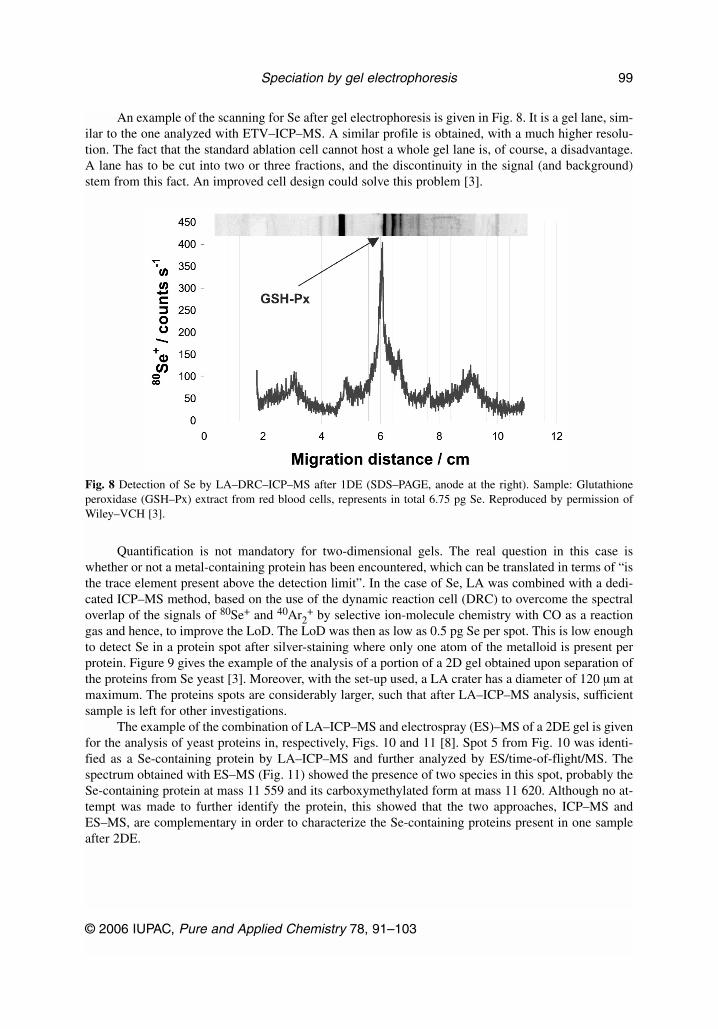
An example of the scanning for Se after gel electrophoresis is given in Fig. 8. It is a gel lane, sim-ilar to the one analyzed with ETV–ICP–MS. A similar profile is obtained, with a much higher resolu-tion. The fact that the standard ablation cell cannot host a whole gel lane is, of course, a disadvantage.A lane has to be cut into two or three fractions, and the discontinuity in the signal (and background)stem from this fact. An improved cell design could solve this problem [3].
Quantification is not mandatory for two-dimensional gels. The real question in this case iswhether or not a metal-containing protein has been encountered, which can be translated in terms of “isthe trace element present above the detection limit”. In the case of Se, LA was combined with a dedi-cated ICP–MS method, based on the use of the dynamic reaction cell (DRC) to overcome the spectraloverlap of the signals of 80Se+ and 40Ar2
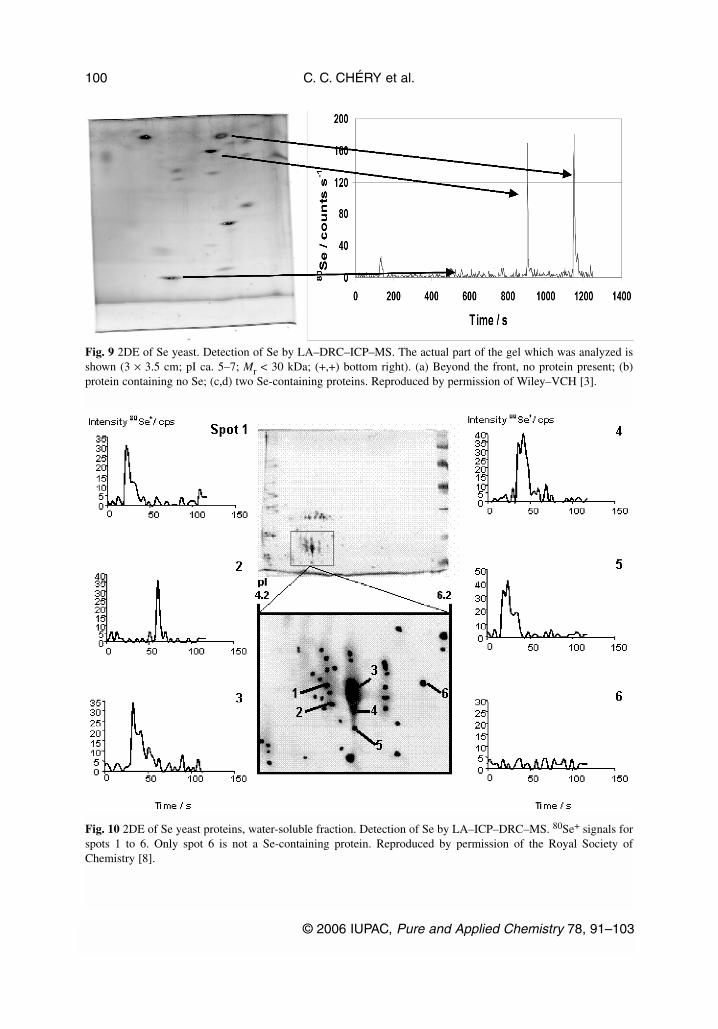
+ by selective ion-molecule chemistry with CO as a reactiongas and hence, to improve the LoD. The LoD was then as low as 0.5 pg Se per spot. This is low enoughto detect Se in a protein spot after silver-staining where only one atom of the metalloid is present perprotein. Figure 9 gives the example of the analysis of a portion of a 2D gel obtained upon separation ofthe proteins from Se yeast [3]. Moreover, with the set-up used, a LA crater has a diameter of 120 µm atmaximum. The proteins spots are considerably larger, such that after LA–ICP–MS analysis, sufficientsample is left for other investigations.
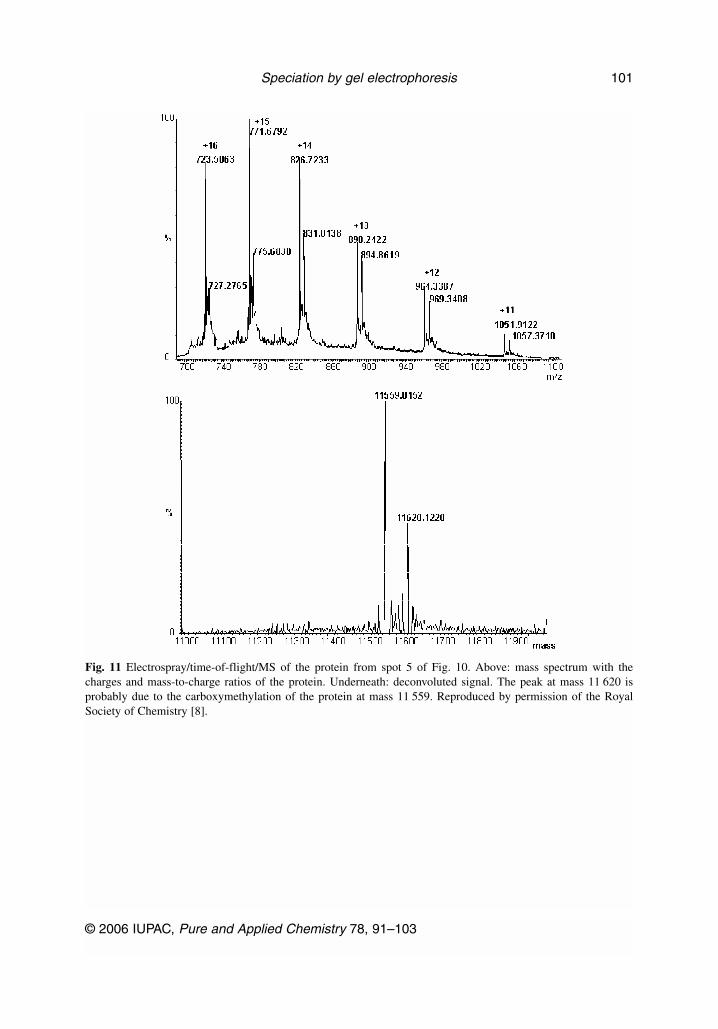
The example of the combination of LA–ICP–MS and electrospray (ES)–MS of a 2DE gel is givenfor the analysis of yeast proteins in, respectively, Figs. 10 and 11 [8]. Spot 5 from Fig. 10 was identi-fied as a Se-containing protein by LA–ICP–MS and further analyzed by ES/time-of-flight/MS. Thespectrum obtained with ES–MS (Fig. 11) showed the presence of two species in this spot, probably theSe-containing protein at mass 11 559 and its carboxymethylated form at mass 11 620. Although no at-tempt was made to further identify the protein, this showed that the two approaches, ICP–MS andES–MS, are complementary in order to characterize the Se-containing proteins present in one sampleafter 2DE.
© 2006 IUPAC, Pure and Applied Chemistry 78, 91–103
Speciation by gel electrophoresis 99
Fig. 8 Detection of Se by LA–DRC–ICP–MS after 1DE (SDS–PAGE, anode at the right). Sample: Glutathioneperoxidase (GSH–Px) extract from red blood cells, represents in total 6.75 pg Se. Reproduced by permission ofWiley–VCH [3].
C. C. CHÉRY et al.
© 2006 IUPAC, Pure and Applied Chemistry 78, 91–103
100
Fig. 9 2DE of Se yeast. Detection of Se by LA–DRC–ICP–MS. The actual part of the gel which was analyzed isshown (3 × 3.5 cm; pI ca. 5–7; Mr < 30 kDa; (+,+) bottom right). (a) Beyond the front, no protein present; (b)protein containing no Se; (c,d) two Se-containing proteins. Reproduced by permission of Wiley–VCH [3].
Fig. 10 2DE of Se yeast proteins, water-soluble fraction. Detection of Se by LA–ICP–DRC–MS. 80Se+ signals forspots 1 to 6. Only spot 6 is not a Se-containing protein. Reproduced by permission of the Royal Society ofChemistry [8].
© 2006 IUPAC, Pure and Applied Chemistry 78, 91–103
Speciation by gel electrophoresis 101
Fig. 11 Electrospray/time-of-flight/MS of the protein from spot 5 of Fig. 10. Above: mass spectrum with thecharges and mass-to-charge ratios of the protein. Underneath: deconvoluted signal. The peak at mass 11 620 isprobably due to the carboxymethylation of the protein at mass 11 559. Reproduced by permission of the RoyalSociety of Chemistry [8].

A THIRD DIMENSION? [9]
It should be noted that the material obtained after gel electrophoresis is useable for other types of analy-sis than elemental analysis or identification of the proteins. A further step can be added, like the iden-tification of the seleno-amino acids in the proteins. Indeed, a condition sine qua non to classify a pro-tein as selenoprotein, where Se is necessary for the enzymatic activity of the protein, compared to aSe-containing protein, where Se is simply incorporated instead of sulfur, is the presence of seleno-cysteine. In principle, the spots obtained by 2DE can be excised, lysed, and analyzed for their aminoacid content with CE hyphenated with DRC–ICP–MS, as this approach offers a sufficiently low ab-solute detection limit to cope with the little material available.
CONCLUSION
Although the existence of some pitfalls—such as contamination or species conversion—cannot be ig-nored, gel electrophoresis is a powerful tool for the fractionation or separation of high-molecular-masscompounds, such as metalloproteins. The two main separation modes, one- or two-dimensional, offer areal separation of the proteins. While non-denaturing 2DE still has to be further developed, denaturing2DE is already a very powerful separation technique for covalently bound elements, such as Se or evenphosphorus and sulfur. In combination with autoradiography or solid sampling–ICP–MS, gel electro-phoresis plays an important role in metalloproteomics.
ABBREVIATIONS
1DE one-dimensional gel electrophoresis2DE two-dimensional gel electrophoresisDRC dynamic reaction cellCE capillary electrophoresisES electrosprayETV electrothermal vaporizationFFF field flow fractionationGSH–Px glutathione peroxidase HPLC high-performance liquid chromatographyICP–MS inductively coupled plasma–mass spectrometryIEF isoelectric focusingLA laser ablationLoD limit of detection MALDI matrix-assisted laser desorption ionizationPAGE polyacrylamide gel electrophoresisSDS sodium dodecyl sulfateSGE slab gel electrophoresisUC ultracentrifugation
ACKNOWLEDGMENT
CCC was Postdoctoral Fellow of the Fund for Scientific Research, Flanders (Belgium) (F.W.O.,Vlaanderen) at the time this work was conducted. FV and RC acknowledge the F.W.O. for financial sup-port (research project G.0037.01 and G.0026.01, respectively).
C. C. CHÉRY et al.
© 2006 IUPAC, Pure and Applied Chemistry 78, 91–103
102

REFERENCES
1. C. C. Chéry. In Handbook of Elemental Speciation, R. Cornelis, J. Caruso, H. Crews, K.Heumann (Eds.), pp. 224–239, John Wiley, Chichester (2003).
2. R. Ma, C. W. McLeod, K. Tomlinson, R. K. Poole. Electrophoresis 25, 2469–2477 (2004).3. C. C. Chéry, D. Günther, R. Cornelis, F. Vanhaecke, L. Moens. Electrophoresis 24, 3305–3313
(2003).4. C. C. Chéry, K. De Cremer, E. Dumont, R. Cornelis, L. Moens. Electrophoresis 23, 3284–3288
(2002).5. C. C. Chéry, E. Dumont, R. Cornelis, L. Moens. Fresenius’ J. Anal. Chem. 371, 775–781 (2001).6. C. C. Chéry, H. Chassaigne, L. Verbeeck, R. Cornelis, F. Vanhaecke, L. Moens. J. Anal. At.
Spectrom. 17, 576–580 (2002).7. H. Chassaigne, C. C. Chéry, G. Bordin, A. R. J. Rodriguez. J. Chromatogr., A. 976, 409–422
(2002).8. H. Chassaigne, C. C. Chéry, G. Bordin, F. Vanhaecke. J. Anal. At. Spectrom. 19, 85–95 (2004).9. C. C. Chéry, E. Dumont, R. Cornelis, L. Moens, F. Vanhaecke. J. Anal. At. Spectrom. 20, 118–120
(2005).10. S. F. Y. Li. Capillary Electrophoresis, Elsevier, Amsterdam (1996).11. T. Wehr. LC GC Europe 16, 154–162 (2003).12. H. J. Issaq, T. P. Conrads, G. M. Janini, T. D. Veenstra. Electrophoresis 23, 3048–3061 (2002).13. P. H. O’Farrell. J. Biol. Chem. 250, 4007–4021 (1975).
© 2006 IUPAC, Pure and Applied Chemistry 78, 91–103
Speciation by gel electrophoresis 103