cap reform and development - overseas … development institute ... any discussion on the...
TRANSCRIPT

CAP reform and development
Introduction, reform options and suggestions for further research
Nicola Cantore, Jane Kennan, Sheila Page
14 May 2011
Acknowledgements
This paper is funded by the Bill & Melinda Gates Foundation. The findings and conclusions
contained within are those of the authors and do not necessarily reflect positions or policies of
the Bill & Melinda Gates Foundation.
This note has been written by Nicola Cantore, Jane Kennan and Sheila Page and includes
comments and suggestions by Alan Matthews, Dirk Willem te Velde, Chris Stevens and
Katherine Foy. The note forms part of a wider research programme on CAP reform funded by
the Gates Foundation. The paper was discussed at a workshop on 31 March 2011 in Brussels.
Overseas Development Institute
111 Westminster Bridge Road
London SE1 7JD, UK
Tel: +44 (0)20 7922 0300
Fax: +44 (0)20 7922 0399
www.odi.org.uk
Disclaimer: The views presented in this paper
are those of the author(s) and do not
necessarily represent the views of ODI or our
partners.

CAP reform and development - Introduction, reform options and suggestions for further research
i
Contents
Contents i Tables, figures & boxes ii Abbreviations iii Executive summary v
1 Introduction 1 2 The CAP: a historical description 3 2.1 The pillars of CAP 3 2.2 Recent CAP reforms 3 3 Current CAP reform options 9 3.1 The Europe 2020 Communication: summary of CAP reform options 9 3.2 Interpreting the CAP reform options 10 4 Impact of the CAP reform: what do we know? 13 4.1 Introduction 13 4.2 Import tariffs 15 4.3 Export Subsidies 16 4.4 Net safety price 16 4.5 Coupled payments 17 4.6 Farm payments 17 4.7 Pillar 2 payments 22 4.8 Switch of CAP payments from old to new EU Member States 25 4.9 Where to look for major effects of EU agricultural policy on developing countries? 25 5 Preliminary analysis of CAP reform options 29 6 Suggestions for further research 31 References 34 Appendix A 37 Appendix B: The economics behind the choice to leave the intervention price to
introduce decoupled payments 40 Appendix C: Different CAP negotiation positions 41 Appendix D: EU tariffs 42 Appendix E : Developing country exporters and importers for which highest EU
intervention product groups are most important 47 Appendix F: Inclusion of agriculture in Emissions Trading Scheme 52

CAP reform and development - Introduction, reform options and suggestions for further research
ii
Tables, figures & boxes
Tables
Table 1: Type of direct payments granted in the EU-25 – evolution 2004-2008 7 Table 2: Different options for CAP policy reform 9 Table 3: Distribution of CAP expenditures across EU countries in 2009 14 Table 4: Distribution of agricultural EU tariffs 15 Table 5: Share of total commodity specific payments by country 17 Table 6: Farm payment implementation models 18 Table 7: Distribution of Pillar 2 rural development budget on Axis 1, 2 and 3 (%) 22 Source: IFOAM (2009) 23 Table 8: The impact of soil management practices on soil organic matter (SOM) and long-run
productivity 23 Table 9: Agricultural land harvested in southern countries of Western and Eastern Europe by
product (ha) 25 Table 10: EU trade balance (exports minus imports), 2009 26 Table 11: Main developing country suppliers of product groups with the highest EU intervention
levels 27 Table E2: Developing country importers for which highest EU intervention product groups are most important
a 49
Figures
Figure 1: Changes in CAP support relating to major reforms 6 Figure 2: Moving from CAP market support to direct payments 6 Figure 3: Distribution of CAP payments between Pillars 1 and 2, by country 7 Figure 4: CAP expenditures, path over time 8 Figure 5: Export refunds for the dairy sector 16 Figure 6: Transmission channel from environment Pillar 2 interventions to developing countries24 Figure 7: GDP per capita (2000 PPP $) vs. direct payments (€ ‗000s) – a kernel non-parametric
estimation across EU Member States 30 Figure 8: GDP per capita (2000 PPP $) vs. direct payments per arable ha (€/ha) – a kernel
non-parametric estimation across EU Member States 30 Figure B1: The economics behind the non distorting effect of decoupling payments 40 Figure F1: Transmission channel from EU emissions trading scheme to developing countries 52
Boxes
Box 1: CAP and food security 11 Box 2: The effects of direct payments on EU production 19 Box 3: The effects of direct payments on developing countries 21 Box 4: Possible basis for redistribution of CAP payments within the EU 29

CAP reform and development - Introduction, reform options and suggestions for further research
iii
Abbreviations
ABBREVIATION Description
CAP Common Agricultural Policy
CGE Computable General Equilibrium
DG Agri Directorate-General for Agriculture and Rural Development
EC European Commission
EU European Union
FAO Food and Agriculture Organization
FTA Free Trade Agreement
GDP Gross Domestic Product
GE General Equilibrium
GEM World Economy Group
GTAP Global Trade Analysis Project
IFOAM International Foundation for Organic Agriculture Movements
ITC International Trade Centre
LDC Least-developed Country
MFN Most-favoured Nation
OECD Organisation for Economic Co-operation and Development
PCD Policy Coherence for Development
PE Partial Equilibrium
PPP Purchasing Power Parity
PSE Producer Support Estimate
RASE Royal Agricultural Society of England
RoW Rest of World
SAPS Single Area Payment Scheme
SOM Soil Organic Matter
SPS Single Payment Scheme
TFA Tenant Farmers‘ Association
TSE Total Support Estimate
UK United Kingdom
UNCTAD United Nations Conference on Trade and Development
US United States
WTO World Trade Organization


CAP reform and development - Introduction, reform options and suggestions for further research
v
Executive summary
This paper reviews the European Union‘s (EU‘s) Common Agricultural Policy (CAP), considers
how current CAP reform options might affect development and suggests a range of activities
that might be helpful to gain a better understanding of how the CAP, and its reform, may
affect development.
The CAP is an EU policy created to protect agriculture throughout the EU by influencing prices,
output and farmers‘ incomes. Some payments, albeit a minority, are intended to support the
production of public goods. Currently, the CAP is based on a two-pillar structure – Pillar 1 and
Pillar 2. The CAP is funded from the EU (European Commission (EC)) budget and accounts for
roughly 40% of total EU budgetary expenditure. Pillar 1 support includes both direct payments
to farmers and market management measures. Pillar 2 support focuses on improving the
structural and environmental performance of agriculture and on promoting local/rural
development. Pillar 2 also requires Member State co-financing.
The EC‘s Communication on ‗The CAP towards 2020‘ (EC, 2010a) outlined three options for the
future CAP and launched the formal debate with the other European institutions, with Member
States, with farmers and with other members of the public. CAP reform will be happening at
the same time as negotiations on the multiannual financial framework for 2014-2020 and at a
time when World Trade Organization (WTO) negotiations are addressing agricultural
protection. The legislative proposals on CAP will be tabled by the EC in November 2011,
accompanied by an impact analysis which will also cover any effects on development under
the mandate for Policy Coherence for Development (PCD).
Past CAP reform
The CAP has been reformed considerably over the past two decades. The 1992 MacSharry
reforms reduced the level of market price support and introduced direct support and gave
prices a stronger role in determining production. The Agenda 2000 reforms made a small
further reduction in market distortions and introduced an environmental focus. The 2003
reform was marked by decoupling most direct payments from production to give clearer
market signals to farmers. It also strengthened rural development policy, including a 5%
reduction in direct payments — modulation — to fund an increase in spending on rural
development. Decoupled payments are now the most important direct payments. The most
recent reform was the 2008 Health Check, which introduced short-term adjustments in the
European regulations.
These reforms have led to some major changes in practice. While the CAP budget has
remained at around €50 billion over the past 15 years, it decreased as a percentage of the EU
budget from 70% in 1985 to around 40% in 2009. The wider estimate of agricultural support
used by the Organisation for economic Co-operation and Development (OECD), the total
support estimate (TSE), was around €100 billion per annum over the period 1986-2009; the
producer support estimate (PSE) decreased as a percentage of agricultural output from 40% in
1986 to 25% in 2009. Coupled direct payments decreased from 77% of total CAP payments in
2004 to 15% in 2008; decoupled payments grew from 3% to 68% and rural payments from
15% to 18%.
Current CAP reform options
Any discussion on the development implications of CAP reform will need to start by identifying
and quantifying the CAP reform policy options. As these options have not yet been spelt out in
detail, we need to discuss possible interpretations before we examine the impact of these
options on developing countries.
Key decisions to be made about CAP reform include:

CAP reform and development - Introduction, reform options and suggestions for further research
vi
The level of overall CAP payments: it is likely there will be no major change to total
payments, but this depends on the multiannual financial framework discussions for
2014-2020;
The redistribution of direct payments (Pillar 1) across Member States: we discuss
different types of criteria for this;
Whether there should be greater targeting of the Pillar 1 payments at
environmental objectives;
The extent of any stronger focus on environmental and climate change objectives,
which could be achieved by moving away from income support and most market
measures (increases in Pillar 2 support at the expense of Pillar 1);
Extension of the menu of Pillar 2 measures to include, for example, climate change
mitigation and risk management instruments.
Effects of CAP and other agricultural policy instruments
Different CAP-related instruments have different effects on different types of countries and
products.
Import tariffs. Most-favoured nation (MFN) tariffs are still high, e.g. 54.6% for
milk, 34.6% for grains and 32.5% for meat. This is a key measure of protection not
covered by CAP reform but it is being negotiated in the Doha trade negotiations and
is affected by EU free trade agreement (FTA) negotiations. Lower tariffs would help
developing country exporters that face MFN tariffs, depending on the elasticity of
supply, but hurt consumers depending on imports of food and increase preference
erosion for countries that have trade preferences (e.g. least-developed countries
(LDCs)). The net effect of reducing these would be positive for the rest of the world
(RoW), but could be negative for some countries or groups.
Export subsidies. The EU paid €1.0 billion in export subsidies in 2008 and €650
million in 2009. These have been used most recently for dairy products; they
remain a policy option, although the EU has offered to end them as part of its Doha
offer. Developing country consumers would lose from a reduction in export
subsidies, but producers and exporters whose products have been displaced by EU
exports would gain. The net effect of removing them would be negative, but could
be positive for some countries or groups.
Intervention price. Public intervention at fixed prices remains in principle for
cereals, beef and veal, and butter and skim powder, but only for quantities fixed in
advance or at very low prices. Since 2009-2010, cereals apart from soft wheat have
not been eligible for intervention.
Coupled payments. These are an addition to the price received for EU products
and EU production will increase. The increase in demand for EU production
represents a shift from imports (because of the reduction in the EU price relative to
imports). The effects on developing countries are a reduction in net exports and
income, with an increase in real income for consumers not offsetting the fall in
income to suppliers.
Direct payments. Approximately 80% of CAP payments are made to farmers
without a direct link to current production, but with conditions which require that
the land remain usable for farming. The criteria for distribution of these payments
vary among EU countries. Direct payments will increase EU supply, but the form of
the relationship depends on farm costs. This will lead to a reduction in net EU
imports, and hence a decrease in developing country exports and lower world
prices, and hence lower costs for developing country importers of CAP-affected
products.
Pillar 2 payments. The economic effects on developing countries are unclear, as
this depends on how much these payments are related to extra spending by
farmers; the environmental implications may be positive for developing countries.

CAP reform and development - Introduction, reform options and suggestions for further research
vii
Switch of CAP payments from old to new EU Member States. If there is just a
shift between producers of the same product, there might be little effect on the
RoW, unless the amount of production affected by farm payments (the region of the
supply curve for which the farm payments determine production) varies between
old and new Member States. For this, we would need evidence on the distribution of
costs of production in each region.
Where to look for major effects of EU agricultural policy on developing
countries. The products most affected by the principal agricultural policy
instruments are dairy, meat and grains, so it is countries for which exports or
imports of these are important that will be most affected. But tracing the effects by
country and by group within country would require knowing which products see
changes and their supply and demand elasticities in the EU and in the RoW.
Suggestions for further research
1 A useful study and one that needs to be done quickly would be a literature review of
assessments of the impact of different CAP instruments on non-EU countries, to identify
how different methodologies have been used to analyse effects on EU output, trade and
prices and then the impact of these on world prices, output and income. This review
would need to cover case studies and partial equilibrium and general equilibrium models.
It could also identify any general conclusions from studies on how developing countries
are affected by changes in EU trade volumes and prices; how this might affect their
production, consumption and other economic structures; and how countries respond to
these effects. It could build on the recent general review of studies of agricultural
liberalisation by Anderson et al. (2011).
More detailed studies will be needed in the next few months on some issues. The first step
would be to agree a set of CAP reform options for simulations. Two options seem
particularly important: 1) redistribution of CAP payments from East to West; and 2)
redistribution from Pillar 1 to Pillar 2 payments.
We should then undertake a series of studies in two areas. First we need a set of specific
assessments of the development effects of CAP reform options taking into account previous
changes to CAP. And secondly, we need to examine CAP in the light of a changed context of
food price variability, food security, climate change, Europe 2020, Policy Coherence for
Development and the multi-year financial framework for EU spending over 2014 -2020.
Specific studies on development effects of CAP:
2 In order to assess the possible development effects of CAP reform options, one approach
could be to model the impact of the current CAP and of different CAP reform options on
income, growth and the environment in order to perform a quantitative evaluation of the
impact of CAP reform options on EU and developing countries. Computational general
equilibrium (CGE) models and/or econometrics could allow us to identify where there
may be significant effects, both in the EU and in developing countries. Modelling studies
exist, but these need to be updated and adapted for the current CAP reforms.
3 There is a clear need for a more thorough literature review of studies of direct payments,
followed by CGE modelling and other types of analysis to identify the nature and size of
their effects on EU production. This would mean a mapping of effects of direct payments.
4 Because of their direct impact on EU trade and prices, there is a need for a study of EU
export subsidies and export refunds (despite their lower size and the EU‘s offer in the
Doha trade negotiations to abolish export subsidies). We could look for changes in the
pattern of prices/production following export subsidies (e.g. chicken, dairy).
5 The broad agreement that there may be large effects at sector or country level means
that studies at this level are needed. Sectoral studies could cover dairy, beef, chicken,

CAP reform and development - Introduction, reform options and suggestions for further research
viii
sugar and some grains. Country studies would examine how the range of EU agricultural
policies affects a specific country. Countries could be chosen to test for various types of
difference, e.g. depending on preference or FTA schemes; composition of imports or
exports; or economic structures. Uganda has been suggested, but also Ghana,
Cameroon, Malawi or the South and Central American countries most likely to be
negatively affected. This could include household-level analysis.
The evolution of CAP in the wider context: contextual studies
6 CAP reform does not happen in isolation. We need to understand the CAP in the new
context of food security and other possible changes in public perceptions about EU
agricultural trade. If Europeans feel less secure, this might imply they want to buy ‗local‘
food. But there is also a range of other issues (e.g. the EU‘s financial framework) which
need to be explored at the same time. This study would provide contextual background
to CAP reform.
7 It is important to examine links between the CAP and commodity price volatility.
8 It could also be useful to undertake some political economy analyses. What are the
relationships of CAP reform with Doha (and regional) negotiations? How does the
example of allowing European views on the nature of food security to be reflected in the
CAP emphasis on European production for European consumption affect policy responses
in other countries? What agricultural regime in the EU would contribute most to a good
international trading and production regime? Will the new role of the European
Parliament in trade policy mean more attention to consumer concerns, such as food
quality, or to the interests of well-organised pressure groups, such as farmers, and less
emphasis on macroeconomic policy, including trade interests?
9 Would there be any effect on developing countries from greater environmental
conditionality (‗greening‘) of Pillar 1?
10 There is also a suggestion that a monitoring mechanism for future CAP changes is
needed to implement policy coherence effectively. What should this look like? How could
it identify ways to counter negative effects?

CAP reform and development - Introduction, reform options and suggestions for further research
1
1 Introduction
This note reviews the European Union‘s (EU‘s) Common Agricultural Policy (CAP), considers
current CAP reform options and suggests a range of activities that might be helpful to gain a
better understanding of how the CAP, and its reform, may affect development. The European
Commission‘s (EC‘s) proposals on the CAP do not deal with EU tariffs on agricultural goods, but
support measures under the CAP are linked inextricably to the structure of tariffs. These are
now the principal tool of agricultural policy and, by restricting entry to the EU market, they
determine the size of internal market interventions and subsidies required to attain the
objectives of the CAP. This note therefore includes these as part of existing agricultural policy.
The Europe 2020 strategy aims to offer a new perspective, and the EU must therefore pay
attention in its impact assessments to the development implications of changes in the CAP –
although it is not clear whether Policy Coherence for Development (PCD) requires the EC to
consider the impact of the CAP as a whole on development or just changes in it, or whether it
requires the EC to adjust policies on agriculture or on development assistance to respond to
any costs to development that are identified. European agricultural policy is a complex mix of
interventions on a range of products, and both the nature of the sector and the importance of
food purchases to different groups are changing in developing countries. As such, identifying
the impact on developing countries as a group, on individual countries and on particular groups
or sectors within each country is likely to give a range of answers as to the size and even the
direction of effects on economic welfare.
There may also be indirect effects (Matthews, 2011). Any impact of CAP policies on the EU‘s
position in multilateral or bilateral negotiations or on the success of these negotiations may
have effects on developing countries. The way in which the EU defines its objectives in
agriculture may also influence what other countries consider to be suitable policy approaches.
This note can describe only some of these paths without knowledge of how wide the scope of
the assessment is likely to be.
The CAP must be reformed by 2013, and any new policy must fully incorporate the most recent
EU Member States. The EC‘s Communication on ‗The CAP towards 2020‘ (EC, 2010a) outlines
three options for the future CAP and launches the debate formally with the other European
institutions, with Member States, with farmers and with other members of the public. The EC is
currently engaged in scenario analysis and is likely to present legislative proposals for reform
by November 2011. CAP reform will be happening while negotiations on financial perspectives
for 2014-2020 are ongoing (to be decided around mid-2011), with implications for its budget.
The current discussion on CAP reform covers many issues that might affect developing
countries, including size and distribution of the CAP budget; balance between Pillar 1 and
Pillar 2 funds; and types of policy instrument that will be included following CAP reform.
Any discussion on the development implications of CAP reform starts out by identifying policy
options for reform. But as these options have not yet been spelt out in detail, we need to
discuss possible interpretations before we examine their impact on developing countries. While
a literature is emerging on the impact of policy reforms on EU countries, there are few recent
studies dealing specifically with impacts on developing countries. The current project aims to
fill this gap. In this pursuit, this note is a preliminary overview of the CAP, its reform, its
potential effects and some options for a future research agenda.

CAP reform and development - Introduction, reform options and suggestions for further research
2
The structure of the note is as follows. Section 2 describes the CAP and past reforms to it.
Section 3 explains proposed CAP reform options for the period after 2013. Section 4 presents a
conceptual framework for analysing the impact of CAP reform options and wider agriculture
trade measures on developing countries. Section 5 provides a preliminary guide to data
analysis, with the aim of informing future research on the quantitative impact of CAP reform on
developing countries. Section 6 concludes with a number of possible research avenues for the
future.

CAP reform and development - Introduction, reform options and suggestions for further research
3
2 The CAP: a historical description
2.1 The pillars of CAP
The CAP1 is an EU policy created to protect agriculture throughout the EU by influencing prices,
output and farmer incomes, including subsidies to protect the rural/agricultural community. It
accounts for roughly 40% of total EU budgetary expenditure. Currently, the CAP is based on a
two-pillar structure, with each pillar funding different policies in different ways.
Pillar 1 support includes both direct payments to farmers and market management measures.
Expenditures are predetermined and funded fully by the EU; Paying Agencies are reimbursed
by the EU on an annual basis. Pillar 1 measures are set centrally and apply across the EU as a
whole. Direct payments account for around 80% of the CAP budget.
Pillar 2 support focuses on improving the structural and environmental performance of
agriculture and promoting local/rural development. It is co-financed by Member States and the
EU Budget. Expenditure is programmed at Member State/regional level and involves
multiannual commitments to beneficiaries (mainly farmers) based on the programmes that are
in place. There are three main axes in this pillar:
Axis 1: improving the competitiveness of the agriculture and forestry sector
(measures for farm modernisation, the setting up and use of advisory services,
participation in food quality schemes, adding value to agricultural and forestry
products, etc.);
Axis 2: improving the environment and the countryside (e.g. agri-environmental
programmes);
Axis 3: improving quality of life in rural areas and encouraging diversification of the
rural economy (measures for diversification into non-agricultural activities, tourism
activities, conservation and upgrading of rural heritage, etc.).
2.2 Recent CAP reforms
The CAP has undergone significant reforms since the early 1990s, with the aim of reducing
market distortions or making them more acceptable at the international level. The most
important recent steps of CAP reform can be summarised as follows.
1992. The MacSharry reforms reduced the level of market price support and introduced direct
support. These reforms included production limits to address surpluses; rural development
measures with an environmental focus; and mandatory land set-aside. The main purpose of
the MacSharry reforms was to give prices a stronger role in determining production.
1995. The World Trade Organization (WTO) Agreement on Agriculture introduced the first
international regulation of agricultural support. This required countries to reduce agricultural
support and protection by establishing disciplines in the areas of market access barriers (trade
restrictions facing imports); domestic support (subsidies and other programmes that raise
domestic agricultural prices and farm income); and export subsidies.
1 See Appendix A for a glossary of CAP terminology.

CAP reform and development - Introduction, reform options and suggestions for further research
4
2000. The Agenda 2000 reforms made a small further reduction in market distortions and
introduced an environmental focus. They encouraged single EU countries to adopt a
comprehensive rural development policy, which built on earlier reforms, and further reductions
in intervention prices, which were compensated for by direct payments.
Spending on environmental and public goods remains a minor pillar of the CAP, with much less
investment than the other pillars. As pointed out by Zahrnt (2011), less than 10% of the CAP
budget is being invested in clearly ‗green subsidies‘ during the 2007-2013 period.
2003. The 2003 reform was marked by decoupling some direct payments from production to
give clearer market signals to farmers. It also strengthened rural development policy, including
a 5% reduction in direct payments – modulation – to fund an increase in spending on rural
development. The rationale behind the introduction of decoupled payments was that, if direct
payments to farmers were not related to production, they would not be distorting (see
Appendix B). As noted below, a link remains because the payments can go only to farmers
who keep their land in ‗good agricultural condition‘, which is interpreted by the EC to mean
ready to produce.2
2008. The most recent reform was the 2008 Health Check, which introduced short-term
adjustments in European regulations. It includes the following elements (the Directorate-
General for Agriculture and Rural Development (DG Agri) describes the Health Check reforms
in detail)3:
Phasing out milk quotas: milk quotas will expire by April 2015. A ‗soft landing‘ is
ensured by increasing quotas by 1% every year between 2009/10 and 2013/14.
Decoupling of support: the 2003 CAP reform ‗decoupled‘ most direct aid to
farmers, i.e. payments were no longer linked to the production of a specific
product. However, some Member States chose to maintain some ‗coupled‘ – i.e.
production-linked – payments. These must now be decoupled and moved into the
Single Payment Scheme (SPS), with the exception of suckler cow, goat and sheep
premia, for which Member States may maintain current levels of coupled support.
Assistance to sectors with special problems (so-called Article 68
measures): currently, Member States may retain by sector 10% of their national
budget ceilings for direct payments for use for environmental measures or
improving the quality and marketing of products in that sector. This possibility will
become more flexible. Funds will no longer have to be used in the same sector:
they may be used to help farmers producing milk, beef, goat and sheep meat and
rice in disadvantaged regions or carrying out vulnerable types of farming; they may
also be used to support risk management measures such as insurance schemes for
natural disasters and mutual funds for animal diseases. Countries operating the
Single Area Payment Scheme (SAPS) system will also become eligible for the
scheme.
2 To claim under the SPS farmers must hold SPS entitlements. They must also have an eligible hectare of land for each entitlement they decide to claim payment on and this land must be at their disposal on 15 May of the scheme year. They do not need to undertake any agricultural production in order to receive the SPS payment but, whether or not they produce, they will still need to comply with EU standards covering public, animal and plant health, environmental and animal welfare (known as ‘cross-compliance’) on all agricultural land (whether they claim on this land or not). SAPS is a simplified scheme and was proposed for the new Member States, ten of which have implemented it. It involves the payment of uniform amounts per eligible hectare of agricultural land, up to a national ceiling laid down in the Accession Agreements. 3 http://ec.europa.eu/agriculture/healthcheck/index_en.htm).

CAP reform and development - Introduction, reform options and suggestions for further research
5
Extending SAPS: EU members applying the simplified SAPS will be allowed to
continue to do so until 2013 instead of being forced into the SPS by 2010.
Additional funding for EU-12 farmers (traditional Member States): €90
million will be allocated to the EU-12 to make it easier for them to make use of
Article 68 until direct payments to their farmers have been fully phased in.
Using currently unspent money: Member States applying the SPS will be
allowed either to use currently unused money from their national envelope for
Article 68 measures or to transfer it into the Rural Development Fund.
Shifting money from direct aid to rural development: Currently, all farmers
receiving more than €5,000 in direct aid have their payments reduced by 5% and
the money is transferred into the rural development budget. This rate will be
increased to 10% by 2012. An additional cut of 4% will be made on payments
above €300,000 a year. The funding obtained this way may be used by Member
States to reinforce programmes in the fields of climate change, renewable energy,
water management, biodiversity, innovation linked to the previous four points and
accompanying measures in the dairy sector. This money will be co-financed by the
EU at a rate of 75% and 90% in convergence regions where average gross
domestic product (GDP) is lower.
Abolition of set-aside: The requirement for arable farmers to leave 10% of their
land fallow has been abolished. This will allow them to maximise their production
potential.
Two conditions (‘cross compliance’) related to environmental protection:
Under Good Agricultural and Environmental Condition, all farmers claiming direct
payments, whether or not they actually produce from their land, must abide by
standards to be established by the Member States. Under Statutory Management
Requirements, farmers must comply with EU Directives and Regulations
relating to
the protection of the environment; public, animal and plant health; and animal
welfare.
Intervention mechanisms: Market supply measures should not slow farmers‘
ability to respond to market signals. Intervention will be abolished for pig meat and
set at zero for barley and sorghum. For wheat, intervention purchases will be
possible during the intervention period at the price of €101.31/tonne up to 3 million
tonnes. Beyond that, it will be done by tender. For butter and skimmed milk
powder, limits will be 30,000 tonnes and 109,000 tonnes, respectively, beyond
which intervention will be by tender.
Other measures: A series of small support schemes will be decoupled and shifted
to the SPS from 2012. The energy crop premium will be abolished.
Investment aid for young farmers: Investment aid for young farmers under
rural development will be increased from €55,000 to €70,000.
The above reforms have made substantial changes in the structure of the CAP. Figures 1, 2
and 3 show respectively changes in the CAP‘s structure, the fall in the importance of market
mechanisms in Pillar 1 and the ways in which different member countries have chosen to
distribute Pillar 1 and Pillar 2 funds. Table 1 shows the change in direct payments from coupled
to decoupled support.

CAP reform and development - Introduction, reform options and suggestions for further research
6
Figure 1: Changes in CAP support relating to major reforms
Source: HSBC Forward Planning 2010 (www.hsbc.co.uk/), also summarised in RASE (2010)
Figure 2: Moving from CAP market support to direct payments
Source: DG Agri
CAP reform and development - Introduction, reform options and suggestions for further research
7
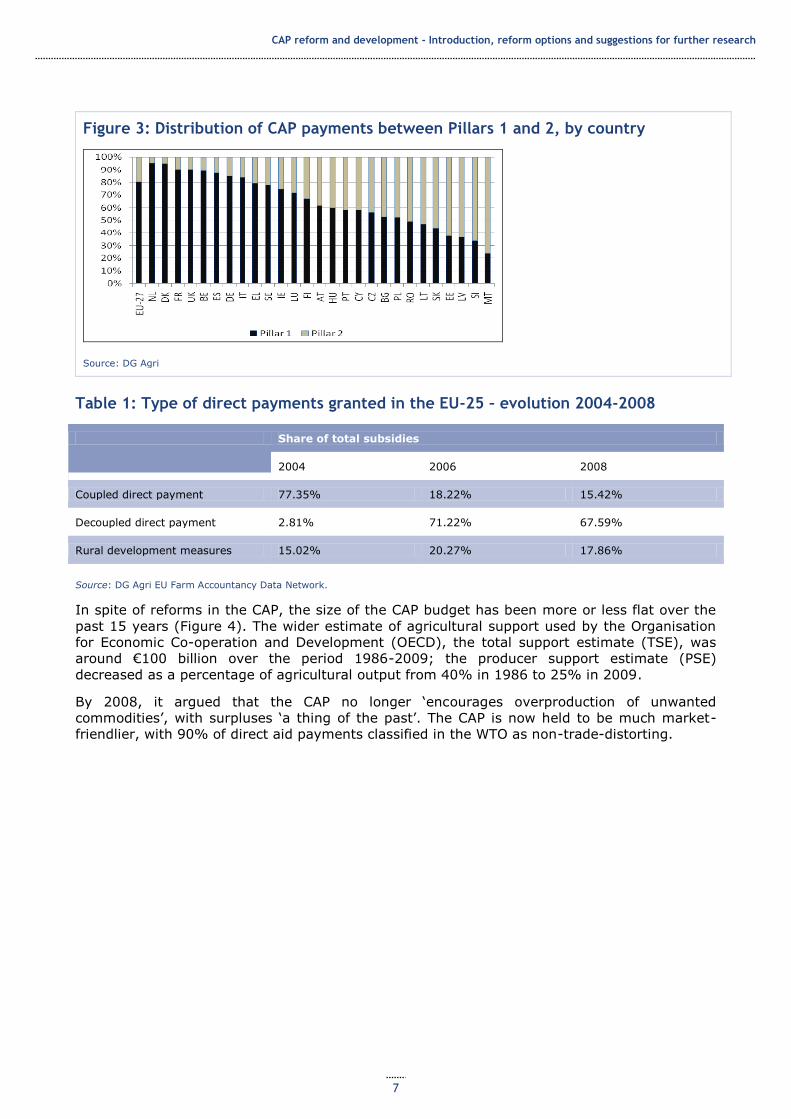
Figure 3: Distribution of CAP payments between Pillars 1 and 2, by country
Source: DG Agri
Table 1: Type of direct payments granted in the EU-25 – evolution 2004-2008
Share of total subsidies
2004 2006 2008
Coupled direct payment 77.35% 18.22% 15.42%
Decoupled direct payment 2.81% 71.22% 67.59%
Rural development measures 15.02% 20.27% 17.86%
Source: DG Agri EU Farm Accountancy Data Network.
In spite of reforms in the CAP, the size of the CAP budget has been more or less flat over the
past 15 years (Figure 4). The wider estimate of agricultural support used by the Organisation
for Economic Co-operation and Development (OECD), the total support estimate (TSE), was
around €100 billion over the period 1986-2009; the producer support estimate (PSE)
decreased as a percentage of agricultural output from 40% in 1986 to 25% in 2009.
By 2008, it argued that the CAP no longer ‗encourages overproduction of unwanted
commodities‘, with surpluses ‗a thing of the past‘. The CAP is now held to be much market-
friendlier, with 90% of direct aid payments classified in the WTO as non-trade-distorting.

CAP reform and development - Introduction, reform options and suggestions for further research
8
Figure 4: CAP expenditures, path over time
Source: DG Agri

CAP reform and development - Introduction, reform options and suggestions for further research
9
3 Current CAP reform options
3.1 The Europe 2020 Communication: summary of CAP reform options
In 2010, the EC issued a memorandum setting out its perspectives on the external effects of
the CAP (EC, 2010a). This discusses possible CAP reform options concerning Pillar 1 and Pillar
2. Table 2 summarises the reform options.
Table 2: Different options for CAP policy reform
Direct payments Market measures Rural development
Option 1 Introduce more equity in the distribution of direct payments between Member States (while leaving unchanged the current direct payment system).
Strengthen risk management tools. Streamline and simplify existing market instruments where appropriate.
Maintain the Health Check orientation of increasing funding to meet the challenges related to climate change, water, biodiversity and renewable energy and innovation.
Option 2 Introduce more equity in the distribution of direct payments between Member States and a substantial change in their design. Direct payments would be composed of:
A basic rate serving as income support; Compulsory additional aid for specific ‗greening‘ public goods through simple, generalised, annual and non-contractual agri-environmental actions based on the supplementary costs for carrying out these actions; An additional payment to compensate for specific natural constraints; and A voluntary coupled support component for specific sectors and regions.1 Introduce a new scheme for small farms. Introduce a capping of the basic rate, while also considering the contribution of large farms to rural employment.
Improve and simplify existing market instruments where appropriate.
Adjust and complement existing instruments to be better aligned with EU priorities, with support focused on environment, climate change and/or restructuring and innovation, and to enhance regional/local initiatives. Strengthen existing risk
management tools and introduce an optional WTO green box compatible income stabilisation tool to compensate for substantial income losses. Some redistribution of funds between Member States based on objective criteria could be envisaged.
Option 3
Phase out direct payments in their current form. Provide instead limited payments for environmental public goods and additional specific natural constraints payments.
Abolish all market measures, with the potential exception of disturbance clauses that could be activated in times of severe crisis.
The measures would be focused mainly on climate change and environment aspects.
Source: EC (2010a).

CAP reform and development - Introduction, reform options and suggestions for further research
10
3.2 Interpreting the CAP reform options
There are challenges in interpreting the CAP reform options. The EC‘s Communication (2010a)
and the Background Paper to the EC paper on CAP reform (2010b) indicate what DG Agri
considers to be the assumptions and objectives that will guide any reform, and can therefore
be used to guide expectations about what the effects of the reform will be – whatever option is
chosen and whatever policy instruments are used to implement it. The EC assumes there is
some ‗share‘ of world food demand which the EU should meet (‘the EU should be able to
contribute to world food demand’, emphasis in the original, Communication p4). It also
argues for preserving farming in order ‗to maintain viable rural communities‘ (Communication
p2) and because it assumes that ‗the agri-food value chain‘ must be protected and that only
agricultural production within the EU can be a basis for this (Communication p3). In order to
achieve total agricultural production at the level necessary for these objectives, it assumes
(probably correctly) that some support must still be given to farmers ‗who really need it‘
(Background Paper p2), and its three reform options are all intended to provide this. This
implies that, under any of them, the EC wants and expects production in the EU to be
maintained above the level that would be consistent with a market, no-intervention, outcome,
and therefore that production outside the EU will be lower than in the absence of the CAP.
In addition to the inefficiency at world level this implies, the DG Agri documents accept
inefficiency in the distribution of agriculture within the EU. They emphasise that food
production must take place throughout the EU (Background Paper p2 ‗maintaining agriculture
throughout Europe‘, Communication p2 ‗food production […] throughout the EU‘, p6 ‗across the
whole European Union‘, ‗throughout Europe‘), and one argument used against reducing total
support for agriculture is that this ‗would lead to greater concentration of agricultural
production in some areas with particularly favourable conditions‘ (Communication p4). An
outcome which supports food production in areas that are not suitable for it, even relative to
other areas within the EU (Communication p7 ‗in areas with specific natural constraints‘), does
not directly reduce production in the rest of the world (RoW) but, reinforcing the inefficiency
created by excess agricultural production, it reduces EU income and therefore aggregate EU
demand for RoW products with further negative effects on RoW income.
Previous reforms introduced direct payments on the basis of historical and/or regionalised
options, with the aim of avoiding directly distorting decisions on the total production or choice
of product by farmers. The Communication implies some reversal of this, with payments to be
only to ‗active farmers‘ (undefined, but intended to exclude some current recipients), basing
this partly on the argument that it is necessary to preserve rural communities on farms. This
argument also suggests a willingness to accept continued distortions in production.
The sections in the EC documents on rural development or environmental practices are much
less precise than those on maintaining production and the income of farmers (Background
Paper p2 ‗there is as yet no exhaustive list of agricultural practices which will be supported
under the ―green‖ component of direct payments‘, for example), further confirming the
impression that the principal objectives are food production and farmer income.
Another motive for intervention (EC, 2010b, p1) is ‗combating the excessive volatility of the
prices of agricultural raw materials‘. The Background Paper does not define ‗excessive‘ and
does not explain why it considers intervention in just one part of world production likely to
reduce volatility.
CAP reform and development - Introduction, reform options and suggestions for further research
11
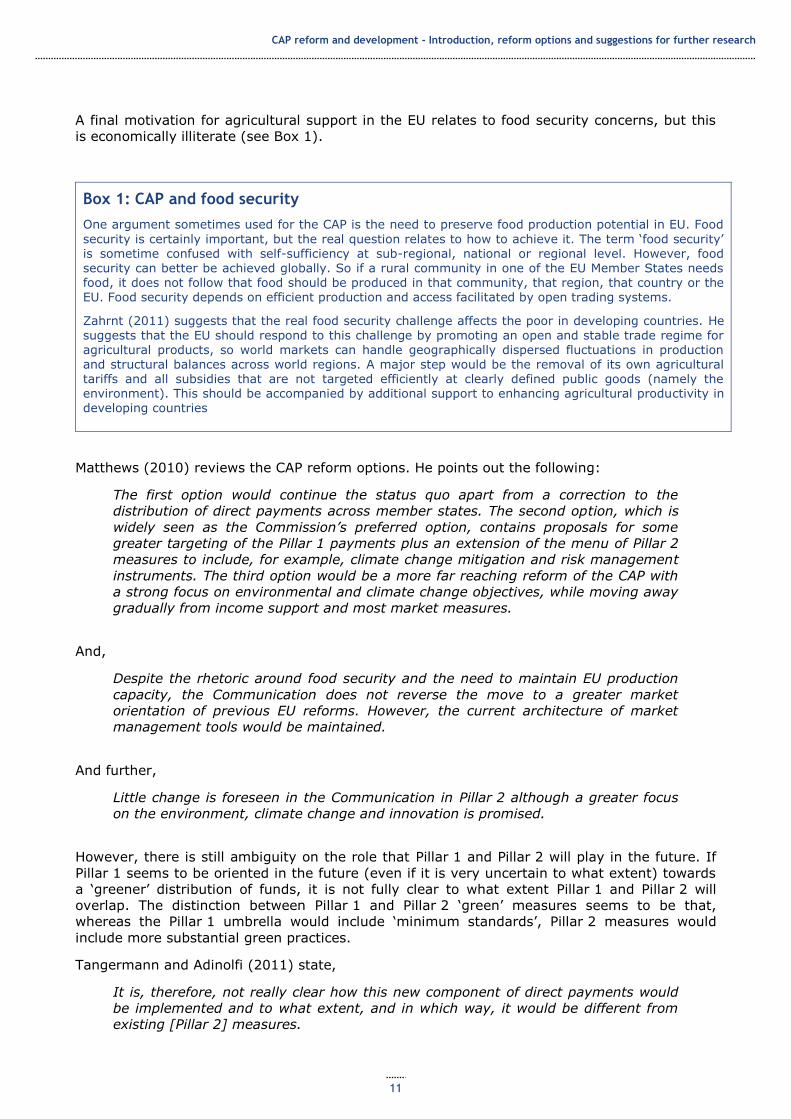
A final motivation for agricultural support in the EU relates to food security concerns, but this
is economically illiterate (see Box 1).
Box 1: CAP and food security
One argument sometimes used for the CAP is the need to preserve food production potential in EU. Food
security is certainly important, but the real question relates to how to achieve it. The term ‗food security‘ is sometime confused with self-sufficiency at sub-regional, national or regional level. However, food security can better be achieved globally. So if a rural community in one of the EU Member States needs food, it does not follow that food should be produced in that community, that region, that country or the EU. Food security depends on efficient production and access facilitated by open trading systems.
Zahrnt (2011) suggests that the real food security challenge affects the poor in developing countries. He
suggests that the EU should respond to this challenge by promoting an open and stable trade regime for agricultural products, so world markets can handle geographically dispersed fluctuations in production and structural balances across world regions. A major step would be the removal of its own agricultural tariffs and all subsidies that are not targeted efficiently at clearly defined public goods (namely the environment). This should be accompanied by additional support to enhancing agricultural productivity in developing countries
Matthews (2010) reviews the CAP reform options. He points out the following:
The first option would continue the status quo apart from a correction to the
distribution of direct payments across member states. The second option, which is
widely seen as the Commission’s preferred option, contains proposals for some
greater targeting of the Pillar 1 payments plus an extension of the menu of Pillar 2
measures to include, for example, climate change mitigation and risk management
instruments. The third option would be a more far reaching reform of the CAP with
a strong focus on environmental and climate change objectives, while moving away
gradually from income support and most market measures.
And,
Despite the rhetoric around food security and the need to maintain EU production
capacity, the Communication does not reverse the move to a greater market
orientation of previous EU reforms. However, the current architecture of market
management tools would be maintained.
And further,
Little change is foreseen in the Communication in Pillar 2 although a greater focus
on the environment, climate change and innovation is promised.
However, there is still ambiguity on the role that Pillar 1 and Pillar 2 will play in the future. If
Pillar 1 seems to be oriented in the future (even if it is very uncertain to what extent) towards
a ‗greener‘ distribution of funds, it is not fully clear to what extent Pillar 1 and Pillar 2 will
overlap. The distinction between Pillar 1 and Pillar 2 ‗green‘ measures seems to be that,
whereas the Pillar 1 umbrella would include ‗minimum standards‘, Pillar 2 measures would
include more substantial green practices.
Tangermann and Adinolfi (2011) state,
It is, therefore, not really clear how this new component of direct payments would
be implemented and to what extent, and in which way, it would be different from
existing [Pillar 2] measures.

CAP reform and development - Introduction, reform options and suggestions for further research
12
Tangermann and Adinolfi (2011) also point out that,
Good agricultural and environmental condition is an obligatory minimum
requirement for all farmers to attain. It should not be confused with the higher
standards (‘good agricultural practices’) involved in voluntary agri-environment
schemes (within rural development measures), where farmers may receive a
payment for providing environmental services which go beyond basic mandatory
legal standards
Matthews (2010) also points out that the reforms would introduce environmental and other
compliance standards in the new Member States:
The Communication also proposes greater targeting: basic income support would
be provided by a uniform decoupled direct payment to all farmers in a Member
State or region, based on transferable entitlements that need to be activated by
matching them with eligible agricultural land, and with eligibility also dependent on
fulfilling cross-compliance requirements. The current EU direct payments financing
mechanism includes the SPS operating in 15 EU Member States and Slovenia
(which feeds the EC Communication proposal) and the SAPS operating in new
Member States which does not require cross-compliance requirements.
As Options 1 and 2 provide for a shift of payments from old to new Member States, any such
effect would be magnified.
The EU has not yet reached a decision on the reforms. Appendix C provides some indications
of Member States‘ negotiating positions.

CAP reform and development - Introduction, reform options and suggestions for further research
13
4 Impact of the CAP reform: what do we know?
4.1 Introduction
The EU‘s interventions under the CAP are intended, on balance:
To increase the incomes of European farmers;
To keep farmers and farms which would otherwise be uneconomic in production;4
To promote environmental or rural development objectives; and
To stabilise the European food market.
Achieving the second objective necessarily implies raising European output above the level in
the absence of policy intervention; most policies for the first in practice keep European output
above non-intervention levels. Interventions for non-farming objectives could be designed to
have no effect on output, but in practice may affect it, and this is the subject of major debate.
European production is therefore raised to a level higher than in the absence of intervention.
Some of this may be consumed in Europe (if the increase in supply is associated with a
reduction in prices), but most policy interventions affect supply more than demand, and thus
reduce net imports or increase net exports, leading to effects on the RoW. Although there are
some positive economic effects on the RoW (e.g. if lower net EU demand leads to lower
prices, this will increase consumers‘ real income), the balance of effects of most of the policies
is negative because effects on production, and therefore income, of lower demand are greater
than those of lower prices. The effects will vary by country depending on their trade
structures. How these effects are distributed within the EU and among different non-EU
countries depends on supply and demand patterns for each product and then on the total
effects of all product interventions on each country.
These direct effects are not the only ones on the RoW: interventions which are variable (to
meet the objective of reducing the effect of world fluctuations on EU farmers) will increase the
size of fluctuations in the RoW.
This section identifies the paths through which each type of intervention acts on EU production
and prices for an individual product, and therefore on production, prices and income for that
product in the RoW, and indicates what determines the size of these effects. The total effect on
the RoW would be the sum of the effects for all products and all interventions.
The direction and distribution of effects within the EU can also be traced. In aggregate,
increases in income for farmers reduce the income of the rest of the population, through
higher prices for EU or imported production; through higher taxation to make the CAP
payments (significant, at 40% of total EU spending); and through efficiency costs to the EU
and to the RoW as a result of the interventions. The CAP reduces output and income in non-
agricultural sectors of the EU, including manufacturing and services. These effects also affect
the RoW, and a general model could estimate them.
The EU countries with the highest rural populations5 in 2007 were France, Germany, Italy and
Poland (all above 10%), followed by Romania at 8%; all others had 5% or lower. The countries
with the highest income from CAP expenditure were the first four plus Spain and the UK (Table
3). Any reduction in the use of CAP policy instruments could decrease these effects, and any
change in the composition of CAP spending could affect different products or regions
4 ‗OBJECTIVES OF THE FUTURE CAP […] Objective 1: Viable food production […] to compensate for production
difficulties in areas with specific natural constraints because such regions are at increased risk of land abandonment‘ (EC, 2010a: 7) . Emphasis in original. 5 If we consider as a relevant variable agricultural employment share, those with the highest shares in 2004 were
Poland (20%), Greece (15%), Romania (12%), Portugal (11%) and Latvia (11%) according to the World Resource Institute dataset.

CAP reform and development - Introduction, reform options and suggestions for further research
14
differently. A switch to Pillar 2 payments could reduce net effects, if they do no more than
meet extra environmental or rural development costs.
Table 3: Distribution of CAP expenditures across EU countries in 2009
Value (€ ‘000s) Share of total (%)
Belgium 958,185.5 1.6
Bulgaria 684,725.2 1.1
Czech Republic 966,485.6 1.6
Denmark 1,142,567.2 1.9
Germany 7,579,784.6 12.6
Estonia 155,351.1 0.3
Ireland 1,681,996.4 2.8
Greece 3,139,214.1 5.2
Spain 7,544,263.0 12.5
France 10,445,075.0 17.4
Italy 6,332,433.0 10.5
Cyprus 62,709.9 0.1
Latvia 260,610.1 0.4
Lithuania 484,976.8 0.8
Luxembourg 48,569.9 0.1
Hungary 1,504,905.0 2.5
Malta 14,877.7 0.0
Netherlands 1,268,347.6 2.1
Austria 1,358,127.3 2.3
Poland 4,008,617.7 6.7
Portugal 1,311,939.0 2.2
Romania 2,105,593.3 3.5
Slovenia 241,049.7 0.4
Slovakia 556,870.5 0.9
Finland 922,241.0 1.5
Sweden 1,046,855.2 1.7
UK 4,264,956.3 7.1
EU 60,120,352.9 100.0
Source: EC (2011).
CAP reform and development - Introduction, reform options and suggestions for further research
15
The following subsections examine the effects of different types of trade-related policy
intervention in EU agriculture on developing countries:
Import tariffs;
Export subsidies;
Net safety price;
Coupled payments;
Farm payments;
Pillar 2 payments.
The allocation of payments between old and new Member States.
All the instruments are designed to meet the EU‘s objectives of assisting EU agriculture sector
and therefore all potentially reduce the net income of the RoW, although some individual
countries or groups may gain.
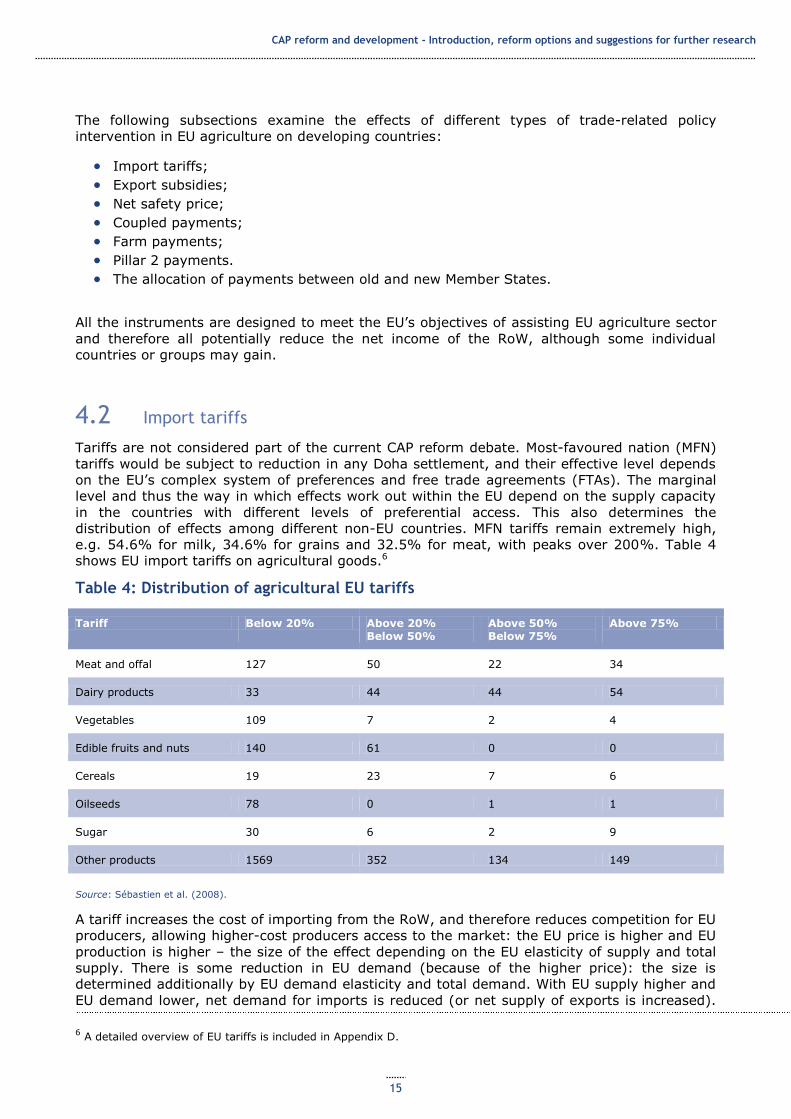
4.2 Import tariffs
Tariffs are not considered part of the current CAP reform debate. Most-favoured nation (MFN)
tariffs would be subject to reduction in any Doha settlement, and their effective level depends
on the EU‘s complex system of preferences and free trade agreements (FTAs). The marginal
level and thus the way in which effects work out within the EU depend on the supply capacity
in the countries with different levels of preferential access. This also determines the
distribution of effects among different non-EU countries. MFN tariffs remain extremely high,
e.g. 54.6% for milk, 34.6% for grains and 32.5% for meat, with peaks over 200%. Table 4
shows EU import tariffs on agricultural goods.6
Table 4: Distribution of agricultural EU tariffs
Tariff Below 20% Above 20% Below 50%
Above 50% Below 75%
Above 75%
Meat and offal 127 50 22 34
Dairy products 33 44 44 54
Vegetables 109 7 2 4
Edible fruits and nuts 140 61 0 0
Cereals 19 23 7 6
Oilseeds 78 0 1 1
Sugar 30 6 2 9
Other products 1569 352 134 149
Source: Sébastien et al. (2008).
A tariff increases the cost of importing from the RoW, and therefore reduces competition for EU
producers, allowing higher-cost producers access to the market: the EU price is higher and EU
production is higher – the size of the effect depending on the EU elasticity of supply and total
supply. There is some reduction in EU demand (because of the higher price): the size is
determined additionally by EU demand elasticity and total demand. With EU supply higher and
EU demand lower, net demand for imports is reduced (or net supply of exports is increased).
6 A detailed overview of EU tariffs is included in Appendix D.
CAP reform and development - Introduction, reform options and suggestions for further research
16
RoW suppliers therefore supply less because they face reduced demand both in the EU
(because of the tariff) and outside the EU, with the amount determined by RoW supply
elasticity and level; while the lower price will cause some increase in demand in the RoW,
depending on the demand elasticity, the effect will be lower income (supply multiplied by
price), partially offset by an increase in real income (at the lower price) for consumers. There
is a reduction in EU income because of the redistribution of production to farming from more
efficient sectors and because of a redistribution towards farm income from other income.
Lower tariffs would help developing country exporters that face MFN tariffs depending on the
elasticity of supply, but they would lead to preference erosion for those countries which
already have trade preferences (e.g. least-developed countries (LDCs) or signatories to FTAs
– see Appendix D). The increase in world prices from any reform could have negative effects
on consumers.
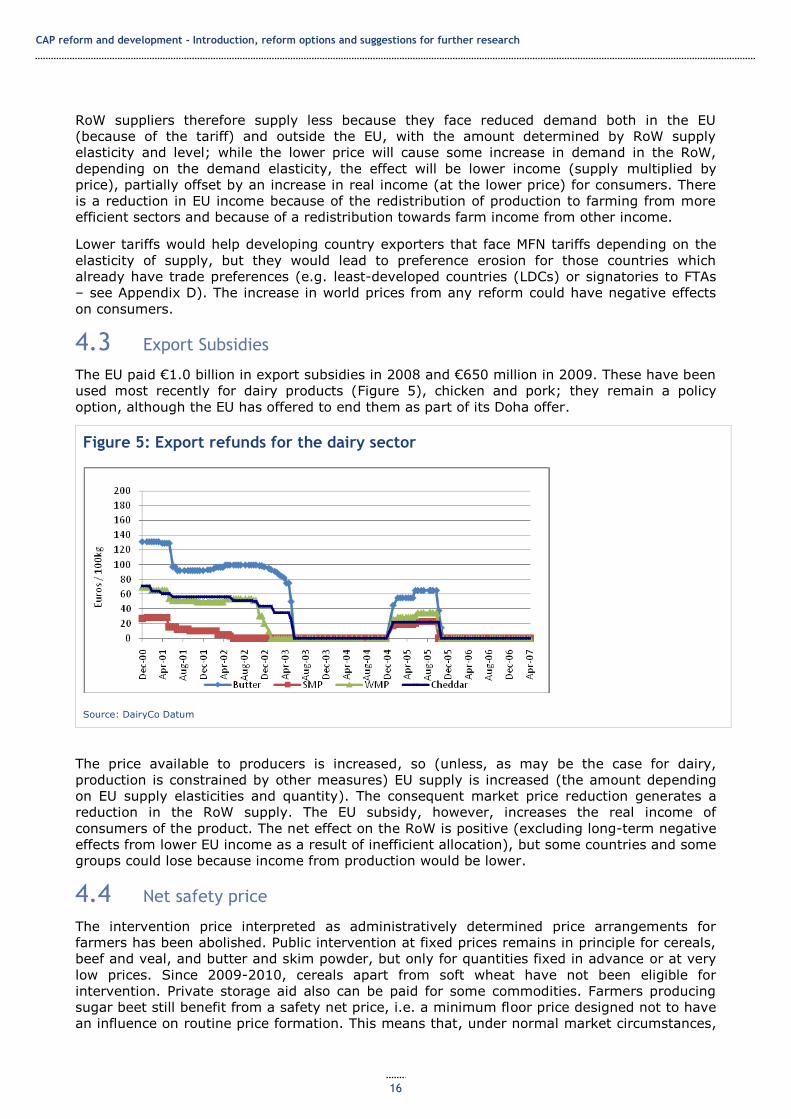
4.3 Export Subsidies
The EU paid €1.0 billion in export subsidies in 2008 and €650 million in 2009. These have been
used most recently for dairy products (Figure 5), chicken and pork; they remain a policy
option, although the EU has offered to end them as part of its Doha offer.
Figure 5: Export refunds for the dairy sector
Source: DairyCo Datum
The price available to producers is increased, so (unless, as may be the case for dairy,
production is constrained by other measures) EU supply is increased (the amount depending
on EU supply elasticities and quantity). The consequent market price reduction generates a
reduction in the RoW supply. The EU subsidy, however, increases the real income of
consumers of the product. The net effect on the RoW is positive (excluding long-term negative
effects from lower EU income as a result of inefficient allocation), but some countries and some
groups could lose because income from production would be lower.
4.4 Net safety price
The intervention price interpreted as administratively determined price arrangements for
farmers has been abolished. Public intervention at fixed prices remains in principle for cereals,
beef and veal, and butter and skim powder, but only for quantities fixed in advance or at very
low prices. Since 2009-2010, cereals apart from soft wheat have not been eligible for
intervention. Private storage aid also can be paid for some commodities. Farmers producing
sugar beet still benefit from a safety net price, i.e. a minimum floor price designed not to have
an influence on routine price formation. This means that, under normal market circumstances,

CAP reform and development - Introduction, reform options and suggestions for further research
17
the minimum price no longer determines the market price of the affected commodity (e.g.
rice). In this context, market prices are determined by the play of managed market forces in
the sector concerned.
4.5 Coupled payments
Couple payments are a subsidy to the price of EU products. They apply to cotton (subject to a
maximum area limit), beef and sheep meat at the discretion of those Member States which
maintained coupled payments for these products in the Fischler reform in 2003 (Table 5). Both
EU production and EU demand are increased, demand because of the lower EU price, with the
change in the price depending on the elasticities. The effects on the RoW are thus reduced net
exports for producers and higher real income for consumers, with the latter not offsetting the
former. The net effect for each country depends on its trade patterns for each commodity.
The 2003 CAP reforms allow Member States some flexibility in implementing the non-distorting
farm payments, including the scope to retain a proportion of commodity-specific payments. In
the 2007 financial year, around 20% of direct payments made in the EU-15 remained
commodity-specific, but with large differences in shares across the EU-15 Member States. The
2008 CAP Health Check introduced measures to move most payments that remain commodity-
specific into farm payments by about 2012. According to the EC, this will increase the level of
‗decoupled‘ support as a percentage of all direct payments to over 90% (Costa et al., 2009).
Table 5: Share of total commodity specific payments by country
Source: Costa et al. (2009).
4.6 Farm payments
Approximately 80% of CAP payments to farmers are made with no direct link to current
production, but with conditions which require the land remain usable for farming. Criteria for
distributing these payments vary among EU countries. There are two basic farm payments
models (Table 6):
An historic model, in which payments to each farm are based on the amount of
payments it received during a reference period (2000-2002), divided by the
number of hectares farmed in the reference period.
A regional model, in which a flat rate of entitlement per hectare is paid based on
the total amount of payments received in the region during the reference period,
divided by the total number of eligible hectares declared in that region in the year
the farm payments were introduced (Costa et al., 2009).

CAP reform and development - Introduction, reform options and suggestions for further research
18
Hybrid models have also been implemented, in which a part-historic, part-regional model is
used. These can be static or dynamic. In the static version, the entitlements remain the same
over time. In the dynamic version, a proportion of the entitlement is based on an historical
reference period, which is then phased out over time.
Table 6: Farm payment implementation models
Historic Regional Static hybrid Dynamic hybrid
Austria Malta Denmark Finland
Belgium Slovenia Luxembourg Germany
France Sweden UK
Greece Uk – Northern Ireland
Ireland
Italy
Netherlands
Portugal
Spain
UK – Scotland
UK – Wales
Source: Costa et al. (2009).
If the payment level were entirely independent of farmers‘ current production decisions, they
would be fully reflected in higher rents and would not affect output. In fact, there are
conditions, as noted above: payments are to ‗active farmers‘ who are following good farming
practices and keeping the land in good agricultural condition, and thus incur the entry costs for
farming. The alternative is to stop producing. Farm payments are a high share of agricultural
factor income in total (29% in 2007-2009) and very high in some EU countries: 60% in
Denmark and over a third in the Czech Republic, France, Germany, Greece, Ireland,
Luxembourg and Sweden; the shares will of course be higher for individual farmers. Therefore,
the level is likely to be significant relative to the costs of farming for a high proportion of
farmers. If a farmer is not able to cover costs without the subsidy, and if the subsidy is greater
than the difference between these costs and potential income, then the subsidy will keep that
farmer in production. The costs include whatever income the farmer requires, given the
opportunity cost of alternative possible sources of income. In two cases, if a farmer is able to
produce without the subsidy, or if the subsidy is not sufficient to cover the farmer‘s costs, then
the direct payment has no effect on production and is just an income transfer from non-
farmers to farmers in the EU.
For farmers in the affected group, the supply curve is (as it would be without intervention) flat
at 0 for prices too low for production even with the subsidy, then steps up from 0 to the level
necessary to meet the criteria for receiving the subsidy up to the point at which the subsidy
again becomes irrelevant; above the price at which the subsidy plus farming income covers the
farmer‘s costs, the supply curve may have a normal upward slope determined by the elasticity.
Taking all farmers in the EU for a particular product together, the subsidy shifts the supply
curve up at lower prices and probably flattens its shape (depending on the distribution of
farmers‘ costs). Some land may merely be transferred from less to more efficient farmers;
some may be farmed only because of the subsidy. The intersection with demand will be a
lower price, so some of the extra supply will be consumed in the EU, but there will be some
reduction in net EU imports, with the usual effects on the RoW.

CAP reform and development - Introduction, reform options and suggestions for further research
19
As direct payments will increase EU supply (depending on output elasticity with respect to
payments), this will lead to a reduction in net EU imports, and hence a decrease in developing
country exports and lower world prices. The effect on net income is offset partially by lower
costs for developing country importers of CAP-affected products.
The exact effects on supply require detailed examination of farm costs. For example Vrolijk et
al. 2010, found the level of subsidies (as a percentage of farm output) is the highest in the
grazing livestock sector followed by field crop (or arable) farms, mixed farms and dairy farms.
Subsidies on other types of farms, including horticulture, permanent crop and wine, as well as
intensive livestock are much lower.7
Area payments are currently used in the new EU Member States, made to individual producers
on the basis of area (acres or hectares) of eligible land. As they are generally based on the
same criteria as coupled payments, they will have the same effect, but currently, as they are
at a generally lower rate, the effects will be smaller. They do not include the cross-
conditionality requirements, but it is uncertain whether these in fact influence or are enforced
for farmers in the old EU Member States.
Boxes 2 and 3 review a number of studies on the impact of direct payments.
Box 2: The effects of direct payments on EU production
A number of studies suggest that direct payments increase EU production. The lack of surpluses is not sufficient proof that there is no ‗overproduction‘ because, under market conditions, the EU would be a net importer of many of the products. An analysis by the World Economy Group at the French National Foundation for Political Science (GEM, 2010) of the external effects of the CAP argues that the CAP: ‗still biases production towards products and activities that benefit from strong assistance‘; promotes ‗higher output of the farm- and food-processing sectors in the EU of about 8% and 6% respectively‘; leads to ‗production of cereals in parts of Africa‘ that is ‗smaller than it would be without the CAP‘; and reduces
‗global welfare by about US$45 billion‘, at the expense of ‗mostly developing and least developed economies which protect their farm sector much less than the EU‘.
Monge Arino and Gonzales-Vega (2007) point out that direct payments, even when disentangled from current production choices, increase agricultural output through transmission channels related to the credit market. First, when a single corn farming household faces imperfections in the credit market that
limit its access to credit, access to additional liquidity through decoupled payments (liquidity effect) increases its landholdings and output transitorily. Second, the increased farming household‘s creditworthiness, brought about by the decoupled payments, may shift the supply of credit, reducing the cost of access to debt (creditworthiness effect). This not only accelerates and reinforces the transitory direct impact of decoupled payments, but also increases farm size and output permanently. Third, when the actions of the representative farming household are replicated by all of them, there may be an
increase in land prices (land price effect). This price effect leads the representative corn farming household to reduce its holdings of land and output, both along the optimal path and in the steady state, thereby mitigating somewhat the expansionary impact of the other two effects.
De Gorter (2006) points out that decoupled payments can reduce risk by reducing farm income variability (the insurance effect) or the increased wealth created by payments may make farmers less risk averse. A way decoupled payments affect trade distortion is through expectations about future policies and dynamic considerations. Producers will develop expectations of future assistance based on past government actions, thereby affecting current production decisions.
Vrolijk et al. (2010) examine the dependency of farms on European subsidies. In particular, they run simulations and they analyse the abolition of direct payments in European countries. They classify five categories of farms representing different financial situations of farms, as follows:
7 If some farms have high costs only because they are small, then the effect on supply from farm payments might be
lower (in the absence of payments, some of the small farms would be absorbed by larger payments), but if land markets are working efficiently, this should happen even with the direct payments, so the difference in effect may be small.

CAP reform and development - Introduction, reform options and suggestions for further research
20
1. Family farm income is higher than opportunity cost of own labour and own assets.
2. Absolute level of family farm income is above zero.
3. Family farm income is negative after policy change but postponing depreciation is an option.
4. Family farm income cannot be compensated for by postponing depreciation.
5. Family farm income is already negative before change.
This classification implies that Categories 1 and 2 represent farms in a good financial condition after the abolition of farm payments and Categories 3-5 those in a bad financial condition.
Interestingly, the authors find that countries showing the highest percentage of farms which might turn from a positive to a negative income after the abolishment of farm payments (Categories 3 and 4) are generally based in Northern Europe (UK, Ireland, Denmark, Germany, Finland, France, Sweden, Slovenia, Slovakia).
Countries with the highest percentage of farms
Category 1 Category 2 Category 3 Category 4 Category 5
Lithuania Spain UK UK Denmark
Latvia Italy Sweden Slovakia Cyprus
Luxembourg Austria France Ireland Sweden
Belgium Poland Denmark Denmark Slovakia
Estonia Estonia Finland Germany Slovenia
Source: Vrolijk et al. (2010).
The authors conclude that CAP type of farms (arable, dairy, other grazing cattle and mixed) comprise the majority of farms and use a very large part of the agricultural land in the EU (95%). Therefore, deterioration of the viability of these farms as a result of the abolition of decoupled subsidies may have a serious impact on the structure of the farm sector as well as on the vitality of rural areas.
Offerman et al. (2009) point out that distortions deriving from direct payments can be even more severe for niche markets such as those related to organic farming. They use the well known concept of ‗policy dependency‘ and calculate the ratio of total payments and farms output for farms in Austria, Denmark,
Germany, the Czech Republic, Estonia, Hungary, Poland and Slovenia. They find that Poland and Hungary stand out, with comparably low values. In all other countries, the importance of direct payments appears
to be substantial, reaching levels of up to 75%. This finding raises the issue of to what extent farms providing environmental public goods can depend on state interventions and on the modalities by which it is possible to reconcile farms‘ efficiency and social goods.
The magnitude of the direct payments‘ impacts on European production will depend on parameters such as the slope of the supply and the demand curve (see previous section). Sipilainen and Kumbhakar (2010) estimate the elasticity of production to subsidies in regions of Finland and Sweden. While this elasticity is negative in central Sweden, for all the other regions it is positive, at around 0.1.
Bhaskar and Beghin (2007) acknowledge the existence of five main major coupling channels of decoupled payments:

CAP reform and development - Introduction, reform options and suggestions for further research
21
1. They affect the risk facing farmers.
2. They ease credit constraints facing farmers.
3. They affect the labour allocation decision of farm households.
4. They alter land values.
5. They influence forward looking farmers‘ decisions.
In spite these mechanisms in place, the authors outline, ‗Although decoupled payments are not fully ―decoupled‖ as the research suggests that they influence farmers‘ decisions through the channels identified above, the magnitude of these impacts was found to be small in most cases.‘
Box 3: The effects of direct payments on developing countries
Conforti (2005) examines the effects of the removal of decoupled and decoupled + coupled direct payments in the EU through partial (PE) and general (GE) equilibrium models. He finds that the removal of both coupled and decoupled forms of support implies, as expected, a larger impact on supply,
particularly for oilseeds – whose production would diminish in the US with both the PE and the GE closures – but also for cereals, rice and the group of plant-based fibres. As a consequence, output growth in non-OECD countries would be far more substantial and far more widespread. For instance, production of oilseeds in China would be 3% higher in the GE approach and paddy production would be almost 2% higher in India. Output of plant-based fibres would increase substantially in a number of developing countries, including in Sub-Saharan Africa and Southern Asia.
Stevens et al. (2008) analyse the impact of decoupling on developing countries. They argue there is unlikely to be a significant effect across the board on developing countries as a result of purely
agricultural policy change by the EU until it reaches the point at which support to farmers is very
substantially decoupled from production and the overall subsidy is very low.
Other studies try to investigate a broad range of CAP policy interventions. Another modelling exercise
comes from Costa et al. (2009), who investigate the impact of direct payments, border tariffs and export to subsidies for Africa. Using the Global Trade Analysis Project (GTAP) model, they find the whole package of measures can reduce by 0.05% Africa‘s GDP ($560 million). A negative effect for Africa is also registered when single measures are considered contextually.
% variation in welfare
Value (2007 $ millions)
Direct payments Between -0.005 and O -16
Border protection -0.07 -834
All CAP measures -0.05 -560
Source: Costa et al. 2009.
A recent study from Boulanger et al. (2010) analyses the impact of the removal of distorting CAP instruments on single African agricultural sectors:
Crops Livestock Food processing Forestry and fishing
Manufacturing Services
Africa 0.81 2.93 -0.18 6.13 -1.02 -0.02

CAP reform and development - Introduction, reform options and suggestions for further research
22
Source: Boulanger et al. (2010).
Interestingly, Boulanger et al. (2010) can separate the pure ‗allocative efficiency effects‘ from welfare effects. The allocation effect comes as production is reallocated across the world and resources are
reallocated within the world‘s economies in response to these changes in relative returns. Welfare effects derive from changes including consumption and investments which are a result of the effects of variations in terms of trade. Their conclusion is that, whereas the allocative efficiency effect coming from a removal of distorting CAP instruments generates a negative effect for Africa, the welfare effect is positive because of the improved terms of trade effect.
% welfare
% GDP
All CAP measures -0.05 -0.01
Source: Boulanger et al. (2010).
4.7 Pillar 2 payments
Pillar 2 payments are intended to go to farmers or communities in order to benefit the
environment or local rural development. Their economic effects on developing countries are
unclear, as this depends on how much they affect the level of production. The environmental
implications may be positive for developing countries. They are classified into three axes: farm
modernisation, environment and rural conditions.
As stated in a recent International Foundation for Organic Agriculture Movements (IFOAM)
(2009) publication, there is strong complementarity between the different axes. Measures
devoted to promoting organic farming as part of initiatives aimed at improving touristic
packages (Axis 3) or to incentives for investment by organic farmers (Axis 1) would meet
environmental goals represented by Axis 2. Axis 2 is currently the most funded across EU
Member States, as Table 7 shows. In other words, complementarities across Pillar 2 axes and
across pillars makes it very difficult to forecast the impacts of the CAP budget sharing across
different options.
Table 7: Distribution of Pillar 2 rural development budget on Axis 1, 2 and 3 (%)
Share Axis 1 Share Axis 2 Share Axis 3
Member State Axis 1 Member State Axis 2 Member State Axis 3
Belgium 49.2 Ireland 79.7 Malta 33.6
Latvia 48.7 Finland 74.0 The Netherlands 30.0
Portugal 46.8 Austria 73.7 Bulgaria 29.7
Hungary 46.5 UK 72.9 Romania 27.4
Spain 45.3 Sweden 70.4 Germany 24.9
Greece 44.0 Denmark 64.6 Poland 19.7
Cyprus 44.0 Luxembourg 58.9 Latvia 19.5
Romania 44.0 Czech Republic 55.5 Czech Republic 17.0
Lithuania 41.7 Slovenia 52.5 Greece 14.1

CAP reform and development - Introduction, reform options and suggestions for further research
23
Poland 41.4 Slovakia 51.0 Slovakia 13.8
Bulgaria 40.8 France 50.6 Hungary 13.6
Italy 38.2 Italy 44.7 Estonia 13.0
Estonia 38.0 Cyprus 44.2 Lithuania 12.4
France 37.7 Portugal 42.3 Slovenia 11.1
Malta 34.9 Germany 41.1 Finland 9.5
Slovenia 33.4 Spain 39.4 Cyprus 9.1
Slovakia 32.1 Lithuania 39.4 UK 9.0
The Netherlands 30.1 Estonia 39.0 Belgium 8.9
Luxembourg 28.4 Belgium 36.7 Italy 8.7
Germany 28.0 Greece 35.7 Sweden 8.2
Czech Republic 22.5 Hungary 34.2 Luxembourg 6.9
Denmark 20.2 Poland 34.1 Austria 6.6
Sweden 15.5 The Netherlands 29.9 France 6.6
Austria 14.1 Latvia 29.2 Denmark 5.3
UK 11.9 Malta 27.2 Spain 3.8
Finland 11.2 Bulgaria 27.0 Portugal 0.4
Ireland 10.3 Romania 26.0 Ireland 0.0
Source: IFOAM (2009)
The issues in Axis 2 represent an important portion of Pillar 2. Whereas for the typical CAP
economic instruments the link between EU policy and developing countries is more intuitive
and involves short-term transmission channels, for environment the connection is much more
difficult to elaborate and explain. In principle, payments for environment results could benefit
developing countries, and the amount available is sufficient to have major effects. But there is
no evidence on whether the effects are arising.
Figure 6 and Table 8 illustrate the transmission channel to developing countries. Environment-
friendly agricultural practices reduce greenhouse gas emissions, and a lower level of
greenhouse gas emissions reduces atmospheric carbon concentration and temperature. A
reduction of temperature reduces in the medium/long term environmental damages for
developing countries. As Tol et al. (2004) emphasise, the scientific literature agrees on the fact
that developing regions and in particular Africa will be those suffering most from global
warming.
Table 8: The impact of soil management practices on soil organic matter (SOM) and long-run productivity
Decrease of biomass production
Decrease in organic matter supply
Increased decomposition rates
Increased biomass production
Increased organic matter supply
Increased organic matter supply

CAP reform and development - Introduction, reform options and suggestions for further research
24
Impact on SOM
- SOM - SOM - SOM + SOM + SOM + SOM
Practices Replacement of perennial vegetation
Burning of natural vegetation and crop residues
Tillage practices Increased water availability for plants
Protection from fire
Reduced or zero tillage
Monoculture of crops and pastures
Overgrazing Drainage Balanced fertilisation
Crop residue management
High harvest index
Removal of crop residues
Fertiliser and pesticide use
Cover crops Forage by grazing rather than by harvesting
Use of bare fallow
Improved vegetative stands
Integrated pest management
Agroforestry and alley cropping
Manure and compost
Reforestation and afforestation
Figure 6: Transmission channel from environment Pillar 2 interventions to developing countries
According to a Food and Agriculture Organization (FAO) report (2002) focused specifically on
organic farming, CO2 emissions per hectare of organic agriculture systems are 48-66%8 lower
than in conventional systems. Haas and Köpke (1994) calculated the CO2 emissions of German
organic farms to be 0.5 tonnes per hectare whereas in conventional agriculture the amount
was 1.3 tonnes, a difference of 60%. If production in the EU is reduced, however, some may
be transferred to the RoW, reducing or eliminating the global gain for the environment (and
possibly transferring any environmental damage to developing countries).
The national co-financing of Pillar 2 makes it more likely that it will target nationally and locally
accepted objectives, and therefore have more favourable effects on the environment than the
‗cross-conditionality‘ from Pillar 1 payments. These are too blunt an instrument to be effective.
Theory suggests, however, that regulation would be more effective than transfer payments to
achieve environmental objectives (Harvey, 2010).
8 Relevant literature (see among the others Acs et al. 2007) highlights that the production of emissions depends on
the intensity of production and land management practices (rotation, residuals management, tillage) rather than the number of hectares. However, calculations of emissions based on hectares represent a useful simplification to express (roughly) the magnitude of the impact of organic farming on emissions reduction and the relative monetary environmental gain.
Pillar 2
interventions
organic farming
production
increase
Emission
s reduction
Carbon
concentration
Temperatur
e stabilisation
Less
climate
damage
for LDCs

CAP reform and development - Introduction, reform options and suggestions for further research
25
4.8 Switch of CAP payments from old to new EU Member States
If there is just a shift between producers of the same product, there might be little effect on
the RoW, unless the amount of production affected by farm payments (the region of the supply
curve for which the farm payments determine production) varies between old and new Member
States. For this, we would need evidence on the distribution of costs of production in each
region.
Data on harvested land suggest that a shift from old to new Member States might also mean a
shift among products (Table 9).
Table 9: Agricultural land harvested in southern countries of Western and Eastern Europe by product (ha)
Cereals Fibres Fruits Roots and tubers
Vegetables
Eastern Europe 83,928,698 185,723 2,302,575 4,820,862 2,085,631
Southern (Western) Europe
15,488,862 306,999 4,382,833 406,184 1,480,389
Source: FAOSTAT
4.9 Where to look for major effects of EU agricultural policy on developing countries?
The interventions which have the most significant effects are now, and are likely to remain,
import tariffs and direct farm or area payments. Export subsidies, intervention prices and non-
decoupled payments are used for a small and falling number of products; Pillar 2 payments for
rural development and environmental protection are much smaller in terms of absolute amount
than direct payments and some proportion of this is non-distorting. Some of the effects of any
transfer of direct payments from old to new countries would be offsetting.
The products most affected by the principal instruments are dairy, meat and grains. Those for
which tariffs are highest are dairy, meat and grains. The types of farms found to be most
dependent on farm payments to stay in production are livestock and mixed farms. If we
included the other types of intervention, the list would not be modified greatly: export
subsidies now go mainly to dairy products; intervention prices have been used most recently
for dairy, sugar and some grains; non-decoupled payments go to cotton and beef. A shift to
new Member States is likely to mean more support to grains.
While it is impossible to know without doing more detailed analysis and calculations what the
market level of production in the EU of each product would be, and therefore whether the EU
should be a net importer or net exporter, Table 10 shows that, contrary to EC assertions (EC,
2008), the EU remains a major net exporter, to the world and to developing countries, of some
of the products of highest intervention, including dairy, cereals and meat. In terms of the
objective of the EU contributing to world supply, therefore, it is more than meeting its own
needs for these products. Of the countries with the highest surpluses, France and Germany are
also among the major recipients of CAP money. There is therefore prima facie evidence to
support analysing and estimating in more detail how production of dairy products, cereals and
meat is affected by CAP policy instruments.

CAP reform and development - Introduction, reform options and suggestions for further research
26
Table 10: EU trade balance (exports minus imports), 2009
Trade with all Extra-EU-27 Trade with developing countries
Cerealsa Fruitb Veg.c Dairyd Meate Cereals
Fruit Veg. Dairy Meat
EU-27 1,094 -9,700 -1,352 4,642 611 1,687 -8,685 -1,428 3,517 204
Austria 4 -211 -72 42 97 -7 -212 -76 42 46
Belgium -168 -1,732 -42 315 -16 -77 -1,526 -28 294 104
Bulgaria 56 -27 -87 19 -1 56 -28 -87 4 -1
Cyprus -17 -7 -3 12 -11 -17 -1 -2 8 -3
Czech Republic -0 -37 -13 44 -1 -5 -32 -8 43 -2
Denmark 11 -75 15 434 873 -10 -58 1 273 171
Estonia -1 -4 -2 22 0 -1 -4 -1 21 0
Finland 5 -31 -1 211 55 -1 -19 -1 176 25
France 1,484 -709 -384 834 362 1,460 -696 -433 475 307
Germany 869 -1,276 -206 445 -62 807 -1,049 -214 482 16
Greece 32 -38 -60 34 -30 34 -19 -45 4 -11
Hungary 74 -10 -2 24 110 67 -10 -4 23 26
Ireland -3 -58 -13 184 -1 -2 -50 -6 153 -10
Italy -594 -651 -313 355 -218 -187 -686 -307 51 -195
Latvia 103 -7 -2 12 2 101 -7 -2 11 2
Lithuania 104 99 83 117 24 99 103 81 113 24
Luxembourg 0 -45 0 -2 -2 0 -5 0 0 -0
Malta -6 -4 -0 -1 -4 -5 -3 -0 0 -1
Netherlands -208 -2,285 432 1,091 -128 -171 -2,108 241 965 -150
Poland 128 164 92 163 151 125 153 78 150 104
Portugal -116 -135 -27 35 -16 -98 -133 -22 28 -6
Romania 244 -55 -33 4 -16 182 -54 -33 3 -16
Slovak Republic
0 -7 -8 5 -0 -0 -7 -8 5 -0
Slovenia -7 -21 -49 19 5 -7 -11 3 19 3
Spain -509 -350 -158 94 21 -410 -328 -228 24 -46
Sweden -1 -157 -16 67 -22 -6 -128 -16 63 -19
UK -390 -2,031 -482 63 -560 -240 -1,768 -311 84 -164
Notes: a) HS Chapter 10; b) HS Chapter 08; c) HS Chapter 07; d) HS Codes 0401-06; e) HS Codes 0201-04 and 0207.

CAP reform and development - Introduction, reform options and suggestions for further research
27
Source: Derived from data obtained from Eurostat COMEXT database.
The developing countries most likely to be affected by the CAP are those for which exports of
any of these products are (or could be) important (they suffer reductions in their real income
because of price and/or volume effects), while those for which imports of any of them are
important could see positive real income effects. Appendix E shows the CAP-affected products
which are most important for developing countries in terms of exports (Table E1) and imports
(Table E2). Table 11 shows the principal developing countries exporting these products to the
EU. EU intervention will affect all markets for these goods.
Significant agricultural exporters to the EU of CAP-affected products include Morocco, China
and South Africa (dairy); Argentina, Brazil, Uruguay, Chile, Namibia and Botswana (meat); and
Ukraine, Thailand, India, Argentina, Chile, Pakistan, Mexico, Uruguay and Brazil (grain). Some
small countries which are not themselves major suppliers may also be affected if the product
accounts for a significant proportion of their exports, so this is not a complete list of potentially
significantly affected countries. Countries for which CAP-affected products are a high share of
total exports are, for dairy, Nicaragua, Djibouti and Uruguay; for meat, Uruguay, Paraguay and
Nicaragua; and for grains, Belize, Paraguay, Uruguay, Guyana, Pakistan, Ukraine and St
Vincent. On the import side (i.e. countries where CAP-affected products constitute an
important part of their total imports and which could hence suffer if world prices in that
product increased owing to a removal of CAP support), countries affected include: meat
(Tonga, Samoa), dairy (Somalia, Cape Verde, São Tomé & Príncipe, Senegal), grains (Yemen,
Côte d‘Ivoire, Guinea-Bissau, Haiti, Gambia, Senegal), vegetables (Somalia, Bangladesh) and
fruits and nuts (Niue, Djibouti).
Some of those exporting to the EU have special trading arrangements (preferences, FTAs,
potential accession countries), so for these the effects of protection against other countries
may be positive, or the preferences may offset losses from the intervention.
But to trace the effects by country and by group within country it would be necessary to know
which products see changes and what their supply and demand elasticities are in the EU and in
the RoW.
Table 11: Main developing country suppliers of product groups with the highest EU intervention levels
CAP product groupa
Developing country
Share of total EU-27 imports, 2009
CAP product groupa
Developing country Share of total EU-27 imports, 2009
Dairy Croatia 70.5% Fruit and nuts Turkey 11.6%
Belarus 10.8% South Africa 10.6%
Morocco 5.0% Chile 9.6%
China 3.0% Costa Rica 9.0%
FYR Macedonia 2.1% Colombia 8.1%
South Africa 1.8% Ecuador 7.9%
Russian Federation 1.6% Brazil 5.3%
Congo 1.1% Argentina 4.7%
United Arab Emirates 1.0% Morocco 2.9%
Meat Argentina 34.4% China 2.5%
Brazil 31.8% Egypt 2.3%

CAP reform and development - Introduction, reform options and suggestions for further research
28
Uruguay 19.5% India 2.1%
Chile 7.1% Vegetables Morocco 21.9%
Namibia 2.3% China 15.1%
Botswana 2.3% Turkey 12.1%
FYR Macedonia 0.9% Egypt 8.7%
Grain Ukraine 19.1% Kenya 6.2%
Thailand 14.2% Peru 4.8%
India 12.2% Argentina 4.4%
Serbia 9.9% India 3.0%
Argentina 4.8% Mexico 2.4%
Chile 4.7% Thailand 1.7%
Pakistan 4.7% Russian Federation 1.5%
Croatia 3.7% Serbia 1.3%
Mexico 3.6% Chile 1.3%
Kazakhstan 3.3% Ecuador 1.0%
Uruguay 3.2%
Brazil 3.0%
Note: a) Imports in HS codes noted in Table 10.
Source: Derived from data obtained from Eurostat COMEXT database.

CAP reform and development - Introduction, reform options and suggestions for further research
29
5 Preliminary analysis of CAP reform options
This section discusses how we could approach a quantitative interpretation of the CAP reform
options. There are a number of key choices, which will affect the development effects of the
2013 CAP reform options:
1 Any change in the focus in Pillar 1 and in particular the criteria for direct payments;
2 The total size of CAP spending;
3 The distribution of CAP spending across countries and products.
We examine a number of scenarios, as follows:
1 BASELINE in which CAP expenditures and the weight of direct payments in the total CAP
expenditures are constant for each EU country until 2013.
2 SIZE – the size of the CAP decreases and the weight of direct payments across countries
remains constant over time. We assume CAP expenditures will be €35 billion in 2013.
3 EQUALGDP where the size of the CAP is the same as in the baseline, but funds are
distributed in inverse relation to GDP per capita. This is a scenario already outlined in
some contributions by the previous literature, such as Zahrnt (2009).
4 EQUALDPPERHA, where the size of the CAP is the same as in the baseline, but direct
payments per hectare are equalised across countries.
Box 4: Possible basis for redistribution of CAP payments within the EU
All CAP reform options accept that the current allocation of direct payments between Member States is no longer tenable and should be replaced by a more equitable distribution, which might take into account
both economic and environmental criteria. There is no accepted basis for redistribution. Kauppi and Widgren (2005) argue that the EU budget allocations across Member States are addressed mainly towards regions in rich Western regions. Among the objectives of the CAP are:
1. An adequate level of agricultural production, ensuring a fair standard of living for the agricultural community; and
2. Equal economic and social progress across Member States.
Kauppi and Widgren propose a number of other criteria for distributing CAP funds across countries:
1. The agriculture share in value added;
2. Ratio of the country GDP per capita and EU average GDP per capita;
3. Number of farmers.
Zahrnt (2009) examines various ways of distributing CAP expenditures. If funds are distributed according to different criteria such as GDP per capita or the country‘s provision of public goods, there are winners and losers. Countries that defend the status quo would – surprisingly – win from reform. This is especially striking in the case of Spain, which would see funds increased under any reform scenario and which
would reap the greatest absolute gains of all Member States.
A non parametric approach confirms the correlation between GDP per capita of EU Member
States and the level of direct payments (Table 3 and Figure 7). We notice that the current
distribution of direct payments appears to be biased towards Western rich countries. Similar
findings are noticed when we consider the relationship between GDP per capita and direct
payments per hectare (Figure 8). The dataset includes all EU countries except Malta. To

CAP reform and development - Introduction, reform options and suggestions for further research
30
calculate direct payments per hectare we calculate the ratio between direct payments (DG
Agri) and hectares of agricultural land (FAOSTAT). GDP per capita data are taken from the
World Bank World Development Indicators.
Figure 7: GDP per capita (2000 PPP $) vs. direct payments (€ ‘000s) – a kernel non-parametric estimation across EU Member States
k-NN regression, k = 12
DP
GDPPC13070 67050
19372
8.1e+06
Figure 8: GDP per capita (2000 PPP $) vs. direct payments per arable ha (€/ha) – a kernel non-parametric estimation across EU Member States
k-NN regression, k = 12
DP
Ph
a
GDPPC13070 67050
31
520
What budgetary consequences could derive from the implementation of different scenarios for
each EU Member State?
The SIZE scenario is quite straightforward. In this, we use the same proportional decrease in
direct payments for all EU Member States; the distribution remains unchanged and biased
towards rich Western countries. In this scenario, the impact on developing countries can be
easily understood on the basis of the transmission channels for different policy channels, as
described previously. The decrease of direct payments decreases EU supply, increases the

CAP reform and development - Introduction, reform options and suggestions for further research
31
world price and increases the income of the RoW. The size of the effect depends on the supply
and demand elasticities, and in particular the range over which the supply elasticity with
respect to direct payments is flat.
To examine the consequences of a redistribution of direct payments on the receipts of EU
Member States and on developing countries, we compute the inverse of GDP per capita for
each country (Popi/GDPi), then the sum of the inverses of GDP per capita (∑iPopi/GDPi) across
countries. Finally, we assume that each country receives an amount of funding proportional to
the ratio between (Popi/GDPi) and ∑iPopi/GDPi.
Under this scenario, the countries with the highest percentage of CAP funds would be
Bulgaria, Romania, Poland, Latvia and Hungary. Eastern European countries would replace
Western countries as the main recipients of EU CAP funds, and it would be necessary to
examine what changes this means for the composition of EU agricultural production.
A scenario in which all EU Member States receive an equal amount of direct payments per
hectare would mean that France and Germany would experience a decrease in CAP funds and
Spain and the UK an increase. Poland would replace Italy in the set of countries with the
highest level of direct payments funding.
To understand the impact of each of these changes on developing countries would require a
more in-depth investigation of trade relationships between EU and developing countries. The
redistribution of funds may generate a change in trading relationship patterns between EU and
the RoW.
When we have done the first step (identifying CAP reform options), we need to go through the
causal chain analysis as presented in Section 4 (so effect on EU production, effect on world
prices, effect on developing country importers and exporters, etc.). World price effects are
important; once these have been estimated, we need to make assumptions on the price pass-
through onto domestic prices. This will have wider economic and social implications in
developing countries depending on economic structures and elasticities.
As emphasised by Bchir et al. (2003), a transfer of CAP expenditures towards Eastern
European countries could lead to a structural change towards the agriculture sector, even
where this shift may be inefficient. The agriculture sector in most of the Central and Eastern
European countries is more fragmented, inefficient and traditional than in the current Member
States. In a computable general equilibrium (CGE) modelling analysis, the authors show that
an increase of CAP expenditures could generate a welfare loss for Baltic countries. These
market distortions may generate a negative impact on developing and emerging economies,
also when East European production takes the place of Western.
6 Suggestions for further research
We suggest there is a need for further work on CAP reform.

CAP reform and development - Introduction, reform options and suggestions for further research
32
1 A useful study and one that needs to be done quickly would be a literature review of
assessments of the impact of different CAP instruments on non-EU countries, to identify
how different methodologies have been used to analyse effects on EU output, trade and
prices and then the impact of these on world prices, output and income. This review
would need to cover case studies and PE and GE models. This could also identify any
general conclusions from studies on how developing countries are affected by changes in
EU trade volumes and prices; how this might affect their production, consumption and
other economic structures; and how countries respond to these effects. It could build on
the recent general review of studies of general agricultural liberalisation by Anderson et
al. (2011).
More detailed studies will be needed in the next few months on some issues. The first step
would be to agree a set of CAP reform options for simulations. Two options seem particularly
important: 1) redistribution of CAP payments from East to West; and 2) redistribution from
Pillar 1 to Pillar 2 payments.
We should then undertake a series of studies in two areas. First we need a set of specific
assessments of the development effects of CAP reform options taking into account previous
changes to CAP. And secondly, we need to examine CAP in the light of a changed context of
food price variability, food security, climate change, Europe 2020, Policy Coherence for
Development and the multi-year financial framework for EU spending over 2014 -2020.
Specific studies on development effects of CAP:
1 In order to assess the possible development effects of CAP reform options, one approach
could be to model the impact of the current CAP and of different CAP reform options on
income, growth and the environment in order to perform a quantitative evaluation of the
impact of CAP reform options on EU and developing countries. Computational general
equilibrium (CGE) models and/or econometrics could allow us to identify where there
may be significant effects, both in the EU and in developing countries. Modelling studies
exist, but these need to be updated and adapted for the current CAP reforms.
2 There is a clear need for a more thorough literature review of studies of direct payments,
followed by CGE modelling and other types of analysis to identify the nature and size of
their effects on EU production. This would mean a mapping of effects of direct payments.
3 Because of their direct impact on EU trade and prices, there is a need for a study of EU
export subsidies and export refunds (despite their lower size and the EU‘s offer in the
Doha trade negotiations to abolish export subsidies). We could look for changes in the
pattern of prices/production following export subsidies (e.g. chicken, dairy).
4 The broad agreement that there may be large effects at sector or country level means
that studies at this level are needed. Sectoral studies could cover dairy, beef, chicken,
sugar and some grains. Country studies would examine how the range of EU agricultural
policies affects a specific country. Countries could be chosen to test for various types of
difference, e.g. depending on preference or FTA schemes; composition of imports or
exports; or economic structures. Uganda has been suggested, but also Ghana,
Cameroon, Malawi or the South and Central American countries most likely to be
negatively affected. This could include household-level analysis.
The evolution of CAP in the wider context: contextual studies
5 CAP reform does not happen in isolation. We need to understand the CAP in the new
context of food security and other possible changes in public perceptions about EU
agricultural trade. If Europeans feel less secure, this might imply they want to buy ‗local‘
food. But there is also a range of other issues (e.g. the EU‘s financial framework) which
need to be explored at the same time. This study would provide contextual background
to CAP reform.

CAP reform and development - Introduction, reform options and suggestions for further research
33
6 It is important to examine links between the CAP and commodity price volatility.
7 It could also be useful to undertake some political economy analyses. What are the
relationships of CAP reform with Doha (and regional) negotiations? How does the
example of allowing European views on the nature of food security to be reflected in the
CAP emphasis on European production for European consumption affect policy responses
in other countries? What agricultural regime in the EU would contribute most to a good
international trading and production regime? Will the new role of the European
Parliament in trade policy mean more attention to consumer concerns, such as food
quality, or to the interests of well-organised pressure groups, such as farmers, and less
emphasis on macroeconomic policy, including trade interests?
8 Would there be any effect on developing countries from greater environmental
conditionality (‗greening‘) of Pillar 1?
9 There is also a suggestion that a monitoring mechanism for future CAP changes is
needed to implement policy coherence effectively. What should this look like? How could
it identify ways to counter negative effects?

CAP reform and development - Introduction, reform options and suggestions for further research
34
References
Acs, S., Berentsen, P.B.M. and Huirne, R.B.M. (2007) ‗Conversion to Organic Arable Farming in
the Netherlands: A Dynamic Linear Programming Analysis.‘ Agricultural Systems 94(2):
405-415.
Anderson, K., Cockburn, J. and Martin, W. (2011) ‗Would Freeing up World Trade reduce
Poverty and Inequality? The Vexed Role of Agricultural Distortions.‘ Policy Research
Working Paper 5603. Washington, DC: World Bank.
Balkhausen O. Banse M., Grethe A., Nolte S. (2005), ―Modelling the effect of partial decoupling
on crop and fodder area and ruminant supply in the EU: current state and outlook‖,
http://paradies.agrar.hu-
berlin.de/wisola/fg/ihe/Publikationen/Decoupling%20Parma%20Balkhausen%20Banse%2
0Grethe%20Nolte.pdf
Balkhausen O., Banse M. (2006), ―European Agriculture without direct payments: a partial
equilibrium analysis‖, Agriculture in the Face of Changing Markets, Institutions and
Policies: Challenges and Strategies JARMILA CURTISS, ALFONS BALMANN, KIRSTI
DAUTZENBERG, KATHRIN HAPPE (eds., 2006) Studies on the Agricultural and Food
Sector in Central and Eastern Europe, Vol. 33, Halle (Saale), IAMO, pp. 294-308.
Bchir, H., Fontagné, L. and Zanghieri, P. (2003) ‗The Impact of EU Enlargement on Member
States: A CGE Approach.‘ CEPIII Working Paper 10.
Bhaskar A., Beghin J. (2009), ―How coupled are decoupled farm payments? A review of the
evidence‖, Journal of Agricultural and Resource Economics, 34, 130 – 153.
Beghin, J.C. and A. Aksoy (2003), ―Agricultural Trade and the Doha Round: Lessons from
Commodity Studies‖, Briefing Paper 03-BP 42, Center for Agricultural and Rural
Development, Iowa State University.
Bouet, A., J-C Bureau, Y. Decreux and S. Jean (2004), ―Multilateral agricultural trade
liberalization: The contrasting fortunes of developing countries in the Doha Round‖, Draft
26 August 2004, Institute for International Integration Studies.
Boulanger, P., Jomini, P., Zhang, X., Costa, C. and Osborne, M. (2010) ‗An Economic
Assessment of Removing the Most Distortive Instruments of the Common Agricultural
Policy.‘ http://www.etsg.org/ETSG2010/papers/Boulanger_Jomini_Zhang_Costa_Osborne.pdf.
Calì M., Cantore N., Nolte s. (2010), ―Modelling exercise on ACPs and changes in the EU sugar
regime‖, Report to the Commonwealth Secretariat, forthcoming.
Christoplos I. (2009), ―Between the CAPs: agricultural policies, programming and the market
in Bosnia and Herzegovina‖, http://www.odi.org.uk/resources/download/1242.pdf
Conforti, P. (2005) ‗The Effect of Direct Payments of the OECD Countries in World Agricultural
Markets. Evidence from Partial Equilibrium and General Equilibrium Frameworks.‘ FAO
Commodity and Trade Research Working Paper 12.
ftp://ftp.fao.org/docrep/fao/008/j6211e/j6211e00.pdf.
Conforti P., Velazquez. B. (2003), ―The effects of alternative proposals on export subsidies to
agricultural products in the current WTO round‖,
http://ageconsearch.umn.edu/bitstream/14801/1/wp030019.pdf
Costa C., Osborne M., Zhang X., Boulanger P. and Jomini P. (2009) ‗Modelling the Effects of
the EU Agricultural Policy.‘
www.pc.gov.au/__data/assets/pdf_file/0005/92777/european-agricultural-policy.pdf.
DECC (2009), ―Carbon valuation in UK policy appraisal: a revised approach‖,
http://www.decc.gov.uk/assets/decc/What%20we%20do/A%20low%20carbon%20UK/C
arbon%20Valuation/1_20090715105804_e_@@_CarbonValuationinUKPolicyAppraisal.pdf
De Gorter, H. (2006) ‗The Potential Benefits to Developing Countries from Domestic Support
Reductions in Developed Countries.‘ www.ppl.nl/bibliographies/wto/files/6785k.pdf.
EC (2007), ―EU report on Policy Coherence for Development‖,
http://ec.europa.eu/development/icenter/repository/Publication_Coherence_DEF_en.pdf
EC (2008) ‘The Common Agricultural Policy: Sorting the Facts from the Fiction.‘ MEMO 08/422,
http://europa.eu/rapid/pressReleasesAction.do?reference=MEMO/08/422&format=HTML&aged=0&language=EN&guiLanguage=en.

CAP reform and development - Introduction, reform options and suggestions for further research
35
EC (2010a) ‗Communication from the Commission to the European Parliament, the Council, the
European Economic and Social Committee and the Committee of the Regions.‘ 18
November. http://ec.europa.eu/agriculture/cap-post-2013/communication/com2010-
672_en.pdf.
EC (2010b) Communication on the future of the CAP memo /10/587. Background Paper.
EC (2010c) Website graph DG Agriculture 1 November.
EC (2011), DG Agriculture and Rural Development, ‗Agricultural Policy Perspectives, Member
States Fact Sheets‘, February.
Eurostat COMEXT database (http://epp.eurostat.ec.europa.eu/newxtweb/mainxtnet.do).
FAO (2002) ‗Organic Agriculture, Environment and the Food Security.‘ In Scialabba, N. and
Hattam, C. (eds) Environment and Natural Resources 4.
FAO (2005) ‗The Importance of Soil Organic Matter.‘ FAO Soils Bulletin.
Gillson I., Poulton C., Balcombe K., Page S. (2004), ―Understanding the impact of cotton
subsidies on developing countries‖, http://www.odi.org.uk/resources/download/3608.pdf
GEM (2010) ‗2020 European Agriculture: Challenges & Policies.‘ Economic Policies Paper. http://gem.sciences-po.fr/content/publications/pdf/agriculture/Ebook_Agriculture.pdf.
Haas G., Köpke, U. (1994): Vergleich der Klimarelevanz ökologischer und konventioneller
Landbewirtschaftung. In: Enquete-Kommission „Schutz der Erdatmosphäre― des 12.
Deutschen Bundestages (Hg.). Studienprogramm Landwirtschaft Teilband II., Bonn
Harvey, D.R. (2010) ‗Agriculture and Multi-functionality.‘ Boulanger, P.H. and Messerlin, P.A.
(eds) 2020 European Agriculture: Challenges and Policies. Washington, DC: German
Marshall Fund of the United States.
IFOAM (2009) ‗The Future of Organic Farming in Europe: How Do European Rural Development
Programmes Support Organic Farming?‘
www.ifoam.org/about_ifoam/around_world/eu_group-new/positions/Others_II/final-
RD_study_7.1_web.pdf.
ITC. Trade Map database, available online at http://www.intracen.org/marketanalysis/.
Karapinar B., Haberli C., (2010), Food Crises and the WTO, Cambridge, New York: Cambridge
University Press.
Karapinar, B. et al (2008). ‗Sustainability Impact of Swiss Agricultural and Trade Policies on
Developing Countries‘, report by World Trade Institute, University of Bern, commissioned
by Swiss Agency for Development and Cooperation
Kauppi, H. and Widgren, M. (2005) ‗The Allocation of EU Budget before and after Enlargement.‘ http://www.pubchoicesoc.org/papers2005/Kauppi_Widgren.pdf.
Kleimann, D. (2011), ‗Taking Stock: EU common commercial policy in the Lisbon Era‘, CEPS
Working Document 346, April.
Matthews, A. (2010) ‗How Might the EU‘s Common Agricultural Policy Affect Trade and
Development after 2013?‘ ICTSD Issue Paper 29,
http://ictsd.org/downloads/2010/12/eu_agriculture_web_1smaller.pdf.
Matthews, A. (2011) ‗PCD and EU CAO Reform.‘ Presentation. Brussels, 31 March.
Monge Arino F. and Gonzales-Vega C. (2007) ‗Neutrality of Decoupled Payments in the
Presence of credit Market Imperfections,‘
http://ageconsearch.umn.edu/bitstream/9837/1/sp07mo06.pdf.
Moran et al. (2011), ―Marginal abatement cost curves for Uk agricultural greenhouse gas
emissions‖, Journal of Agricultural Economics, 62, 93 - 118
Morrissey, O., D.W. Te Velde, I Gillson and S. Wiggins (2005), ‗Sustainability Impact
Assessment Of Proposed WTO Negotiations: Agriculture‘, report for European
Commission.
OECD (2001), ―Decoupling: a conceptual overview‖
http://www.oecd.org/dataoecd/23/51/25481500.pdf
Offermann, F., Nieberg, H. and Zander, K. (2009) ‗Dependency of Organic Farms on Direct
Payments in Selected EU Member States: Today and Tomorrow.‘ Food Policy 34(3): 273-
279.
Peters R. (2006), ―Roadblock to reform: the persistence of agricultural export subsidies‖,
http://www.unctad.org/en/docs/itcdtab33_en.pdf
RASE (2010) ‗Members Agri-Bulletin.‘ Paper 365. Kenilworth: RASE.

CAP reform and development - Introduction, reform options and suggestions for further research
36
Renwick A., Giha C., Barnes A., Jansson T., Schwarz T. (2008), ―Assessment of the impact of
partial decoupling on prices, production and farm revenues within the EU‖,
http://www.oecd.org/dataoecd/21/62/44739016.pdf
Roberts M., Barrett K., Hopkins J. (2003), ―The incidence of government program payments on
agricultural land rents: the challenges of identification‖, American Journal of Agricultural
Economics, 85, 762 - 769
Sébastien, J., Josling, T.E. and Laborde, D. (2008) ‗The Consequences for the European Union
of the WTO Revised Draft Modalities for Agriculture.‘ Mimeo.
Sipilainen, T. and Kumbhakar, S. (2010) ‗Effects of Direct Payments on Farm Performance:
The Case of Dairy Farms in Northern EU Countries.‘
www.helsinki.fi/taloustiede/Abs/DP43.pdf.
Stevens, C., Wiggins, S. and Matthews, A. (2008) ‗The Options for CAP Reform and Their
Implications for Developing Countries.‘
www.odi.org.uk/resources/details.asp?id=1573&title=options-cap-reform-their-
implications-developing-countries.
Tangermann, S. and Adinolfi, F. (2011) ‗Direct Payments in the CAP Post 2013.‘
www.reformthecap.eu/sites/default/files/EP%20note%20direct%20payments_Tangerma
nn.pdf.
Te Velde D., Calì M. (2006), ―A Political Economy Perspective of UK Trade Policy‖,
http://www.odi.org.uk/resources/download/3571.pdf
Tol, R., Downing, T., Kuik, O. and Smith, J. (2004) ‗Distributional Aspects of Climate Change
Impacts.‘ Global Environmental Change 14: 259-272.
UNCTAD Trade Analysis and Information System database, available online via the World
Bank‘s World Integrated Trade Solution website (http://wits.worldbank.org/wits/).
Von Witzke A., Noleppa S., Scwarz G. (2010), ―Decoupled payments to EU farmers, production
and trade: an economic analysis for Germany‖,
http://ageconsearch.umn.edu/bitstream/59853/2/wp90.pdf
Vrolijk, H., de Bont, C., Blokland, P. and Soboh, R. (2010) ‗Farm Viability in the European
Union: Assessment of the Impact of Changes in Farm Payments.‘ http://capreform.eu/wp-content/uploads/2010/06/2010-0111.pdf.
Wiggins S., Stevens C., Matthews A. ―The options for CAP reform and their implications for
developing countries‖,
http://www.odi.org.uk/resources/details.asp?id=1573&title=options-cap-reform-their-
implications-developing-countries
World Bank (2008) ―Agriculture for development‖, World Bank World Development Report
2008.
Zahrnt, V. (2009) ‗Public Money for Public Goods: Winners and Losers from CAP Reform.‘
Working Paper 8. Brussels: ECIPE.
Zahrnt, V. (2011) ‗A Guide to CAP Reform Politics: Issues, Positions and Dynamics.‘ Working
Paper 3. Brussels: ECIPE.

CAP reform and development - Introduction, reform options and suggestions for further research
37
Appendix A
Term Description
The Common Agricultural Policy (CAP)
The CAP is an EU policy created to protect agriculture throughout the EU by controlling prices, levels of production and issuing subsidies to protect the rural/agricultural community. Currently the CAP is based on a two-pillar structure – Pillar 1 and Pillar 2; the separation of the CAP into these two different pillars is not based on the policies that each pillar funds but is more importantly based on the different budgets and different rules that are used to fund each pillar. The CAP is funded from the EU budget and accounts for roughly 40% of total EU budgetary expenditure.
Pillar 1 (product/producer support)
Includes both direct payments to farmers and market management measures. Pillar 1 expenditures are predetermined and fully funded by the EU; the Paying Agencies are reimbursed by the EU on an annual basis. Pillar 1 measures are set centrally and apply across the EU as a whole. In 2002, the Brussels Ceiling put a limit that spending on Pillar 1 (but not Pillar 2) should not rise more than 1% in cash terms until the end of the next Financial Perspective – effectively freezing Pillar 1 expenditure until 2013.
Pillar 2 (rural development policy)
Focused on improving the structural and environmental performance of agriculture by promoting local/rural development. It is co-financed by the Member States as well as from the EU Budget. Pillar 2 expenditure is programmed at the Member State/regional level and involves multi-annual commitments to beneficiaries (farmers) based on the programmes in place.
Direct Payments Direct payments are under the category of Pillar 1. They account for around ¾ of the CAP Budget. They are a direct subsidy to farmers allowed to EU Member States based on historic criteria. Direct payments replaced previous coupled payments and market measures that were phased out when levels of production in the EU became too high. Direct payments can either be classified as coupled (production-linked) payments or decoupled (unrelated to production) payments. The Single Payment Scheme (SPS), a decoupled payment introduced in 2003, is now the most important system of direct payments. In addition to SPS, farmers can still receive coupled aid under other specific support schemes linked to the land used for their crops or to their production, depending on whether the Member State concerned implements the scheme. These production-linked (coupled) aid schemes are supposed to end by 2012 at the latest and their funds are to be allocated to SPS. Direct payments are administered through Paying Agencies appointed by national authorities.
Single Payment Scheme (SPS)
The single payment falls under Pillar 1 as a form of direct aid that is allocated to farmers unrelated to their production (decoupled). The main aim is to support farmers' incomes in return for them respecting standards of environmental protection, animal welfare, food safety and keeping the land in good condition. To be eligible for SPS a farmer requires payment entitlements. These are calculated in a Member State by the historic/basic approach where the payments received by the farmer during a reference period (normally 2000, 2001, and 2002) are divided by the number of hectares farmed during the reference years. Or they can also be calculated by the regional/flat rate approach where the reference amounts are calculated at the regional level and not at the individual farmer level. Member States may also mix these two methods of entitlement calculation. SPS support can be reduced to any farmer if the farmer does not comply with standards on environmental protection, animal welfare and product quality; this is known as ‗cross-compliance‘.
Single Area Payment Scheme (SAPS)
A simplified version of the SPS support scheme within the CAP. SAPS is a different type of direct aid scheme and only offered to new members in the first years of their accession (not on offer for the EU-15). Involves payment of uniform amounts per
hectare of agricultural land in the concerned Member State, up to a national ceiling determined during the accession agreements.
Market Management Measures
These measures fall under Pillar 1 of the CAP. The EU uses these tools to control the market of agricultural goods in and out of the EU. These measures include safety net intervention, export subsidies, recourse to private storage and the use of market disturbance clauses responding to periods of price crises. Specific support schemes have been introduced or maintained for a number of products such as durum wheat, protein crops, rice, nuts, energy crops, starch potatoes, milk and milk products, seeds, cotton, tobacco, olive groves, grain and legumes. Traders and processors can, under certain conditions, receive export refunds as well as processing and

CAP reform and development - Introduction, reform options and suggestions for further research
38
transformation subsidies. These funds are administered through Paying Agencies appointed by national authorities.
Rural Development Rural development is part of Pillar 2 of the CAP. It provides assistance for farmers and others in rural areas with policies such as modernising farm buildings and machines, assisting young farmers to set up farms, assisting farmers to meet EU standards, improving product quality, support for farming in mountainous areas and other areas with handicaps, measures to improve the environment, and training in new farming techniques and rural crafts. Member States choose how to spend their rural development funds depending on regional needs, but are required to spend at least 25% on improving the environment and countryside, 10% on the competitiveness of agricultural/forestry sector and 10% on the quality of life in rural areas and encouraging diversification.
European Agricultural Guarantee Fund (EAGF)
One of the two funds for agricultural expenditure in the EU. EAGF finances direct payments to farmers and measures to regulate agricultural markets such as intervention and export refunds, basically covering Pillar 1 expenditures. The Commission reimburses these expenditures within Member States on a monthly basis.
European Agricultural Fund for Rural Development (EAFRD)
One of the two funds for agricultural expenditure in the EU. EAFRD finances the rural development programmes of the Member States, basically covering Pillar 2 expenditure. The Commission reimburses the expenditures within Member States on a quarterly basis.
MacSharry Reforms of 1992
The reforms extended milk quotas but also made the first significant reductions in the level of institutional prices for cereals and beef. The core of the MacSharry reforms was a cut of 30% in the cereal intervention prices as well as smaller cuts in the institutional prices for beef and butter. In another aspect of the reforms, cereal farmers had to leave a portion of their land out of cultivation – known as the ―set-aside programme‖. To compensate for these cutbacks in price support, farmers were given direct payments per head of livestock and hectare of crops. The reforms also made funds available for programmes to assist with the development of rural areas.
The Agenda 2000 Reform Extended the MacSharry reforms with additional compensation for cuts in institutional prices of commodities and reinforced rural development/agri-environmental schemes, more clearly forming Pillar 2 of the CAP.
The Fischler Reforms 2003 (Mid-term Review of Agenda 2000)
Continued the reductions in support prices with changes to the policies for problem commodities such as durum wheat, rice and rye. Introduced the Single Payment Scheme (SPS), which was intended to break the link between farm aid and production (decoupling), and created the related policy of ‗cross-compliance‘.
CAP Health Check 2008 Determined by the EU agricultural ministers on 20 Nov. 2008. The agreement abolished the ‗set-aside programme‘, increased milk quotas gradually until the abolition in 2015, further transferred production-linked direct aid payments to the Single Payment Scheme, extended SAPS until 2013, simplified the ‗cross-compliance‘ policy, and stated that ―all farmers receiving more than €5,000 in direct aid have their payments reduced by 5 percent and the money is transferred into the Rural Development budget. This rate will be increased to 10 percent by 2012. An additional cut of 4 percent will be made on payments above €300,000 a year‖ (known as modulation). In addition, these 2008 reforms maintained assistance to sectors with special problems under ‗Article 68‘measures.
‗Annex I goods‘ Along with ‗Non-Annex I goods‘, ‗Annex I goods‘ comprise the basic products and commodities that are covered by the CAP. ‗Annex I goods‘ include meat and poultry products; sugar; fish and dairy products; cereals and rice products; products of the milling industry (flour); fruit and vegetables, nuts, grains and seeds; wine and spirits; live trees and other plants; bulbs and roots; cut flowers; un-manufactured tobacco; cork; and flax and hemp.
‗Non-Annex I goods‘ These are goods covered by the CAP that are manufactured from the basic products of ‗Annex I goods‘ listed above. Includes glycerol, sugar confectionery, preparations of malt extract, pasta products, tapioca and sago, puffed rice and similar products,
bread, pastries, biscuits, sauces and soups.
Total Support Estimate (TSE)
TSE ‗is the overall annual monetary value of transfers arising from all policy measures that support agriculture. It is calculated by adding together the PSE, the GSSE and the taxpayer cost of consumption subsidies.‘

CAP reform and development - Introduction, reform options and suggestions for further research
39
Producer Support Estimate (PSE)
Most important indicator of agricultural support produced by the OECD, developed to monitor and evaluate progress of agricultural policy reform. The PSE ‗is an accounting of the monetary value of the support arising from many different types of policy measures that can be broadly grouped into the categories of budgetary transfers, Market Price Support (MPS), or revenue forgone.‘ The PSE is the monetary value of transfers from consumers and taxpayers to producers and can be influenced by the size and structure of the country‘s agricultural sector, inflation and the exchange rate.
Consumer Support Estimate (CSE)
CSE is the ‗annual monetary value of transfers from/to consumers from policy measures that: maintain domestic prices paid for by the first consumers at levels higher (sometimes lower) than those on world markets at the country‘s border, which is an implicit tax on consumers resulting from market price support to farmers; and provide subsidies to keep prices of commodities consumed by certain groups in the economy lower than would otherwise be the case (i.e. cheap food for poor people).‘ CSE tends to be negative because the implicit tax on consumers normally outweighs the consumer food subsidies.
Aggregate Measurement
of Support (AMS)
The AMS is an indicator developed by the WTO as the basis for a legal commitment
within the WTO Agreement on Agriculture to reduce domestic agricultural support. The AMS includes only those domestic policies that are classified under the ‗Amber Box‘. It is frequently used in comparison with the PSE. Like the PSE, the AMS is measured annually and includes MPS (but each indicator calculates it differently), budgetary transfers and revenue forgone.

CAP reform and development - Introduction, reform options and suggestions for further research
40
Appendix B: The economics behind the choice to leave the intervention price to introduce decoupled payments
The economics behind this statement is simple. Given a standard supply function S and being
p1 the government minimum regulated minimum producer price, then q1 is the quantity
supplied at the minimum price. The shaded area represents the gain of the producer surplus
resulting from the producer price support. The idea of direct payments is to eliminate the price
support by providing producers the value of the producer surplus.
Figure B1: The economics behind the non distorting effect of decoupling payments
Von Witzke et al. (2010) also stress that in many cases the reality does not match predictions
of standard textbook theory, because in reality a wide share of subsidies is still coupled and
because it does not incorporate other important factors such as the farmers` risk aversion.
P1
Q1
P0
Q0
Producer surplus

CAP reform and development - Introduction, reform options and suggestions for further research
41
Appendix C: Different CAP negotiation positions
France France has not yet delivered a comprehensive position paper of its own, but the Ministry of Agriculture has expressed the French position at various occasions. Priorities are: the preservation of a large CAP budget, of a large, fully EU-financed first pillar, and of
current distribution criteria for subsidy allocation across Member States; the continuation of market management and the introduction of new subsidies for risk management; support to ailing sectors, especially livestock; enhancing production as a means to ensure European and global food security; preference for EU products through tariffs and labels; maintenance of agriculture across the entire territory; and the promotion of territorial balance/rural through agriculture
Germany The two-pillar system with a strong first pillar, centred on direct income support, should be maintained, together with the current distribution of subsidies across Member States. The CAP should be further simplified and remaining market interventions be reduced to a safety net. Socio-economic objectives should remain central.
Uk, Sweden, Denmark, The Netherlands and Malta
Led by Uk, the reform narrative of this coalition accentuates more the competitiveness of EU agriculture: it supports removing the distortions arising from current intervention and notes the need for investments in research, development and extension and reductions in the regulatory burden on farmers. The UK negotiating position is also shaped by the rebate on UK contributions to the EU budget
France, Germany, Uk, the Netherlands and Finland
In a public letter addressed to José Barroso, heads of state from France, Germany, the UK, the Netherlands and Finland insisted on budget discipline. In particular, they wrote that ‗payment appropriations should increase, at most, by no more than inflation over the next financial perspectives‘ and
that ‗commitment appropriations over the next multiannual financial framework should not exceed the 2013 level with a growth rate below the rate of inflation
Poland and the new member States
Led by Poland, the Eastern European mainstream credo consists in a large CAP budget with a strong EU-financed income support component, redistribution of subsidies to the benefits of the new Member States, centralised spending with as little co-financing and national top-ups as possible, and investments in rural development and agricultural productivity
Farmers and land owners The European farmer federation Copa-Cogeca takes a hard line.57 It wishes to maintain, and in many cases strengthen, most elements of the CAP, including export subsidies (until trading partners agree to eliminate their own export support mechanisms) and intervention buying (with higher intervention prices and broader product coverage). Direct income support shall be limited to active farmers and rural development be refocused on agriculture
Agricultural economists Agricultural economists from across Europe have issued two declarations on the post-2013 CAP. The 2009 declaration on ‗A Common Agricultural Policy for European Public Goods‘ provides a five-page blueprint for a better CAP. It concludes that ‗the future role of the CAP should be to give farmers appropriate incentives to deliver European public goods demanded by society, particularly in the environmental realm‘ and that ‗a future CAP in line with these objectives would differ fundamentally from the current CAP
Source: Zahrnt (2011).

CAP reform and development - Introduction, reform options and suggestions for further research
42
Appendix D: EU tariffs
Regime
Butter Cheese Beef & veal
Cotton Tobacco
Sugar Wheat Soya beans
Poultry meat
Bananas
Rice
Bound rates
189.6 or 231.3
€/100kg
6.58 to 221.2
€/100kg/net
12.8% + 141.4 to 304.1
€/100kg/net
0 10-74.9%
or 11.2% min.
22/max. 56 €/100 kg/net
or 18.4% min.
22/max. 24 €/100 kg/net
8 or 12.8% or 0.4
€/100kg to
16%+50.7 €/
100kg/net mas
12.8% or 95 or 148 €/t
0 0 or 6.4% or 18.7 to 128.3
€/100kg/net
680 €/1000k
g/net
7.7% or 128 to 416 €/t
MFN a 189.6 or 231.3
€/100kg
7.7% to 221.2
€/100kg
12.8% + 141.4 to
304.1 €/100kg
/net
Duty free
10-74.9%
or 10-11.2% min.
22/max. 56 €/100kg/net
8 or 12.8%
or 0.4 €/100kg
to 16%+50
.7 €/ 100kg/net mas
12.8% or 95 or
148 €/t
Duty free
0 or 6.4% or
18.7 to 128.3
€/100kg/net
176 €/1000k
g/net
7.7% or 65 to
211 €/t
Preferential
Standard GSP b
n/a n/a n/a n/a 6.5-52.4% or 3.9-7.7% max.
56 €/100kg/net
8 or 8.9% or
0.4 €/100kg
to 12.5%+50.7 €/ 100kg/net mas
n/a n/a 2.9% on 3 lines which are
6.4% under MFN,
otherwise no pref.
n/a n/a
GSP+ c n/a n/a n/a n/a Duty free
0 or 8% or 0.4
€/100kg to
50.7 €/100kg/net
mas
n/a n/a 0% on 3 lines which are
6.4% under MFN,
otherwise no pref.
n/a n/a
EBA d Duty free
Duty free
Duty free
n/a Duty free
Duty free
Duty free
n/a Duty free
Duty free
Duty free
EPA e Duty free
Duty free
Duty free
n/a Duty free
Duty free
(subject to an
‗automatic
volume safe-guard clause‘ until
2015)
Duty free
n/a Duty free
Duty free
Duty free
Albania
Duty free
Duty free
n/a n/a Duty free
n/a Duty free
n/a Duty free
Duty free
Duty free
Algeria n/a n/a n/a n/a 0% or 3.9-7.7% max.
56 €/100
0 or 8% or 0.4
€/100kg to
50.7 €/1
n/a n/a n/a n/a n/a

CAP reform and development - Introduction, reform options and suggestions for further research
43
kg/net 00kg/net mas
Bosnia/ Herzegovina
Duty free
Duty free
n/a n/a Duty free
0 or 8% or 0.4
€/100kg to
50.7 €/100kg/net
mas
Duty free
n/a Duty free
Duty free
Duty free
Chile n/a 0% to 221.2
€/100kg
n/a n/a 0-6.5% or 3.9-7.7%
max. 56 €/100kg/net
0 or 8.9% or
0.4
€/100kg to
12.5% + 50.7 €/100kg/net mas
1.6% or 95 or
148 €/t
n/a 0% or 18.7 to 128.3
€/100kg/net
n/a 0% or 65 to
211 €/t
Croatia
Duty free
Duty free
n/a n/a Duty free
n/a Duty free
n/a Duty free
Duty free
Duty free
Egypt n/a n/a n/a n/a 0% or 3.9-7.7% max.
56 €/100kg/net
0 or 8% or 0.4
€/100kg to
50.7 €/100kg/net
mas
n/a n/a n/a n/a n/a
Regime
Butter Cheese Beef & veal
Cotton Tobacco
Sugar Wheat Soya beans
Poultry meat
Bananas
Rice
Gaza Strip
n/a n/a n/a n/a 0% or 3.9-7.7% max.
56 €/100kg/net
0 or 8% or 0.4
€/100kg to
50.7 €/100kg/net
mas
n/a n/a n/a n/a n/a
India n/a n/a n/a n/a n/a n/a n/a n/a n/a n/a 0 or 7.7% or
65 to 211 €/t
Jordan Duty free
Duty free
Duty free
n/a Duty free
Duty free
Duty free
n/a Duty free
Duty free
Duty free
Lebanon
Duty free
Duty free
Duty free
n/a Duty free
0% or 33.9
€/100kg to
50.7 €/100kg/net
mas
Duty free
n/a Duty free
Duty free
Duty free
Macedonia FYR
Duty free
Duty free
n/a n/a Duty free
n/a Duty free
n/a 0% or 26.9
€/100kg/net
Duty free
Duty free
Mexico n/a n/a n/a n/a Duty free
n/a n/a n/a 0% or 18.7 to 128.3
€/100kg/net
n/a n/a
Moldova
n/a n/a n/a n/a Duty free
0% or 41.9
€/100kg/net
0% or 95 or
148 €/t
n/a n/a Duty free
Duty free
Montenegro
Duty free
Duty free
n/a n/a Duty free
n/a Duty free
n/a Duty free
Duty free
Duty free
Morocco
n/a n/a n/a n/a 0% or 3.9-7.7% max.
56 €/100kg/net
0 or 8% or 0.4
€/100kg to
50.7 €/100kg/net
n/a n/a n/a n/a n/a

CAP reform and development - Introduction, reform options and suggestions for further research
44
mas
Pakistan
n/a n/a n/a n/a n/a n/a n/a n/a n/a n/a 0 or 7.7% or
65 to 211 €/t
Serbia Duty free
Duty free
n/a n/a Duty free
n/a Duty free
n/a Duty free
Duty free
Duty free
South Africa
n/a 7.7% to 188.2
€/100kg
n/a n/a 0% or 1.7€/100
kgnet
8 or 9.4% 0.4
€/100kg to
13%+50.7 €/100kg/net mas
1.5% or 16.1 or 25.1
€/1000kg/net
n/a 0% or 3.1 oto 28.8
€/100kg
n/a n/a
Syria n/a n/a n/a n/a 0% or 3.9-7.7% max.
56 €/100kg/net
0 or 8% or 0.4
€/100kg to
50.7 €/100kg/net
mas
n/a n/a n/a n/a n/a
Tunisia
n/a n/a n/a n/a 0% or 3.9-7.7% max.
56 €/100kg/net
0 or 8% or 0.4
€/100kg to
50.7 €/100kg/net
mas
n/a n/a n/a n/a n/a
Turkey n/a 0% to 221.2
€/100kg
141.4 to 304.1
€/100kg/net
n/a Duty free
0% or 0.4
€/100kg to
50.7 €/100kg/net
mas
0% or 95 or
148 €/t
n/a 0% or 18.7 to 128.3
€/100kg/net
n/a 0% or 65 to
211 €/t

CAP reform and development - Introduction, reform options and suggestions for further research
45
Regime
Butter Cheese Beef & veal
Cotton Tobacco
Sugar Wheat Soya beans
Poultry meat
Bananas
Rice
New
FTAs
Colombia
No offer DF 7 yrs after EIF (42 lines)
No offer
(2 lines)
DFQ 5,600t with annual increase of 560t (4 lines)
No offer
(10 lines)
DF on EIF
DF on EIF
DF 3 yrs after EIF (1 line - maple syrup)
AV zero
on EIF (1 line - fructose)
DFQ of 62 000t, with annual increase of 1,860t (5 lines)
No offer
(24 lines)
DF on EIF
DF on EIF
DF on EIF (9 lines)
No offer
(83 lines)
Reduction from €145/t to €75/t in annual stages to 2020
DF on EIF (1 line - in husk for sowing)
Peru DFQ of 500t, with annual increase of 50t
DF 7 yrs
after EIF
DFQ of 2,500t, with annual increase of 120t
DF 7 yrs
after EIF
DFQ of 2,150t, with a yearly increase of 215t
DF on EIF
DF on EIF
DF on EIF (1 line - maltose)
DF 3 yrs
after EIF (1 line - maple syrup)
DFQ of 22,000t, with a yearly increase of 660t (20 lines - 1 o/w has elimination of AV element on EIF)
No offer
(9 lines)
DF on EIF
DF on EIF
DF on EIF (9 lines)
DF 3 yrs
after EIF (1 line)
DFQ of 7,500t, with a yearly increase of 750t (31 lines)
Reduction from €145/t to €75/t in annual stages to 2020
DF on EIF (1 line - in husk for sowing)
General notes:
In most cases there are numerous different rates applying to goods within the broad tariff headings used for the CAP product group in question. The ranges shown are intended to indicate the lowest and highest, but in the case of specific or compound duties relative magnitude is very hard to gauge.
'n/a' denotes that there is no preference for the regime/country in question. In the case of Standard GSP and GSP+, MFN rates will apply. In the case of FTAs, the rate applicable will be that shown for Standard GSP (if product covered/country eligible) or MFN - see specific notes below.
Where preferences are available on some but not all goods within the broad CAP product group, the range takes account of rates applying under the next most favourable regime (see notes below) for goods not covered.
Where preferences exist, but are less good than Standard GSP, it is the preferential rate that is shown here - even though the country probably claims the GSP rate. (e.g. South Africa/sugar).
Specific notes:
(a) The most favourable regime available for: Belarus and North Korea.
(b) The most favourable regime available for: Argentina, Bahrain, Brazil, Brunei, China, Congo, Cook Islands, Cuba, Gabon, India, Indonesia, Iran, Iraq, Kazakhstan, Kuwait, Kyrgyzstan, Libya, Malaysia, Marshall Islands, Micronesia, Nauru, Nigeria, Niue, Oman, Pakistan, Palau, Philippines, Qatar, Russian Federation, Saudi Arabia, Sri Lanka, Tajikistan, Thailand, Tonga, Turkmenistan, Ukraine, United Arab Emirates, Uruguay, Uzbekistan, Venezuela, Viet Nam. (Although India and Pakistan receive a preference on two rice items, and Brazil is not eligible for any GSP preference on sugar and tobacco.) MFN rates apply to goods not covered by the GSP.
(c) The most favourable regime available for: Armenia, Azerbaijan, Bolivia, Colombia, Costa Rica, Ecuador, El Salvador, Georgia, Guatemala, Honduras, Mongolia, Nicaragua, Panama, Paraguay and Peru. MFN rates apply to goods not covered by GSP+.
(d) The most favourable regime available for: Afghanistan, Angola, Bangladesh, Benin, Bhutan, Burkina Faso, Cambodia, Cape Verde, Central African Republic, Chad, Congo DR, Djibouti, Equatorial Guinea, Eritrea, Ethiopia, Gambia, Guinea, Guinea-Bissau, Haiti, Kiribati, Lao PDR, Liberia, Malawi,

CAP reform and development - Introduction, reform options and suggestions for further research
46
Maldives, Mali, Mauritania, Myanmar, Nepal, Niger, Samoa, Sao Tome and Principe, Senegal, Sierra Leone, Solomon Islands, Somalia, Sudan, Timor-Leste, Togo, Tuvalu, Vanuatu, Yemen. All CAP goods are covered.
(e) The most favourable regime available for: Antigua/Barbuda, Bahamas, Barbados, Belize, Botswana, Burundi, Cameroon, Comoros, Côte d'Ivoire, Dominica, Dominican Rep., Fiji, Ghana, Grenada, Guyana, Jamaica, Kenya, Lesotho, Madagascar, Mauritius, Mozambique, Namibia, Papua New Guinea, Rwanda, St Kitts/Nevis, St Lucia, St Vincent/Grenadines, Seychelles, Suriname, Swaziland, Tanzania, Trinidad/Tobago, Uganda, Zambia, Zimbabwe. All CAP goods are covered.
Sources: EU 2010 tariff schedules from UNCTAD‘s TRAINS database; Official Journal L211 of 6 August 2008; European Commission Taxation and Customs Union Taric Consultation (online at:
http://ec.europa.eu/taxation_customs/dds2/taric/geographical_consultation.jsp?Lang=en&SimDate=20110324&Code=&Description=&Group=SPGL&Expand=true).

CAP reform and development - Introduction, reform options and suggestions for further research
47
Appendix E : Developing country exporters and importers for which highest EU intervention product groups are most important
Table E1: Developing country exporters for which highest EU intervention product groups are most important a
CAP product groupb
Developing country exporter Exports of product group
to world
Total exports to world
Product group share in total
exports to world
Meat Uruguay 747,907 3,861,604 19.4%
Paraguay 399,359 2,270,868 17.6%
Nicaragua 165,716 998,870 16.6%
Brazil 6,510,894 109,702,736 5.9%
Somalia 10,248 180,356 5.7%
Botswana 82,301 2,477,870 3.3%
Argentina 1,303,036 39,916,724 3.3%
Namibia 43,423 1,503,344 2.9%
Belarus 330,946 15,260,124 2.2%
Dairy Nicaragua 91,946 998,870 9.2%
Djibouti 21,107 260,792 8.1%
Uruguay 263,189 3,861,604 6.8%
Gambia 2,766 47,343 5.8%
Belarus 726,347 15,260,124 4.8%
Sao Tome And Principe 171 5,820 2.9%
Grains Belize 245,021 1,390,850 17.6%
Paraguay 327,599 2,270,868 14.4%
Uruguay 520,827 3,861,604 13.5%
Guyana 60,593 523,553 11.6%
Pakistan 1,307,312 12,587,351 10.4%
Ukraine 2,549,919 28,463,210 9.0%
Saint Vincent and the Grenadines 3,085 35,181 8.8%
Argentina 2,304,616 39,916,724 5.8%
Moldova 50,815 923,235 5.5%
Serbia 234,575 5,983,720 3.9%
Lao PDR 27,390 781,863 3.5%
Thailand 3,802,021 109,345,984 3.5%
Viet Nam 1,406,271 43,100,084 3.3%
Senegal 35,866 1,446,538 2.5%
Uganda 25,159 1,052,974 2.4%
Djibouti 5,481 260,792 2.1%
Myanmar 84,156 4,253,367 2.0%
Vegetables Tonga 2,056 10,657 19.3%
Ethiopia 210,827 1,160,283 18.2%
Myanmar 721,510 4,253,367 17.0%
Saint Vincent and the Grenadines 3,765 35,181 10.7%
Nepal 56,973 635,293 9.0%
Jordan 270,463 4,564,468 5.9%
Nicaragua 55,540 998,870 5.6%
Kenya 161,221 3,200,449 5.0%
Kyrgyzstan 32,695 844,865 3.9%
Niger 9,556 260,613 3.7%
Morocco 345,121 9,993,940 3.5%
Egypt 479,956 16,031,634 3.0%
Afghanistan 8,495 289,282 2.9%
Tajikistan 18,416 644,691 2.9%

CAP reform and development - Introduction, reform options and suggestions for further research
48
CAP product groupb
Developing country exporter Exports of product group
to world
Total exports to world
Product group share in total
exports to world
Malawi 23,489 851,779 2.8%
FYR Macedonia 52,240 1,929,923 2.7%
Palestine 1,380 52,630 2.6%
Guatemala 127,280 5,168,816 2.5%
Syrian Arab Republic 101,803 4,141,629 2.5%
Fiji 10,482 450,783 2.3%
Tanzania 45,931 2,138,492 2.1%
Bhutan 7,267 355,539 2.0%
Fruit and nuts Guinea-Bissau 61,414 66,879 91.8%
Afghanistan 146,655 289,282 50.7%
Dominica 22,581 57,678 39.2%
Benin 69,522 238,134 29.2%
Panama 106,922 437,644 24.4%
Saint Vincent and the Grenadines 5,968 35,181 17.0%
Ecuador 1,496,171 9,840,807 15.2%
Saint Lucia 20,916 147,435 14.2%
Tajikistan 89,270 644,691 13.8%
Costa Rica 721,153 6,245,878 11.5%
Moldova 89,937 923,235 9.7%
Honduras 180,165 1,884,588 9.6%
Guatemala 458,366 5,168,816 8.9%
Cameroon 217,250 2,534,370 8.6%
Gambia 3,758 47,343 7.9%
Georgia 63,149 817,016 7.7%
Chile 2,502,297 38,527,584 6.5%
Ghana 112,426 2,349,331 4.8%
Belize 61,117 1,390,850 4.4%
Suriname 41,199 996,419 4.1%
Mali 6,183 149,630 4.1%
Uzbekistan 156,676 3,839,126 4.1%
Serbia 230,506 5,983,720 3.9%
Palestine 1,909 52,630 3.6%
Egypt 573,564 16,031,634 3.6%
Burundi 2,803 80,976 3.5%
Tonga 347 10,657 3.3%
Morocco 323,038 9,993,940 3.2%
Dominican Republic 107,183 3,365,239 3.2%
Côte d'Ivoire 230,802 7,371,186 3.1%
Tanzania 66,200 2,138,492 3.1%
South Africa 1,160,998 38,622,352 3.0%
Kyrgyzstan 25,189 844,865 3.0%
Turkey 2,152,420 73,237,000 2.9%
Namibia 43,957 1,503,344 2.9%
Colombia 635,097 23,556,774 2.7%
Swaziland 15,029 593,120 2.5%
Haiti 9,729 471,749 2.1%
Bhutan 7,283 355,539 2.0%
Note: (a) All developing countries for which exports in the product group account for 2% or more of total exports to the world. (b) Exports in HS codes noted in Error! Reference source not found..
Source: Derived from data obtained from ITC Trade Map. Includes both own-reported and mirror data.

CAP reform and development - Introduction, reform options and suggestions for further research
49
Table E2: Developing country importers for which highest EU intervention product groups are most important a
CAP product group b
Developing country exporter Imports of product group
from world
Total imports from world
Product group share in total im-ports from
world
Meat Tonga 8,883 71,170 12.5% Samoa 12,964 165,305 7.8% Comoros 10,454 139,590 7.5% Cuba 144,177 3,380,811 4.3% Gabon 57,794 1,431,636 4.0% Montenegro 62,002 1,610,771 3.8%
Grenada 5,395 144,575 3.7%
Saint Vincent and the Grenadines 7,871 239,124 3.3% Russian Federation 3,843,566 122,488,816 3.1% Benin 117,573 3,792,874 3.1% Congo 69,781 2,252,040 3.1% Kuwait 339,864 11,287,207 3.0% Micronesia 2,818 93,669 3.0%
Cook Islands 2,167 76,794 2.8% Venezuela 701,370 27,732,540 2.5% Bahamas 47,837 1,934,940 2.5% Kiribati 975 40,123 2.4% Dominica 3,703 154,976 2.4% Congo DR 52,674 2,206,650 2.4%
Palau 888 38,751 2.3% Sao Tome and Principe 1,697 74,058 2.3% Angola 258,018 11,479,337 2.2%
Saint Kitts and Nevis 3,264 146,715 2.2% FYR Macedonia 78,943 3,616,095 2.2% Iraq 350,122 16,187,980 2.2% Papua New Guinea 51,127 2,461,846 2.1%
Dairy Somalia 36,218 733,030 4.9% Cape Verde 18,529 481,151 3.9% Sao Tome and Principe 2,437 74,058 3.3% Senegal 99,309 3,379,318 2.9% Grenada 4,197 144,575 2.9% Djibouti 12,816 464,363 2.8%
Tonga 1,890 71,170 2.7% Samoa 4,339 165,305 2.6% Mauritania 30,903 1,299,621 2.4% Niger 20,514 908,401 2.3% Maldives 15,547 702,624 2.2%
Algeria 615,310 28,149,634 2.2%
Mauritius 57,844 2,673,756 2.2% Yemen 136,058 6,585,866 2.1% Haiti 33,010 1,612,384 2.0% Montenegro 32,294 1,610,771 2.0%
Grains Yemen 828,043 6,585,866 12.6% Côte d'Ivoire 527,374 4,990,524 10.6%
Guinea-Bissau 21,851 207,858 10.5% Haiti 163,939 1,612,384 10.2% Gambia 21,869 217,937 10.0% Senegal 334,753 3,379,318 9.9% Comoros 13,628 139,590 9.8% Benin 324,136 3,792,874 8.5% Somalia 57,940 733,030 7.9%
Mauritania 99,994 1,299,621 7.7% Kenya 537,226 7,315,202 7.3%
Mozambique 197,612 2,699,072 7.3% Zimbabwe 158,275 2,528,828 6.3% Cuba 211,037 3,380,811 6.2%

CAP reform and development - Introduction, reform options and suggestions for further research
50
CAP product group b
Developing country exporter Imports of product group
from world
Total imports from world
Product group share in total im-ports from
world
Eritrea 13,708 226,766 6.0% Sierra Leone 25,942 434,756 6.0% Algeria 1,658,902 28,149,634 5.9% Syria 595,395 10,462,387 5.7% Cape Verde 26,457 481,151 5.5% Iran 2,083,973 38,378,092 5.4%
Cameroon 140,629 2,611,824 5.4% Egypt 1,734,580 33,827,972 5.1% Sudan 313,386 6,159,251 5.1% Burkina Faso 67,671 1,341,059 5.0% Iraq 800,107 16,187,980 4.9%
Nigeria 1,133,876 24,312,024 4.7% Ethiopia 264,014 5,717,559 4.6%
Niger 41,347 908,401 4.6% Saint Vincent and the Grenadines 10,584 239,124 4.4% Sao Tome and Principe 3,259 74,058 4.4% Malawi 63,253 1,454,871 4.3% Micronesia 4,064 93,669 4.3% Philippines 1,424,240 32,895,988 4.3%
Papua New Guinea 103,843 2,461,846 4.2% Uganda 128,091 3,051,505 4.2% Bangladesh 545,547 13,170,512 4.1% Fiji 41,276 1,030,394 4.0% Jordan 377,869 10,092,495 3.7% Peru 578,959 15,681,388 3.7% Azerbaijan 159,897 4,387,587 3.6%
Colombia 846,199 23,588,816 3.6% Saudi Arabia 2,425,681 68,514,360 3.5% Tanzania 165,590 4,682,836 3.5% Swaziland 6,761 193,378 3.5% Armenia 78,429 2,276,325 3.4% Honduras 146,463 4,268,895 3.4% Jamaica 123,276 3,631,254 3.4%
Morocco 795,602 23,685,394 3.4% Grenada 4,765 144,575 3.3% Mali 47,757 1,455,168 3.3% Nicaragua 81,639 2,494,289 3.3% Sri Lanka 219,195 6,762,977 3.2% Bhutan 12,216 379,605 3.2%
Burundi 7,862 247,231 3.2% Guinea 42,273 1,341,943 3.2%
Mauritius 82,581 2,673,756 3.1% El Salvador 160,070 5,201,906 3.1% Kyrgyzstan 63,309 2,132,370 3.0% Ghana 167,993 5,842,828 2.9% Tajikistan 51,790 1,857,271 2.8%
Guatemala 227,787 8,261,232 2.8% Rwanda 24,262 902,018 2.7% Georgia 83,312 3,169,901 2.6% Palau 1,003 38,751 2.6% Dominican Republic 222,095 8,643,467 2.6% Libya 349,058 13,647,402 2.6% Gabon 35,282 1,431,636 2.5%
Tunisia 335,370 13,692,644 2.4% Congo DR 53,873 2,206,650 2.4% Korea PDR 48,673 2,055,276 2.4%
Togo 47,110 2,061,978 2.3% Kuwait 257,327 11,287,207 2.3% Samoa 3,460 165,305 2.1%

CAP reform and development - Introduction, reform options and suggestions for further research
51
CAP product group b
Developing country exporter Imports of product group
from world
Total imports from world
Product group share in total im-ports from
world
Vegetables Somalia 91,403 733,030 12.5% Bangladesh 460,349 13,170,512 3.5% Sri Lanka 173,959 6,762,977 2.6% Maldives 16,904 702,624 2.4%
Fruit & nuts Niue 7,485 247,296 3.0%
Djibouti 13,101 464,363 2.8% Russian Federation 3,150,484 122,488,816 2.6% Maldives 15,180 702,624 2.2%
Notes: (a) All developing countries for which imports in the product group account for 2% or more of total imports from the world. (b) Imports in HS codes noted in Error! Reference source not found..
Source: Derived from data obtained from ITC Trade Map. Includes both own-reported and mirror data.
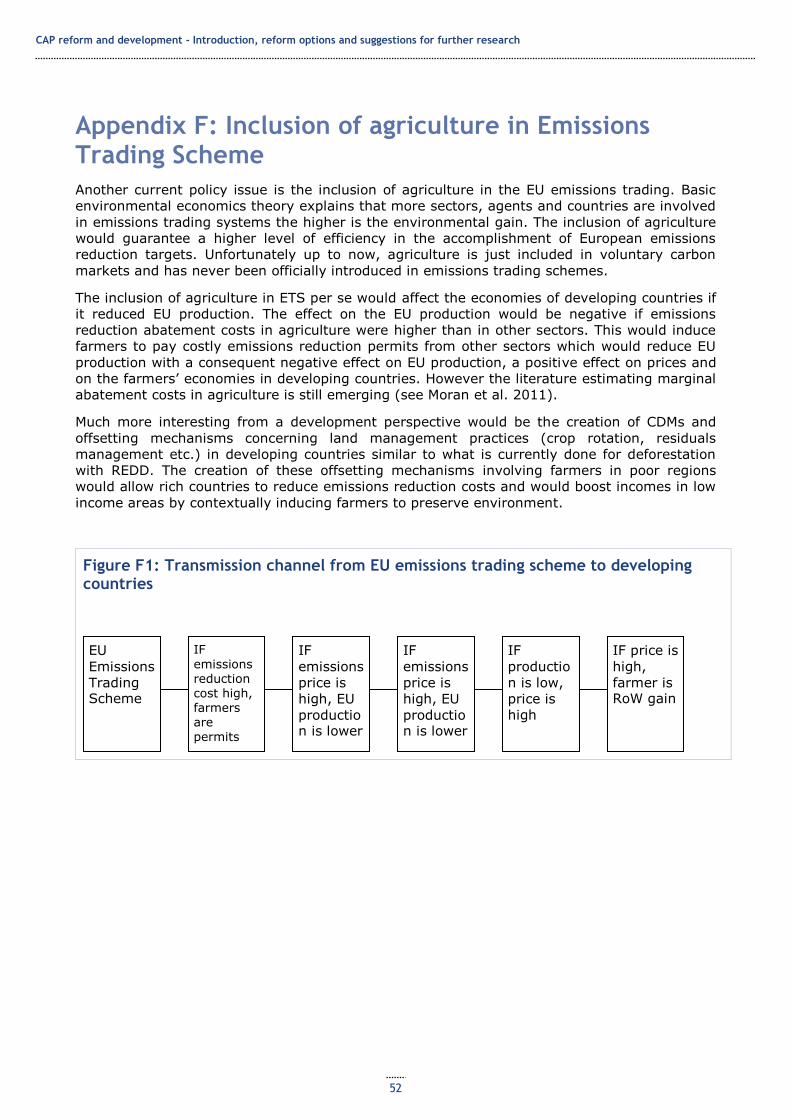
CAP reform and development - Introduction, reform options and suggestions for further research
52
Appendix F: Inclusion of agriculture in Emissions Trading Scheme
Another current policy issue is the inclusion of agriculture in the EU emissions trading. Basic
environmental economics theory explains that more sectors, agents and countries are involved
in emissions trading systems the higher is the environmental gain. The inclusion of agriculture
would guarantee a higher level of efficiency in the accomplishment of European emissions
reduction targets. Unfortunately up to now, agriculture is just included in voluntary carbon
markets and has never been officially introduced in emissions trading schemes.
The inclusion of agriculture in ETS per se would affect the economies of developing countries if
it reduced EU production. The effect on the EU production would be negative if emissions
reduction abatement costs in agriculture were higher than in other sectors. This would induce
farmers to pay costly emissions reduction permits from other sectors which would reduce EU
production with a consequent negative effect on EU production, a positive effect on prices and
on the farmers‘ economies in developing countries. However the literature estimating marginal
abatement costs in agriculture is still emerging (see Moran et al. 2011).
Much more interesting from a development perspective would be the creation of CDMs and
offsetting mechanisms concerning land management practices (crop rotation, residuals
management etc.) in developing countries similar to what is currently done for deforestation
with REDD. The creation of these offsetting mechanisms involving farmers in poor regions
would allow rich countries to reduce emissions reduction costs and would boost incomes in low
income areas by contextually inducing farmers to preserve environment.
Figure F1: Transmission channel from EU emissions trading scheme to developing countries
EU
Emissions
Trading Scheme
IF
emissions reduction cost high, farmers are permits buyers
IF
emissions
price is
high, EU
production is lower
IF
emissions
price is
high, EU
production is lower
IF
productio
n is low,
price is
high
IF price is
high,
farmer is RoW gain