canary in a coalmine: securities lending predicting the...
TRANSCRIPT

* Kempf: Chicago Booth School of Business, email: [email protected]; Manconi: Bocconi
University, email: [email protected]; Massa: INSEAD, email: [email protected]. Part of this
paper was developed while the first author was a visiting PhD student at Yale School of Management. We thank
Lamont Black (discussant), Boris Vallee, Pedro Saffi, Dragon Tang (discussant), and participants at the FIRS and
EFA 2016 conferences.
Canary in a Coalmine: Securities Lending Predicting
the Performance of Securitized Bonds
Elisabeth Kempf Alberto Manconi Massimo Massa*
August 2016
Abstract
In illiquid markets, trading by informed investors can have limited predictive power, because
trading volumes are low and may not be timely. In these conditions, changes in the lendable
amounts of securities can act as a canary in a coalmine, and predict future performance when
trading activity cannot. We test this argument on the market for structured finance products
(“securitized bonds”). We find strong evidence that changes in amounts available for lending
(lendable) predict future performance (delinquency and foreclosure rates). In contrast, we do
not find any evidence of predictability from changes in the amounts on loan. While investor
trades have comparable predictive power to changes in lendable amounts in general, lendable
amounts are a better predictor in illiquid markets. Overall, these findings are consistent with
the hypothesis that securities holders (lenders) possess material information in this segment.
JEL codes: G14, G23, G01
Keywords: Securitization; Securities lending; Informed trading.

2
It’s one thing to bet on red or black and know that you are betting on red or black. It’s another to bet
on a form of red and not to know it [Lewis (2010)].
Introduction
Trading by informed investors plays a crucial role in financial markets, as a source of
information. This intuition is behind, for instance, arguments that there should be no
restriction on insider trading (Leland (1992)), or that short sale restrictions can make market
prices less efficient (Miller (1977)). Indeed, a large body of evidence supports the notion that
trading by certain classes of market participants, e.g. corporate insiders (Seyhun (1992),
Meulbroek (1992)), institutional investors (Baker, Litov, Wachter, and Wurgler (2010), Puckett
and Yan (2011)), or short sellers (Saffi and Sigurdsson (2011), Boehmer and Wu (2013)), is
informative.
As an increasing volume of financial securities is traded in over-the-counter, illiquid
markets, however, actual trading activity can become less informative, for at least two reasons.
First, it is harder to observe trading volumes in OTC markets. Second, and more important,
although some investors may possess valuable information and be willing to trade on it, lack
of transparency and uncertainty can make the security illiquid, so that trading cannot occur in
the first place, and thus cannot be informative.
In this paper, we propose to overcome these difficulties by looking at an additional
signal of the presence of informed investors in the market: the amount of a security available
for lending. Securities lending involves the temporary transfer of a security from a lender to a
borrower, typically against cash and/or securities collateral. The global securities lending
market has grown tremendously since the early 2000s, with several trillions of dollars on loan
and many more available for lending, and is now close in size to its pre-crisis peak in 2007
(Dive, Hodge, and Jones (2011)). Increasingly, securities lending is an important component of
the business model, and a sizeable source of funding, for insurance companies (Foley-Fisher,
Narajabad, and Verani (2015)) and investment advisors (Evans, Ferreira, and Prado (2016)).
Securities lenders are typically large institutional investors who hold in their portfolio
a security, which they make available for lending, earning a fee in the event that the security
is loaned. Suppose the investor comes into possession of negative information regarding the
future value of a given security, and would like to liquidate her holdings of it. Before she can
sell the security, she will have to reduce the amount available for lending. As a result, a drop

3
in the lendable amount indicates a future worsening in the security’s performance.
Importantly, the signal from the lendable amount should be informative even in the presence
of a market freeze, when investors are not readily able to sell their holdings. We provide
empirical evidence consistent with this mechanism.
To run this test, we focus on securities lending in the structured finance products
(henceforth, “securitized bonds”) segment, as a relatively clean setting to take our argument
to the data. Securitized bonds are a market segment of first-order economic importance:
according to the Securities Industry and Financial Markets Association (SIFMA), as of 2012 its
outstanding value in the U.S. was more than $10 trillion, or 1.4 times the size of the corporate
bond market.
In addition, the features of the structured finance segment mirror the conditions of
limited trading volumes and high information asymmetry at the root of our test. First, trading
volumes can be low and uninformative. Securitized bonds typically trade in over-the-counter,
illiquid markets, where the information content of trading activity might be limited, and
trading itself is prone to freezes. This was especially true, for instance, in the wake of the
financial crisis of 2007-09, where trading volumes in this segment dried up (Getter, Jickling,
Lamonte, and Murphy (2007), Gorton (2008), Manconi, Massa, and Yasuda (2012)).
Second, this is a segment where information asymmetry considerations are very
relevant. In fact, a debate has waged in the literature on whether or not (some) investors
possessed information about structured finance products prior to the recent crisis. According
to the “investor naïveté” view, market participants were largely oblivious to the risk associated
with holding these securities (Bolton, Frexias, and Shapiro (2012), Skreta and Veldkamp
(2009)). In contrast, the “regulatory arbitrage” view suggests that at least some investors were
aware of a mispricing of risk in securitized bonds, which they exploited, e.g. to profitably
circumvent regulatory restrictions on their holdings (Acharya and Richardson (2009),
Calomiris (2009), Efing (2016)).
Using a novel, comprehensive dataset on securitized bonds lending and borrowing,
our central finding is a strong, statistically robust relationship between changes in the amount
of securities made available for lending (“lendable”) and the future performance of securitized
bonds’ underlying pool of loans. Like a canary in a coalmine, a drop in the amount of a given
security available for lending heralds a worsening performance of the underlying deal loans.
This predictability result is economically meaningful, and it is immediately visible in the data,

4
as illustrated in Figure 3. Securities experiencing the largest decline in the lendable amount
exhibit a 15% increase in delinquency rates, and a 14% increase in foreclosures, in their
underlying pool of loans. The simple intuition from Figure 3 is confirmed in more formal,
regression-based tests. Further, it is robust to the inclusion of deal fixed effects, i.e. to
comparing securities whose value depends on the same underlying pool of loans.
In contrast, we do not find any evidence of predictability associated with securities
borrowing. This runs counter to the intuition from the literature on the market for borrowing
shares, typically motivated by short-selling, which does appear to predict future stock returns
(D’Avolio (2002), Cohen, Diether, and Malloy (2007), Engelberg, Reed, and Ringgenberg
(2012)). It is consistent, however, with fixed income securities borrowing having other
objectives than short selling, for instance borrowing cash via a reverse repo agreement
(Asquith, Au, Covert, and Pathak (2013)), as well as with anecdotal accounts such as Lewis
(2010), suggesting that investors who wanted to short structured finance products would
typically resort to alternative instruments, e.g. such as credit default swaps.
We argue that the possible economic mechanism underlying the predictive power of
lendable amounts is described by the informed lenders hypothesis. Under this hypothesis, the
holders of securitized bonds generally have superior information – due e.g. to the relative
opacity of this market, as well as to the fact that they are typically large, sophisticated
institutional investors (Manconi, Massa, and Yasuda (2012)). Their information advantage
allows them to forecast a worsening performance of the securities they lend, and react by either
liquidating them outright, or just recalling them so that they are no longer available for lending
and are thus more readily liquidated. This will generate a drop in the lendable amount in
anticipation of a worsening performance.
A potential alternative explanation is that it is not the securities holders, but rather the
brokers/intermediaries, who have superior predictive ability. This is also plausible, given that,
compared to a single investor, the intermediary can observe a larger number of signals coming
from the many investors with whom she trades, and may thus be able to extract more precise
information signal. When the intermediary forecasts worsening performance for a given
security, she will no longer be willing to accept it as collateral for lending in a repo agreement.
This will also generate a drop in lendable amount in anticipation of a worsening performance.
Both hypotheses, thus, are consistent with our baseline finding. They have, however,
very different implications for the structure of the market for securitized bonds, as well as for

5
policy and regulation. By refusing to accept securities of worsening quality as collateral,
informed prime brokers can limit the spread of risk through the financial system, confining
underperforming assets to their holders, as well as reducing rehypothecation risk (Kahn and
Park (2015), Singh (2015)). In contrast, if information rests with the holders (lenders) of
securities, adverse selection problems about the quality of securitized bonds will be
exacerbated, reducing liquidity (Morris and Shin (2012), Pagano and Volpin (2012), Vanasco
(2014)), and/or exacerbating the risk and impact of fire sales (Shleifer (2011)).
To distinguish between the informed lenders and informed intermediaries hypotheses,
we compare and contrast the predictive power of changes in lendable amount and investor
sales. Under the informed intermediaries hypothesis, only lendable amount should have
predictive power; investor trades should instead be uninformative (or less informative) about
future performance: lendable amounts change exclusively in response to the pledgeability of
a security as collateral.
In contrast, under the informed lenders hypothesis, investor sales will subsume part of
the predictive power of changes in lendable amount, because the lenders would like to
liquidate their holdings. The relative predictive ability of lendable vis-à-vis sales will depend,
in turn, on liquidity. Investors will be able to sell the more liquid bonds, such that their trades
will soak up the predictive power of changes in lendable. In contrast, they will not be able to
sell less liquid bonds, such that changes in lendable will retain their predictive power. We use
coupon size as a proxy for the expected liquidity of a given security, with higher coupons
associated, ceteris paribus, with lower liquidity. Therefore, changes in lendable amounts will
have stronger predictive power for securities with high coupons, and trading for securities
with low coupons.
Our results confirm this prediction. Indeed, we find in general that investor trades have
predictive power for the future performance of securitized bonds, comparable to that of
changes in lendable amount. However, their predictive power is limited to the set of securities
with a lower coupon; for higher-coupons, only changes in lendable amount predict
performance. Additional tests based on lending fees (omitted for brevity) fail to provide any
support for the informed intermediaries hypothesis.
In a future draft of the paper, we plan to look at more direct proxies for liquidity, based
on actual trading activity. We also plan to investigate the potential channels through which
securities lenders acquire information. One possibility, which we are currently investigating

6
is affiliation to a financial conglomerate, e.g. one encompassing investment banks that
underwrite securitized bonds.
Our paper makes three main contributions to the literature. First, it contributes to the
Literature on information asymmetry and the role of informed traders in financial markets.
The literature has focused on actual trading activity, such as insider traders (Seyhun (1992),
Meulbroek (1992)), or the trades of short sellers (Cohen, Diether, and Malloy (2007), Saffi and
Sigurdsson (2011)). But as we argued, trading activity can be an inadequate tool to establish
the presence of informed investors, particularly in conditions of low liquidity when the
informed investors themselves might be unable to trade on their information. We show that
lendable amounts act as an additional, potentially cleaner signal, which in contrast to trading
can be effective even in illiquid markets.
Second, it contributes to the recent literature on securities lending. While a large body
of has studies the behavior and information content of securities borrowing and in particular
short selling, much less is known about its counterpart, securities lending. A number of recent
studies has started to fill this gap. Foley-Fisher, Narajabad, and Verani (2015) and Evans,
Ferreira, and Prado (2016) show that securities lending has become an important source of
funding for financial intermediaries such as insurance companies and investment advisors.
Prado, Saffi, and Sturgess (2016) show ownership structure, through its impact on lendable
amounts, can introduce limits to arbitrage and, consistent with the arguments of Miller (1977),
have an impact on price informativeness. Because of its potential impact on firm-level and
systemic risk, Adrian, Begalle, Copeland, and Martin (2013) advocate greater transparency and
analysis of the securities lending market. We provide evidence of the informational role of the
securities lending market, and in particular of changes in lendable amounts as a distress signal.
Third, it contributes to the literature on structured finance and securitization (Coval,
Jurek, and Stafford (2009)). There is abundant evidence that, possibly due to incentives faced
by their issuers (Pagano and Volpin (2012)), the structured finance market is characterized by
great complexity and opacity (Celerier and Vallee (2014)), and even fraud regarding the
quality of individual deals (Griffin and Maturana (2016), Piskorski, Seru, and Witking (2015)).
Due to the central role these assets played in the financial crisis of 2007-08 (Brunnermeier
(2008), Gorton (2008)), and the potential systemic risk associated with them (Manconi, Massa,
and Yasuda (2012), Merrill, Nadauld, Stulz, and Sherlund (2013)), a key question in the
literature is, what financial market participants possess material information regarding their

7
valuation. Rating agencies are an obvious candidate (Kempf (2015), Stanton and Wallace
(2010)), but the market does not appear to rely exclusively on credit ratings (Adelino (2009),
He, Qian, and Strahan (2014)). The literature is split between the “investor naïveté” view,
suggesting that the vast majority of market participants was unaware of the risks associated
with structured finance products, and the “regulatory arbitrage” view, which argues that at
least a meaningful subset of investors was informed. We contribute to this literature by
providing evidence consistent with the argument that the holders of securitized bonds, who
make them available for lending, possess information about their future performance.
The remainder of the paper is articulated as follows. Section II describes the data
sources and the main variables of interest used in the analysis. Section III reports our central
finding, that securities lending predicts the performance of securitized bonds. Section IV
considers two alternative economic mechanisms explaining the predictability result, based on
the informed intermediaries and lenders hypotheses, and presents evidence more supportive
of the latter. Section V concludes.
II Data
We merge data from a variety of sources: the CUSIP Master File, the Lipper eMAXX fixed
income securities holdings database, Bloomberg Loan Performance database, and the
DataExplorers securities lending database.
A. Some details on the securitized assets
We now briefly describe the structure of the securitized bonds in our sample. Each issue
(henceforth, “deal”) is based on a portfolio of underlying loans: mortgages, student loans,
credit card debt, etc.
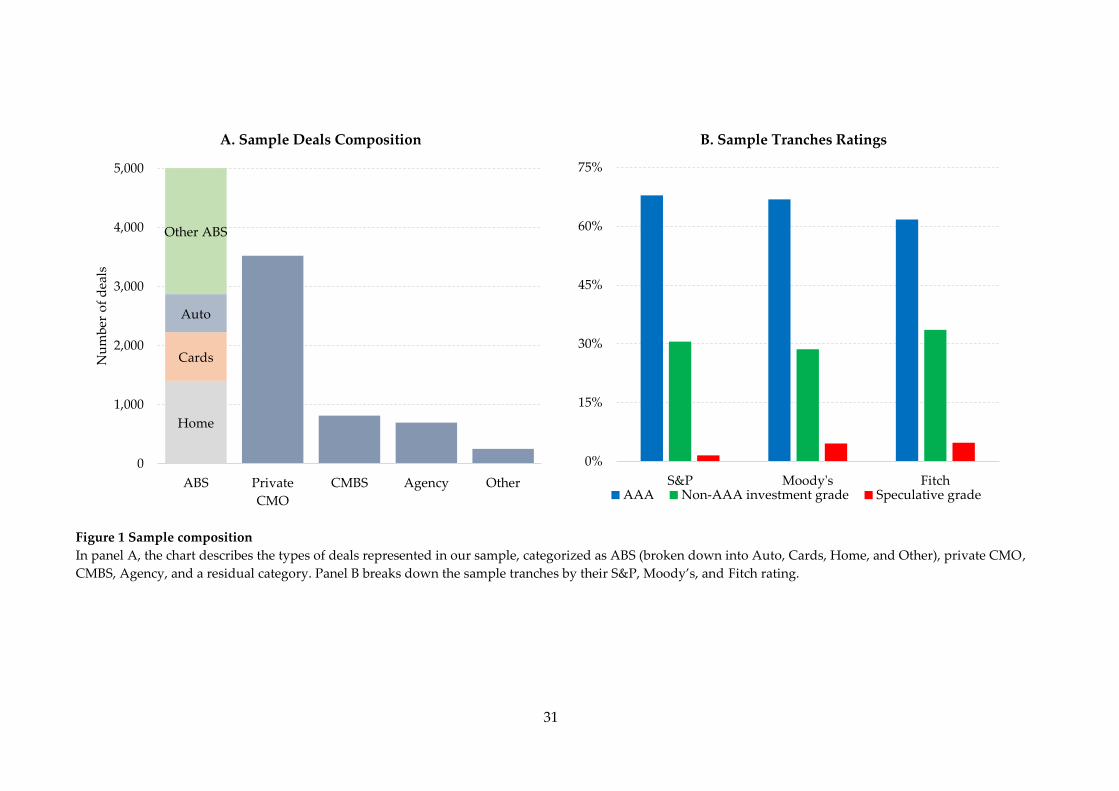
Figure 1A describes the breakdown of our sample securities by type of underlying
loans; the underlying are classified according to information from the Bloomberg Loan
Performance database. The largest group of deals consists of general Asset Backed Securities
(ABS, 49% of the total), comprising ABS with underlying home loans (“Home”), credit card
debt (“Cards”), Auto loans (“Auto”), and a residual category “Other”. Along with these, the
sample also comprises Collateralized Mortgage Obligations (CMO, 34%), Commercial
Mortgage-Backed Securities (CMBS, 8%), government agency-backed securities (Agency, 7%),
and a residual category for all other deals (Other, 2%).A given portfolio is then broken down

8
into a number of tranches, having a different seniority and, as a consequence, a different rating.
Tranches with a lower seniority absorb any losses (loan defaults) first, and a given higher-
seniority tranche does not take any losses until all tranches of lower seniority have been wiped
out. In total, our sample contains 3,973 deals issued between January 2000 and June 2010,
broken down into 9,180 tranches. As shown in Figure 1B, the majority of tranches in our
sample have a AAA rating at issuance (67% based on S&P ratings, 67% based on Moody’s
ratings, and 62% based on Fitch ratings). This is consistent with the findings in the literature
that institutional investors, whose holdings typically provide the bulk of securities in the
lending market, as we discuss below, largely hold securitized assets with AAA rating due to
regulatory constraints (Herring and Schuermann (2005), Manconi, Massa, and Yasuda (2012)).
The remainder consists mostly of non-AAA, investment grade securities (30-35%), and only a
tiny fraction of speculative grade securities (2-5%).
B. Securities lending and borrowing data
We obtain securitized bonds lending data from DataExplorers, a privately owned company
that supplies financial benchmarking information to the securities lending industry and short-
side intelligence to investment managers. DataExplorers collects data from custodians and
prime brokers that lend and borrow securities, and is the leading provider of lending data
world-wide. For each security, DataExplorers reports the lendable quantity (in $1,000 par
amount value) and the total balance quantity (in $1,000 par amount value) at monthly
frequency.1
The mechanics of lending and borrowing securitized bonds is similar to that of other
fixed income securities (e.g. Asquith, Au, Covert, and Pathak (2013)). Investors typically
borrow bonds through an intermediary such as a depository bank. Such banks act as
custodians for the securities, and pay lenders (depositors) a fee in exchange for the right to
lend them out. The security borrower must post collateral, corresponding to 102% of the
market value of the borrowed bond. Loans are typically collateralized with cash or US
Treasuries. In our sample period, cash collateral is about 94% of the amount on loan for the
1 For a more recent subset of the data, this information is also available at the weekly frequency; and for
an even smaller sub-sample, at the daily frequency. To maximize sample coverage, as well as to combine
DataExplorers data with information e.g. from Lipper eMAXX, which comes at the quarterly frequency,
we collapse these data to the monthly or quarterly frequency throughout the analysis.

9
average security, comparable to the 99% reported by Asquith, Au, Covert, and Pathak (2013)
for the corporate bond market.
The security borrowing-lending transaction, thus, involves three parties: (i) a security
borrower; (ii) the intermediary, depository bank; and (iii) the owner of the security. The
security borrower pays a fee for the security loan, and receives a rebate rate in return for the
use of the collateral she posts. The owner of the security, typically an institutional investor
(Asquith, Pathak, and Ritter (2005)), receives a fee from the depository bank. The rebate rate
may be larger than the fee paid by the security borrower, in which case the owner of the
security effectively borrows the collateral (cash) from the security borrower, paying an interest
equal to the rebate rate minus the security loan fee.
The DataExplorers database covers the entire market for lending fixed income
securities in the U.S. Thus, we are able to evaluate the size of the securitized bonds lending
market, and compare it to the markets for lending stocks and corporate bonds. Equity short
sales (borrowing) transactions have been found to represent about 2.5% of NYSE and AMEX
market cap (Asquith, Pathak, and Ritter (2005)) or about one third of share trading volume on
NYSE and NASDAQ (Diether, Lee, and Werner (2002)). Asquith, Au, Covert, and Pathak
(2013) report an average daily par value of corporate bonds shorted of $3.3 Bn, or 19% of all
corporate bond trades. The average daily par value of securitized bonds on loan in our sample
is $103 million. This is consistent with the impression among practitioners that the market for
borrowing securitized bonds is smaller than those for stocks and corporate bonds. At the same
time, the market appears economically non-negligible, accounting for 22% of the outstanding
amount of the securities on loan on average, or utilization ratio of about 1%.2
C. Performance measures
From the Bloomberg Loan Performance Database, we obtain measures of the performance of
the securitized bonds in our sample. During our sample period, securitized bonds are very
thinly traded, and largely over the counter. Measures of the price of individual securities could
in principle be obtained, but they are mostly based on matrix pricing: they are not market
prices, and thus need not reflect the effective economic value of the security.
2 Since there is no liquid market for securitized bonds, an estimate of the amount on loan as a fraction
of daily trading volume is not available.

10
We thus turn to two measures of performance based on the value of the underlying
portfolio of assets: the monthly (or quarterly) changes in 90-day delinquency and Foreclosure rate.
The change in 90-day delinquency and Foreclosure rate are computed at the deal level.
The change in 90-day delinquency rate refers to the monthly (or quarterly) change in the fraction
of loans underlying a given deal that are more than 90 days delinquent. The change in
Foreclosure rate refers to the monthly (or quarterly) change in the fraction of loans underlying
a given deal that are in foreclosure. An increase in 90-day delinquency or Foreclosure rate, thus,
implies a worsening performance for the entire deal.
Compared to a more standard measure of performance such as market returns, the
delinquency and foreclosure rates that we use have pros and cons. On the one hand, they are
not based on market trades, and are not forward-looking, so they need not reflect the
expectations of the marginal investor. This is not a problem, however, because the objective of
our baseline tests is to predict ex post performance of the securities (and based on that
determine which market participant(s) are informed). On the other hand, they are near-perfect
measures of the quality of the underlying economic fundamentals of the security, unlike the
secondary-market return on a stock or corporate bond, which can be at best a noisy proxy.
The average monthly change in 90-day delinquency rate (Foreclosure rate) is 0.27% (0.12%,
Table I), with a standard deviation of 1.21% (1.04%). Figure 2A describes the time series of
these performance measures. Consistent with anecdotal accounts of this market, following a
long period of virtually no foreclosures or delinquencies, the performance of securitized assets
in our sample began to worsen on average in early 2007, reaching a peak in 2009. The
worsening performance is more pronounced for smaller issues – the value-weighted averages
in Figure 2A reach a peak around 3% (for both 90-day delinquency and Foreclosure rate), while
the equal-weighted averages around 7.5%.
Interestingly, however, there is a wide distribution around the averages, as shown in
panel B. As of 2009, in the midst of the recent financial crisis, there are deals with delinquency
rates as high as nearly 40% (95th percentile), as well as deals with no delinquencies at all (25th
percentile). There is room, therefore, for informed market participants to predict the difference
between securities associated with deals of such differing performance.
D. Identifying information and institutional holdings data

11
The CUSIP Master file contains identifying information, standardized descriptions, and
additional data attributes for any corporate, municipal, and government security with a CUSIP
code offered in North America. We complement these data with deal characteristics retrieved
from the Bloomberg Loan Performance database: size (amount) of the issue, level of
subordination, credit rating(s) at the time of the issue, number of ratings available on the issue,
weighted-average life of the underlying loans, median FICO score, geographic concentration,
as well as the percentage of collateral located in “troubled” states (He, Qian, and Strahan
(2014)).
The Lipper eMAXX database contains details of corporate bonds and securitized bonds
(mortgage- and asset-backed securities, collateralized debt, mortgage, or loan obligations, and
their variants) holdings for nearly 20,000 U.S. and European insurance companies, U.S.,
Canadian, and European mutual funds, and leading U.S. public pension funds. It provides
information on quarterly ownership of more than 50,000 fixed income issuers with over $7
trillion in total par amount, from 2000Q1 to 2008Q1. Holdings are recorded in units of $1,000
in par amount, not in market values. This allows us to accurately measure quarterly quantity
changes (as opposed to market value changes) in holdings of individual bonds; we use changes
in holdings as a measure of active trading on part of institutional securities holders.
E. Key securitized bonds lending and borrowing proxies
A unique feature of the DataExplorers database is that, for each security, it reports both the
quantity that is on loan at a given point in time, as well as the quantity that is available for
lending. In other words, it allows us to directly observe the demand and supply sides of the
market. We are thus able to compute three key variables of interest, related to securitized
bonds lending and borrowing.
The first one is Lendable/Issue Amount, computed for a given tranche as:
Quantity available for lending
Issue amount (1)
The quantity available for lending is obtained from DataExplorers, while the issue amount
comes from the Mergent FISD database. This variable measures the supply of the security
available for lending at a given point in time.
The second one is Lent/Issue Amount, computed for a given tranche as:
Quantity on loan
Issue amount (2)

12
The quantity on loan is obtained from DataExplorers, while the issue amount comes from the
Mergent FISD database. This variable measures the demand for borrowing the security at a
given point in time.
The third one is the Utilization ratio, computed for a given tranche as:
Quantity on loan
Quantity available for lending (3)
This variable measures the excess demand for borrowing the security at a given point in time.
Throughout the analysis, we will focus on monthly or quarterly changes in
Lendable/Issue amount, Lent/Issue amount, and Utilization ratio, and relate them to the future
performance of individual securitized loans.
Table II relates security lending and borrowing to a number of security characteristics.
We focus on characteristics that are likely to affect the demand and supply for securities loans:
size at issuance, level of subordination, maturity, coupon, rating and rating uncertainty
(proxied by an indicator for initial disagreement among different ratings), as well as
creditworthiness of the underlying loans, proxied by median FICO score, loan-to-value ratio
(LTV), percentage of adjustable-rate mortgage (ARM) loans, geographic concentration of
collateral, in particular in “troubled” U.S. states especially exposed to the subprime crisis (He,
Qian, and Strahan (2014)).
Specifications (1) and (2) in Table II indicate that, similar to the corporate bond market
(Asquith, Au, Covert, and Pathak (2013)), securitized bonds are more likely borrowed when
they are large. Unlike corporate bonds, however, securitized bonds borrowing is not driven
by default risk – at least not insofar as it is captured by rating at issuance, FICO score, or LTV.
In contrast, specification (3) highlights that default risk, and in particular the
creditworthiness of the underlying pool of loans, is much more important for the decision to
make the securitized bonds available for lending. Securities with a higher median FICO score,
less geographically concentrated underlying loans, and lower exposure to troubled states, are
more likely available for lending.
This is consistent with the securities’ lenders taking into account information about the
quality of the underlying pool of assets in their lending decision. As in the equity market
(Asquith, Pathak, and Ritter (2005)), lenders are typically large, institutional investors. That
such sophisticated market participants should have access to superior information about
collateral quality, or be better able to interpret publicly available information, is perhaps not

13
surprising; it has, however, important implications for lending as a predictor of the
performance of securitized assets, as we discuss in the next section.
III Predicting the Performance of Securitized Bonds
In this section, we present our central result. We show that decreases in the amounts of
securitized bonds made available for lending predict worsening performance of the securities,
proxied by 90-day delinquency and Foreclosure rate. In contrast, we find no evidence that changes
in securities borrowing predict performance. These results hold at the deal as well as at the
tranche level; and in particular, they hold after controlling for deal fixed effects, i.e. fixing the
securities’ underlying economic fundamentals, except in terms of the exposure to default risk.
We further show that the result is driven by decreases in the amount of securities made
available for lending – i.e., increases in the amount of securities made available for lending do
not predict an improving performance. We discuss two potential interpretations of these
findings, pointing to two distinct economic mechanisms behind our results.
A. Predictability: the evidence
We start by relating changes in the amounts of securitized bonds made available for lending
to securitized bonds performance, with a simple test akin to an event study. Each calendar
month, we sort the deals in our sample into quintiles, based on the change in Lendable/Issue
amount relative to the previous month. We then track the average performance of the deals in
each quintile over the subsequent 6 months.
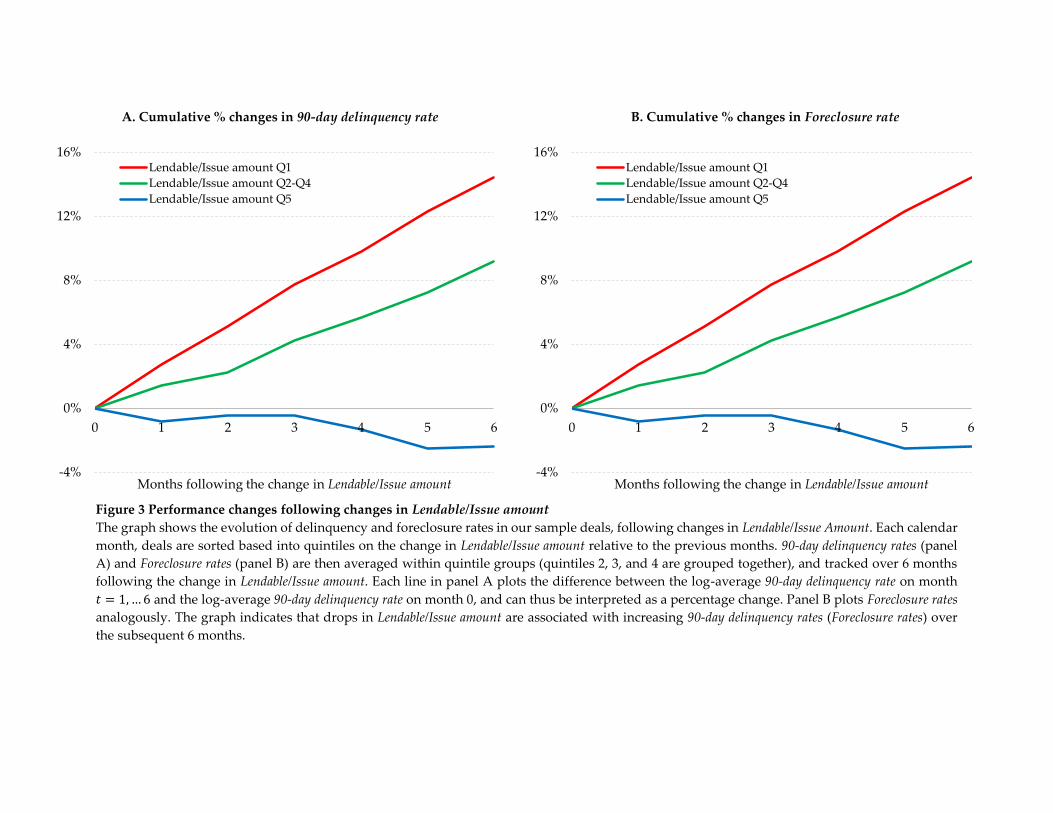
Figure 3 provides a visual description of the results, which indicate that changes in
securities lending are a strong predictor of the subsequent performance of the underlying pool
of loans. Deals in the bottom quintile, experiencing the largest decrease in Lendable/Issue
amount, exhibit a 14.4% increase in 90-day delinquency rate, and a 15.2% increase in Foreclosure
rate, over the subsequent 6 months. In contrast, deals in the top quintile display a modest
improvement in performance: a 2.4% drop in delinquency rates, and a 1.4% drop in
foreclosures.
As a more formal test, we consider a baseline regression specification:
𝑃𝑒𝑟𝑓𝑖𝑡+1 = 𝛼 + 𝛽𝐿𝑒𝑛𝑑𝑎𝑏𝑙𝑒/𝐼𝑠𝑠𝑢𝑒 𝐴𝑚𝑜𝑢𝑛𝑡𝑖𝑡 + 𝛾′𝑥𝑖𝑡 + 𝜀𝑖𝑡 (4)
where 𝑃𝑒𝑟𝑓𝑖𝑡+1 denotes the monthly change in 90-day delinquency or Foreclosure rate on deal 𝑖
in month 𝑡 + 1. In a separate set of regressions, we also run (4) on tranche-level securities

14
lending data. 90-day delinquency and Foreclosure rates are only available at the deal level. For a
small number of deals, we could obtain directly from Bloomberg information on the losses on
individual tranches. On this set, most of the results we describe below are confirmed.
We also run separate regressions in which we focus on securities borrowing, as
opposed to changes in the amounts of securitized bonds made available for lending, and thus
Lendable/Issue Amount is replaced by Lent/Issue Amount. In all the specifications, 𝑥𝑖𝑡 denotes a
vector of deal characteristics: log issue amount, number of ratings available from different
rating agencies, log weighted-average life, median FICO score of the underlying pool of loans
(with an indicator if the information on FICO score is missing), geographic concentration of
the underlying pool of loans, and the percentage of collateral located in “troubled” U.S. states
(He, Qian, and Strahan (2014)). The control variables also include deal type and calendar
month fixed effects.
Importantly, the richness and depth of our data, as well as the nature of the securitized
assets we study, allow us to include deal fixed effects in our specifications. This means that,
when running the tranche-level tests, we can compare securities that are, by construction,
identical in terms of their underlying economic fundamentals – they are based on the very
same set of underlying bonds. The only difference between different tranches is their holders’
exposure to default risk, due to the different seniority levels. Thus, when we relate changes in
in the amounts of each tranche made available for lending to changes in their performance, we
can control for omitted/unobservable factors that could potentially confound our estimates
and that should vary across deal, but for which we can control within deals. Table III reports
the central findings of our paper: a drop in lending predicts a worsening performance. We find
a strong, negative association between changes in Lendable/Issue Amount and next-month
performance, measured by the change in 90-day delinquency or Foreclosure rate.
The effects are also economically meaningful: a 1 percentage point decrease in
Lendable/Issue Amount predicts an increase in 90-day delinquency rate by 0.45 percentage points,
and an increase in Foreclosure rate by 0.21 percentage points.3 For the average bond in our
sample, Lendable/Issue Amount is 21%, the 90-day delinquency rate is 13%, and the Foreclosure rate
3 These effects are estimated as follows. The coefficient on Lendable/Issue amount in Table IIIA, column
(2), is –0.457; multiplying that by a 1 percentage point decrease, we obtain the 0.45 percentage point
increase in 90-day delinquency rate. Likewise, the coefficient in column (4) is –0.207; multiplying that by
a 1 percentage point decrease, we obtain the 0.21 percentage point increase in Foreclosure rate. Economic
effects are computed analogously throughout the paper.
15
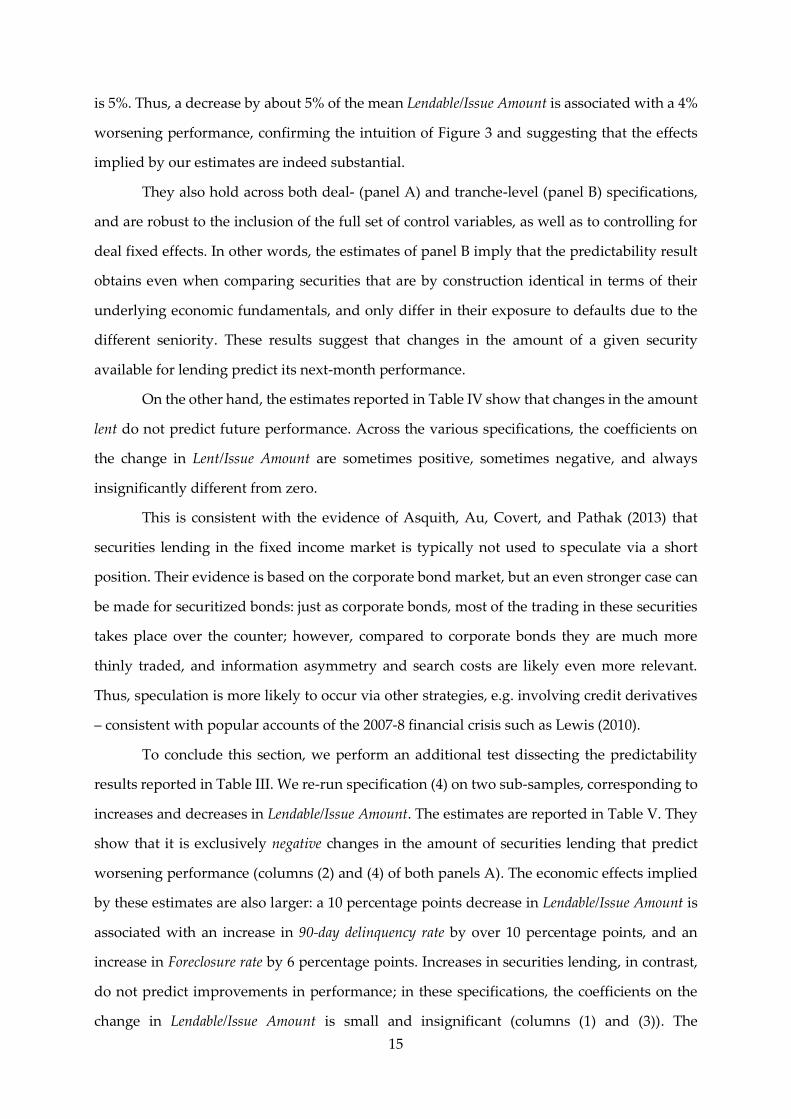
is 5%. Thus, a decrease by about 5% of the mean Lendable/Issue Amount is associated with a 4%
worsening performance, confirming the intuition of Figure 3 and suggesting that the effects
implied by our estimates are indeed substantial.
They also hold across both deal- (panel A) and tranche-level (panel B) specifications,
and are robust to the inclusion of the full set of control variables, as well as to controlling for
deal fixed effects. In other words, the estimates of panel B imply that the predictability result
obtains even when comparing securities that are by construction identical in terms of their
underlying economic fundamentals, and only differ in their exposure to defaults due to the
different seniority. These results suggest that changes in the amount of a given security
available for lending predict its next-month performance.
On the other hand, the estimates reported in Table IV show that changes in the amount
lent do not predict future performance. Across the various specifications, the coefficients on
the change in Lent/Issue Amount are sometimes positive, sometimes negative, and always
insignificantly different from zero.
This is consistent with the evidence of Asquith, Au, Covert, and Pathak (2013) that
securities lending in the fixed income market is typically not used to speculate via a short
position. Their evidence is based on the corporate bond market, but an even stronger case can
be made for securitized bonds: just as corporate bonds, most of the trading in these securities
takes place over the counter; however, compared to corporate bonds they are much more
thinly traded, and information asymmetry and search costs are likely even more relevant.
Thus, speculation is more likely to occur via other strategies, e.g. involving credit derivatives
– consistent with popular accounts of the 2007-8 financial crisis such as Lewis (2010).
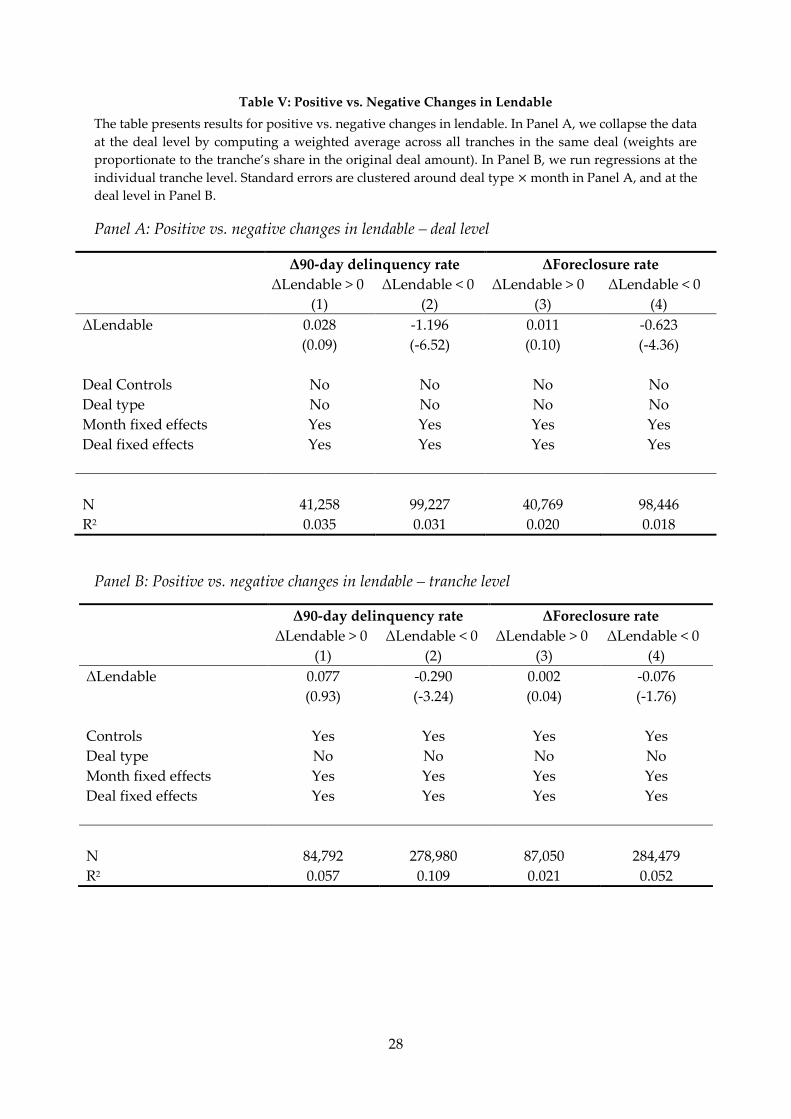
To conclude this section, we perform an additional test dissecting the predictability
results reported in Table III. We re-run specification (4) on two sub-samples, corresponding to
increases and decreases in Lendable/Issue Amount. The estimates are reported in Table V. They
show that it is exclusively negative changes in the amount of securities lending that predict
worsening performance (columns (2) and (4) of both panels A). The economic effects implied
by these estimates are also larger: a 10 percentage points decrease in Lendable/Issue Amount is
associated with an increase in 90-day delinquency rate by over 10 percentage points, and an
increase in Foreclosure rate by 6 percentage points. Increases in securities lending, in contrast,
do not predict improvements in performance; in these specifications, the coefficients on the
change in Lendable/Issue Amount is small and insignificant (columns (1) and (3)). The

16
implication of these estimates is that the predictor of securitized bonds performance that we
have identified in Table III – Lendable/Issue Amount – is really a predictor of worsening
performance.
To sum up, the evidence presented so far indicates that a decrease in the amounts of
securitized bonds made available for lending is a significant predictor of (worsening)
securitized assets performance. It predictive power is not subsumed by standard controls for
security characteristics, and is even robust to the inclusion of deal fixed effects – i.e. to
comparing securities that are by construction identical in terms of their economic
fundamentals, with the exception of the differential exposure to default risk associated with
different tranches.
It is worth noting that Lendable/Issue Amount is an indicator that can be measured in
real time. This makes itat least in principle, a very useful indicator for policy makers as it can
directly inform the decisions of market participants as well as regulators.
B. Interpretations
The interesting question is, why does lendable predict performance? At first glance, this is
surprising, as there is no evidence in the literature that anything similar happens, for instance,
in the equity market (Cohen, Diether, and Malloy (2010)) or in the corporate bond market
(Asquith, Au, Covert, and Pathak (2013)). There are two possible explanations, each related to
the unique features of the fixed income securities lending market.
The first possibility is that at least some of the securities holders have superior
predictive ability regarding the performance of the pool of assets underlying the securities that
they hold and make available for lending. This is plausible, given the general opacity of these
securities, and the evidence that they are largely held by large, sophisticated institutional
investors (Manconi, Massa, and Yasuda (2012)). Such specialized investors may have either
access to superior information about the underlying loans, or greater ability to interpret public
information (Engelberg, Reed, and Ringgenberg (2012)), which enable them to forecast a
worsening future performance. Faced with this forecast, the investors choose to outright
liquidate their holdings of the securities, or recall them, such that they are no longer available
for lending and are thus more readily liquidated. This will generate a drop in lending in
anticipation of a worsening performance.

17
The second possibility is that it is not the securities holders, but rather the
intermediaries (“brokers”), who have superior predictive ability. This is also plausible, given
e.g. the evidence that at least some institutional investors absorbed losses on their securitized
assets holdings in the midst of the 2007-2008 crisis (Manconi, Massa, and Yasuda (2012), or the
popular account given by Lewis (2010)), and the fact that, compared to individual investors,
the broker can observe a larger number of signals coming from the many investors with which
she trades, and may thus be able to extract more precise information. As a result, when the
broker forecasts worsening performance for a given security, she will not be willing to accept
it as collateral for lending. This will also generate a drop in lending in anticipation of a
worsening performance, consistent with the evidence provided so far.
IV Informed Traders or Informed Intermediaries?
How to distinguish between the two interpretations of the evidence described above?
To the extent that the predictability result is due to superior information (or
information processing ability) on part of the holders of securitized bonds, we can expect that
not only changes in the amount available for lending, but also investor trades, will have
predictive power towards future performance. This would be consistent with recent evidence
that the trades of institutional investors contain information that predicts performance (e.g.,
Baker, Litov, Wachter, and Wurgler (2010), Puckett and Yan (2011)).
Furthermore, making securities available for lending and investor trades should differ,
other things equal, along a crucial dimension: liquidity. Consider the position of a given
investor who, having initially made her security available for lending, forecasts a worsening
performance. The investor would want to recall the security, so that it is no longer lendable,
and immediately sell it to avoid absorbing the loss deriving from the upcoming bad
performance. In a liquid market, the sale occurs immediately. In an illiquid market,
information asymmetry and search costs can prevent the sale from taking place in a timely
manner. The implication is that, in a liquid market, investor sales should subsume the
predictive power of changes in lendable. In an illiquid market, however, selling activity may
fail to predict a worsening performance, so that changes in lendable retain their predictive
power.
We take coupon rates as a proxy for liquidity, with higher coupon rates associated with
lower liquidity (in a future draft of the paper, we plan to consider more direct proxies for

18
liquidity, based on actual trading activity). We thus preduct that lendable amounts will have
greater predictive power for securities with a high coupon, while with a lower coupon its
predictive power will be similar to, or potentially even lower than, investor sales. In contrast,
the informed intermediaries hypothesis implies predictability exclusively in terms of lendable
amounts, and it makes no prediction at all regarding the role of different coupons.
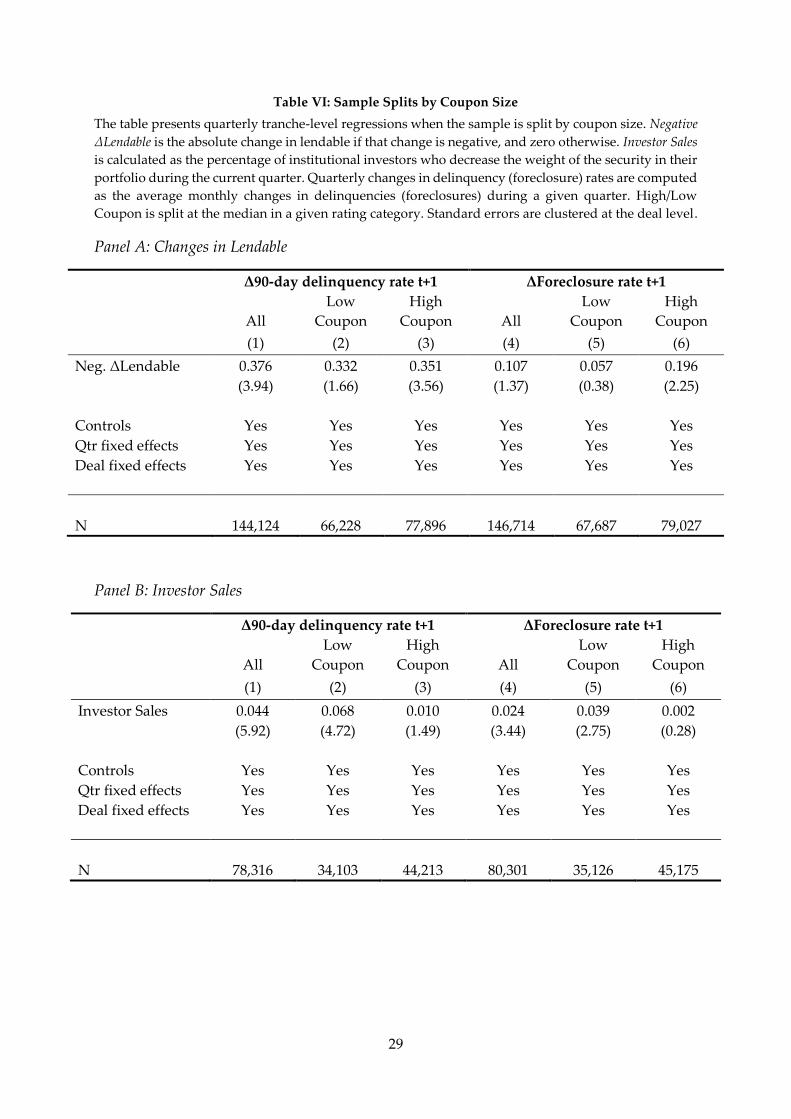
As a proxy for decreases in lendable amounts, we consider Negative Lendable, equal to
the absolute value of the change in Lendable/Issue Amount if negative, and zero otherwise. As a
proxy for investor trading activity we consider Investor sales, defined as the percentage of
institutional investors in the Lipper eMAXX database who decrease their holdings of a given
security at a given point in time. We then run a horse race, using Lendable/Issue Amount and
Investor sales as alternative predictors for securitized bonds’ performance, measured again as
90-day delinquency and Foreclosure rate.
The results of the test are reported in Table VI. Panel A considers predictive regressions
using Lendable/Issue Amount only, panel B using Investor sales only, and panel C combining
both predictors. The results support the informed investors hypothesis. First, the evidence of
panel B (and C) shows that investor sales have strong predictive power. The coefficient on
Investor sales is positive and statistically significant, and a 1 percentage point increase in
Investor sales predicts a 0.04 percentage points increase in 90-day delinquency, and a 0.02
percentage points increase in Foreclosure rate. Similarly, and consistent with the results of
Tables III and V, an increase Negative Lendable predicts worsening performance.
Second, the combined evidence of panels A, B, and C shows that the predictive power
of Investor sales and Negative Lendable varies across different securities, depending on the level
of their coupon. Namely, the predictive power of Negative Lendable is stronger among the
securities with high coupon (above the credit rating category median), while Investor sales are
a stronger predictor of performance for securities with low coupon.
This evidence is inconsistent with the informed broker hypothesis, while it confirms
the informed investors hypothesis. It suggests that the predictive power of making securities
available for lending is due to superior information (or greater ability to interpret public
information) on part of the holders of these securities.
Conclusions

19
In illiquid markets, trading by “informed” investors can have limited predictive power,
because trading volumes are low and may not be timely. In these conditions, changes in the
lendable amounts of securities can act as a canary in a coalmine, and predict future
performance when trading activity cannot.
We bring this argument to the data by focusing on the structured finance (“securitized
bonds”) segment. Trading in this segment typically occurs in OTC, illiquid markets, where
information asymmetry considerations are of first-order economic relevance. We find strong
evidence that changes in the amount of securities made available for lending predict the future
performance (delinquency and foreclosure rates) of the underlying pool of loans in our sample
securitized bonds. In contrast, we do not find any evidence of predictability from securities
borrowing.
Our tests also show that investor trades have comparable predictive power to lending,
supporting the hypothesis that securities holders (lenders), but not lending/borrowing
intermediaries, possess material information in this market. Finally, consistent with our
argument, we find that lending has stronger predictive power than trading in less liquid
markets, proxied by securities with a larger coupon.
In a future draft of the paper, we plan to expand our results by considering more direct
proxies for liquidity, based on actual trading activity. We also plan to investigate the channels
through which securities lenders become informed. Another open question which we plan to
investigate is the horizon of informed investors. In most of our tests, we have focused on
predictive regressions with a one-month or one-quarter horizon. But it is possible (and indeed,
figure 3 suggests it) that the predictive power of changes in lendable amounts stretch over a
longer horizon.
Overall, these findings provide evidence on the information content of the securities
lending market. To the best of our knowledge, they are the first to identify changes in lendable
amounts as a signal of distress in the structured finance segment.

20
References
Adelino, M., 2009, Do Investors Rely Only on Ratings? The Case of Mortgage-Backed
Securities, Working paper, Duke University – Fuqua School of Business.
Adrian, T., B. Begalle, A. Copeland, and A. Martin, 2013, Repo and Securities Lending, Federal
Reserve Bank of New York Staff Report No. 529.
Asquith, P., A. S. Au, T. Covert, and P. A. Pathak, 2013, The Market for Borrowing Corporate
Bonds, Journal of Financial Economics 107, 155-182.
Asquith, P., P. A. Pathak, and J. Ritter, 2005, Short Interest, Institutional Ownership and Stock
Returns, Journal of Financial Economics 78, 243-276.
Baker, M., L. Litov, J. A. Wachter, and J. Wurgler, 2010, Can Mutual Fund Managers Pick
Stocks? Evidence from Their Trades Prior to Earnings Announcements, Journal of
Financial and Quantitative Analysis 45, 1111-1131.
Boehmer, E., and J. Wu, 2013, Short Selling and the Price Discovery Process, Review of Financial
Studies 26, 287-322.
Brunnermeier, M., 2008, Deciphering the Liquidity and Credit Crunch of 2007-08, NBER
Working paper 14612.
Brunnermeier, M., and L. H. Pedersen, 2009, Market Liquidity and Funding Liquidity, Review
of Financial Studies 22, 2201-2238.
Celerier, C., and B. Vallee, 2014, The Motives for Financial Complexity: An Empirical
Investigation, Working paper, Harvard Business School.
Cohen, L., K. B. Diether, and C. J. Malloy, 2007, Supply and Demand Shifts in the Shorting
Market, Journal of Finance 62, 2061-2096.
Coval, J., J. Jurek, and E. Stafford, 2009, The Economics of Structure Finance, Journal of Economic
Perspectives 23, 3-26.
D’Avolio, G., 2002, The Market for Borrowing Stock, Journal of Financial Economics 66, 271-306.
Diether, K. B., K.-H. Lee, and I. M. Werner, 2009, Short-Sale Strategies and Return
Predictability, Review of Financial Studies 22, 575-607.
Dive, M., R. Hodge, and C. Jones, 2011, Developments in the Global Securities Lending Market,
Bank of England Quarterly Bulletin.
Duffie, D., and H. Zhu, 2011, Does a Central Clearing Counterparty Reduce Counterparty
Risk?, Review of Asset Pricing Studies 1, 74-95.
Engelberg, J. E., A. V. Reed, and M. C. Ringgenberg, 2012, How Are Shorts Informed? Short
Sellers, News, and Information Processing, Journal of Financial Economics 105, 260-278.
Evans, R., M. A. Ferreira, and M. P. Prado, 2016, Fund Performance and Equity Lending: Why
Lend What You Can Sell?, Working Paper, Darden School of Business – University of
Virginia.
Foley-Fisher, N., B. Narajabad, and S. Verani, 2015, Securities Lending as Wholesale Funding:
Evidence from the U.S. Life Insurance Industry, Working Paper, Board of Governors
of the Federal Reserve.
Getter, D., M. Jickling, M. Lamonte, and E. Murphy, 2007, Financial Crisis? The Liquidity
Crunch of August 2007 (RL34182; September 21, 2007). US Congressional Research
Service.
Gorton, G., 2008, The Panic of 2007, NBER Working paper 14358.
Griffin, J., and G. Maturana, 2016, Who Facilitated Misreporting in Securitized Loans?, Review
of Financial Studies, 29, 384-419.

21
Jorion, P., Z. Liu, and C. Shi, 2005, Informational Effects of Regulation FD: Evidence from
Rating Agencies, Journal of Financial Economics 76, 309-330.
He, J., J. Qian, and P. E. Strahan, 2014, Does the Market Understand Rating Shopping?
Predicting MBS Losses with Initial Yields, Working Paper, Boston College.
Herring, R., and T. Schuermann, 2005, Capital Regulation for Position Risk in Banks, Securities
Firms and Insurance Companies. In: Scott, H. S. (Ed.), Capital Adequacy Beyond Basel:
Banking, Securities, and Insurance, Oxford University Press, New York, pp. 15-87.
Kahn, C. M., and H. J. Park, 2015, Collateral, Rehypothecation, and Efficiency, Working Paper,
University of Illinois at Urbana-Champaign.
Kempf, E., 2015, The Job Rating Game: The Effects of Revolving Doors on Analyst Incentives,
Working Paper, Tilburg University.
Kyle, A. S., 1985, Continuous Auctions and Insider Trading, Econometrica 53, 1315-1335.
Leland, H. E., 1992, Insider Trading: Should It Be Prohibited?, Journal of Political Economy 100,
859-887.
Lewis, M., 2010, The Big Short: Inside the Doomsday Machine, Norton & Co.
Manconi, A., M. Massa, and A. Yasuda, 2012, The Role of Institutional Investors in Propagating
the Crisis of 2007-2008, Journal of Financial Economics 104, 491-518.
Merrill, C. B., T. Nadauld, R. M. Stulz, and S. M. Sherlund, 2013, Why Were There Fire Sales
of Mortgage-Backed Securities by Financial Institutions during the Financial Crisis?,
Working paper, Ohio State University.
Morris, S., and H. S. Shin, 2012, Contagious Adverse Selection, American Economic Journal:
Macroeconomics 4, 1-21.
Pagano, M., and P. Volpin, 2012, Securitization, Transparency, and Liquidity, Review of
Financial Studies 25, 2417-2453.
Piskorski, T., A. Seru, and J. Witkin, 2015, Asset Quality Misrepresentation by Financial
Intermediaries: Evidence from the RMBS Market, Journal of Finance, 70, 2635-2678.
Prado, M. P., P. Saffi, and J. Sturgess, 2016, Ownership Structure, Limits to Arbitrage, and
Stock Returns: Evidence from Equity Lending Markets, Review of Financial Studies,
forthcoming.
Puckett, A., and X. Yan, 2011, The Interim Trading Skills of Institutional Investors, Journal of
Finance 66, 601-633.
Saffi, P., and K. Sigurdsson, 2011, Price Efficiency and Short Selling, Review of Financial Studies
24, 821-852.
Saffi, P., and C. Vergara-Alert, 2015, The Big Short and the Right Short: Short Selling Activity
and Housing Prices, Working paper, Cambridge University Judge Business School.
Shleifer, A., 2011, Fire Sales in Finance and Macroeconomics, Journal of Economic Perspectives
25, 29-48.
Singh, M., and J. Aitken, 2010, The (Sizable) Role of Rehypothecation in the Shadow Banking
System, IMF Working Paper 10/172.
Stanton, R., and N. Wallace, 2010, CMBS Subordination, Ratings Inflation, and the Crisis of
2007-09, NBER Working paper 16206.
Vanasco, V., 2014, Information Acquisition vs. Liquidity in Financial Markets, Working Paper,
Stanford University.

22
Table I: Descriptive statistics
The table shows tranche-level descriptive statistics for our sample of 9,180 ABS and MBS from 3,973
deals issued between January 2000 and June 2010 which are reported in the DataExplorers database.
Δ90-day delinquency and ΔForeclosure rate are monthly measures of deal-level performance, where Δ90-
day delinquency refers to the monthly change in the fraction of loans that are more than 90 days
delinquent and ΔForeclosure rate refers to the monthly change in the fraction of loans that are in
foreclosure. ΔUtilization ratio is the monthly change in the tranche’s utilization ratio, defined as total
amount short sold divided by total amount lendable. ΔLent (Lendable) / issue amount is the monthly
change in the amount lent (lendable) divided by initial issue amount. HHI is the weighted average
Herfindahl Index of the investors holding the tranche. Level of subordination is defined following He et
al. (2014) as the dollar-weighted fraction of tranches in the same deal that have a rating the same as or
better than the given tranche. Initial rating is average rating assigned to the same tranche by the three
rating agencies, converted to a numerical scale following Jorion, Liu, Shi (2005). Weighted average life is
equal to the expected timing of payments of principal of a tranche. Geographical concentration of the
collateral pool equals the sum of the squared shares of the collateral within a deal across each of the top
five states (with the largest amount of mortgages), with the aggregation of all the other states as the
sixth category. Collateral in troubled states equals the fraction of collateral originated in the states with
the highest delinquency rates in the previous calendar month according to the Loan Performance
database.
Quantiles
N Mean Stdev. Min 0.25 Med 0.75 Max
Performance measures
Δ90-day delinquency rate (%) 501,029 0.27 1.21 -59.50 0.00 0.00 0.42 59.50
ΔForeclosure rate (%) 488,930 0.12 1.04 -50.97 0.00 0.00 0.16 100.00
Key explanatory variables
ΔUtilization ratio (%) 811,736 0.00 5.00 -100.00 0.00 0.00 0.00 100.00
ΔLent / issue amount (%) 810,641 0.00 0.11 -1.81 0.00 0.00 0.00 1.81
ΔLendable / issue amount (%) 810,641 -0.21 4.71 -99.99 -0.31 -0.01 0.04 100.49
HHI (%) 783,447 0.90 1.46 0.03 0.17 0.45 1.08 19.10
Control variables
Log issue amount 845,873 4.13 1.59 -9.21 3.13 4.11 5.30 12.26
Level of subordination (%) 658,055 87.87 11.34 0.00 82.50 91.25 96.10 100.00
Initial rating 844,636 2.54 2.65 1.00 1.00 1.00 3.00 18.00
Number of ratings 847,019 2.16 0.55 0.00 2.00 2.00 2.00 3.00
Wavg. Life 809,394 5.85 3.27 0.10 3.25 5.01 9.05 29.11
Median FICO score 360,427 694.09 57.40 0.00 677.00 712.00 731.00 788.00
Median FICO score missing 847,019 0.57 0.49 0.00 0.00 1.00 1.00 1.00
Geographic concentration 532,203 0.34 0.08 0.17 0.29 0.33 0.37 0.95
Collateral in troubled states 847,019 0.10 0.19 0.00 0.00 0.00 0.12 1.00

23
Table II: Short selling and lending as a function of security characteristics
The table reports the results from tranche-level regressions of (1) the utilization ratio, (2) amount short
sold as a fraction of total issue amount, and (3) amount lendable as a fraction of total issue amount, on
security and deal characteristics. Standard errors are clustered at the deal level.
Utilization
ratio
Lent /
issue amount
Lendable /
issue amount
(1) (2) (3)
Log issue amount 0.520 0.016 -8.300
(4.16) (3.58) (-12.95)
Level of subordination -0.044 -0.001 -0.196
(-2.06) (-1.83) (-4.39)
Initial rating 0.051 0.004 -0.574
(0.51) (0.94) (-1.73)
Number of ratings -0.267 -0.003 -1.100
(-2.95) (-0.51) (-1.72)
Initial rating disagreement -0.269 -0.011 -0.140
(-1.70) (-1.39) (-0.15)
Wavg. Life 0.362 0.008 2.606
(4.04) (4.40) (17.27)
Wavg. Coupon -0.105 -0.004 -1.800
(-1.26) (-1.56) (-6.08)
Geographic concentration of collateral -5.300 -0.130 -21.000
(-3.14) (-2.41) (-5.08)
Collateral in troubled states 3.225 0.079 -20.000
(2.43) (2.00) (-1.52)
Median FICO score 0.005 0.000 0.030
(1.38) (1.39) (4.26)
Median FICO score missing 2.799 0.054 19.000
(1.30) (1.34) (3.86)
Median LTV 0.010 0.000 0.113
(0.87) (1.00) (4.08)
Median LTV missing 2.208 0.053 6.932
(2.07) (1.51) (2.86)
Percentage of ARM loans -0.011 0.000 -0.067
(-2.23) (-1.10) (-3.26)
Number of loans 0.000 0.000 0.000
(-0.16) (0.48) (0.23)
Issuance quarter dummies Yes Yes Yes
N 300,769 300,769 300,769
R2 0.038 0.047 0.413

24
Table III: Predicting future performance with changes in the amount lendable
The table reports regressions of next month’s change in the deal’s 90-day delinquency rate (columns (1)
and (2)) and next month’s change in foreclosure rates (columns (3) and (4)) on changes in the amount
lendable as a fraction of total issue amount, and controls. In Panel A, we collapse the data at the deal
level by computing a weighted average across all tranches in the same deal (weights are proportionate
to the tranche’s share in the original deal amount). In Panel B, we run regressions at the individual
tranche level. Standard errors are clustered around deal type × month in Panel A, and at the deal level
in Panel B.
Panel A: Deal level
(Coefficients of interest multiplied by 100)
Δ90-day delinquency rate t+1 ΔForeclosure rate t+1
(1) (2) (3) (4)
ΔLendable / issue amount -0.452 -0.457 -0.278 -0.207
(-2.58) (-2.47) (-3.31) (-2.70)
Log issue amount 0.009 0.004
(1.50) (0.99)
Number of ratings -0.003 0.002
(-0.21) (0.22)
Log wavg. Life -0.281 -0.111
(-10.93) (-7.47)
Median FICO score 0.000 0.000
(-5.50) (-3.46)
Median FICO score missing -0.302 -0.142
(-7.94) (-4.49)
Geographic concentration of
collateral 0.102 0.009
(0.75) (0.12)
Collateral in troubled states -0.099 0.015
(-1.62) (0.36)
Deal type Yes No Yes No
Month fixed effects Yes Yes Yes Yes
Deal fixed effects No Yes No Yes
N 143,207 181,580 142,186 178,739
R2 0.028 0.063 0.015 0.037

25
Panel B: Tranche level
(Coefficients of interest multiplied by 100)
Δ90-day delinquency rate t+1 ΔForeclosure rate t+1
(1) (2) (3) (4)
ΔLendable / issue amount -0.196 -0.103 -0.133 -0.049
(-3.54) (-2.16) (-2.95) (-1.69)
Log issue amount 0.012 0.003 0.007 0.001
(2.71) (2.00) (3.24) (0.84)
Level of subordination -0.013 0.000 -0.005 0.000
(-13.87) (1.04) (-12.25) (1.25)
Log wavg. Life -0.127 -0.027 -0.051 -0.011
(-12.59) (-6.91) (-10.05) (-4.57)
Number of ratings 0.002 0.008
(0.12) (1.26)
Median FICO score -0.001 -0.001
(-3.76) (-3.37)
Median FICO score missing -0.971 -0.420
(-4.17) (-3.88)
Geographic concentration of
collateral -0.043 -0.055
(-0.75) (-1.69)
Collateral in troubled states -0.221 -0.032
(-4.41) (-1.19)
Rating category Yes Yes Yes Yes
Deal type Yes No Yes No
Month fixed effects Yes Yes Yes Yes
Deal fixed effects No Yes No Yes
N 284,492 440,859 292,728 449,236
R2 0.048 0.091 0.019 0.041

26
Table IV: Predicting future performance with changes in the amount lent
The table reports regressions of next month’s change in the deal’s 90-day delinquency rate (columns (1)
and (2)) and next month’s change in foreclosure rates (columns (3) and (4)) on changes in the amount
lent as a fraction of total issue amount, and controls. In Panel A, we collapse the data at the deal level
by computing a weighted average across all tranches in the same deal (weights are proportionate to the
tranche’s share in the original deal amount). In Panel B, we run regressions at the individual tranche
level. Standard errors are clustered around deal type × month in Panel A, and at the deal level in Panel
B.
Panel A: Deal level
(Coefficients of interest multiplied by 100)
Δ90-day delinquency rate t+1 ΔForeclosure rate t+1
(1) (2) (3) (4)
ΔLent / issue amount 1.378 0.499 1.050 0.196
(0.48) (0.27) (0.48) (0.17)
Log issue amount 0.009 0.004
(1.44) (0.94)
Number of ratings -0.003 0.002
(-0.20) (0.22)
Log wavg. Life -0.281 -0.111
(-10.93) (-7.45)
Median FICO score 0.000 0.000
(-5.50) (-3.46)
Median FICO score missing -0.303 -0.142
(-7.95) (-4.49)
Geographic concentration of
collateral 0.102 0.008
(0.74) (0.11)
Collateral in troubled states -0.098 0.015
(-1.61) (0.37)
Deal type Yes No Yes No
Month fixed effects Yes Yes Yes Yes
Deal fixed effects No Yes No Yes
N 143,207 181,580 142,186 178,739
R2 0.028 0.063 0.015 0.037

27
Panel B: Tranche level
(Coefficients of interest multiplied by 100)
Δ90-day delinquency rate t+1 ΔForeclosure rate t+1
(1) (2) (3) (4)
ΔLent / issue amount -1.548 0.298 -0.351 0.016
(-1.31) (0.56) (-0.35) (0.04)
Log issue amount 0.011 0.003 0.007 0.001
(2.65) (1.92) (3.16) (0.78)
Level of subordination -0.013 0.000 -0.005 0.000
(-13.87) (1.05) (-12.26) (1.26)
Log wavg. Life -0.127 -0.027 -0.051 -0.011
(-12.59) (-6.91) (-10.05) (-4.57)
Number of ratings 0.001 0.008
(0.11) (1.25)
Median FICO score -0.001 -0.001
(-3.76) (-3.37)
Median FICO score missing -0.971 -0.420
(-4.17) (-3.88)
Geographic concentration of
collateral -0.043 -0.055
(-0.75) (-1.70)
Collateral in troubled states -0.222 -0.032
(-4.41) (-1.19)
Rating category Yes Yes Yes Yes
Deal type Yes No Yes No
Month fixed effects Yes Yes Yes Yes
Pool fixed effects No Yes No Yes
N 284,492 440,859 292,728 449,236
R2 0.048 0.091 0.019 0.041
28
Table V: Positive vs. Negative Changes in Lendable
The table presents results for positive vs. negative changes in lendable. In Panel A, we collapse the data
at the deal level by computing a weighted average across all tranches in the same deal (weights are
proportionate to the tranche’s share in the original deal amount). In Panel B, we run regressions at the
individual tranche level. Standard errors are clustered around deal type × month in Panel A, and at the
deal level in Panel B.
Panel A: Positive vs. negative changes in lendable – deal level
Δ90-day delinquency rate ΔForeclosure rate
ΔLendable > 0 ΔLendable < 0 ΔLendable > 0 ΔLendable < 0
(1) (2) (3) (4)
ΔLendable 0.028 -1.196 0.011 -0.623
(0.09) (-6.52) (0.10) (-4.36)
Deal Controls No No No No
Deal type No No No No
Month fixed effects Yes Yes Yes Yes
Deal fixed effects Yes Yes Yes Yes
N 41,258 99,227 40,769 98,446
R2 0.035 0.031 0.020 0.018
Panel B: Positive vs. negative changes in lendable – tranche level
Δ90-day delinquency rate ΔForeclosure rate
ΔLendable > 0 ΔLendable < 0 ΔLendable > 0 ΔLendable < 0
(1) (2) (3) (4)
ΔLendable 0.077 -0.290 0.002 -0.076
(0.93) (-3.24) (0.04) (-1.76)
Controls Yes Yes Yes Yes
Deal type No No No No
Month fixed effects Yes Yes Yes Yes
Deal fixed effects Yes Yes Yes Yes
N 84,792 278,980 87,050 284,479
R2 0.057 0.109 0.021 0.052
29
Table VI: Sample Splits by Coupon Size
The table presents quarterly tranche-level regressions when the sample is split by coupon size. Negative
ΔLendable is the absolute change in lendable if that change is negative, and zero otherwise. Investor Sales
is calculated as the percentage of institutional investors who decrease the weight of the security in their
portfolio during the current quarter. Quarterly changes in delinquency (foreclosure) rates are computed
as the average monthly changes in delinquencies (foreclosures) during a given quarter. High/Low
Coupon is split at the median in a given rating category. Standard errors are clustered at the deal level.
Panel A: Changes in Lendable
Δ90-day delinquency rate t+1 ΔForeclosure rate t+1
All
Low
Coupon
High
Coupon All
Low
Coupon
High
Coupon
(1) (2) (3) (4) (5) (6)
Neg. ΔLendable 0.376 0.332 0.351 0.107 0.057 0.196
(3.94) (1.66) (3.56) (1.37) (0.38) (2.25)
Controls Yes Yes Yes Yes Yes Yes
Qtr fixed effects Yes Yes Yes Yes Yes Yes
Deal fixed effects Yes Yes Yes Yes Yes Yes
N 144,124 66,228 77,896 146,714 67,687 79,027
Panel B: Investor Sales
Δ90-day delinquency rate t+1 ΔForeclosure rate t+1
All
Low
Coupon
High
Coupon All
Low
Coupon
High
Coupon
(1) (2) (3) (4) (5) (6)
Investor Sales 0.044 0.068 0.010 0.024 0.039 0.002
(5.92) (4.72) (1.49) (3.44) (2.75) (0.28)
Controls Yes Yes Yes Yes Yes Yes
Qtr fixed effects Yes Yes Yes Yes Yes Yes
Deal fixed effects Yes Yes Yes Yes Yes Yes
N 78,316 34,103 44,213 80,301 35,126 45,175

30
Panel C: Both Changes in Lendable and Investor Sales
Δ90-day delinquency rate t+1 ΔForeclosure rate t+1
All
Low
Coupon
High
Coupon All
Low
Coupon
High
Coupon
(1) (2) (3) (4) (5) (6)
Neg. ΔLendable 0.105 -0.081 0.222 0.143 0.182 0.113
(1.12) (-0.46) (2.01) (1.75) (1.09) (1.35)
Investor Sales 0.041 0.063 0.008 0.025 0.041 0.002
(5.47) (4.27) (1.14) (3.55) (2.81) (0.25)
Controls Yes Yes Yes Yes Yes Yes
Qtr fixed effects Yes Yes Yes Yes Yes Yes
Deal fixed effects Yes Yes Yes Yes Yes Yes
N 76,198 33,263 42,935 78,116 34,254 43,862
31
A. Sample Deals Composition B. Sample Tranches Ratings
Figure 1 Sample composition
In panel A, the chart describes the types of deals represented in our sample, categorized as ABS (broken down into Auto, Cards, Home, and Other), private CMO,
CMBS, Agency, and a residual category. Panel B breaks down the sample tranches by their S&P, Moody’s, and Fitch rating.
Home
Cards
Auto
Other ABS
0
1,000
2,000
3,000
4,000
5,000
ABS Private
CMO
CMBS Agency Other
Nu
mb
er o
f d
eals
0%
15%
30%
45%
60%
75%
S&P Moody's FitchAAA Non-AAA investment grade Speculative grade

32
A. Aggregate Performance B. Delinquency Rates – Distribution
Figure 2 Performance of the sample deals
Panel A plots the aggregate performance of the sample deals, in terms of 90-day delinquency and Foreclosure rate, both in equal-weighted and issue size-weighted
average terms. Panel B plots the 25th, 50th, 75th, and 95th percentiles of the distribution of 90-day delinquency rates over time.
0.0
1.5
3.0
4.5
6.0
7.5
9.0
2002 2003 2004 2005 2006 2007 2008 2009 2010
90-day delinquency rate
Foreclosure rate
90-day delinquency rate
(issue size-weighted)
Foreclosure rate (issue size-
weighted)
0.0
7.5
15.0
22.5
30.0
37.5
45.0
2002 2003 2004 2005 2006 2007 2008 2009 2010
25 50 75 95
Percentiles:
A. Cumulative % changes in 90-day delinquency rate B. Cumulative % changes in Foreclosure rate
Figure 3 Performance changes following changes in Lendable/Issue amount
The graph shows the evolution of delinquency and foreclosure rates in our sample deals, following changes in Lendable/Issue Amount. Each calendar
month, deals are sorted based into quintiles on the change in Lendable/Issue amount relative to the previous months. 90-day delinquency rates (panel
A) and Foreclosure rates (panel B) are then averaged within quintile groups (quintiles 2, 3, and 4 are grouped together), and tracked over 6 months
following the change in Lendable/Issue amount. Each line in panel A plots the difference between the log-average 90-day delinquency rate on month
𝑡 = 1, … 6 and the log-average 90-day delinquency rate on month 0, and can thus be interpreted as a percentage change. Panel B plots Foreclosure rates
analogously. The graph indicates that drops in Lendable/Issue amount are associated with increasing 90-day delinquency rates (Foreclosure rates) over
the subsequent 6 months.
-4%
0%
4%
8%
12%
16%
0 1 2 3 4 5 6
Months following the change in Lendable/Issue amount
Lendable/Issue amount Q1
Lendable/Issue amount Q2-Q4
Lendable/Issue amount Q5
-4%
0%
4%
8%
12%
16%
0 1 2 3 4 5 6
Months following the change in Lendable/Issue amount
Lendable/Issue amount Q1
Lendable/Issue amount Q2-Q4
Lendable/Issue amount Q5