canada’s renewable power landscape s renewable power landscape 1 2 executive summary 3...
TRANSCRIPT
CANADA’S RENEWABLE POWER LANDSCAPE
Energy MarketAnalysis 2016
National EnergyBoard
Office nationalde l’énergie
National EnergyBoard
Office nationalde l’énergie
National EnergyBoard
Office nationalde l’énergie
National EnergyBoard
Office nationalde l’énergie

© Her Majesty the Queen in Right of Canada 2015 as represented by the National Energy Board
ISSN: 2371-5804
NE2-17E-PDF
This report is published separately in both official languages and is available upon request in multiple formats.
© Sa Majesté la Reine du chef du Canada représentée par l’Office national de l’énergie 2016
ISSN : 2371-5812
NE2-17F-PDF
Ce rapport est publié séparément dans les deux langues officielles. On peut obtenir cette publication sur supports multiples, sur demande.
Permission to ReproduceMaterials may be reproduced for personal, educational, and/or non-profit activities, in part or in whole and by any means, without charge or further permission from the National Energy Board (NEB or Board), provided that due diligence is exercised in ensuring the accuracy of the information reproduced; that the NEB is identified as the source institution; and that the reproduction is not represented as an official version of the information reproduced, nor as having been made in affiliation with, or with the endorsement of, the NEB.
If a party wishes to rely on material from this report in any regulatory proceeding before the NEB, it may submit the material, just as it may submit any public document. Under these circumstances, the submitting party in effect adopts the material and that party could be required to answer questions pertaining to the material.
This report does not provide any indications of whether or not any application will be approved. The NEB will decide on specific applications based on the material in evidence before it at that time.
For permission to reproduce the information in this publication for commercial redistribution, please e-mail: [email protected]
Autorisation de reproduction Le contenu de cette publication peut être reproduit à des fins personnelles, éducatives et(ou) sans but lucratif, en tout ou en partie et par quelque moyen que ce soit, sans frais et sans autre permission de l’Office national de l’énergie, pourvu qu’une diligence raisonnable
soit exercée afin d’assurer l’exactitude de l’information reproduite, que l’Office national de l’énergie soit mentionné comme organisme source et que la reproduction ne soit présentée ni comme une version officielle ni comme une copie ayant été faite en collaboration avec l’Office national de l’énergie ou avec son consentement.
Quiconque souhaite utiliser le présent rapport dans une instance réglementaire devant l’Office peut le soumettre à cette fin, comme c’est le cas pour tout autre document public. Une partie qui agit ainsi se trouve à adopter l’information déposée et peut se voir poser des questions au sujet de cette dernière.
Le présent rapport ne fournit aucune indication relativement à l’approbation ou au rejet d’une demande quelconque. L’Office étudie chaque demande en se fondant sur les documents qui lui sont soumis en preuve à ce moment.
Pour obtenir l’autorisation de reproduire l’information contenue dans cette publication à des fins commerciales, faire parvenir un courriel à : [email protected]

Canada’s Renewable Power Landscape 1
2 Executive Summary
3 Executive Summary Infographic
4 Greenhouse Gas Emissions
6 Policies and Incentives for Renewables
8 Canadian Overview
10 British Columbia
12 Alberta
14 Saskatchewan
16 Manitoba
18 Ontario
20 Quebec
22 New Brunswick
24 Nova Scotia
26 Newfoundland and Labrador
28 Prince Edward Island
30 Yukon
32 Northwest Territories
34 Nunavut
36 Power in Canada’s Northern Regions
37 The Renewables Challenge
Table of ContentsAbout the NEB The NEB is an independent federal regulator whose purpose is to promote safety and security, environmental protection, and economic efficiency in the Canadian public interest within the mandate set by Parliament for the regulation of pipelines, energy development, and trade.
The Board’s main responsibilities include regulating:
• the construction, operation, and abandonment of pipelines that cross international borders or provincial/territorial boundaries;
• associated pipeline tolls and tariffs;
• the construction and operation of international power lines and designated interprovincial power lines;
• imports of natural gas and exports of crude oil, natural gas, oil, natural gas liquids, refined petroleum products, and electricity; and
• oil and gas exploration and production activities in specified northern and offshore areas
About this ReportThe Board monitors energy markets and assesses Canadian energy requirements and trends to support its regulatory responsibilities. This report, Canada’s Renewable Power Landscape, is one of a series of publications on energy supply, demand, and infrastructure that the NEB publishes regularly as part of its ongoing market monitoring.
See “Data issues” section on page 37 for all data sources and details.
Contributors to this report include: Natalia Lis (project manager), Colette Craig, Ingrid Ektvedt, Michael Nadew, Ken Newel, Sara Tsang, and Cassandra Wilde.
Questions or comments? Email [email protected]

2 Energy Market Analysis – October 2016
Executive SummaryCanada ranks fourth in the world in renewable power generation. Hydro is the dominant source of electricity in Canada, accounting for nearly 60% of installed capacity and generation.
Five provinces and territories generated the vast majority of their electricity from hydro in 2015. The share of electricity production from hydro reached 86% in British Columbia (BC), 97% in Manitoba, 95% in Quebec, 95% in Newfoundland and Labrador, and 94% in Yukon.
Four provinces and territories have diverse electricity mixes relying on various combinations of nuclear, coal, gas, oil, and renewables. In 2015, the share of renewables in total generation reached 34% in Ontario, 28% in New Brunswick, 24% in Nova Scotia, and 38% in Northwest Territories (NWT).
Three provinces and territories relied primarily on fossil fuels for electricity in 2015: Alberta (90% of generation from coal and natural gas), Saskatchewan (83% of generation from coal and natural gas), and Nunavut (100% of generation from oil).
Nearly all of the power generated in Prince Edward Island (PEI) is from wind, but PEI also relies on power imported from nearby provinces to meet its total demand.
A decade ago, wind, solar, biomass, and other non-hydro renewables comprised just 2% of total Canadian capacity. Growth over the last decade has been very impressive, especially with wind capacity growing 1 900%
and solar growing an astounding 12 500%. However, the total share of these technologies in 2015 was just 11% of capacity; and because solar and wind are intermittent, non-hydro renewables accounted for just 7% of generation.
Ontario and Nova Scotia have seen the largest gains in renewable power production over the last decade. Renewable power generation in Ontario increased from 23% to 34%. In Nova Scotia, the renewable generation share increased from 12% to 24%.
Despite various policies and programs in support of renewables, new capacity additions in Canada have been limited as a result of low growth in electricity demand and the long operating life of existing facilities. Cost concerns and local opposition have also limited growth opportunities.
11% of Canada’s greenhouse gas emissions (GHGs) come from the electricity sector. From 2000 to 2014 emissions from this sector declined 40% due primarily to the phase out of coal in Ontario and initiatives to reduce GHGs in Nova Scotia and New Brunswick.
Renewable capacity versus generation
Capacity is the maximum electric output a facility can produce while generation refers to the amount of power actually produced. Generation facilities cannot operate at full capacity 100% of the time because of maintenance and unplanned outages. Operating costs, market conditions, technological constraints, and the availability of the necessary resources also determine how much a generator runs.
The difference between generation and capacity is distinct in the case of intermittent renewables. For example, solar photovoltaics (PV) output is relative to sun intensity during daylight hours and wind generation changes
exponentially with wind speeds. Although wind and solar accounted for 9% of Canadian capacity in 2015, they only generated 5% of Canadian electricity.
Because of their efficiency and relatively low operating costs, some generation facilities are well suited to providing constant generation and meeting minimum system demands. For example, a nuclear reactor runs at fairly constant level over a long period of time.
Other facilities such as certain types of natural gas-fired plants, can be ramped up or shut down quickly, providing power during periods of peak demand.

Canada’s Renewable Power Landscape 3
Ontario leads CanadaWind capacity
4 374 MW Solar capacity
2 119 MW
Canada ranks 2nd
in the world for hydroelectric generation4th in the world for renewable generation
Canada’s generation from hydro
58per cent
Decline in Canada’sannual GHG emissionsfrom electricity2010 to 2014
40per cent
wind capacity grew
20X2005 to 2015
solar capacity grew
125X2005 to 2015
Share of Canada’s GHGemissions from the power sector
11%
In 2015, these hydro rich areas generated almost all of their electricity from renewables
QUEBEC 99%
MANITOBA 99%
BRITISH COLUMBIA 94%
NEWFOUNDLAND 96%
YUKON 94%
New Brunswickinstalled
300 MWof wind capacity
from 2008 to 2011
PEI imports most of its electricity from NB. Virtually all
electricity produced on the island comes from wind
Nova Scotia doubled the share of generation from renewables in the last 10 years
12% to 24%
Nunavut explores the possibility of importing hydro from Manitoba
Alberta’s generation from renewables increased by
66% from 2005 to 2015
NWT now uses LNG to fuel one of its power plants. LNG reduces
GHG-emissions by about
25% compared to diesel
50%
Saskatchewanplans to achieve
capacity from renewablesources by 2030

4 Energy Market Analysis – October 2016
TA B L E 1
Share of Emissions by Sector in 2014
Oil and Gas Production 26%
Transportation 23%
Buildings 12%
Electricity 11%
Emissions-Intensive and Trade Exposed Industry* 10%
Agriculture 10%
Waste and Others 7%
*Mining (except for coal, oil, and gas), smelting and refining, and producing or processing industrial goods
Greenhouse Gas EmissionsIn 2014, Canada emitted 732 megatons of carbon dioxide equivalent (Mt CO2 equivalent). Of these GHG emissions, 78% were carbon dioxide (CO2), primarily from fossil fuel combustion.
Methane (CH4) contributed 15%, with the remaining 7% comprised of various other types of emissions including hydrofluorocarbons, perfluorocarbons and sulphur hexaflouride generated in industrial processes.
11% of Canada’s GHG emissions came from electricity production. In other words, if Canada switched to 100% non-emitting sources of electricity generation, the nation’s GHG emissions would decline by 11%. In comparison, the power sector in the U.S. generated 30% of the country’s emissions in 2014.
Ontario’s GHG emissions from electricity decreased dramatically as a result of phasing out coal generation. Emissions decreased from 43 to 6 Mt CO2 equivalent from 2000 to 2014 as shown in the graph below.
Saskatchewan and Alberta have the highest emissions from the power sector. Alberta generated 57% of Canada’s electricity GHG emissions in 2014 and Saskatchewan accounted for 18%.
Using different types of electricity generation can reduce emissions. The difference in emissions between using thermal and non-thermal generation is the most pronounced, but using carbon capture and storage (CCS) technology or switching from higher-emitting thermal sources such as coal, oil, and diesel to cleaner-burning natural gas can also decrease emissions, especially if combined-cycle generators are used.

Canada’s Renewable Power Landscape 5
0
20
40
60
80
100
120
140
2000 2014
Nova Scotia Alberta
All others New Brunswick Ontario
Saskatchewan
Mt CO2 equivalent
FIGURE 1
Electricity Emissions by Region
0
10
20
30
40
50
60
70
80
90
100
Wind Solar Hydro Biomass NaturalGas
Diesel HeavyFuel Oil
Coal
grams of CO2 equivalent per Megajoule
FIGURE 2
Emissions by Fuel Type
This chart shows provincial and territorial GHG emissions from electricity production in 2000 and 2014. Total emissions from electricity production in Canada dropped from over 120 Mt CO2 equivalent in 2000 to under 80 Mt CO2 equivalent in 2014.
This chart shows CO2 emissions by fuel type in grams of CO2 equivalent per megajoule. Coal emits the highest amount of CO2 at 90.87g/MJ, followed by heavy fuel oil at 74.58g/MJ, diesel at 74.08g/MJ, natural gas at 49.88g/MJ, and biomass at 4.59g/MJ. There are no emissions from hydro, wind, or solar.
6 Energy Market Analysis – October 2016
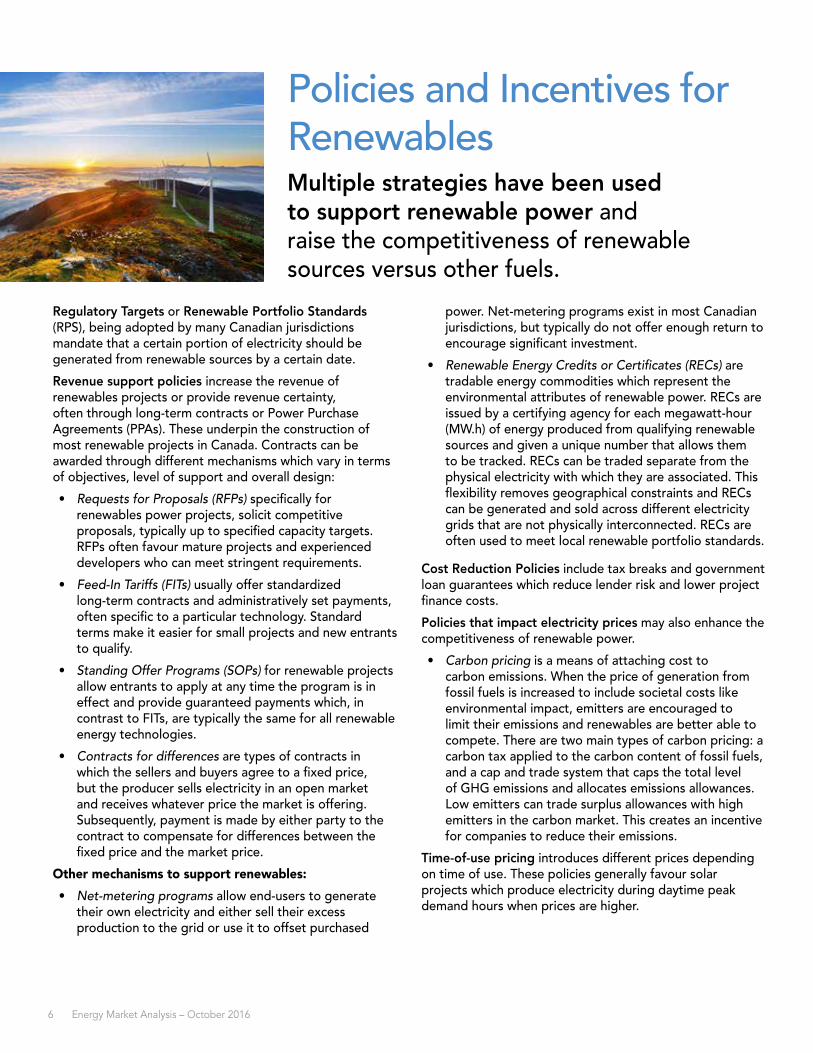
Regulatory Targets or Renewable Portfolio Standards (RPS), being adopted by many Canadian jurisdictions mandate that a certain portion of electricity should be generated from renewable sources by a certain date.
Revenue support policies increase the revenue of renewables projects or provide revenue certainty, often through long-term contracts or Power Purchase Agreements (PPAs). These underpin the construction of most renewable projects in Canada. Contracts can be awarded through different mechanisms which vary in terms of objectives, level of support and overall design:
• Requests for Proposals (RFPs) specifically for renewables power projects, solicit competitive proposals, typically up to specified capacity targets. RFPs often favour mature projects and experienced developers who can meet stringent requirements.
• Feed-In Tariffs (FITs) usually offer standardized long-term contracts and administratively set payments, often specific to a particular technology. Standard terms make it easier for small projects and new entrants to qualify.
• Standing Offer Programs (SOPs) for renewable projects allow entrants to apply at any time the program is in effect and provide guaranteed payments which, in contrast to FITs, are typically the same for all renewable energy technologies.
• Contracts for differences are types of contracts in which the sellers and buyers agree to a fixed price, but the producer sells electricity in an open market and receives whatever price the market is offering. Subsequently, payment is made by either party to the contract to compensate for differences between the fixed price and the market price.
Other mechanisms to support renewables:
• Net-metering programs allow end-users to generate their own electricity and either sell their excess production to the grid or use it to offset purchased
power. Net-metering programs exist in most Canadian jurisdictions, but typically do not offer enough return to encourage significant investment.
• Renewable Energy Credits or Certificates (RECs) are tradable energy commodities which represent the environmental attributes of renewable power. RECs are issued by a certifying agency for each megawatt-hour (MW.h) of energy produced from qualifying renewable sources and given a unique number that allows them to be tracked. RECs can be traded separate from the physical electricity with which they are associated. This flexibility removes geographical constraints and RECs can be generated and sold across different electricity grids that are not physically interconnected. RECs are often used to meet local renewable portfolio standards.
Cost Reduction Policies include tax breaks and government loan guarantees which reduce lender risk and lower project finance costs.
Policies that impact electricity prices may also enhance the competitiveness of renewable power.
• Carbon pricing is a means of attaching cost to carbon emissions. When the price of generation from fossil fuels is increased to include societal costs like environmental impact, emitters are encouraged to limit their emissions and renewables are better able to compete. There are two main types of carbon pricing: a carbon tax applied to the carbon content of fossil fuels, and a cap and trade system that caps the total level of GHG emissions and allocates emissions allowances. Low emitters can trade surplus allowances with high emitters in the carbon market. This creates an incentive for companies to reduce their emissions.
Time-of-use pricing introduces different prices depending on time of use. These policies generally favour solar projects which produce electricity during daytime peak demand hours when prices are higher.
Policies and Incentives for RenewablesMultiple strategies have been used to support renewable power and raise the competitiveness of renewable sources versus other fuels.

Canada’s Renewable Power Landscape 7
8 Energy Market Analysis – October 2016
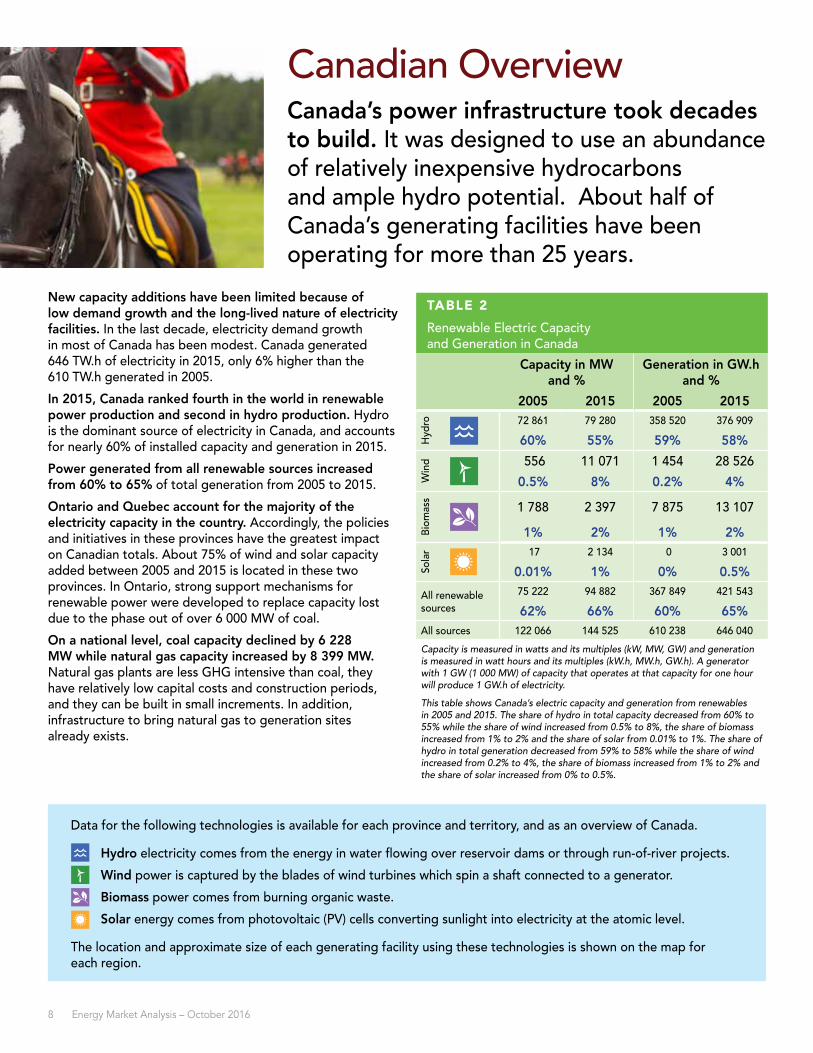
New capacity additions have been limited because of low demand growth and the long-lived nature of electricity facilities. In the last decade, electricity demand growth in most of Canada has been modest. Canada generated 646 TW.h of electricity in 2015, only 6% higher than the 610 TW.h generated in 2005.
In 2015, Canada ranked fourth in the world in renewable power production and second in hydro production. Hydro is the dominant source of electricity in Canada, and accounts for nearly 60% of installed capacity and generation in 2015.
Power generated from all renewable sources increased from 60% to 65% of total generation from 2005 to 2015.
Ontario and Quebec account for the majority of the electricity capacity in the country. Accordingly, the policies and initiatives in these provinces have the greatest impact on Canadian totals. About 75% of wind and solar capacity added between 2005 and 2015 is located in these two provinces. In Ontario, strong support mechanisms for renewable power were developed to replace capacity lost due to the phase out of over 6 000 MW of coal.
On a national level, coal capacity declined by 6 228 MW while natural gas capacity increased by 8 399 MW. Natural gas plants are less GHG intensive than coal, they have relatively low capital costs and construction periods, and they can be built in small increments. In addition, infrastructure to bring natural gas to generation sites already exists.
Canadian OverviewCanada’s power infrastructure took decades to build. It was designed to use an abundance of relatively inexpensive hydrocarbons and ample hydro potential. About half of Canada’s generating facilities have been operating for more than 25 years.
TABLE 2
Renewable Electric Capacity and Generation in Canada
Capacity in MW and %
Generation in GW.h and %
2005 2015 2005 2015
Hyd
ro 72 861 79 280 358 520 376 909
60% 55% 59% 58%W
ind 556 11 071 1 454 28 526
0.5% 8% 0.2% 4%
Biom
ass
1 788 2 397 7 875 13 107
1% 2% 1% 2%
Sola
r 17 2 134 0 3 001
0.01% 1% 0% 0.5%
All renewable sources
75 222 94 882 367 849 421 543
62% 66% 60% 65%All sources 122 066 144 525 610 238 646 040
Capacity is measured in watts and its multiples (kW, MW, GW) and generation is measured in watt hours and its multiples (kW.h, MW.h, GW.h). A generator with 1 GW (1 000 MW) of capacity that operates at that capacity for one hour will produce 1 GW.h of electricity.
This table shows Canada’s electric capacity and generation from renewables in 2005 and 2015. The share of hydro in total capacity decreased from 60% to 55% while the share of wind increased from 0.5% to 8%, the share of biomass increased from 1% to 2% and the share of solar from 0.01% to 1%. The share of hydro in total generation decreased from 59% to 58% while the share of wind increased from 0.2% to 4%, the share of biomass increased from 1% to 2% and the share of solar increased from 0% to 0.5%.
Data for the following technologies is available for each province and territory, and as an overview of Canada.
Hydro electricity comes from the energy in water flowing over reservoir dams or through run-of-river projects.
Wind power is captured by the blades of wind turbines which spin a shaft connected to a generator.
Biomass power comes from burning organic waste.
Solar energy comes from photovoltaic (PV) cells converting sunlight into electricity at the atomic level.
The location and approximate size of each generating facility using these technologies is shown on the map for each region.
Canada’s Renewable Power Landscape 9
!(
!(
!(
!(
!(
!(!(
!(
!(
!(
!(!(
!(
!(!(
!(
!(!(!(
!(
!(
!(
!(
!(
!(
!(!(
!(
!(
!(
!(
!(
!(
!(
!( !(
!(
!(!(
!(
!(!(
!(
!(!(
!(
!(
!(
!(
!(
!(
!(
!(
!(
!(
!(
!(
!( !(
!(
!(
!(
!(
!(
!(
!(
!(
!(
!(
!(
!(
!(
!(
!(!(!(
!(
!(
!(
!(
!(
!(!(
!(
!(
!(
!(
!(
!(
!(
!(!(
!(
!(
!(
!(
!( !(
!(
!(
!(
!(
!(
!( !(
!(
!(!(
!(
!(
!(
!(
!(
!(
!(
!(
!(
!(
!(
!(
!(
!(
!(
!(!(
!(!(
!(
!(
!(
!(
!(
!( !(!(
!(!(
!(
!(
!(
!(
!(
!(!(
!(!(
!(
!(
!(!(!(
!(
!(
!(
!(
!(
!(
!(!(!(
!(
!(
!(
!(
!(
!(
!(
!(
!(
!(
!(
!(
!(
!(
!(
!(
!(
!(
!(
!(
!(
!(
!(
!(
!(
!(
!(
!(
!(
!(
!(
!(
!(!(
!(
!(
!(
!(
!(
!(
!(
!(
!(
!(
!(
!(
!(
!(
!(
!(
!(
!(
!(
!(
!(
!(
!(
!(
!(
!(!(
!(
!(
!(
!(
!(
!(
!(
!(
!(
!(
!(
!(
!(!(
!(
!(
!(
!(
!(
!( !(
!(
!(
!(
!(
!( !(
!(
!(
!(
!(
!(
!(
!(
!(
!(
!(
!(
!(
!(
!(
!(
!(
!(
!(
!(
!( !(!(
!(
!(!(
!(
!(
!(
!(
!(
!(
!(!( !(
!(
!(
!(
!(
!(
!(
!(
!(
!(
!(
!(
!(
!(
!(
!(
!(!(
!(
!(
!(
!(
!(
!(
!(
!(
!(
!(
!(
!(
!(
!(
!(
!(
!(
!(
!(
!(
!(
!(
!(!(
!(
!(
!(!(
!(
!(
!(
!(
!(
!(
!(
!(
!(
!(
!(
!(
!(
!(
!(!(
!(
!(
!(
!(
!(
!(
!(
!(
!(
!(
!(
!( !(
!(
!(
!(
!(
!( !(
!(
!(
!(
!(
!(
!(
!( !(
!(!(
!(
!(
!(!(
!(
!(
!(!(!(
!(
!(
!(
!(
!(!(!(
!(
!(
!(
!(
!(
!(
!(
!(
!(
!(
!(!(
!(
!(!(!(!(
!(
!(
!(!(!(!(
!(
!(!(
!(
!(
!( !(!(
!(!(
!(!(
!(
!(!(
!(
!(
!(
!(
!(
!(
!(
!(
!(!(
!(
!(
!(!(
!(
!(
!(
!(
!(
!(
!(
!(
!(
!(
!(
!(
!(
!(
!(
!(!(
!(
!(
!(
!(
!(
!(
!(!(
!(
!(
!(
!(
!(!(
!(
!(
!(
!(
!(!(
!(
!(!(
!(!(!(
!(
!(!(
!(!(
!(
!(
!(!(0 1,000500 km
Map produced by the NEB, September, 2016
Renewable Capacity (MW)
( 50-99( 100-199( 200-499( 500-999
( 1000 >
( 10-49
ResourceHydroelectric!
Wind!
Biomass!
Solar!
0
50 000
100 000
150 000
2005 2015Non-hydro renewables
Hydro
Nuclear
Natural gas
Coal
Oil
MW
FIGURE 4
Electric Generation Capacity in Canada
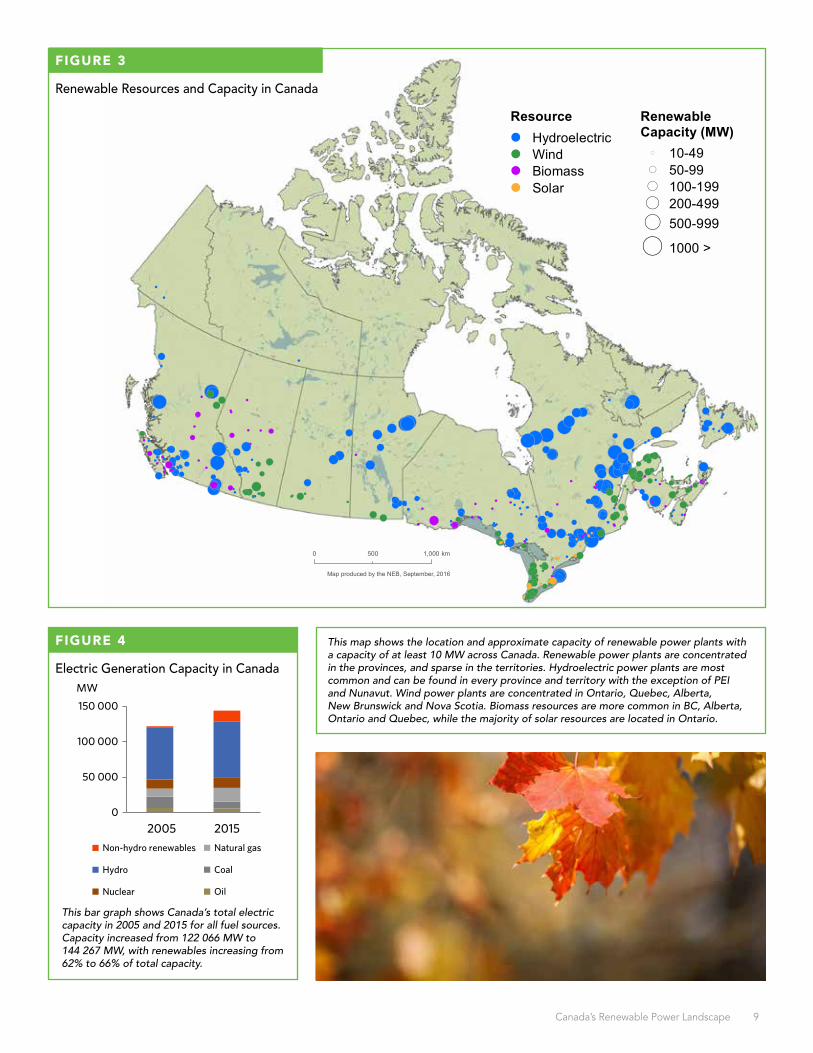
This bar graph shows Canada’s total electric capacity in 2005 and 2015 for all fuel sources. Capacity increased from 122 066 MW to 144 267 MW, with renewables increasing from 62% to 66% of total capacity.
FIGURE 3
Renewable Resources and Capacity in Canada
!(
!(
!(
!(
!(
!(!(
!(
!(
!(
!(!(
!(
!(!(
!(
!(!(!(
!(
!(
!(
!(
!(
!(
!(!(
!(
!(
!(
!(
!(
!(
!(
!( !(
!(
!(!(
!(
!(!(
!(
!(!(
!(
!(
!(
!(
!(
!(
!(
!(
!(
!(
!(
!(
!( !(
!(
!(
!(
!(
!(
!(
!(
!(
!(
!(
!(
!(
!(
!(
!(!(!(
!(
!(
!(
!(
!(
!(!(
!(
!(
!(
!(
!(
!(
!(
!(!(
!(
!(
!(
!(
!( !(
!(
!(
!(
!(
!(
!( !(
!(
!(!(
!(
!(
!(
!(
!(
!(
!(
!(
!(
!(
!(
!(
!(
!(
!(
!(!(
!(!(
!(
!(
!(
!(
!(
!( !(!(
!(!(
!(
!(
!(
!(
!(
!(!(
!(!(
!(
!(
!(!(!(
!(
!(
!(
!(
!(
!(
!(!(!(
!(
!(
!(
!(
!(
!(
!(
!(
!(
!(
!(
!(
!(
!(
!(
!(
!(
!(
!(
!(
!(
!(
!(
!(
!(
!(
!(
!(
!(
!(
!(
!(
!(!(
!(
!(
!(
!(
!(
!(
!(
!(
!(
!(
!(
!(
!(
!(
!(
!(
!(
!(
!(
!(
!(
!(
!(
!(
!(
!(!(
!(
!(
!(
!(
!(
!(
!(
!(
!(
!(
!(
!(
!(!(
!(
!(
!(
!(
!(
!( !(
!(
!(
!(
!(
!( !(
!(
!(
!(
!(
!(
!(
!(
!(
!(
!(
!(
!(
!(
!(
!(
!(
!(
!(
!(
!( !(!(
!(
!(!(
!(
!(
!(
!(
!(
!(
!(!( !(
!(
!(
!(
!(
!(
!(
!(
!(
!(
!(
!(
!(
!(
!(
!(
!(!(
!(
!(
!(
!(
!(
!(
!(
!(
!(
!(
!(
!(
!(
!(
!(
!(
!(
!(
!(
!(
!(
!(
!(!(
!(
!(
!(!(
!(
!(
!(
!(
!(
!(
!(
!(
!(
!(
!(
!(
!(
!(
!(!(
!(
!(
!(
!(
!(
!(
!(
!(
!(
!(
!(
!( !(
!(
!(
!(
!(
!( !(
!(
!(
!(
!(
!(
!(
!( !(
!(!(
!(
!(
!(!(
!(
!(
!(!(!(
!(
!(
!(
!(
!(!(!(
!(
!(
!(
!(
!(
!(
!(
!(
!(
!(
!(!(
!(
!(!(!(!(
!(
!(
!(!(!(!(
!(
!(!(
!(
!(
!( !(!(
!(!(
!(!(
!(
!(!(
!(
!(
!(
!(
!(
!(
!(
!(
!(!(
!(
!(
!(!(
!(
!(
!(
!(
!(
!(
!(
!(
!(
!(
!(
!(
!(
!(
!(
!(!(
!(
!(
!(
!(
!(
!(
!(!(
!(
!(
!(
!(
!(!(
!(
!(
!(
!(
!(!(
!(
!(!(
!(!(!(
!(
!(!(
!(!(
!(
!(
!(!(0 1,000500 km
Map produced by the NEB, September, 2016
Renewable Capacity (MW)
( 50-99( 100-199( 200-499( 500-999
( 1000 >
( 10-49
ResourceHydroelectric!
Wind!
Biomass!
Solar!
This map shows the location and approximate capacity of renewable power plants with a capacity of at least 10 MW across Canada. Renewable power plants are concentrated in the provinces, and sparse in the territories. Hydroelectric power plants are most common and can be found in every province and territory with the exception of PEI and Nunavut. Wind power plants are concentrated in Ontario, Quebec, Alberta, New Brunswick and Nova Scotia. Biomass resources are more common in BC, Alberta, Ontario and Quebec, while the majority of solar resources are located in Ontario.

10 Energy Market Analysis – October 2016
Hydro remains the most important source of power generation, followed by biomass, natural gas, wind and oil. Non-hydro renewables reached 8% of total capacity in 2015, amounting to a 70% (563 MW) increase since 2005.
Hydro capacity has grown by 17% or over 2 000 MW since 2005. Hydroelectric reservoirs such as Williston Lake created by the W.A.C Bennett Dam in the northern interior of BC also function as storage and backup for less predictable wind projects.
Provincial Crown corporations own and operate approximately 80% of installed capacity. These two companies are the British Columbia Hydro and Power Authority (BC Hydro) and the Columbia Power Corporation.
The remaining capacity is provided by FortisBC and independent power producers including municipalities and First Nations. Renewable power is sold to BC Hydro or its marketing arm, Powerex.
BC Hydro is expected to produce or contract enough electricity from resources in BC to satisfy its load requirements. In 2007, the province announced a goal to achieve electricity self-sufficiency by 2016 and generate 90% of its energy from clean or renewable sources. This goal was later increased to 93%. The province has a legislative commitment in the Clean Energy Act that 66% of BC Hydro’s future incremental power demand must be met through conservation by 2020.
BC’s renewable generating capacity increased by almost 2 800 MW between 2005 and 2015 through various RFPs, and upgrades. Most additions were from expansions of hydro facilities. Site C, a new 1 100 MW dam, is under construction.
Wind capacity grew from 0 to 488 MW between 2005 and 2015. Four wind farms were built between 2009 and 2014, most of them under the BC Hydro Standing Offer Program initiated in 2008.
Biomass capacity grew 9% in the last ten years. The 2008 BC Bioenergy Strategy resulted in BC Hydro RFPs for bioenergy in 2008 and for both bioenergy and biomass in 2010. Some biomass plants are built on the sites of idle sawmills.
British ColumbiaClose to 95% of BC’s electricity is generated from renewables. Its renewable capacity is more than 16 000 MW, representing approximately 90% of total installed capacity.
TABLE 3
Renewable Electric Capacity and Generation in BC
Capacity in MW and %
Generation in GW.h and %
2005 2015 2005 2015
Hyd
ro 12 847 15 029 60 327 57 374
85% 84% 89% 86%
Win
d 0 488 0 1 206
0% 3% 0% 2%
Biom
ass
811 886 3 254 3 711
5% 5% 5% 6%
All renewable sources
13 658 16 405 63 581 62 292
91% 92% 94% 94%All sources 15 030 17 913 67 774 66 565
This table shows BC’s electric capacity and generation from renewables in 2005 and 2015. The share of hydro in total capacity decreased from 85% to 84% while the share of wind increased from 0% to 3%; the share of biomass remained stable at 5%. The share of hydro in total generation decreased from 89% to 86% while the share of wind increased from 0% to 2% and the share of biomass increased from 5% to 6%.
Canada’s Renewable Power Landscape 11
Victoria
0 400200 km
BC Renewable Capacity (MW)
50-99100-199200-499500-999
1000 >
10-49
ResourceHydroelectricWindBiomass
Map produced by the NEB, September, 2016
0
5 000
10 000
15 000
20 000
2005 2015Non-hydro renewables
Hydro
Natural gas and oil
MW
FIGURE 6
Electric Generation Capacity in BC
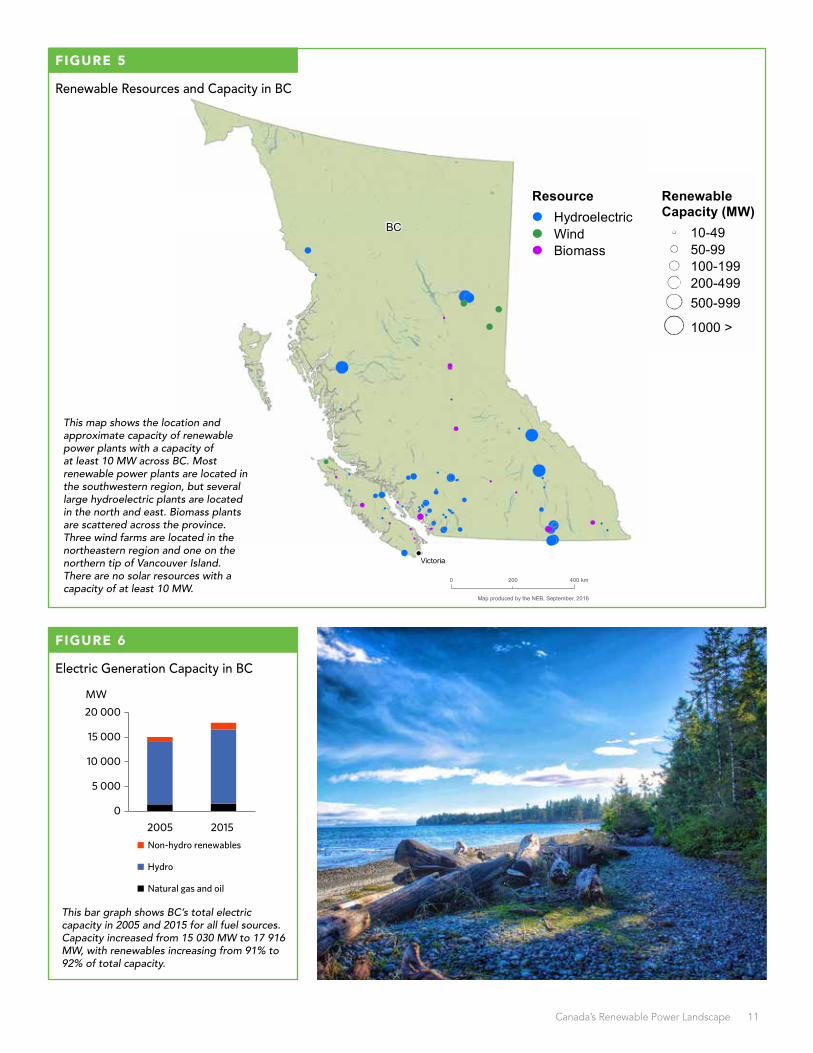
This bar graph shows BC’s total electric capacity in 2005 and 2015 for all fuel sources. Capacity increased from 15 030 MW to 17 916 MW, with renewables increasing from 91% to 92% of total capacity.
FIGURE 5
Renewable Resources and Capacity in BC
Victoria
0 400200 km
BC Renewable Capacity (MW)
50-99100-199200-499500-999
1000 >
10-49
ResourceHydroelectricWindBiomass
Map produced by the NEB, September, 2016
This map shows the location and approximate capacity of renewable power plants with a capacity of at least 10 MW across BC. Most renewable power plants are located in the southwestern region, but several large hydroelectric plants are located in the north and east. Biomass plants are scattered across the province. Three wind farms are located in the northeastern region and one on the northern tip of Vancouver Island. There are no solar resources with a capacity of at least 10 MW.

12 Energy Market Analysis – October 2016
To meet increasing electricity demand between 2005 and 2015, many power plants, mainly fired with natural gas, were built in Alberta. Consequently, the share of renewable generation increased only slightly from 7% in 2005 to 10% in 2015.
Approximately 40% of Alberta’s generation capacity is natural gas-fired and 40% is coal-fired. However, coal-fired generation produces 51% of Alberta’s electricity, and Alberta has the highest level of coal-fired generation of any province. Alberta has significant coal and natural gas resources which can make it difficult for other fuel sources to be cost-competitive.
Alberta deregulated the wholesale electricity market in 1996 and the retail electricity market in 2001. Wholesale prices are determined by the market which consists of about 200 participants including five major wholesalers. The system is administered by the Alberta Electric System Operator.
Alberta has approximately 1 500 MW of installed wind capacity, ranking 3rd behind Ontario and Quebec. The 300 MW Blackspring Ridge project, the largest wind energy investment in western Canada, was built in 2014. The project is partially financed through RECs. While power from the project is sold in Alberta, the project’s RECs are contracted to Pacific Gas and Electric, a California utility, who uses them to comply with California’s renewable portfolio standards.
Renewable projects face specific challenges in Alberta. In Alberta’s deregulated market, producers sell to the power pool at market rates. Wind farms cannot always adjust output to produce more electricity when prices are at their peak. Consequently, they more often sell energy at times when prices are weaker, earning lower average revenue than other producers.
In addition, unlike power generated from coal and natural gas, wind and solar cannot produce power on demand for Alberta’s many industrial users. This reliability risk is a drawback for industrial users without backup supply sources.
Finally, due to the distance between major demand centres and suitable rivers in Alberta, the high cost to develop hydro-electricity currently prevents its widespread use.
In 2007, Alberta established legislation targeted towards large industrial emitters to reduce GHG emissions. In 2008, a target to reduce emissions by 200 Mt below current projections by 2050 was introduced as part of Alberta’s Climate Change Strategy. Since 2008, Alberta implemented a net-metering program which allows Albertans to send excess small scale generation from renewable sources into the grid.
In November 2015, Alberta introduced a plan to phase out coal-fired generation by 2030. The Climate Leadership Plan proposes replacing two thirds of generation capacity with renewables and the remainder with natural gas. The proposed strategy would also include renewable incentives.
AlbertaIn 2015 Alberta generated 7 947 GW.h or 10% of its total generation from renewables. This is a significant increase from the 4 782 GW.h generated in 2005.
TABLE 4
Renewable Electric Capacity and Generation in Alberta
Capacity in MW and %
Generation in GW.h and %
2005 2015 2005 2015
Hyd
ro 869 894 2 316 1 709
7% 5% 3% 2%
Win
d 251 1 463 741 4 089
2% 9% 1% 5%
Biom
ass
271 428 1 725 2 149
2% 3% 3% 3%
All renewable sources
1 391 2 791 4 782 7 947
12% 17% 7% 10%All sources 12 008 16 279 68 435 81 540
This table shows Alberta’s electric capacity and generation from renewables in 2005 and 2015. The share of hydro in total capacity decreased from 7% to 5% while the share of wind increased from 2% to 9% and the share of biomass from 2% to 3%. The share of hydro in total generation decreased from 3% to 2% while the share of wind increased from 1% to 5% and the share of biomass remained stable at 3%.

Canada’s Renewable Power Landscape 13
Edmonton
0 400200 km
AB
Map produced by the NEB, September, 2016
Renewable Capacity (MW)
50-99100-199200-499
10-49
ResourceHydroelectricWindBiomass
0
5 000
10 000
15 000
20 000
2005 2015
Non-hydro renewables
Hydro
Natural gas
Coal and oil
MW
FIGURE 8
Electric Generation Capacity in Alberta
This bar graph shows Alberta’s total electric capacity in 2005 and 2015 for all fuel sources. Capacity increased from 12 008 MW to 16 018 MW, with renewables increasing from 12% to 17% of total capacity.
FIGURE 7
Renewable Resources and Capacity in Alberta
Edmonton
0 400200 km
AB
Map produced by the NEB, September, 2016
Renewable Capacity (MW)
50-99100-199200-499
10-49
ResourceHydroelectricWindBiomass
The map shows the location and approximate capacity of renewable power plants with a capacity of at least 10 MW across Alberta. Wind farms are concentrated in the southern region while hydroelectric resources are located southwest and biomass resources are concentrated in the north. There are no solar resources with a capacity of at least 10 MW.

14 Energy Market Analysis – October 2016
The province’s five wind farms have a combined capacity of 221 MW. Hydro and wind were used to generate 17% of Saskatchewan’s electricity in 2015.
Between 2005 and 2014, about 22% of electricity in Saskatchewan was produced from renewable resources. This figure changes each year because of fluctuations in hydroelectric generation. Electricity demand in Saskatchewan has increased at a relatively strong pace in the last few years and the share of renewable generation has remained relatively stable even though renewable generation has increased.
Most capacity belongs to SaskPower, the principal electric utility company and the rest is operated by independent power producers.
Coal remains the most important source of power generation, followed by natural gas, hydro and wind. Electricity generation from the province’s three coal-fired plants is reliable and relatively low cost.
SaskPower Centennial Wind Power Facility was once the biggest wind facility in Canada. The 150 MW facility was developed in 2006 under the provincial Green Power Portfolio program.
Between 2010 and 2015, independent power producers built three additional wind farms following RFPs by SaskPower.
In 2015 SaskPower set a target of 50% renewable power by 2030. To achieve this goal, the share of renewables in the capacity mix must double in the next 15 years. In addition to wind capacity, the province also plans to develop solar projects.
SaskPower offers several programs to encourage the use of renewables and flare gas. Although natural gas is not a renewable resource, the programs support generation of electricity from natural gas which would otherwise be flared into the environment.
Small producers with up to 100 kW of capacity can offset or sell their production through Net Metering or Small Power Producers programs. Flare Gas Power Generation Program supports small and medium-sized oil producers who want to generate power from gas that would have been flared.
With the launch of the Boundary Dam Carbon Capture Project in 2014, SaskPower pioneered the use of CCS technology which cuts emissions from existing coal-fired plants.
SaskatchewanRenewable capacity in Saskatchewan reached 1 115 MW (25% of total capacity) in 2015. Hydroelectric plants provide 889 MW of capacity, a figure almost unchanged since 2005.
TABLE 5
Renewable Electric Capacity and Generation in Saskatchewan
Capacity in MW and %
Generation in GW.h and %
2005 2015 2005 2015
Hyd
ro 854 889 4 573 3 426
23% 20% 23% 15%
Win
d 16 221 92 684
0.4% 5% 0.5% 3%
All renewable sources
870 1 115 4 665 4 110
23% 25% 23% 17%All sources 3 743 4 477 19 910 23 599
This table shows Saskatchewan’s electric capacity and generation from renewables in 2005 and 2015. The share of hydro in total capacity decreased from 23% to 20% while the share of wind increased from 0.4% to 5%. The share of hydro in total generation decreased from 23% to 15% while the share of wind increased from 0.5% to 3%.
Canada’s Renewable Power Landscape 15
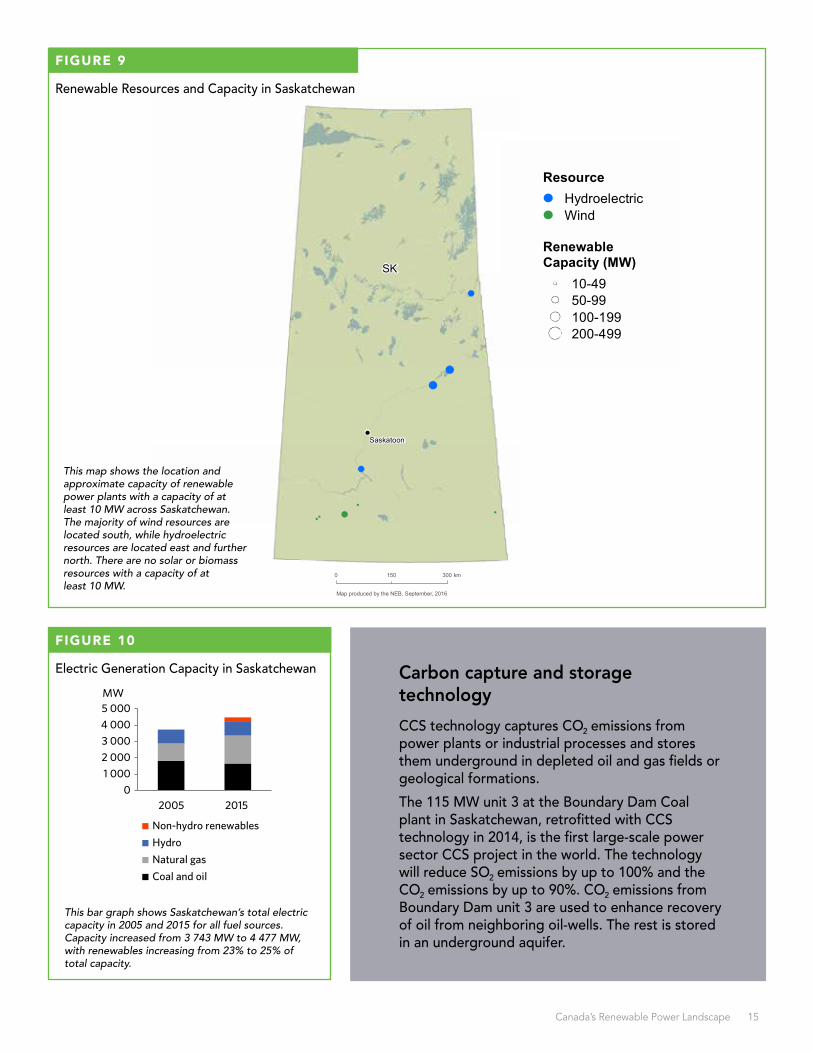
Carbon capture and storage technology
CCS technology captures CO2 emissions from power plants or industrial processes and stores them underground in depleted oil and gas fields or geological formations.
The 115 MW unit 3 at the Boundary Dam Coal plant in Saskatchewan, retrofitted with CCS technology in 2014, is the first large-scale power sector CCS project in the world. The technology will reduce SO2 emissions by up to 100% and the CO2 emissions by up to 90%. CO2 emissions from Boundary Dam unit 3 are used to enhance recovery of oil from neighboring oil-wells. The rest is stored in an underground aquifer.
Saskatoon
SK
0 300150 km
Map produced by the NEB, September, 2016
Renewable Capacity (MW)
50-99100-199200-499
10-49
ResourceHydroelectricWind
01 0002 0003 0004 0005 000
2005 2015
Non-hydro renewablesHydroNatural gasCoal and oil
MW
FIGURE 10
Electric Generation Capacity in Saskatchewan
This bar graph shows Saskatchewan’s total electric capacity in 2005 and 2015 for all fuel sources. Capacity increased from 3 743 MW to 4 477 MW, with renewables increasing from 23% to 25% of total capacity.
FIGURE 9
Renewable Resources and Capacity in Saskatchewan
This map shows the location and approximate capacity of renewable power plants with a capacity of at least 10 MW across Saskatchewan. The majority of wind resources are located south, while hydroelectric resources are located east and further north. There are no solar or biomass resources with a capacity of at least 10 MW.
Saskatoon
SK
0 300150 km
Map produced by the NEB, September, 2016
Renewable Capacity (MW)
50-99100-199200-499
10-49
ResourceHydroelectricWind

16 Energy Market Analysis – October 2016
Most electricity in Manitoba is procured through Manitoba Hydro, a Crown corporation and the province’s major energy utility. Manitoba Hydro determines future electricity requirements and is responsible for the design, construction, and operation of hydro facilities. Wind and biomass facilities are operated by independent power producers.
Manitoba has 15 major hydroelectric generating stations, the largest of which are located along the Nelson River. The increase in hydro capacity in 2015 is attributed to the new 200 MW Wuskwatim Project that was placed in service in 2012. In addition, the 695 MW Keeyask Project is under construction and is expected to come online in 2019.
Between 2005 and 2015, over 200 MW of wind power was added to Manitoba’s supply. Favourable wind resources and recent grid upgrades would allow for further increases.
Manitoba generates almost 100% renewable electricity. However, the province’s power sector could further reduce global GHG emissions by increasing clean energy exports into neighbouring provinces and states dominated by coal and natural gas-fired generation. In 2015, Manitoba Hydro’s exports reduced net global GHG emissions by approximately 7.5 million tonnes of CO2. Energy conservation and construction of new hydro capacity will increase the amount of electricity available for sale. The province is also improving electricity transmission infrastructure by adding a new 500 kV line in 2020 to improve reliability and facilitate up to 883 MW in increased exports to the U.S. Mid-West. Manitoba Hydro is also planning on building a new 230 kV transmission line to Saskatchewan in the same time frame, increasing exports by 100 MW.
In 2012, Manitoba implemented an emissions tax on coal and petroleum coke, both of which will be banned in 2017. Revenues from the tax are used for the Biomass Energy Support Program which helps former coal users transition to local, renewable energy sources.
Manitoba plans to reduce GHGs by one third by 2030, and one half by 2050 compared to 2005 levels. This was put forth in Manitoba’s Climate Change and Green Economy Action Plan, released in December 2015. The province aims to be carbon-neutral by 2080. The plan is an update and expansion of earlier strategies (Clean Energy Strategy 2012, Tomorrow Now 2014) and considers a cap and trade program for large emitters. Details have not yet been finalized, but the intent is to join Quebec, California and Ontario in the Western Climate Initiative.
ManitobaElectricity in Manitoba is generated almost entirely from renewable sources. Given Manitoba’s rich abundant hydro resources, hydroelectricity accounts for the vast majority of capacity; wind has grown considerably in the last decade, from 20 to 258 MW.
TABLE 6
Renewable Electric Capacity and Generation in Manitoba
Capacity in MW and %
Generation in GW.h and %
2005 2015 2005 2015
Hyd
ro 5 038 5 239 36 440 34 694
90% 87% 98% 97%
Win
d 20 258 53 860
0.4% 4% 0.1% 2%
Biom
ass
22 22 27 45
0.4% 0.4% 0.1% 0.1%
All renewable sources
5 080 5 520 36 521 35 599
91% 92% 98% 99.6%All sources 5 578 5 998 37 077 35 757
This table shows Manitoba’s electric capacity and generation from renewables in 2005 and 2015. The share of hydro in total capacity decreased from 90% to 87% while the share of wind increased from 0.4% to 4% and the share of biomass remained stable at 0.4%. The share of hydro in total generation decreased from 98% to 97% while the share of wind increased from 0.1% to 2% and the share of biomass remained stable at 0.1%.
Canada’s Renewable Power Landscape 17
Winnipeg
0 300150 km
MB
Map produced by the NEB, September, 2016
Renewable Capacity (MW)
50-99100-199200-499500-999
1000 >
10-49
ResourceHydroelectricWindBiomass
0
2 000
4 000
6 000
8 000
2005 2015Non-hydro renewables
Hydro
Natural gas
Coal and oil
MW
FIGURE 12
Electric Generation Capacity in Manitoba
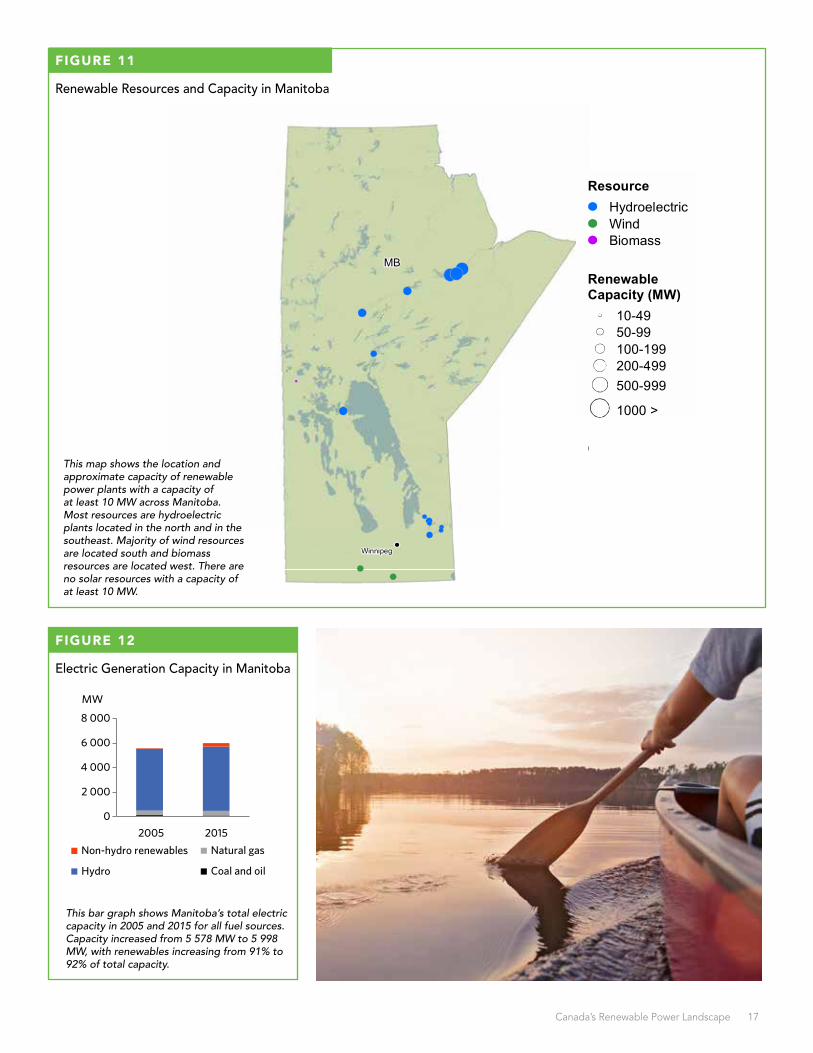
This bar graph shows Manitoba’s total electric capacity in 2005 and 2015 for all fuel sources. Capacity increased from 5 578 MW to 5 998 MW, with renewables increasing from 91% to 92% of total capacity.
FIGURE 11
Renewable Resources and Capacity in Manitoba
This map shows the location and approximate capacity of renewable power plants with a capacity of at least 10 MW across Manitoba. Most resources are hydroelectric plants located in the north and in the southeast. Majority of wind resources are located south and biomass resources are located west. There are no solar resources with a capacity of at least 10 MW.
Winnipeg
0 300150 km
MB
Map produced by the NEB, September, 2016
Renewable Capacity (MW)
50-99100-199200-499500-999
1000 >
10-49
ResourceHydroelectricWindBiomass

18 Energy Market Analysis – October 2016
However, generation from biomass more than tripled, and generation from wind and solar went from almost nothing in 2005 to 6% and 2% of generation, respectively.
Ontario leads Canada in wind and solar capacity. In the last decade, wind capacity increased by 4 359 MW, reaching 4 374 MW in 2015. Solar capacity increased from 17 MW in 2005 to 2 119 MW in 2015. Most of the province’s solar installations are small systems connected to local distribution networks, but the first commercial transmission-connected solar farms were built in 2015.
Power generation in Ontario is publicly and privately owned. Ontario Power Generation, a provincial Crown corporation, is one of the largest electricity producers in North America. At the end of 2015, it had 17 055 MW of hydroelectric, nuclear, biomass and other thermal generating capacity.
Ontario’s remaining power plants are owned by private entities, such as Bruce Power, TransCanada, Brookfield Renewable Power, and various independent power producers.
Ontario phased out the use of coal in 2014. The Lakeview coal-fired plant was shut down in 2005, followed by Atikokan in 2012, Lambton and Nanticoke in 2013, and Thunder Bay in 2014. In 2013, The Ending Coal for Cleaner Air Act was introduced to ensure no future coal plants are built in Ontario.
Most of the growth in renewable project development has occurred within the last seven years through the FIT Program which promotes the use of renewable energy sources including on-shore wind, hydro, biomass, biogas, landfill gas, and solar PV. The FIT Program was introduced as part of the 2009 Green Energy and Economy Act and is open to projects between 10 kW and 500 kW. Projects with a capacity of 10 kW or less may qualify under the microFIT program. Both programs are administered by the Independent Electricity System Operator (IESO).
In June 2016, the combined capacity contracted through four waves of the FIT Program totaled 4 864 MW; of which 67 MW were bio-energy, 1 672 MW solar, 2 964 MW wind and 162 MW hydroelectricity. In addition, 177 MW of combined contract capacity from solar generation was in commercial operation under the microFIT Program.
OntarioOntario generated more than one third of its electricity from renewable sources in 2015, up from 23% in 2005. Hydroelectric generation, which accounts for most of that power, remained relatively unchanged between 2005 and 2015.
TABLE 7
Renewable Electric Capacity and Generation in Ontario
Capacity in MW and %
Generation in GW.h and %
2005 2015 2005 2015
Hyd
ro 8 505 8 768 35 480 37 300
27% 22% 22% 23%
Win
d 15 4 374 26 10 200
0% 11% 0% 6%
Biom
ass
209 574 1 252 3 899
1% 1% 1% 2%
Sola
r 17 2 119 0 3 001
0.1% 5% 0% 2%
All renewable sources
8 745 15 835 36 757 54 400
28% 40% 23% 34%All sources 31 575 39 345 159 335 159 999
This table shows Ontario’s electric capacity and generation from renewables in 2005 and 2015. The share of hydro in total capacity decreased from 27% to 22% while the share of wind increased from 0% to 11%, the share of biomass remained stable at 1% and the share of solar increased from 0.1% to 5%. The share of hydro in total generation increased from 22% to 23% while the share of wind increased from 0% to 6%, the share of biomass from 1% to 2% and the share of solar from 0% to 2%.
The procurement of renewable projects continues. In 2016, the IESO awarded contracts for over 450 MW under the first phase of the Large Renewable Procurement program.
The 2013 Long Term Energy Plan sets a long-term conservation target of 30 TW.h by 2032 which represents a 16% reduction in forecasted electricity demand compared to what was forecast in the absence of the program. It also outlines a goal to use Demand Response to meet 10% of peak demand by 2025, equivalent to approximately 2 400 MW. Demand Response occurs when consumers reduce their electricity consumption in response to price signals and system needs, shifting demand from peak to off-peak times.
The Ontario government is committed to increasing the amount of renewable energy to 20 000 MW by 2025. This equals almost half of Ontario’s current installed capacity.

Canada’s Renewable Power Landscape 19
Ottawa
Toronto
Map produced by the NEB, September, 2016
0 300150 km
ON
Renewable Capacity (MW)
50-99100-199200-499500-999
1000 >
10-49
ResourceHydroelectricWindBiomassSolar
0
10 000
20 000
30 000
40 000
50 000
2005 2015
Non-hydro renewables
Hydro
Nuclear
Natural gas
Coal
Oil
MW
FIGURE 14
Electric Generation Capacity in Ontario
This bar graph shows Ontario’s total electric capacity in 2005 and 2015 for all fuel sources. Capacity increased from 31 575 MW to 39 345 MW, with renewables increasing from 28% to 40% of total capacity.
FIGURE 13
Renewable Resources and Capacity in Ontario
Ottawa
Toronto
Map produced by the NEB, September, 2016
0 300150 km
ON
Renewable Capacity (MW)
50-99100-199200-499500-999
1000 >
10-49
ResourceHydroelectricWindBiomassSolar
The amount of wind, solar and bioenergy capacity would gradually increase to 10 700 MW by 2021. Hydroelectric capacity would reach 9 300 MW by 2025.
In April 2015, the Ontario government announced plans to introduce a cap and trade program by becoming part of the carbon trading market with Quebec and California. This was followed by the Climate Change Mitigation and Low-carbon Economy Act 2016 which sets targets for the reduction of GHGs and establishes the framework for Ontario’s cap and trade program.
This map shows the location and approximate capacity of renewable power plants with a capacity of at least 10 MW across Ontario. Hydroelectric plants are concentrated in the Niagara region and along the Quebec border. The majority of wind and solar resources are located near the south and east coasts of lakes Ontario, Erie and Huron, while biomass resources are concentrated in the north.
20 Energy Market Analysis – October 2016
Installed renewable capacity reached 43 719 MW in 2015 compared to 36 959 MW in 2005. Wind capacity changed the most, increasing from 207 to 3 262 MW.
Hydro-Québec, a Crown corporation, generates, transmits, and distributes most of the electricity in the province. The utility is Canada’s largest electricity producer and is among the world’s largest hydro power producers. Several thermal and hydro power plants, as well as all the existing wind farms in the province are owned and operated by independent power producers.
Hydro-Québec has added over 3 000 MW of hydro capacity since 2005 from reservoir and run-of-river facilities. Major additions include two hydroelectric facilities on the Eastmain river in northern Quebec (1 248 MW) and two units at the La Romaine complex on the Côte-Nord. Two more units at La Romaine (640 MW) are currently under construction.
Most wind projects in the province were built as a result of four RFPs conducted between 2003 and 2013. In December 2015, the government established a partnership with Hydro-Québec and the Innu nation to build a 200 MW wind project. With that initiative, the total capacity of wind projects operating, under construction, or under development approaches the 4 000 MW target set in the Energy Strategy for 2006 to 2015.
In 2012, Quebec committed to reducing GHG emissions 20% below 1990 levels by 2020. The total reduction of GHG emissions achieved through implementation of this 2013-2020 Climate Change Action Plan amounted to 3 million tonnes of CO2 equivalent in 2013-2014.
In 2016, Quebec unveiled, The 2030 Energy Policy – Energy in Quebec: A Source of Growth. The new policy sets targets to promote energy efficiency, increase the use of renewable resources and lower consumption of fossil fuels by 2030, reducing GHG emissions by 16 million tonnes of CO2 equivalent.
The policy confirms the government’s support for renewable power sources. Small hydroelectric projects are expected to serve as sources of economic development for local and indigenous communities. Residual forest biomass can
be used as fuel in cogeneration power plants or turned into biogas to generate renewable electricity in remote communities. Similarly, wind could be used as an alternate solution to fossil energies in northern Quebec. However, the continued development of wind energy is desirable only to the extent that the impact on consumers is limited and to the extent that any additional supply of energy is required in order to meet any fluctuations in Quebec’s annual electricity needs.
Only 0.8% of Quebec’s GHG emissions are from electricity generation. These emissions are mainly from 24 diesel-fired power plants, which supply off-the-grid power systems such as in Îles-de-la-Madeleine and northern communities.
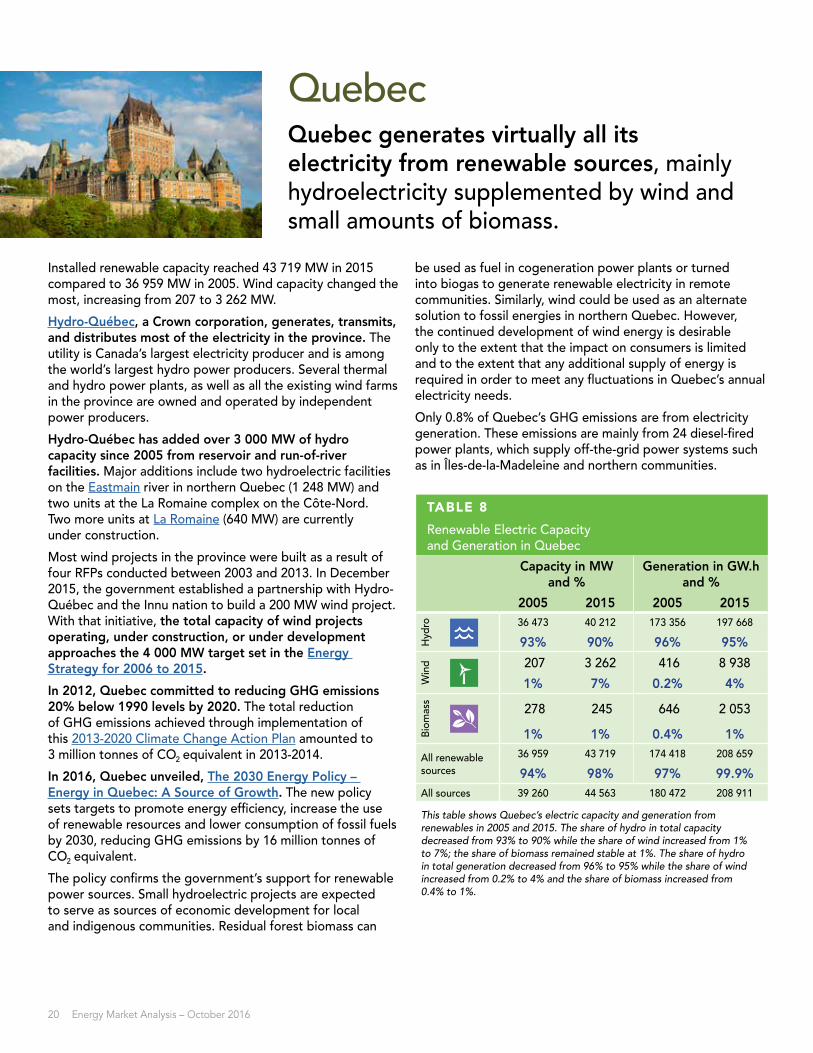
QuebecQuebec generates virtually all its electricity from renewable sources, mainly hydroelectricity supplemented by wind and small amounts of biomass.
TABLE 8
Renewable Electric Capacity and Generation in Quebec
Capacity in MW and %
Generation in GW.h and %
2005 2015 2005 2015
Hyd
ro 36 473 40 212 173 356 197 668
93% 90% 96% 95%
Win
d 207 3 262 416 8 938
1% 7% 0.2% 4%
Biom
ass
278 245 646 2 053
1% 1% 0.4% 1%
All renewable sources
36 959 43 719 174 418 208 659
94% 98% 97% 99.9%All sources 39 260 44 563 180 472 208 911
This table shows Quebec’s electric capacity and generation from renewables in 2005 and 2015. The share of hydro in total capacity decreased from 93% to 90% while the share of wind increased from 1% to 7%; the share of biomass remained stable at 1%. The share of hydro in total generation decreased from 96% to 95% while the share of wind increased from 0.2% to 4% and the share of biomass increased from 0.4% to 1%.

Canada’s Renewable Power Landscape 21
Québec 0 500250 km
QC
Map produced by the NEB, September, 2016
Renewable Capacity (MW)
50-99100-199200-499500-999
1000 >
10-49
ResourceHydroelectricWindBiomass
0
10 000
20 000
30 000
40 000
50 000
2005 2015
Non-hydro renewables
HydroNuclearNatural gas and oil
MW
FIGURE 16
Electric Generation Capacity in Quebec
This bar graph shows Quebec’s total electric capacity in 2005 and 2015 for all fuel sources. Capacity increased from 39 260 MW to 44 563 MW, with renewables increasing from 94% to 98% of total capacity.
FIGURE 15
Renewable Resources and Capacity in Quebec
Québec 0 500250 km
QC
Map produced by the NEB, September, 2016
Renewable Capacity (MW)
50-99100-199200-499500-999
1000 >
10-49
ResourceHydroelectricWindBiomass
This map shows the location and approximate capacity of renewable power plants with a capacity of at least 10 MW across Quebec.
Hydroelectric plants are most common, with the majority of capacity located on the north
shore of the St. Lawrence river and in the north. The majority of wind resources are located south
of the St. Lawrence River, while biomass resources are scattered across the province. There are no
solar resources with a capacity of at least 10 MW.

22 Energy Market Analysis – October 2016
The New Brunswick Power Corporation (NB Power), a vertically-integrated Crown corporation, owns about 3 500 MW or 80% of provincial generating capacity. Independent power producers and utilities supply the remaining power, roughly half of which is renewable.
In the last decade, wind registered the strongest growth among renewable sources. There was no wind installed in New Brunswick in 2005. However, after NB Power issued several RFPs, almost 300 MW of wind was installed between 2008 and 2011. In contrast, hydro and biomass capacity remained relatively unchanged. Nuclear, coal, oil and gas-fired generation account for roughly 70% of the province’s capacity.
New Brunswick plans to meet 40% of provincial electricity demand with renewables by 2020. According to the 2011 New Brunswick Energy Blueprint and 2014 Integrated Resource Plan, this goal will be accomplished through a combination of eligible renewable energy imports from other provinces, and by purchased power from local producers and customers through a variety of programs. In 2015, regulations under the Electricity Act were amended to support the 40% renewable portfolio standard.
Under a net-metering program, NB Power customers generating electricity for individual use from renewable installations of less than 100 kW can send surplus electricity into the grid. The NB Power Embedded Generation Program allows small-scale renewable energy projects to be connected to the distribution system and sell electricity to the grid.
In January 2016, NB Power issued a call offering to purchase up to 40 MW of electricity from First Nations.
New BrunswickIn New Brunswick, renewables account for 31% of capacity. Hydro, wind and biomass capacity grew by 28% between 2005 and 2015, and renewables’ share of generation increased from 21% to 28%.
TABLE 9
Renewable Electric Capacity and Generation in New Brunswick
Capacity in MW and %
Generation in GW.h and %
2005 2015 2005 2015H
ydro 949 957 3 875 2 728
22% 21% 18% 19%
Win
d 0 294 0 737
0% 7% 0% 5%
Biom
ass
127 127 653 606
3% 3% 3% 4%
All renewable sources
1 076 1 378 4 528 4 070
25% 31% 21% 28%All sources 4 231 4 505 21 333 14 378
This table shows New Brunswick’s electric capacity and generation from renewables in 2005 and 2015. The share of hydro in total capacity decreased from 22% to 21% while the share of wind increased from 0% to 7% and the share of biomass remained stable at 3%. The share of hydro in total generation increased from 18% to 19% while the share of wind increased from 0% to 5% and the share of biomass increased from 3% to 4%.

Canada’s Renewable Power Landscape 23
Fredericton
NB
0 10050 km
Map produced by the NEB, September, 2016
Renewable Capacity (MW)
50-99100-199200-499500-999
10-49
Resource
WindBiomass
Hydroelectric
0
1 000
2 000
3 000
4 000
5 000
2005 2015
Non-hydro renewables
Hydro
Natural gas
Coal
Nuclear
Oil
MW
FIGURE 18
Electric Generation Capacity in New Brunswick
This bar graph shows New Brunswick’s total electric capacity in 2005 and 2015 for all fuel sources. Capacity increased from 4 231 MW to 4 505 MW, with renewables increasing from 25% to 31% of total capacity.
FIGURE 17
Renewable Resources and Capacity in New Brunswick
Fredericton
NB
0 10050 km
Map produced by the NEB, September, 2016
Renewable Capacity (MW)
50-99100-199200-499500-999
10-49
Resource
WindBiomass
Hydroelectric
This map shows the location and approximate capacity of renewable power plants with a capacity of at least 10 MW across New Brunswick. Renewable power plants are concentrated near the coasts and rivers. Majority of hydroelectric resources are located west, while wind resources are located east and biomass resources are scattered throughout the province. There are no solar resources with a capacity of at least 10 MW.

24 Energy Market Analysis – October 2016
Nova Scotia generates the highest percentage of electricity from wind in Canada, after PEI.
Nova Scotia Power, an investor-owned utility, controls most of the generation assets in the province. Independent power producers own the majority of the wind and biomass facilities.
Nova Scotia has an increasingly diverse electricity supply mix including coal, oil, natural gas, and renewables. In 2005 generation from fossil fuels, mostly coal, accounted for over 80% of the total. In 2015 this declined to about 70%.
In 2010 Nova Scotia adopted a Renewable Electricity Standard designed to increase generation of electricity from renewable resources. This legislated standard requires 25% of the province’s electricity to come from renewable sources by 2015 and increase to 40% by 2020. To support these targets the province introduced programs such as Enhanced Net Metering, Community Feed-in Tariffs, Developmental Tidal Feed-in Tariff, a Commercial Renewables Program, and other initiatives.
Nova Scotia is home to the only tidal power plant in North America, and one of few in the world. The Annapolis Tidal station, built in 1984, has a 20 MW generating capacity.
Nova Scotia is looking to develop its vast tidal energy resource. In 2012 the province introduced the Marine Renewable Energy Strategy which targeted 300 MW of power from in-stream tidal energy projects. To meet this goal, the Marine Renewable Energy Act was introduced in 2015.
In 2015, the province introduced the Developmental Tidal Feed-in Tariff program which is specific to in-stream tidal projects (0.5 MW or higher). A number of independent producers have expressed interest in this program and so far there are five proposed projects with a combined capacity of 22 MW.
Nova ScotiaIn 2015, Nova Scotia generated 2 659 GW.h of electricity from renewable sources, mainly wind and hydro. In the past ten years, the share of generation from renewables increased from 12% to 24%.
TABLE 10
Renewable Electric Capacity and Generation in Nova Scotia
Capacity in MW and %
Generation in GW.h and %
2005 2015 2005 2015
Hyd
ro 404 376 1 075 1 003
16% 13% 9% 9%
Win
d 35 444 85 1 015
1% 15% 1% 9%
Biom
ass
69 113 318 641
3% 4% 3% 6%
All renewable sources
507 933 1 479 2 659
21% 32% 12% 24%All sources 2 447 2 925 12 540 11 028
This table shows Nova Scotia’s electric capacity and generation from renewables in 2005 and 2015. The share of hydro in total capacity decreased from 16% to 13% while the share of wind increased from 1% to 15% and the share of biomass from 3% to 4%. The share of hydro in total generation remained stable at 9% while the share of wind increased from 1% to 9% and the share of biomass increased from 3% to 6%.

Canada’s Renewable Power Landscape 25
Halifax0 10050 km
NS
Map produced by the NEB, September, 2016
Renewable Capacity (MW)
50-99100-199200-499
10-49
Resource
HydroelectricWindBiomass
0
1 000
2 000
3 000
4 000
2005 2015
Non-hydro renewables
Hydro and tidal
Natural gas
Coal
Oil
MW
FIGURE 20
Electric Generation Capacity in Nova Scotia
This bar graph shows Nova Scotia’s total electric capacity in 2005 and 2015 for all fuel sources. Capacity increased from 2 447 MW to 2 925 MW, with renewables increasing from 21% to 32% of total capacity.
FIGURE 19
Renewable Resources and Capacity in Nova Scotia
Halifax0 10050 km
NS
Map produced by the NEB, September, 2016
Renewable Capacity (MW)
50-99100-199200-499
10-49
Resource
HydroelectricWindBiomass
This map shows the location and approximate capacity of renewable
power plants with a capacity of at least 10 MW across Nova Scotia. Resources
are spread throughout the province. The largest hydro plant is located in the northeast while the largest windfarm is
located in the centre of the province. There are no solar resources with a
capacity of at least 10 MW.
26 Energy Market Analysis – October 2016
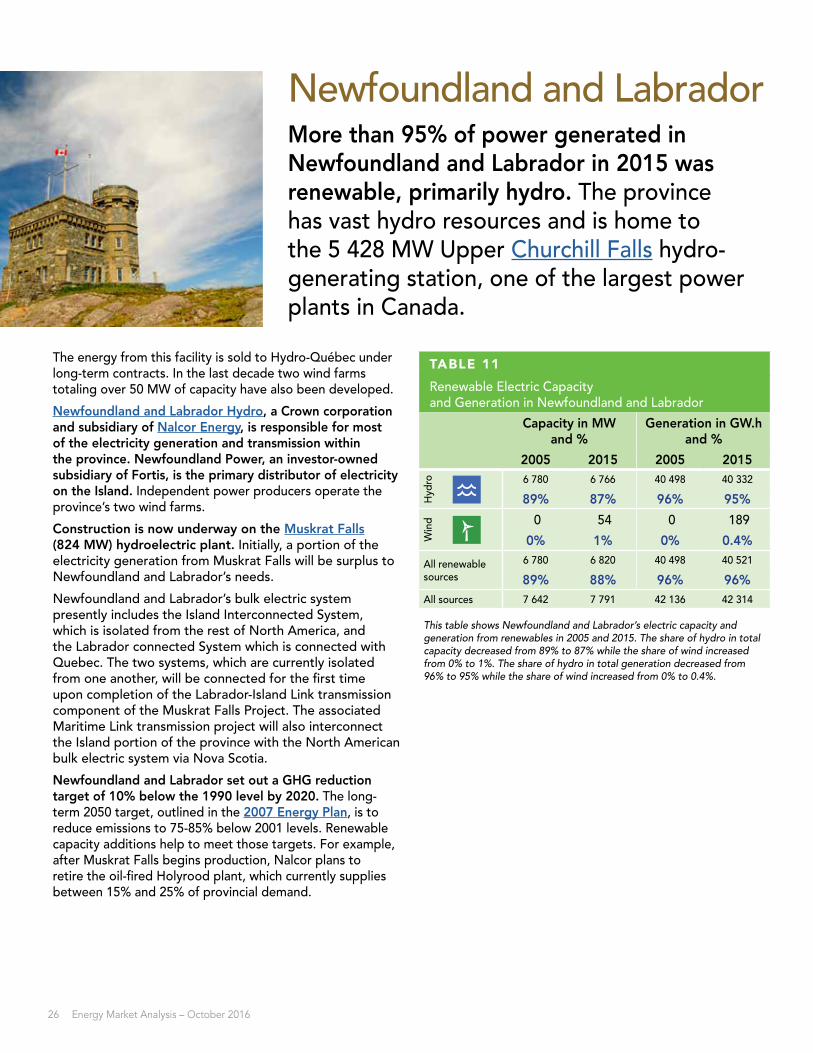
The energy from this facility is sold to Hydro-Québec under long-term contracts. In the last decade two wind farms totaling over 50 MW of capacity have also been developed.
Newfoundland and Labrador Hydro, a Crown corporation and subsidiary of Nalcor Energy, is responsible for most of the electricity generation and transmission within the province. Newfoundland Power, an investor-owned subsidiary of Fortis, is the primary distributor of electricity on the Island. Independent power producers operate the province’s two wind farms.
Construction is now underway on the Muskrat Falls (824 MW) hydroelectric plant. Initially, a portion of the electricity generation from Muskrat Falls will be surplus to Newfoundland and Labrador’s needs.
Newfoundland and Labrador’s bulk electric system presently includes the Island Interconnected System, which is isolated from the rest of North America, and the Labrador connected System which is connected with Quebec. The two systems, which are currently isolated from one another, will be connected for the first time upon completion of the Labrador-Island Link transmission component of the Muskrat Falls Project. The associated Maritime Link transmission project will also interconnect the Island portion of the province with the North American bulk electric system via Nova Scotia.
Newfoundland and Labrador set out a GHG reduction target of 10% below the 1990 level by 2020. The long-term 2050 target, outlined in the 2007 Energy Plan, is to reduce emissions to 75-85% below 2001 levels. Renewable capacity additions help to meet those targets. For example, after Muskrat Falls begins production, Nalcor plans to retire the oil-fired Holyrood plant, which currently supplies between 15% and 25% of provincial demand.
Newfoundland and LabradorMore than 95% of power generated in Newfoundland and Labrador in 2015 was renewable, primarily hydro. The province has vast hydro resources and is home to the 5 428 MW Upper Churchill Falls hydro-generating station, one of the largest power plants in Canada.
TABLE 11
Renewable Electric Capacity and Generation in Newfoundland and Labrador
Capacity in MW and %
Generation in GW.h and %
2005 2015 2005 2015
Hyd
ro 6 780 6 766 40 498 40 332
89% 87% 96% 95%
Win
d 0 54 0 189
0% 1% 0% 0.4%
All renewable sources
6 780 6 820 40 498 40 521
89% 88% 96% 96%All sources 7 642 7 791 42 136 42 314
This table shows Newfoundland and Labrador’s electric capacity and generation from renewables in 2005 and 2015. The share of hydro in total capacity decreased from 89% to 87% while the share of wind increased from 0% to 1%. The share of hydro in total generation decreased from 96% to 95% while the share of wind increased from 0% to 0.4%.
Canada’s Renewable Power Landscape 27
St. John's
0 400200 km
NL
Map produced by the NEB, September, 2016
Renewable Capacity (MW)
50-99100-199200-499
500-999
1000 >
10-49
ResourceHydroelectricWind
02 0004 0006 0008 000
10 000
2005 2015
Non-hydro renewablesHydroOilNatural gas
MW
FIGURE 22
Electric Generation Capacity in Newfoundland and Labrador
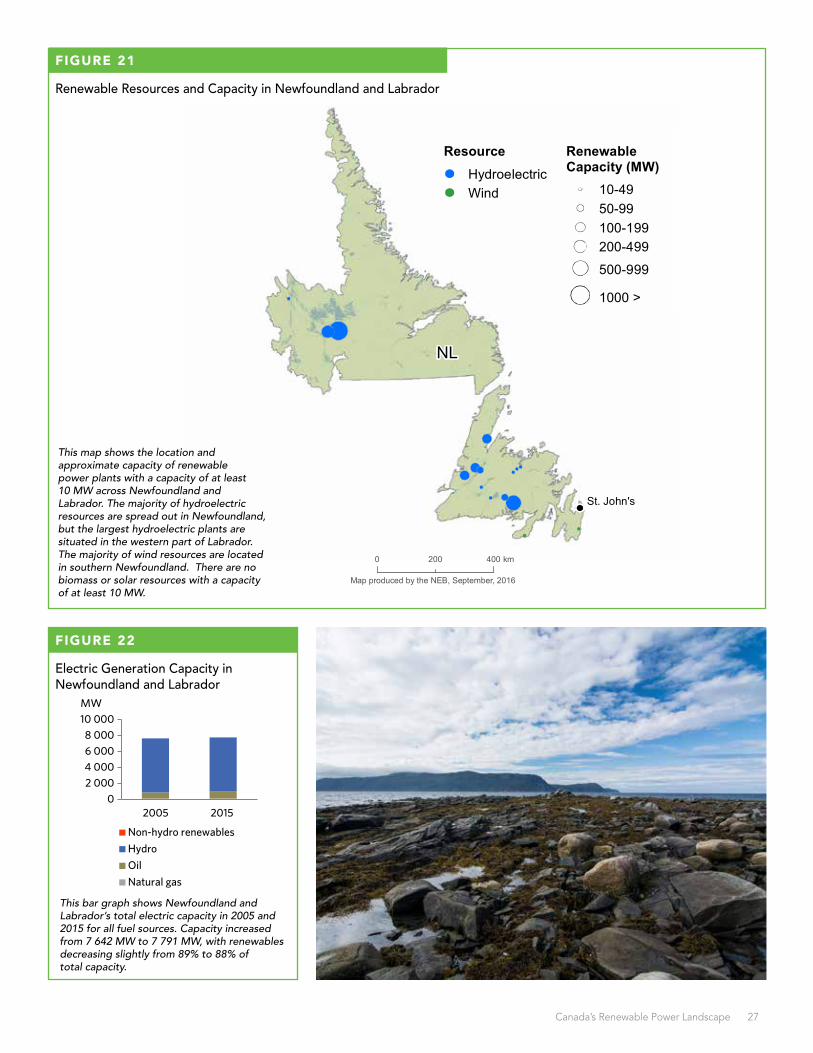
This bar graph shows Newfoundland and Labrador’s total electric capacity in 2005 and 2015 for all fuel sources. Capacity increased from 7 642 MW to 7 791 MW, with renewables decreasing slightly from 89% to 88% of total capacity.
FIGURE 21
Renewable Resources and Capacity in Newfoundland and Labrador
St. John's
0 400200 km
NL
Map produced by the NEB, September, 2016
Renewable Capacity (MW)
50-99100-199200-499
500-999
1000 >
10-49
ResourceHydroelectricWind
This map shows the location and approximate capacity of renewable power plants with a capacity of at least 10 MW across Newfoundland and Labrador. The majority of hydroelectric resources are spread out in Newfoundland, but the largest hydroelectric plants are situated in the western part of Labrador. The majority of wind resources are located in southern Newfoundland. There are no biomass or solar resources with a capacity of at least 10 MW.

28 Energy Market Analysis – October 2016
Over the last decade, the share of generation from renewables grew from 86% to 99%, with wind farms supplying almost all the electricity generated (596 GW.h) in 2015.
However, PEI uses a lot of electricity from other provinces to meet its needs. In 2015, almost 75% of electricity used in PEI was supplied via subsea cables from New Brunswick. The high share for renewables in PEI reflects the share attributable to power generation, and not power consumption.
Almost half of PEI’s installed capacity consists of diesel and oil-fired facilities. These thermal-fired generators are typically used as “peakers” or for emergency back-up when demand is high and off-Island supply is interrupted, or island wind production is intermittent.
Maritime Electric Company Ltd. owns and operates most thermal generation on the island. The balance of the thermal generation is owned by the municipal utility in the city of Summerside. Eight wind farms are owned by a small number of independent companies, including a municipal utility, an Independent Power Producer, and a Crown corporation.
To encourage wind development, PEI passed the Renewable Energy Act (REA) in 2005. REA required utilities to source a minimum of 15% of electrical energy from renewable energy sources by 2010. 15% was achieved by 2010, and by 2014 there was 203 MW of wind generation installed on PEI. The REA also provided a net metering program for small capacity renewable generators (100 kW or less).
In mid-2015, the REA was amended to eliminate the requirement that utilities source a percentage of their sales through renewables. Energy and the corresponding renewable energy credits can be sold outside the province.
Prince Edward IslandElectricity generation on PEI came almost entirely from renewables in 2015, reflecting PEI’s exceptional wind resource and a small amount of biomass. Renewable capacity on PEI increased from about 14 MW in 2005 to over 200 MW in 2015.
TABLE 12
Renewable Electric Capacity and Generation in PEI
Capacity in MW and %
Generation in GW.h and %
2005 2015 2005 2015
Win
d 13 203 40 587
8% 56% 86% 98%
Biom
ass
1 1 0 4
1% 0.3% 0% 1%
All renewable sources
14 204 40 591
8% 56% 86% 99%All sources 173 363 46 596
This table shows PEI’s electric capacity and generation from renewables in 2005 and 2015. The share of wind in total capacity increased from 8% to 56% while the share of biomass decreased from 1% to 0.3%. The share of wind in total generation increased from 86% to 98% while the share of biomass increased from 0% to 1%.
Canada’s Renewable Power Landscape 29
Charlottetown
0 4020 km
PE
Map produced by the NEB, September, 2016
ResourceWind
Renewable Capacity (MW)
50-9910-49
0
100
200
300
400
2005 2015
Oil Non-hydro renewables
MW
FIGURE 24
Electric Generation Capacity in PEI
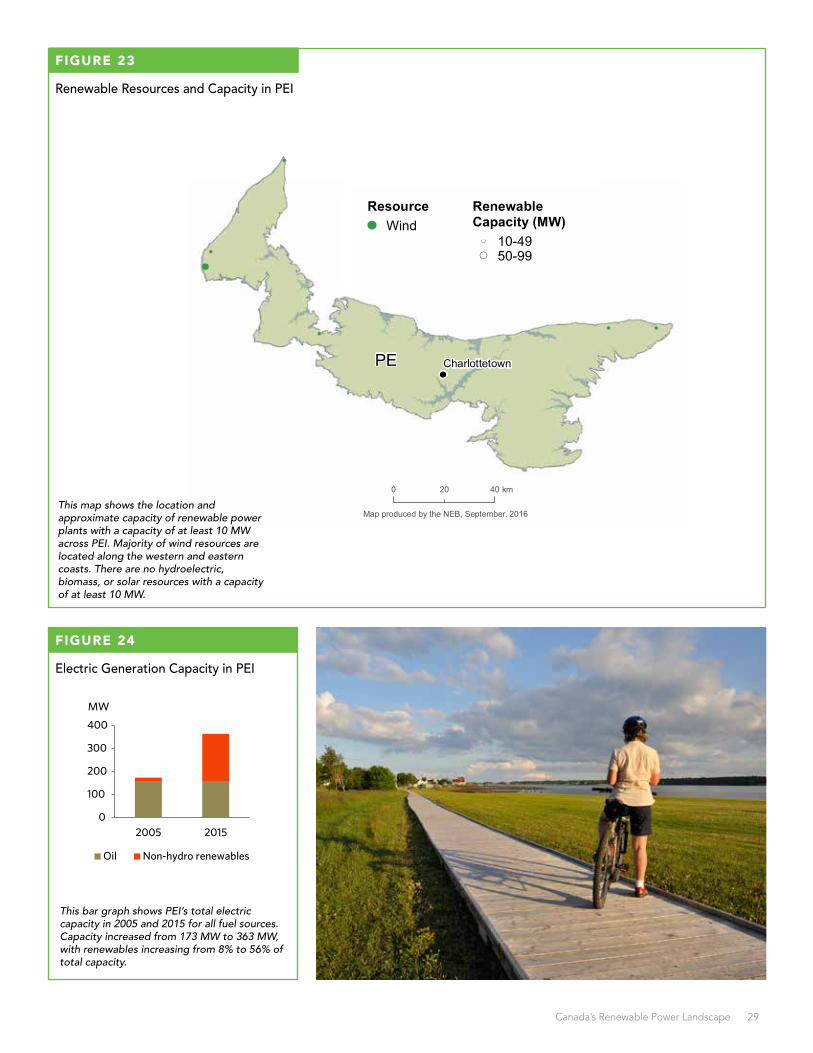
This bar graph shows PEI’s total electric capacity in 2005 and 2015 for all fuel sources. Capacity increased from 173 MW to 363 MW, with renewables increasing from 8% to 56% of total capacity.
FIGURE 23
Renewable Resources and Capacity in PEI
Charlottetown
0 4020 km
PE
Map produced by the NEB, September, 2016
ResourceWind
Renewable Capacity (MW)
50-9910-49
This map shows the location and approximate capacity of renewable power plants with a capacity of at least 10 MW across PEI. Majority of wind resources are located along the western and eastern coasts. There are no hydroelectric, biomass, or solar resources with a capacity of at least 10 MW.
30 Energy Market Analysis – October 2016
While Yukon generates the majority of its electricity from hydro, diesel and LNG are required to meet peak demand.
Two regulated Yukon utilities generate and distribute electricity. Yukon Energy Corporation owned by the territory generates most of the power and owns and operates most of the territory’s transmission infrastructure. ATCO Electric Yukon is a privately owned distributor, which also generates power.
Yukon’s government announced plans in 2009 to increase renewable energy by 20% by 2020. Since then, it has implemented a biomass energy strategy for district and home heating, adopted an Independent Power Production policy, and introduced a micro-generation program which allows individuals to produce and sell electricity to the grid.
Increasing renewable capacity on a larger scale requires infrastructure investments, and the Yukon government plans to upgrade key transmission lines in 2017 if it has sufficient funding.
YukonIn 2015, Yukon generated 94% of its electricity from renewables, almost exclusively from hydro. Although a 5 to 10 MW windfarm site was selected in late 2014, Yukon has less than 1 MW wind capacity.
TABLE 13
Renewable Electric Capacity and Generation in Yukon
Capacity in MW and %
Generation in GW.h and %
2005 2015 2005 2015H
ydro 77 95 320 422
70% 76% 93% 94%
All renewable sources
77 95 320 422
70% 77% 93% 94%All sources 110 124 343 448
This table shows Yukon’s electric capacity and generation from renewables in 2005 and 2015. The share of hydro in total capacity increased from 70% to 76% while its share in total generation increased from 93% to 94%.

Canada’s Renewable Power Landscape 31
Whitehorse
0 200100 km
YT
Renewable Capacity (MW)
1-45-910-50
Resource
Map produced by the NEB, July 2016
Hydroelectric
0
50
100
150
2005 2015Non-hydro renewablesHydroNatural gasOil
MW
FIGURE 26
Electric Generation Capacity in Yukon
This bar graph shows Yukon’s total electric capacity in 2005 and 2015 for all fuel sources. Capacity increased from 110 MW to 124 MW, with renewables increasing from 70% to 77% of total capacity.
FIGURE 25
Renewable Resources and Capacity in Yukon
Whitehorse
0 200100 km
YT
Renewable Capacity (MW)
1-45-910-50
Resource
Map produced by the NEB, July 2016
Hydroelectric
This map shows the location and approximate capacity of renewable power plants with a capacity of at least 1 MW across Yukon. There are three hydroelectric plants in south and central Yukon. There are no wind, biomass or solar resources with a capacity of at least 1 MW.

32 Energy Market Analysis – October 2016
While NWT has additional hydro potential, it is dependent on fossil fuels for the majority of its electricity. Most industrial sites in NWT require diesel generation because they are not connected to a grid.
The government-owned Northwest Territories Power Corporation generates and distributes electricity to the territory’s isolated communities. A subsidiary of ATCO Electric and Denendeh Investments, Northland Utilities Ltd. also distributes to many NWT communities.
In 2008, NWT introduced the Energy Priorities Framework to help reduce reliance on fossil fuels. This was followed by the Northwest Territories Energy Action Plan in 2013 to increase electricity from renewable sources such as hydro, solar, wind, geothermal and biomass.
As part of the NWT’s focus on sustainability, it plans to transition from diesel by expanding biomass use. There are also several small scale solar installations, and the NWT government offers installation incentives for renewables to businesses and homeowners. The NWT is also currently conducting wind feasibility studies for turbines in the Beaufort Delta.
Since 2013, the town of Inuvik has used LNG to power one of its power plants. Compared to diesel, LNG reduces GHG emissions by about 25%, and there are plans to use it in other NWT communities.
Northwest TerritoriesNWT generated more than one third of its electricity from renewable sources in 2015. 35% of generation comes from hydro and 3% comes from wind.
TABLE 14
Renewable Electric Capacity and Generation in NWT
Capacity in MW and %
Generation in GW.h and %
2005 2015 2005 2015
Hyd
ro 65 56 259 253
30% 30% 37% 35%W
ind 0 9 0 21
0% 5% 0% 3%
All renewable sources
65 65 259 274
30% 35% 37% 38%All sources 214 186 693 718
This table shows NWT’s electric capacity and generation from renewables in 2005 and 2015. The share of hydro in total capacity remained stable at 30% while the share of wind increased from 0% to 5%. The share of hydro in total generation decreased from 37% to 35% while the share of wind increased from 0% to 3%.
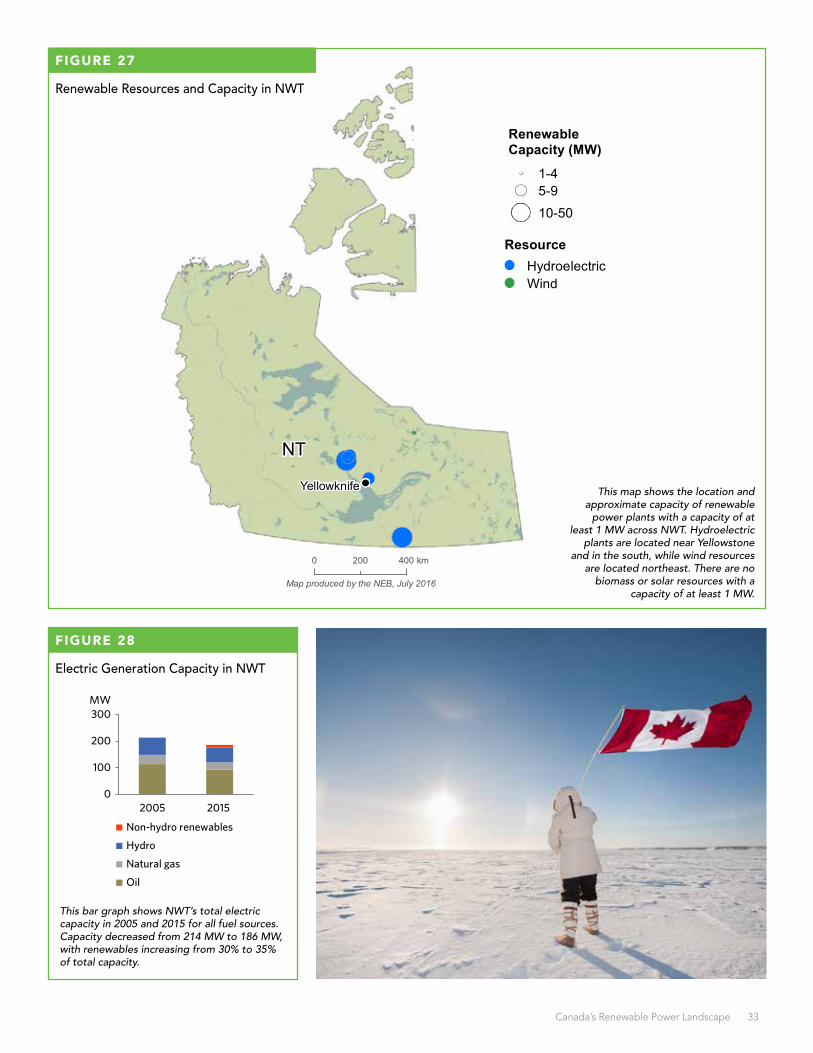
Canada’s Renewable Power Landscape 33
Yellowknife
0 400200 km
NT
Resource
Wind
Renewable Capacity (MW)
1-45-910-50
Map produced by the NEB, July 2016
Hydroelectric
0
100
200
300
2005 2015
Non-hydro renewables
Hydro
Natural gas
Oil
MW
FIGURE 28
Electric Generation Capacity in NWT
This bar graph shows NWT’s total electric capacity in 2005 and 2015 for all fuel sources. Capacity decreased from 214 MW to 186 MW, with renewables increasing from 30% to 35% of total capacity.
FIGURE 27
Renewable Resources and Capacity in NWT
Yellowknife
0 400200 km
NT
Resource
Wind
Renewable Capacity (MW)
1-45-910-50
Map produced by the NEB, July 2016
Hydroelectric
This map shows the location and approximate capacity of renewable
power plants with a capacity of at least 1 MW across NWT. Hydroelectric
plants are located near Yellowstone and in the south, while wind resources
are located northeast. There are no biomass or solar resources with a
capacity of at least 1 MW.

34 Energy Market Analysis – October 2016
Plans to replace some diesel generation with LNG and, to a limited extent, biomass, are in the initial stages. A transmission power line from Manitoba has also been proposed. The line would transport electricity generated from Manitoba Hydro plants to the Kivalliq region in southern Nunavut.
The Qulliq Energy Corporation (QEC), owned by the Nunavut government, is responsible for the generation, transmission and distribution of electricity in Nunavut. QEC operates 26 diesel plants in 25 communities which are not connected by roads or power lines.
In 2007, Nunavut released its Ikummatiit Energy Strategy, with the goal of reducing dependence on fossil fuels through energy conservation and increased use of renewables.
Nunavut also considered an Independent Power Purchase Policy to allow private individuals to generate renewable energy and sell it back to the QEC.
Although Nunavut currently has no wind generation, it has piloted three wind projects since 1994. Developing and maintaining the required infrastructure is difficult due to the QEC’s inability to recover the costs from Nunavut’s small communities. Similarly, plans for an Iqaluit hydroelectric facility were delayed in 2013.
NunavutVirtually all Nunavut’s electricity is generated from diesel. A 3 kW PV system is currently installed and other small PV system additions are planned, but this represents a small portion of total capacity.

Canada’s Renewable Power Landscape 35
Iqaluit
NU
0 500250 km
Map produced by the NEB, September 2016
Renewable Capacity (MW)Currently, there are no renewable power plants with a capacity larger than 1 MW in Nunavut
0
20
40
60
2005 2015
Oil
MW
FIGURE 30
Electric Generation Capacity in Nunavut
This bar graph shows Nunavut’s total electric capacity in 2005 and 2015 for all fuel sources. Capacity remained stable at 54 MW, with oil accounting for close to 100% of total capacity in both years.
FIGURE 29
Renewable Resources and Capacity in Nunavut
This map shows the location and approximate capacity of renewable power plants with a capacity of at least 1 MW across Nunavut. Currently, there are no renewable power plants with a capacity larger than 1 MW in Nunavut.
36 Energy Market Analysis – October 2016
As a result, many remote communities in the northern territories and the northern parts of most provinces rely on fossil fuels transported by truck, ocean-going tanker or barge for power generation.
Several feasibility studies and pilot projects in the past decades have explored the potential for wind turbines in northern regions. However, wind is a higher-cost option than diesel due to initial construction and transmission costs. Wind is also intermittent and requires reliable generation as back up.
Solar power faces the same challenges with cost and intermittency. Sunlight in northern regions is limited during the coldest parts of the year, which also makes it less attractive.
Hydroelectricity faces major challenges in the North, including high capital costs and required transmission lines. The majority of Yukon’s electricity is hydraulically generated, but high costs limit hydro generation in NWT and Nunavut, where populations are more scattered and the necessary distribution networks do not exist.
How can individuals support greater use of renewables?These are some things individuals can do to encourage the use of renewable energy:
• Ask your local utility if you can purchase green power, for example, wind power at a premium.
• Look into the possibility of installing rooftop solar panels on your school, home, or business.
• Support green energy programs and initiatives at the community, municipal, provincial or federal level.
• Support businesses that use green energy.
• Donate to a renewable energy charity.
• Purchase carbon offsets or green energy credits for yourself and your family. For more ideas, please visit: Top 10 Things You Can Do To Help
Power in Canada’s Northern RegionsCanada’s vast and sparsely populated northern regions are not connected to integrated electricity grids and natural gas pipelines like the rest of North America, and there is little commercial incentive to build these connections because communities are small and widely dispersed.

Canada’s Renewable Power Landscape 37
Continued renewable growth in Canada is facing challenges. Canadian electricity prices are among the lowest in the world, and although costs decreased for solar and wind power due to technological advances and large-scale production, it is still difficult for these relatively expensive renewable sources to compete for market share in many areas.
Projects can face public criticism and approval delays. Obtaining approval to build new projects can be difficult and sometimes projects face staunch opposition from local landowners. Citizens may also be concerned about effects such as bird and bat strikes for wind turbines, flooding or river impacts for dams, and impact on wildlife habitat from large solar projects.
Renewables add operating complexities to power grids. Solar and wind power are intermittent resources that generate power only when the sun shines and the wind blows.
To keep an electricity grid operating reliably, supply must match demand every second. This means solar and wind require back-up sources which reduce the appeal and cost-competitiveness of renewables.
Canadian energy demand is generally flat. Growth in renewables generally occurs as replacements for existing generation rather than in response to new demand. This occurred to an extent over the last decade as coal-fired generation was mandatorily phased out and replaced with renewables in Ontario.
Data issuesData in this report was derived from:
• Statistics Canada
• Open Government (a portal that provides access to the Government of Canada’s searchable open data and open information)
• Provincial agencies
• Provincial utilities and system operators
Ontario is the only province with significant solar capacity. Total capacity of utility interconnected PV systems in other provinces and territories adds up to less than 2% of the Canadian total (see Photovoltaic Technology Status and Prospects Canadian Annual Report 2015 for detailed numbers) and generation data is not available. As a result, only Ontario’s solar capacity and generation data is included in the report. Small PV capacity figures for other provinces and territories are not listed but are included in capacity totals.
Accurate and detailed data on renewables is difficult to obtain. When values are small, the data might be aggregated for ease of reporting or omitted from reports for confidentiality. For example, when only one or two biomass facilities or wind facilities operate in an area, the generation data is not published.
The NEB used the best available data for this report, but it is likely that some data is absent. When necessary, estimates or older data was used.
For data questions or suggestions, please email [email protected]
The Renewables Challenge