can you measure social cohesion in south africa? - oecd a.pdf · can you measure social cohesion in...
TRANSCRIPT

Can you measure social cohesion in South Africa?
And can you fix what you don’t measure?
Alan Hirsch
The Presidency, South Africa and
University of Cape Town
1

Findings of the OECD Development Centre Global Development Report -
• Social cohesion is made up of social inclusion, social capital and social mobility
• Social cohesion supports economic growth • Key areas of policy to support cohesion are:
– Fiscal and tax design – Employment – Social protection – Civic participation – Education – Gender and – Migration
2
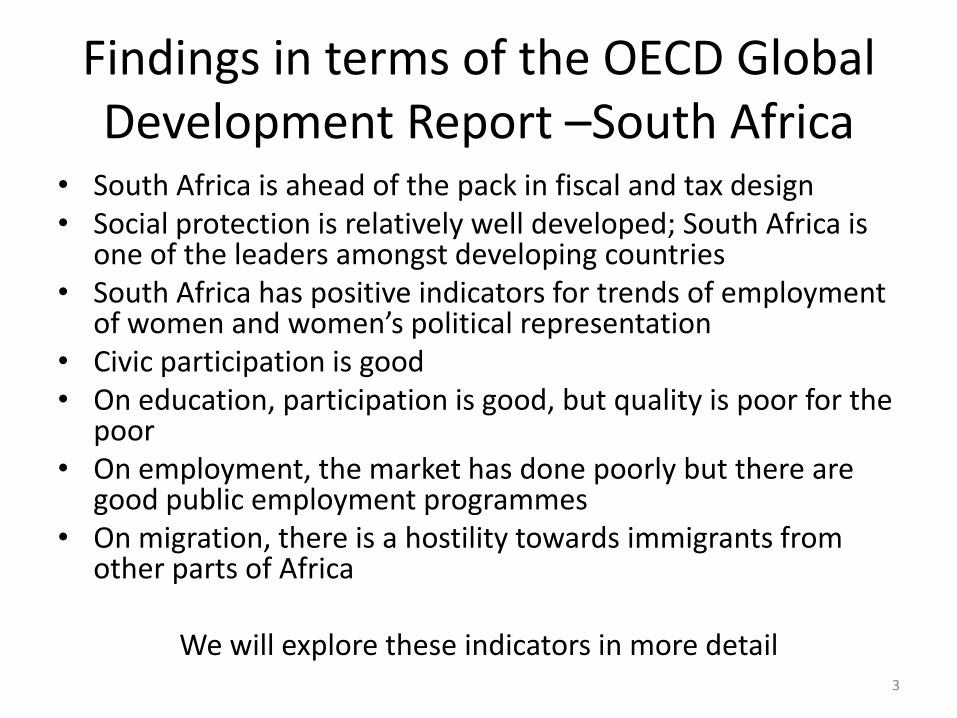
Findings in terms of the OECD Global Development Report –South Africa
• South Africa is ahead of the pack in fiscal and tax design • Social protection is relatively well developed; South Africa is
one of the leaders amongst developing countries • South Africa has positive indicators for trends of employment
of women and women’s political representation • Civic participation is good • On education, participation is good, but quality is poor for the
poor • On employment, the market has done poorly but there are
good public employment programmes • On migration, there is a hostility towards immigrants from
other parts of Africa
We will explore these indicators in more detail
3

Political participation Table Voter participation in national and provincial elections
1994 % 1999 % 2004 % 2009 %
Voting age population (VAP) 22 709 152 22 798 845 27 436 898 27 574 414
VAP registered no registration 18 172 751 79.7% 20 674 926 75.4% 23 181 997 84.1%
Turnout 19 533 498 16 228 462 15 863 558 17 919 966
% Turnout of VAP 86.0% 71.2% 57.8% 65.0%
% Turnout of registered VAP no registration 89.3% 76.7% 77.3%
Under 35 years
VAP under 35 11 768 544 14 162 663 13 923 366
VAP under 35 registered 8 667 832 73.7% 9 193 845 64.9% 9 253 537 66.5%
No turnout data
4

Mortality rate
48.0
50.0
52.0
54.0
56.0
58.0
60.0
2001 2002 2003 2004 2005 2006 2007 2008 2009 2010 2011
Years
LIFE EXPECTANCY
LE male StatsSA LE female StatsSA
LE combined StatsSA LE combined ASSA
5

Female representation
Table 1 Women members of Parliament and Provincial Legislatures
Female Total % Female Total % Female Total % Female Total %
Parliament 111 400 27.8% 120 400 30.0% 131 400 32.8% 173 400 43.3%
Provincial
Legislatures
Eastern Cape 13 56 23.2% 15 63 23.8% 21 63 33.3% 28 63 44.4%
Free State 7 30 23.3% 7 30 23.3% 8 30 26.7% 12 30 40.0%
Gauteng 25 86 29.1% 26 73 35.6% 31 73 42.5% 33 73 45.2%
Kw aZulu-Natal 11 81 13.6% 22 80 27.5% 21 80 26.3% 30 80 37.5%
Limpopo 11 40 27.5% 16 49 32.7% 16 49 32.7% 23 49 46.9%
Mpumalanga 6 30 20.0% 8 30 26.7% 9 30 30.0% 12 30 40.0%
North West 9 33 27.3% 9 33 27.3% 11 33 33.3% 14 33 42.4%
Northern Cape 7 30 23.3% 8 30 26.7% 9 30 30.0% 13 30 43.3%
Western Cape 10 42 23.8% 11 42 26.2% 13 42 31.0% 14 42 33.3%
Total 210 828 25.4% 242 830 29.2% 270 830 32.5% 352 830 42.4%
1994 1999 2004 2009
6

Social Assistance Support
Grant type 1999/00 2000/01 2001/02 2002/03 2003/04 2004/05 2005/06 2006/07 2007/08* 2008/09 2009/10 2010/11
Old Age Grant 1 848 726 1 900 406 1 903 042 1 943 348 2 050 572 2 124 984 2 146 344 2 195 018 2 229 550 2 390 543 2 546 657 2 678 554
War Veterans
Grant 7 908 5 617 5 336 4 638 3 996 2 963 2 817 2 340 1 924 1 500 1 216 958
Disability Grant 607 537 655 822 694 232 840 424 1 228 231 1 293 280 1 315 143 1 422 808 1 408 456 1 286 883 1 264 477 1 200 898
Foster Child
Grant 49 843 66 967 67 817 83 574 120 571 195 454 317 434 400 503 454 199 474 759 510 760 512 874
Child
Dependency
Grant 22 789 33 574 34 978 42 355 76 494 86 917 90 112 98 631 102 292 107 065 110 731 112 185
Child Support
Grant 150 366 1 111 612 1 277 396 1 998 936 2 996 723 4 165 545 7 075 266 7 863 841 8 189 975 8 765 354 9 570 287 10 371 950
Total 2 687 169 3 773 998 3 982 801 4 913 275 6 476 587 7 869 143 10 947 116 11 983 141 12 386 396 13 026 104 14 004 128 14 877 419
Growth Rate 5.8% 40.4% 5.5% 23.4% 31.8% 21.5% 39.1% 9.5% 3.4% 5.2% 7.5% 6%
Grant-in-aid 8 570 10 107 10 332 12 625 17 528 25 667 26 960 31 918 37 343 46 069 53 237 58 413
7
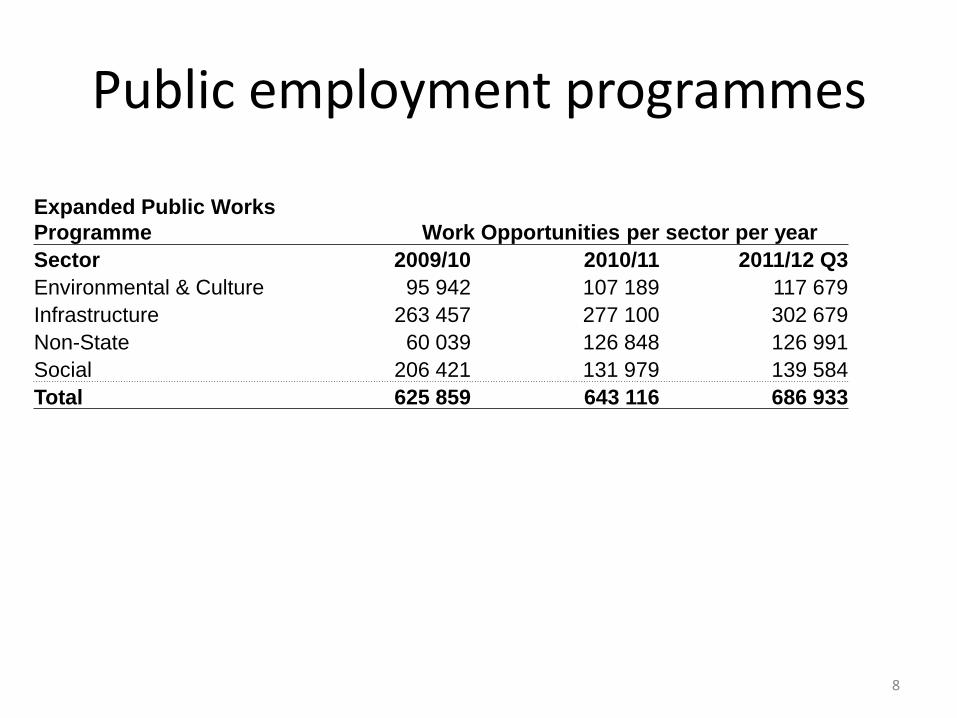
Public employment programmes
Expanded Public Works
Programme Work Opportunities per sector per year
Sector 2009/10 2010/11 2011/12 Q3
Environmental & Culture 95 942 107 189 117 679
Infrastructure 263 457 277 100 302 679
Non-State 60 039 126 848 126 991
Social 206 421 131 979 139 584
Total 625 859 643 116 686 933
8

Poverty levels
Percentage of population living
below R422 poverty line (in 2008
constant Rand)
1993 1994 1995 1996 1997 1998 1999 2000 2001 2002 2003 2004 2005 2006 2007 2008 2009
R422 a month
poverty line (AMPS) 50.1% 50.5% 51.7% 53.1% 51.2% 51.0% 52.1% 50.8% 51.4% 49.0% 47.6% 46.9% 44.5% 43.9% 38.2% 33.9% 34.5%
Percentage of population living below various poverty lines (in 2009 constant Rand from GHS)
2005 2009
Expenditure Poverty Line [R551.78 per person per month] 70% 65%
Income Poverty Line [R551.78 per person per month] 59% 46%
Expenditure Poverty Line [R298.17 per person per month] 54% 49%
Income Poverty Line [R298.17 per person per month] 40% 27%
Expenditure Poverty Line [R149.08 per person per month] 31% 25%
Income Poverty Line [R149.08 per person per month] 23% 12%
9

Gender parity at school
10
0.90
0.95
1.00
1.05
1.10
1.15
1.20
1997 1998 1999 2000 2001 2002 2003 2004 2005 2006 2007 2008 2009 2010
index
GENDER PARITY INDEX
Primary GPI Secondary GPI

Pre-School participation
5.0
15.0
25.0
35.0
45.0
55.0
65.0
2002 2003 2004 2005 2006 2007 2008 2009 2010
%
CHILDREN ATTENDING ECD FACILITIES
0-4 year olds 3-5 year olds 5 year olds
11

Decline in child and infant mortality
12

Access to electricity
0
2 000 500
4 001 000
6 001 500
8 002 000
10 002 500
12 003 000
1994/9
5
1995/9
6
1996/9
7
1997/9
8
1998/9
9
1999/0
0
2000/0
1
2001/0
2
2002/0
3
2003/0
4
2004/0
5
2005/0
6
2006/0
7
2007/0
8
2008/0
9
2009/1
0
2010/1
1
num
ber
HOUSEHOLDS WITH ACCESS TO ELECTRICITY
Total number of households
HH with access to electricity
13

Why, then, is society not cohesive?
• Unemployment level
• Inequality
• Race and class (Irish coffee)
• Poor services to the poor
• Structural legacies of colonialism and apartheid (initial conditions matter)
14

Unemployment Level
0
10
20
30
40
50
60
70
Sep Mar Sep Mar Sep Mar Sep Mar Sep Mar Sep Mar Sep Mar Jun Sep Dec Mar Jun Sep Dec Mar Jun Sep Dec Mar Jun Sep Dec
2001 2002 2003 2004 2005 2006 2007 2008 2009 2010 2011
%
Unemployment rate by age group and gender
15 - 24 25 - 34 35 - 44 45 - 54 55 - 64 Male Female
15

Inequality
GHS Gini Coefficient for Income and Expenditure
Province Income Expenditure
2005 2009 2005 2009
Eastern Cape 0.70 0.68 0.66 0.63
Free State 0.68 0.69 0.66 0.67
Gauteng 0.67 0.67 0.64 0.65
KwaZulu-Natal 0.70 0.69 0.68 0.64
Limpopo 0.69 0.71 0.62 0.64
Mpumalanga 0.68 0.68 0.66 0.67
Northern Cape 0.71 0.71 0.69 0.66
North West 0.68 0.70 0.64 0.68
Western Cape 0.66 0.61 0.63 0.64
16

Class and race
30
35
40
45
50
55
60
65
70
75
80
May Nov May Nov May Nov May Nov May Nov May Nov May Nov May Nov May Nov May Nov May Nov May Nov
2000 2001 2002 2003 2004 2005 2006 2007 2008 2009 2010 2011
%
Number of those who were of the opinion that race relations are improving expressed as a proportion of the total population
17

Maternal mortality
Estimated MMR, deaths per 100 000 live births
Region 1990 1995 2000 2005 2008
Australia 10 13 9 8 8
Brazil 120 98 79 64 58
Chile 56 40 29 26 26
Colombia 140 120 110 85 85
Malysia 56 46 39 34 31
Mauritius 72 67 28 32 36
Mexico 93 85 90 87 85
Nigeria 1100 1100 980 900 840
South Africa 230 260 380 440 410
Thailand 50 52 63 51 48
Africa 780 590
Sub-Sahara 870 640
World Total 400 260
18

Sexual Assault Reported Cases
2003/04 2004/05 2005/06 2006/07 2007/08 2008/09 2009/10 2010/11
Eastern Cape 8 238 8 626 10 312 9 117 9 087 9 456 9 047 9 380
Free State 4 734 4 972 4 559 4 386 4 396 4 523 4 581 4 838
Gauteng 16 402 16 333 15 676 15 124 15 398 18 176 15 645 13 987
KwaZulu-
Natal 11 378 12 122 11 932 11 649 11 355 13 279 13 269 12 793
Limpopo 4 491 5 070 4 671 4 780 4 528 4 675 4 905 4 883
Mpumalanga 4 375 4 674 4 756 4 631 4 169 4 695 4 603 4 442
North West 4 519 4 610 4 546 4 588 4 513 5 021 4 759 4 706
Northern
Cape 2 191 2 212 1 993 1 957 1 749 1 917 1 845 1 868
Western
Cape 9 751 10 498 9 631 8 969 8 623 8 772 9 678 9 299
Reported
cases 66 079 69 117 68 076 65 201 63 818 70 514 68 332 66 196
19

The system of accountability is leaky
• Poor forms of representation (constitution, list system and the liberation dividend)
• Weak leadership in parts of government, especially local government, corruption, nepotism and incompetence
• Stagnation of politics
Let’s look at inverse measurements of social cohesion….
20
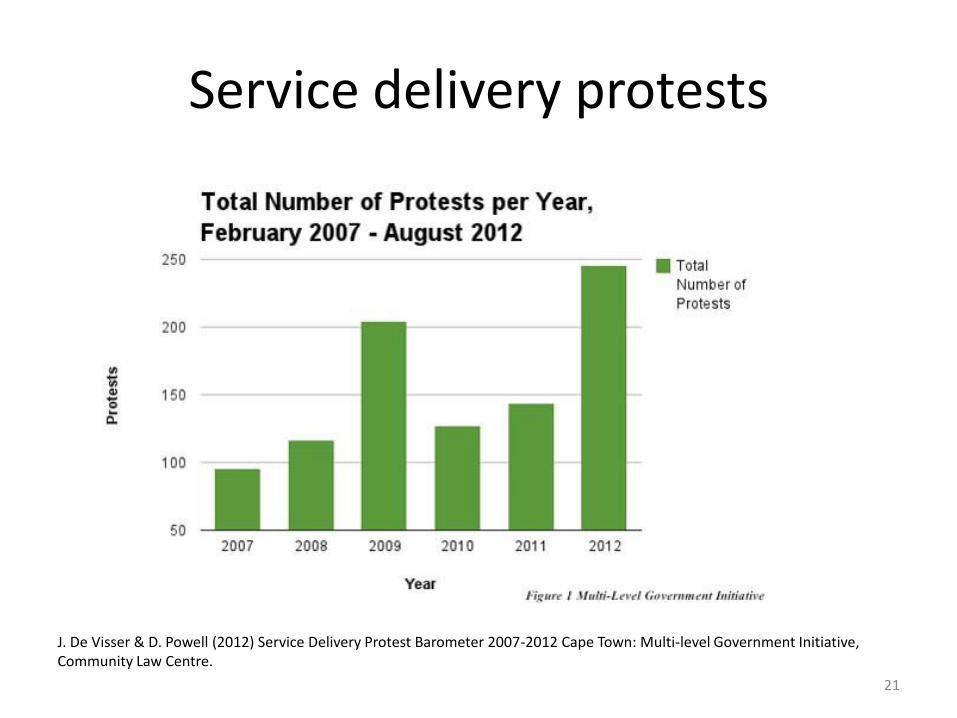
Service delivery protests
21
J. De Visser & D. Powell (2012) Service Delivery Protest Barometer 2007-2012 Cape Town: Multi-level Government Initiative, Community Law Centre.

Protest growth rate
22
J. De Visser & D. Powell (2012) Service Delivery Protest Barometer 2007-2012 Cape Town: Multi-level Government Initiative, Community Law Centre.

Nature of grievances
J. De Visser & D. Powell (2012) Service Delivery Protest Barometer 2007-2012 Cape Town: Multi-level Government Initiative, Community Law Centre.
23
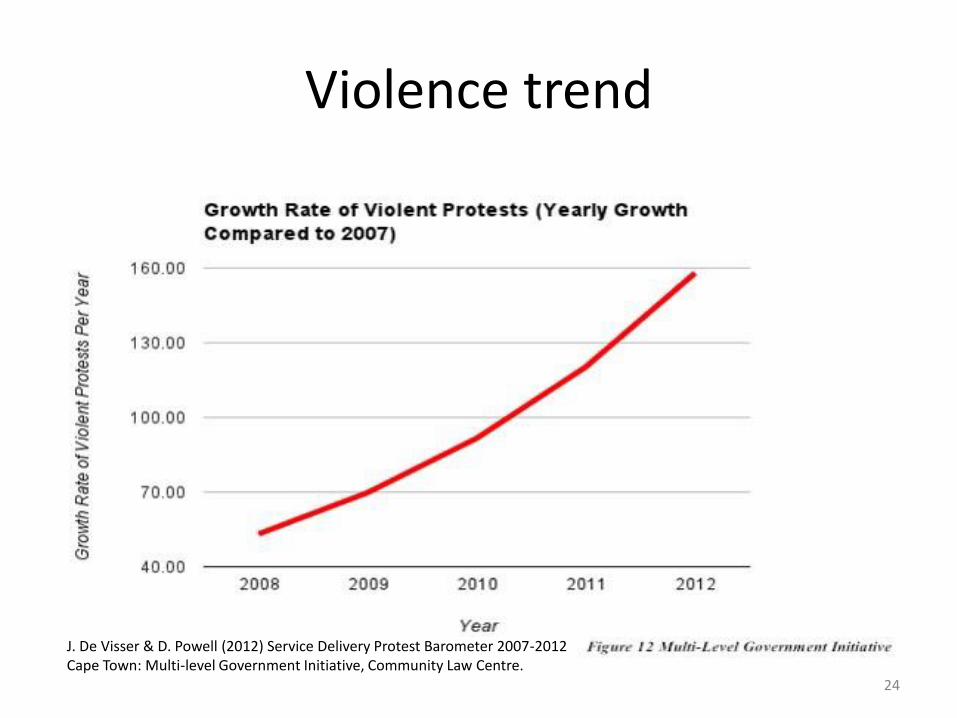
Violence trend
24
J. De Visser & D. Powell (2012) Service Delivery Protest Barometer 2007-2012 Cape Town: Multi-level Government Initiative, Community Law Centre.

Marikana-revealing structural faults
Marikana erupted due to structural fissures in South African society that threaten social cohesion—deep fissures, with roots in colonialism and apartheid, that don’t appear to threaten the overall integrity of the society in the short-term, but weaken growth and development prospects through undermining social cohesion
25

Marikana-Why?
The cleavages are about colonial-style migrant labour, unions that represent white collar, not blue collar workers in a weakening industrial relations environment, extreme inequality of rewards in the mining sector (and elsewhere), poor living conditions and inferior services for the relatively poor—not absolute poverty See Gavin Hartford: http://groundup.org.za/content/mining-industry-strike-wave-what-are-causes-and-what-are-solutions
26

Need to look beyond general data to structural fractures in society
• Indicators on inclusion, mobility and social capital are important and provide valuable insights
• In many respects, South African achievements after only 18 years of democracy are impressive: declining poverty, improved access to infrastructure, services, health and education
• But in societies that are deeply fractured, its not enough to reform at a macro-programme level and aggregates of data don’t work
• We need to address issues like: – the continuation of old-fashioned migrant labour – Poor forms of political representation/accountability – Extreme manifestations of inequality – The quality of social services for the poor vs. the rest
27

“The risks of focusing on what we can measure”
• In most important ways South Africa is a well managed country: – Democratic rights – Rule of law – Fiscal and monetary management – Even, significantly declining crime levels and improving health
indicators
• Many social and social security interventions were introduced to address inequality—social transfers, public employment programmes, compulsory education, the largest government ARV programme etc.
• But, there are structural faults in the society that wont be repaired by general programmes and they are not reflected traditional aggregated indicators
• Suitable indicators are important, but so are policies which accept that there is a lot that benchmark social programmes cant fix
28