can price structure and action lead the way
TRANSCRIPT
Can Price Structure And Action Lead The Way? http://www.netpicks.com/no-trading-indicators/

With all the trading indicators that are available and their ease of use (not usually
successfully though), it is easy to forget that simple still works.
Let's not confuse simple with being easy though but in this instance I want to use
simple in terms of price action and structure.
I also don't want to take away from the simple nature of trading indicators but
understand that price is needed to make them work. So why not just go to
the source?

It's not that I am against all trading indicators because I do find usefulness in a
few of them just not to dictate trades.

Interesting enough, whenever you look at a trading forum and someone posts a chart with a moving average
for example, the common question is "what is the setting?" Does it really
matter if the setting is 20 or 30 periods?Over the course of many
trades the answer is, "probably not".
While the Netpicks trading systems utilize indicators, you DO NOT trade
them blindly. Discretion is taught during your training which enables you to expertly pick the higher probability trading plays that are shown directly
on the trading chart.
But this is not about trading indicators.
This is about structure, price, and simply trading basics that are used
with skill.

The following trading charts are from a recent trading session and as you can see, no indicators were used for the
trading choices.

I am going to break down what I find to be the important details on these charts. Some may agree, some may disagree but it works for me and to
me...that is all that matters.

The pattern of the uptrend is broken for a swing once a LH is put in place. The uptrend line actually originates
further off to the left of the chart but you can see the HL after the LH comes into the line although a zone around
the line is close enough.


A high is put in and then price pulls back again in the location of the
uptrend line. The line does not actually physically hold price but trend lines
are more or less measures about the current "state" and volatility of the market. There is a rhythm to price
movements.

A LH is put in again just before the open. The horizontal line originates
from the left where price was supporting in that zone and eventually broke through. Price is now up into the same line and appears to be showing that sellers are willing to resist at this
price.


NOTE: There is much subjectivity around support/resistance lines so I just use areas that are obvious. If I have to search for an area, I am not
too interested in it.

At the open, price slams through the trendline, has a stall around the HL just
to the left and then falls to a more prominent pivot area.

NOTE: Pivot area is not to be confused with pivot points. Pivot
areas are simply areas where price turned. There are major and minor
pivot areas.

Whenever I see a strong move in one direction especially after a break of a technical such as trendlines, I get very
interested.

This next trading chart shows the strong move down and then
something interesting happens at the pivot marked "A".
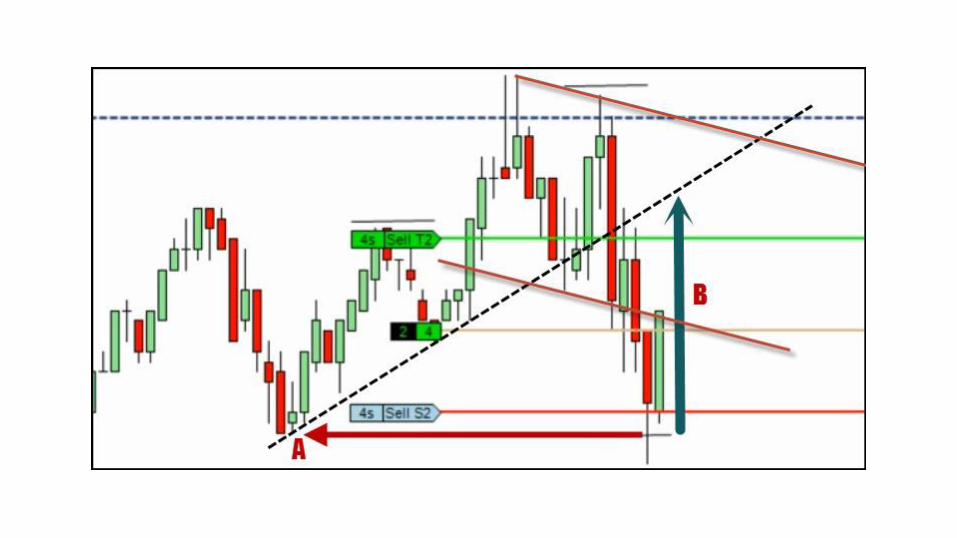

Price breaches the low and is quickly bought up (failure test of the support
zone) and given that often times a trend line broken to any side gets

a revisit of price (B), I bought into the move once price confirmed the
direction through a break of the high of the failure test candle.
NOTE: The trade actually gets stopped out for scratch but is bought back
again and target is reached.
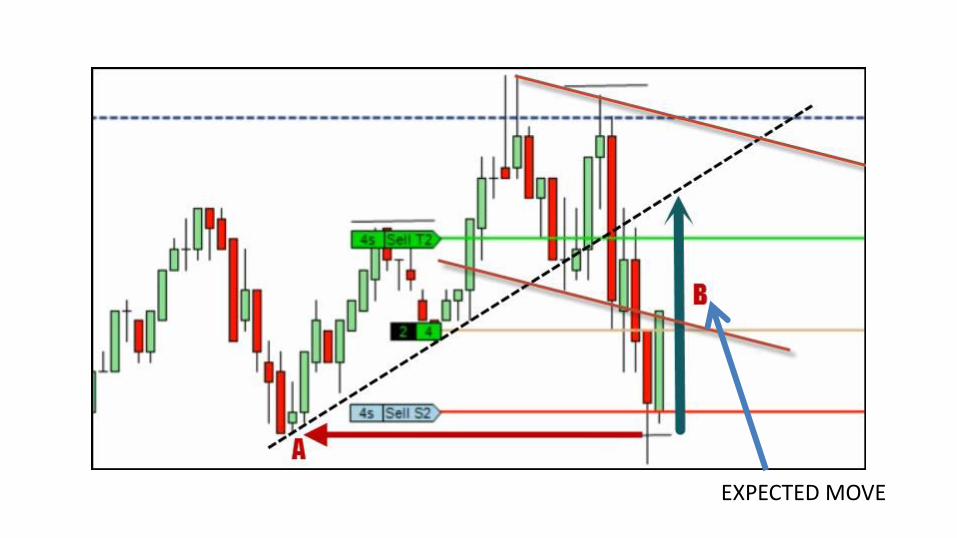
EXPECTED MOVE

Now price has done what I expected it to do after it showed a failure to break
the pivot. It is sitting up inside the trend line and the high of the candle is running into a trend line off the highs off the previous two candles marked
"A". bigger trend line.


Not shown on the chart but you can also form a channel using the
downward trend line and you would see price break through the low and
then retest just like we see on the

Price is also being held up at a price zone that is providing
resistance to the bulls.
You can see in the inset box that as soon as bears stepped in, a short
trading position was taken.

These are simple concepts however they can be difficult to implement due
to subjectivity that virtually all of us have.

Trading indicators are popular for many people because if you just follow
the indicator, your emotions, judgments, and some biases can be
removed. (although blindly following an indicator is a recipe for disaster).

But let's see if we can make some of what I covered objective.

- Draw trend lines from the last two/three lows or highs - Use pivots only when highs/lows are taken out to confirm pivot - Failure tests must conclude with testing candle closing > 50% up/down the body

I'm sure there are a few more variables that we can put rules around
but this is a good starting point.

As I mentioned earlier, I don't dismiss all trading indicators as there are some that are useful. Yes, even the moving average set at the basic setting of 20
can be used to help you frame the market.

This entire piece was to show that indicators are not a necessity and you can learn to skillfully trade using just what you see on the chart. It's a skill that can be learned but give yourself
time to become proficient.

Trading can be lucrative and it is naive to think that a PDF and a week of
studying will have you raking in the money the following week.
Be a professional in your trading and on the journey towards success.
