can parents afford to work? childcare costs, tax …can parents afford to work? childcare costs,...
TRANSCRIPT

DELSA/ELSA/WD/SEM(2005)10
OECD SOCIAL, EMPLOYMENT AND MIGRATION WORKING PAPERS
31
Can Parents Afford to Work? Childcare Costs, Tax-Benefit Policies and Work Incentives
Herwig Immervoll and David Barber

Unclassified DELSA/ELSA/WD/SEM(2005)10 Organisation de Coopération et de Développement Economiques Organisation for Economic Co-operation and Development 15-Dec-2005 ___________________________________________________________________________________________
English - Or. English DIRECTORATE FOR EMPLOYMENT, LABOUR AND SOCIAL AFFAIRS EMPLOYMENT, LABOUR AND SOCIAL AFFAIRS COMMITTEE
OECD SOCIAL, EMPLOYMENT AND MIGRATION WORKING PAPERS No. 31 CAN PARENTS AFFORD TO WORK? CHILDCARE COSTS, TAX-BENEFIT POLICIES AND WORK INCENTIVES
Herwig Immervoll and David Barber
JEL Classification: D13, H31, J13, J18, J22
JT00196045
Document complet disponible sur OLIS dans son format d'origine Complete document available on OLIS in its original format
DE
LSA
/EL
SA/W
D/SE
M(2005)10
Unclassified
English - O
r. English
Cancels & replaces the same document of 14 December 2005

DELSA/ELSA/WD/SEM(2005)10
DIRECTORATE FOR EMPLOYMENT, LABOUR AND SOCIAL AFFAIRS
http://www.oecd.org/els
OECD SOCIAL, EMPLOYMENT AND MIGRATION WORKING PAPERS
http://www.oecd.org/els/workingpapers
This series is designed to make available to a wider readership selected labour market, social policy and migration studies prepared for use within the OECD. Authorship is usually collective, but principal writers are named. The papers are generally available only in their original language – English or French – with a summary in the other. Comment on the series is welcome, and should be sent to the Directorate for Employment, Labour and Social Affairs, 2, rue André-Pascal, 75775 PARIS CEDEX 16, France.
The opinions expressed and arguments employed here are the responsibility of the author(s) and do not necessarily reflect those of the OECD
Applications for permission to reproduce or translate all or part of this material should be made to:
Head of Publications Service
OECD 2, rue André-Pascal
75775 Paris, CEDEX 16 France
Copyright OECD 2005
2

DELSA/ELSA/WD/SEM(2005)10
ACKNOWLEDGEMENTS
This work is the result of a joint project between the OECD and the European Commission. It has been produced with the financial assistance of the European Community. The views expressed herein are entirely those of the authors and can therefore in no way be taken to reflect the official opinion of the European Commission, or the OECD. The contributions of Desney Erb and Veronica Weisser are gratefully acknowledged. We also thank Hans Hansen for detailed comments on an earlier draft.
3

DELSA/ELSA/WD/SEM(2005)10
SUMMARY
1. Finding a suitable balance of work and family life is not an easy task for parents who face multiple, and potentially conflicting, demands. Childcare policies play a crucial role in helping parents reconcile care and employment-related tasks. But inconsistent or poorly implemented policies can also introduce additional barriers that make it harder for families to arrange and share their responsibilities according to their needs and preferences.
2. This paper quantifies the net cost of purchasing centre-based childcare in OECD countries taking into account a wide range of influences on household budgets, including fees charged by childcare providers as well as childcare-related tax concessions and cash benefits available to parents. Building on these calculations, family resources are evaluated for different employment situations in order to assess the financial trade-offs between work and staying at home. Results are disaggregated to identify the policy features that present barriers to work for parents whose employment decisions are known to be particularly responsive to financial work incentives: lone parents and second earners with young children requiring care.
3. The main findings can be summarised as follows.
• Net childcare costs are high in many countries. Even after deducting all relevant types of government support, typical out-of-pocket expenses for two pre-school children can add up to 20% and more of total family budgets. In a few cases, typical net costs are found to consume more than a third of family resources. If costs are prohibitive, those who want to (or need to) work may decide not to have children in the first place. Alternatively, parents will find it difficult to combine employment with high-quality childcare, with adverse consequences for both themselves and their children. Children will forego the developmental opportunities that high-quality childcare can bring while parents are hindered in their attempts to seek employment and improve family incomes. The issues are similar where good-quality childcare is in short supply. In fact, in some countries, very limited numbers of children in non-parental childcare suggest that undersupply of childcare facilities can be a more pressing problem than affordability.
• In a number of countries, supply-side subsidies to providers or direct cash support for parents succeed at keeping childcare costs low for those who manage to find a childcare place. The policy choices are, however, not straightforward and there is considerable scope to learn from the range of approaches adopted in different OECD countries. A frequent objective of childcare-related policies is to further child developmental goals by supporting childcare patterns believed to be most appropriate for the child. Childcare support is also provided in recognition of the public benefits of women’s participation in the labour market and, more generally, the desire to minimise any avoidable trade-offs between fertility and employment. Depending on the balance of these policy objectives, policy designs are likely to differ. For instance, policies that seek to encourage participation frequently target benefits towards mothers whose employment behaviour is thought to be particularly responsive to changes in childcare costs (lone parents, low-income second earners). A successful overall package ensures that parents are given a real choice about their preferred care arrangements without compromising concerns for child development or women’s employment chances.
4
DELSA/ELSA/WD/SEM(2005)10
• Given the very high cost of childcare provision, particularly for infants, significant and well-structured government support can help to achieve this balance. Targeting cash payments to needy parents can limit strains on government budgets and remove barriers to work for those who are most likely to respond to improved work incentives. Yet, by themselves, demand-side subsidies may be insufficient to ensure sufficient provision of good-quality childcare services, especially in disadvantaged areas.
• Whether or not parents can “afford to work” does not hinge on childcare policies alone, however. An important point emerging from the results is that the cost of purchasing childcare services needs to be analysed in conjunction with other social and fiscal policies that affect family incomes. While fees for full-time childcare can be very high, high prices do not necessarily impede employment if tax-benefits system incorporate well-balanced provisions that help parents pay for these services. Conversely, even highly subsidised childcare markets offering inexpensive childcare options can leave parents with little financial gain from employment if high tax burdens or benefit claw-back rates give rise to adverse work incentives.
• For most countries results show that, without accounting for the costs of purchasing childcare, even low-wage employment brings significant income gains for lone parents and, especially, potential second earners in two-parent families. Yet, in several countries, tax burdens and the withdrawal of social benefits reduce gains from work to such an extent that even very limited childcare expenses can leave families with less money to spend than if they were to stay at home. In a few countries, lone parents entering a low-wage job lose income even before accounting for any childcare-related expenses. Since non-employed lone parents are faced with extremely low incomes in some countries, and with considerable poverty risks everywhere, this highlights the need for work-friendly policies, including low effective tax burdens for low-wage earners and/or effective support for childcare.
• Once childcare costs are taken into account as work-related expenditures, low-wage second earners in about half the countries see more than 70% of their earnings consumed by childcare fees, taxes and reduced benefits. For lone parents, the payoff from employment can be lower still. For instance, in at least five countries where statutory minimum wages exist, lone parents taking up full-time minimum-wage employment lose out, often substantially, as their very limited income gains are not sufficient to cover the costs of centre-based childcare. Those who work despite the low payoffs are forced to find alternative care arrangements. These may be of lower quality or, in the case of informal care, only provide patchy or irregular care and risk damaging the well-being and development of the children concerned.
• A grouping of countries in terms of both overall financial work incentives and the importance of childcare costs in shaping these incentives reveals that very different institutional setups or welfare state ‘regimes’ can in fact lead to remarkably similar outcomes for parents. The results also indicate that adverse work incentives can occur as a result of high childcare costs (e.g. in Ireland or Switzerland) or because taxes and benefits make employment financially unattractive even before accounting for childcare costs (e.g. in the Slovak Republic or for lone parents in France). This suggests that simple policy prescriptions would not be sufficient for reducing employment barriers in all countries. Instead, policy responses need to be multi-faceted and carefully tailored to the situation in each country.
5

DELSA/ELSA/WD/SEM(2005)10
RÉSUMÉ
4. Trouver un juste équilibre entre le travail et la vie de famille n’est pas toujours facile pour des parents confrontés à des contraintes multiples, potentiellement contradictoires. Les mesures en faveur de la garde des enfants jouent un rôle essentiel pour ce qui est d’aider les parents à concilier ces responsabilités et les contraintes liées à un emploi. Mais des politiques incohérentes ou mal mises en œuvre peuvent aussi créer des obstacles supplémentaires qui feront qu’il sera plus difficile encore pour les familles de s’organiser et de partager les tâches en fonction de leurs besoins et de leurs préférences.
5. Il s’agit ici de mesurer le coût net de l’achat de services de garde d’enfants dans des structures spécifiques, dans les pays de l’OCDE, en faisant intervenir tout un éventail d’éléments qui influent sur le budget des ménages, à savoir notamment les tarifs pratiqués par les prestataires de services de garde ainsi que les avantages fiscaux et prestations en espèces dont les parents peuvent bénéficier au titre de la garde des enfants. En s’appuyant sur ces calculs, on évalue les ressources des familles dans différentes situations d’emploi afin de mettre en évidence les termes du choix financier entre travailler et rester à la maison. Les résultats sont affinés pour faire apparaître les éléments, dans les dispositifs publics, qui créent des obstacles à l’emploi des parents dont on sait que la décision d’emploi est particulièrement sensible aux incitations financières en faveur de l’activité : en l’occurrence, parents isolés et seconds apporteurs de revenu ayant de jeunes enfants qui doivent être gardés.
6. Les principales conclusions de ce travail peuvent être résumées comme suit :
• Il apparaît que les coûts nets liés à la garde des enfants sont élevés dans de nombreux pays. Même après déduction de toutes les formes d’aide publique existantes, en règle générale, les dépenses à la charge des familles, pour deux enfants d’âge préscolaire à garder, peuvent représenter jusqu’à 20 %, si ce n’est plus, du budget total de la famille. Dans quelques cas, le coût net de la garde des enfants absorbe plus d’un tiers des ressources de la famille. Si le coût est prohibitif, ceux qui souhaitent travailler (ou qui ont besoin de travailler) peuvent commencer par décider de ne pas avoir d’enfants. Sinon, les parents auront du mal à concilier un emploi et des conditions de garde des enfants de qualité, ce qui aura des conséquences négatives pour eux-mêmes et pour leurs enfants. Les enfants ne bénéficieront pas des opportunités de développement que recèlent des formules de garde de qualité tandis que les parents seront entravés dans leurs tentatives pour trouver du travail et améliorer le revenu de la famille. La problématique est la même lorsque l’offre de formules de qualité est insuffisante. En fait, le taux, très faible dans certains pays, d’accès à des services de garde donne à penser que l’insuffisance de l’offre de services de garde d’enfants peut être un problème plus aigu que le coût.
• Dans un certain nombre de pays, les subventions aux prestataires ou les aides monétaires directes aux parents parviennent à faire que le coût de la garde des enfants soit faible pour les parents qui parviennent à obtenir une place. Les choix qui s’offrent aux gouvernements ne sont toutefois pas univoques et il y a beaucoup à apprendre à observer les différentes approches adoptées dans les différents pays de l’OCDE. L’un des objectifs fréquents d’une politique d’accueil du jeune enfant est de favoriser son développement en lui offrant l’accès à des formules de garde dont on estime qu’elles sont les meilleures pour lui. On est aussi soucieux de favoriser la participation des femmes au marché du travail, reconnue bénéfique pour la société, et, de façon plus générale, on
6

DELSA/ELSA/WD/SEM(2005)10
souhaite éviter, dans toute la mesure du possible, qu’il y ait un choix à faire entre fécondité et emploi. La conception des politiques gouvernementales variera en fonction de l’importance relative donnée à ces différents objectifs. Par exemple, les mesures qui cherchent à encourager la participation au marché du travail ciblent souvent les prestations sur les mères dont on pense que le comportement au regard de l’emploi est particulièrement sensible au coût de la garde des enfants (parents isolés, seconds apporteurs de revenu à faible niveau de revenu). Il est souhaitable de concilier les différents objectifs, à savoir donner véritablement aux parents la possibilité de choisir le mode de garde qu’ils préfèrent sans pour autant négliger le souci du développement de l’enfant ou les chances des femmes sur le marché du travail.
• Étant donné le coût très élevé de la mise à disposition de services de garde d’enfants, en particulier pour les très jeunes enfants, une aide publique bien structurée et d’importance a un grand rôle à jouer. En ciblant les prestations en espèces sur les parents dans le besoin, on limitera les tensions sur les budgets publics et on fera tomber les obstacles à l’emploi des individus les plus susceptibles de réagir à une amélioration des incitations en faveur de l’activité. Cependant, les subventions du côté de la demande peuvent ne pas suffire, à elles seules, pour assurer une offre adéquate de services de garde de qualité, surtout dans les zones défavorisées.
• Savoir si les parents peuvent ou non « se permettre de travailler » ne dépend toutefois pas uniquement de la politique visant les services de garde d’enfants. L’un des points importants qui se dégage des résultats est que le coût de l’achat de services de garde d’enfants doit s’analyser en liaison avec d’autres mesures, d’ordre social et fiscal, qui influent sur le revenu des familles. Si les tarifs des services de garde à plein temps peuvent être très élevés, représentant souvent plus d’un tiers des revenus moyens d’activité, des tarifs élevés n’entravent pas nécessairement l’emploi si le système fiscal et de prestations intègre des dispositions bien équilibrées qui aident les parents à y faire face. A l’inverse, même un marché des services de garde d’enfants fortement subventionné, offrant des possibilités de garde peu coûteuses, peut faire que les parents ne gagneront pas grand-chose à travailler si la pression fiscale ou les mécanismes de réduction des prestations créent des incitations négatives à l’égard de l’activité.
• Pour la plupart des pays, les résultats montrent que, indépendamment du coût des services de garde, même un emploi faiblement rémunéré représente un gain notable, en termes de revenu, pour des parents isolés et, surtout, pour un second apporteur potentiel de revenu dans les familles biparentales. Mais, dans plusieurs pays, la pression fiscale et les mécanismes de réduction des prestations sociales amputent à ce point les revenus du travail que, même avec des frais de garde des enfants très modiques, les familles ont finalement moins d’argent à dépenser que si les parents restaient à la maison. Dans quelques pays, les parents isolés qui prennent un emploi à bas salaire sont pénalisés en terme de revenu avant même que l’on tienne compte d’éventuels frais de garde d’enfants. Étant donné le très faible niveau de revenu des parents isolés qui n’ont pas d’emploi, dans certains pays, et le risque important de pauvreté auquel ils sont exposés partout, on voit toute la nécessité de politiques qui soient favorables à l’activité, ce qui suppose notamment une pression fiscale effective faible sur les bas salaires et/ou un réel soutien à la garde des enfants.
• Si l’on considère les frais de garde d’enfants comme des dépenses liées à l’exercice d’un emploi, dans environ la moitié des pays le second apporteur de revenu, s’il a un faible salaire, voit plus de 70% de ses gains absorbés par les frais de garde d’enfants, les prélèvements fiscaux et les réductions de prestations. L’avantage financier lié à l’emploi peut être plus faible encore pour les parents isolés. Dans plusieurs pays, ceux-ci subissent souvent, en fait, une baisse de revenu lorsqu’ils accèdent à un emploi. Par exemple, dans au moins 5 pays où existe un salaire minimum officiel, les parents isolés qui prennent un emploi à plein temps rémunéré au niveau du salaire
7

DELSA/ELSA/WD/SEM(2005)10
minimum y perdent, et souvent dans une proportion non négligeable, le surcroît de revenu, très limité, qu’ils s’assurent ainsi ne suffisant pas pour couvrir le coût de la garde des enfants dans des structures spécifiques. Ceux qui travaillent en dépit du faible avantage que cela représente pour eux sont contraints de trouver d’autres solutions pour faire garder leurs enfants. Ces autres solutions risquent d’être de moindre qualité ou, s’il s’agit d’une prise en charge informelle, risquent de n’avoir qu’un caractère ponctuel ou irrégulier, et le bien-être et le développement des enfants risquent d’en pâtir.
• En regroupant les pays à la fois en fonction des incitations financières globales en faveur de l’activité et en fonction de l’importance du coût de la garde des enfants dans ces mécanismes incitatifs, on constate que des dispositifs institutionnels ou des « régimes » publics d’aide sociale très différents peuvent, en fait, produire des résultats étonnamment semblables pour les parents. Les résultats montrent aussi que des incitations négatives vis-à-vis de l’activité peuvent se produire par suite du coût élevé de la garde des enfants (en Irlande ou en Suisse, par exemple) ou parce que les prélèvements fiscaux et les prestations rendent l’emploi financièrement peu attrayant, même avant de faire entrer en ligne de compte les frais de garde des enfants (République slovaque ou, pour les parents isolés, France, par exemple). On peut donc penser que des prescriptions simples à l’intention des autorités ne sauraient suffire pour réduire les obstacles à l’emploi. La réaction des pouvoirs publics doit être pluriforme et bien adaptée à la situation propre à chaque pays.
8

DELSA/ELSA/WD/SEM(2005)10
TABLE OF CONTENTS
ACKNOWLEDGEMENTS ............................................................................................................................3 SUMMARY ....................................................................................................................................................4 RÉSUMÉ.........................................................................................................................................................6
1. Introduction.....................................................................................................................................10 2. Use and affordability of non-parental childcare..............................................................................11
2.1. Use of purchased childcare........................................................................................................12 2.2. Fees charged by childcare centres .............................................................................................14 2.3. Childcare-related benefits and tax concessions .........................................................................17 2.4. Summing up: Parents’ out-of-pocket expenses .........................................................................19
3. Care to work? The net impact of employment on family resources. ..............................................26 3.1. Sharing work efforts and opportunities: The roles of family taxation and social benefits ........26 3.2. Working parents: What is left after paying for childcare? ........................................................32
4. Future work.....................................................................................................................................50 ANNEX A .......................................................................................................................................................52 ANNEX B .......................................................................................................................................................63 BIBLIOGRAPHY .........................................................................................................................................66 Boxes
Box 1. Labour supply effects of the cost of purchasing childcare: Empirical evidence .......................32
9

DELSA/ELSA/WD/SEM(2005)10
CAN PARENTS AFFORD TO WORK? CHILDCARE COSTS, TAX-BENEFIT POLICIES AND WORK INCENTIVES.
1. Introduction
7. Parents perform a wide range of tasks to ensure the well-being of their children and the family as a whole. While, between them, most parents face similar sets of core tasks, they adopt very different coping strategies responding, in part, to the household’s specific social and economic circumstances. To an important extent, the economic context of household behaviour is shaped by government policies which seek to further a range of different, and sometimes, conflicting objectives.
8. Discussions in many OECD countries have recently focussed on policies affecting parents with young children.1 Childcare policies assume a central role in these debates. Support for parental or non-parental care is granted for a number of reasons and both the objectives and the nature of support differ markedly across countries. Objectives include promoting child development and well-being2; encouraging parenthood; reducing gender inequities; improving incomes of disadvantaged or large families or reducing their expenditures; and, in the case of support for non-parental childcare, removing barriers to female employment and, more generally, reconciling work and family life.
9. But what is the overall effect of policies in this area from the perspective of individual families? This paper analyses and compares the impact of a range of social and fiscal policies on the budgets of families with children requiring care. It quantifies the “out-of-pocket” childcare costs faced by families in a number of different circumstances and shows how these costs are shaped by different types of policies. The analysis focuses on the cost to parents (rather than the cost of childcare provision) in order to be able to compare situations of families across countries with very different childcare institutions. In a second step, the calculations are used to examine the financial consequences of different employment and care patterns. Focusing on the circumstances of mothers of pre-school children, the objective is to understand how the cost of non-parental childcare affects the payoffs from (re-) entering employment. Childcare costs are analysed in conjunction with taxes and social benefits in order to investigate how existing policies combine to reward or penalise work efforts.
10. Whether families manage to combine raising children with active participation in the labour market has major implications for the design and success of social policies. These links have received much attention in the context of ageing populations and the financial viability of existing welfare state 1. The OECD series Babies and Bosses provides an in-depth assessment of the policy issues and a contribution to
the debate for a number of OECD countries (OECD, 2002a; 2003; 2004a; 2005).
2. For the age-group this paper focuses on (pre-school children aged two years and older), available evidence indicates that, when combined with good-quality childcare, mother’s employment away from home is not detrimental to their development but can, on the contrary, contribute to it (James-Burdumy, 2005; Kamerman et al., 2003). There is convincing evidence that maternal full-time employment during the first year after birth is harmful to children’s health (Berger et al., 2005; Gregg et al., 2005; Tanaka, 2005). Recent evidence for the United States, where maternity leave periods are extremely short, also suggest that measures that enable women to extend their leave, as recently implemented or currently considered in the majority of states, have beneficial effects for the health of mothers (Chatterji and Markowitz, 2005).
10

DELSA/ELSA/WD/SEM(2005)10
regimes, most notably in the area of health and pay-as-you-go pension systems.3 While a macro perspective on these mechanisms is needed for understanding current policy tradeoffs and the magnitude of future challenges, an obvious but less often discussed, aspect is that patterns of work and family life affect the well-being of individual families. Essentially, families benefit from measures that expand their choice of feasible patterns of work and family life. Where this choice is severely constrained, well-being (‘utility’) is damaged in a number of ways.
11. A large number of studies have emphasised the roles of taxes, social benefits and childcare costs faced by parents in shaping financial incentives and household behaviour. While taxes and benefits have been thoroughly analysed in this context, cross-country evidence on childcare costs has been hampered by a lack of comparable data. The aim of this paper is to bring the costs of childcare into the analysis of financial work incentives on a cross-national basis. To do this, we draw on recently developed extensions of the OECD’s tax-benefit models, which now incorporate childcare fees as well as childcare-related tax and benefit provisions. These models are used to assess the resource situation of families in a range of different circumstances and to assess how existing policies shape the financial incentives for employment decisions in particular. The aim is to provide policy-relevant information that relates directly to existing policy features. Interactions between different policy instruments, such as the tax treatment of childcare costs or benefits, are fully taken into account in order to show their combined impact on family incomes. In addition, results are broken down to investigate the impact of individual policy elements.
12. The paper is organised as follows. Section 2 discusses the characteristics of institutional childcare, summarising available data on the use of formal childcare and showing detailed information on childcare fees and benefits as provided by delegates to the OECD Working Party on Social Policy. Focussing on lone parents and second earners, this information is then combined to compute net childcare costs faced by working parents in a range of different circumstances. Section 3 evaluates the consequences of tax-benefit and childcare policies for work incentives. It presents detailed estimates of family net incomes in and out of work and the net income gain from taking up employment. A first set of calculations in Section 3.1 determines the effects of non-childcare-related tax and benefit provisions on work incentives, discussing the role of benefit withdrawals and family taxation in particular. Building on these findings, Section 3.2 extends the calculations by accounting for work-related childcare costs incurred by parents in full-time employment. Results are used to identify barriers to parental, and especially mothers’, employment and implications are discussed for each policy area. A final section discusses possible future directions for this work.
2. Use and affordability of non-parental childcare
13. Ensuring the provision of affordable childcare is an essential component of policies aiming to address the balance between work and family life. This section discusses provides an overview of available information on the institutional features of policies relating to non-parental childcare. This information is then used to derive detailed estimates of the overall cost of childcare borne by parents in a number of different situations. Estimates take into account the prices charged by childcare institutions as well as all childcare-related government benefits and tax provisions.
14. A comparison of childcare policies across countries is complicated by the very considerable heterogeneity of policy arrangements in this area. To facilitate a meaningful discussion of country differences it is essential to adopt a consistent terminology. In what follows, childcare fees are the amounts paid by parents to the childcare institution. They are the prices that the institution would advertise
3. D’Addio and Mira D’Ercole (2005) analyse trends and influences on fertility rates. Projections of age-related
spending are provided by Dang et al. (2001).
11

DELSA/ELSA/WD/SEM(2005)10
and are therefore measured after any government subsidies received by childcare providers but before any childcare-related cash transfers, special rebates or tax concessions available to parents.
15. In practice, the proper distinction between subsidies, refunds and childcare benefits is often not self-evident. Indeed, some of these instruments can be functionally equivalent. For instance, a graduated fee structure can result in the same “out-of-pocket” childcare expense as an income-related childcare benefit. While it is important to understand each of the underlying policy elements, the overall childcare costs are therefore the most relevant concept when thinking about childcare affordability. Childcare cost as used here is a broad measure that aims to encompass all relevant cost components irrespective of their label or the way they are administered in a particular country. It thus includes fees minus cash benefits, rebates and the value of any tax concessions.
2.1. Use of purchased childcare
16. For a given family, the choice of the most appropriate childcare package (parental, professional and/or informal care) is influenced by the availability and cost of each mode of care. The overall number of children in registered (i.e. formal) childcare varies enormously across countries. Attendance rates for young children range from less than 10 percent in Korea and most countries in southern and eastern Europe countries to more than 50 percent in Denmark, Sweden and the United States (Table 2.1). The data, collected from a range of different sources, do not account for other differences in childcare patterns, such as the number of hours a child typically spends in formal care. In some cases, accounting for these can be expected to show even larger discrepancies as some countries with particularly high rates of childcare use (Scandinavian countries) typically provide long hours of care.
17. The observed country differences are a reflection of both incomplete information on childcare use (notably a lack of consistent data on the use of informal care across countries4) and the large number of factors influencing childcare arrangements. These factors include demographic and labour market characteristics as well as institutional factors such childcare affordability, tax-benefit systems as well as other aspects of work/family-life reconciliation policies such as workplace practices and the nature of parental leave entitlements.
18. There are a number of potential links between women’s participation in the labour market and the use of purchased childcare. A simple plot of formal childcare use against employment rates of mothers of young children shows a moderate positive relationship across countries (Figure 2.1). While such an association does not establish causality, one would expect causal links to run in both directions. Higher employment rates lead to increased demand for childcare services while adequate supply of such services enables women to combine work and family life.
19. Another potential link works via the supply of informal care. This type of care can be especially important in countries where extended family networks are common. Since childcare (both formal and informal) is predominantly provided by women, their attachment to the labour market has implications for their availability as informal care-givers. One can therefore expect a crowding-out effect where higher female employment rates reduce the number of women able and willing to engage in informal childcare work.5 In turn, this can raise the demand for formal care and further strengthen a positive association between female employment and use of formal care.
4. OECD (2006), a forthcoming synthesis volume of the Babies and Bosses series, provides a summary of
available data on the use of informal care.
5. Informal care can serve a valuable temporary buffer function in a situation where the supply of formal childcare is lagging behind increasing female employment rates. An example is Ireland where, amid low
12

DELSA/ELSA/WD/SEM(2005)10
Table 2.1. Children in registered childcare
Australia 1999 31Austria 2001 13Belgium 2000 30Canada 2001 19Czech Republic 2000 1Denmark 1999 64Finland 2003 25France 2001 30Germany 2001 9Greece 2000 3Hungary 2003 6-8Iceland 2003 38Ireland 1997 12Italy 1998 6Japan 2001 18Korea 2000 7Luxembourg -- --Netherlands 1997 17New Zealand 2002 40Norway 1997 40Poland 2003 2Portugal 2002 22Slovak Republic 1999 46Spain 2000 5Sweden 2003 65Switzerland 2003 28United Kingdom 2003 26United States 1997 16
YearChildcare use (% of children
aged 0-2)
Notes: "--" indicates that information is unavailable. Figures include both full-time and part-time care. Registered care includes licensed centre-based care in all countries; it also includes accredited childminders/residential care where they exist. Switzerland: rates for children aged 0-30 months. Canada: children aged 6 months to 5 years. United States: institutional care including Head Start, pre-school, pre-kindergarten, nursery school and child care centres. Sources: Australia, Austria, Denmark, Finland, Ireland, Japan, Netherlands, New Zealand, Portugal, Sweden, Switzerland, United Kingdom: data collected for the OECD series Babies and Bosses (OECD, 2002a; 2003; 2004a; 2005). Belgium, Czech Republic, Italy, Korea, Norway, Slovak Republic, Spain: OECD (2001), Employment Outlook; Paris. Canada, Iceland, Poland: Delegates to the OECD Working Party on Social Policy. France: Thibault et al. (2004), “De l’APE à la PAJE: comment apprehender les effets sur l’emploi des femmes?”, Revue de l’OFCE, 90, 276-82. Germany: OECD (2004c), Early Childhood Education and Care Policy in Germany: Country Note; Hungary: data provided by the National Family and Social Policy Research Institute; United States: Tout, K., M. Zaslow, A.M. Papillo, and S. Vandivere, 2001, “Early care and education: Work support for families and developmental opportunity for young children”, Urban Institute Occasional Paper No. 51, Urban Institute, Washington, D.C.
20. Does the infrequent use of registered childcare then stem primarily from a shortage of childcare places or is it a consequence of limited demand for these services? This is a very policy-relevant question. Governments wishing to address obstacles to female employment will need to know to what extent employment prospects are inhibited by inadequate supply of formal childcare or by other factors, including work practices, education policies or parental-leave arrangements. For forward-looking policies, it is also
formal childcare coverage, employment has soared from 37 percent of working-age women in 1990 to 55 percent in 2002 (OECD database on Labour Force Statistics). To the extent that women substitute employment for unpaid childcare work, rising female employment diminishes the capacity for informal care and this eventually implies a more urgent need for other forms of childcare.
13

DELSA/ELSA/WD/SEM(2005)10
important to recognise the links between supply and demand. Indeed, insufficient childcare capacities can conserve negative cultural attitudes towards maternal employment.
21. Available data on childcare use do not allow us to analyse supply and demand issues separately and on a consistent basis across countries (see Bennett, 2002, for a discussion of data needs in this area). It is, however, possible to analyse carefully the overall costs faced by parents. This can provide valuable clues about the reasons for different patterns of childcare use as costs are a crucial determinant of childcare choices.
Figure 2.1. Use of formal childcare and maternal employment rates(1)
R2 = 0.1615
25
35
45
55
65
75
85
0 10 20 30 40 50 60 7children in formal childcare , %
mat
erna
l em
ploy
men
t rat
e, %
0
AUS
AUT BEL
CZE
DNK
FIN
FRADEU
GRCESP
ITA
NLD
NZL
PRT
SVK*
SWE
GBR
USA
IRL
HUN*
CHE
JPN
NOR**
CAN
1. See Table 2.1 for years of reference. Employment rates are for mothers of children aged under three (*: children aged under six; **: all mothers). Employment rates include mothers on employment-protected parental leave. Source: Childcare use: Table 2.1; employment rates: Labour Force Survey data; OECD (2004), Society at a Glance; OECD, Babies and Bosses, various issues.
2.2. Fees charged by childcare centres
22. The most visible influence on the affordability of purchased care is the fee charged by providers. Fees vary not only by country but also by the type of care provided and, frequently, by region or municipality and/or characteristics of the children or parents. In addition, parents may choose to use both formal and informal care6 or may find that an optimal childcare “package” involves a mix of different forms of parental and non-parental care.
23. While one needs to keep in mind the heterogeneity in childcare arrangements, it is, for an international comparison, useful to focus on quite specific circumstances initially. In an effort to provide
6. While frequently unpaid, informal care carries an economic cost (mainly in terms of forgone earnings and
leisure of the care-giver). As a result, potential informal carers who would be available in principle (e.g. non-working relatives living close-by) may not be prepared to offer their help at all or only for a fraction of the time required.
14

DELSA/ELSA/WD/SEM(2005)10
such a comparison, the OECD Secretariat has collected data on the “typical” fees charged by accredited childcare centres for children aged two and three.7 As part of this data collection, delegates to the OECD Working Party on Social Policy also provided other relevant information such as how fees vary with income, family status or the child’s age.
Figure 2.2. Only one element of net costs: Fees charged by childcare centres.1
Fee per two-year old, 2001 or latest year available.
6 6 6 6 7 8 810 11 11 12 12 13
1618
19 19 1921
22
25
29 30
34
37
16
0
5
10
15
20
25
30
35
40
Sweden
Slovak R
epub
lic
Hungary
Spain
Greece
Denmark
Finland
Czech
Repu
blic
Iceland
Korea
German
y
Norway
Austria
Belgium
AVERAGEUSA
New Zealand
Canada
Portuga
l
Australi
aJa
pan UK
Netherlan
ds
Irelan
d
Franc
e
Switzerl
and
% o
f APW
1. See Figures 2.3 and 2.4 for comprehensive estimates of net costs. APW = gross earnings of an average production worker (see OECD, 2004). Fees are for one month of full-time care not taking into account reductions due to periods where childcare may not be available or required, such as vacation. Where fee information is provided per hour of care, full-time care is assumed to cover 40 hours per week. Fees are the gross amounts charged to parents, i.e. after any subsidies paid to the provider but before any childcare-related cash benefits, tax advantages available to parents or childcare refunds/rebates that are akin to benefits. Where prices depend on income or family characteristics, the maximum applicable fees are shown. Unless fees are rule-based or uniform across institutions, averages or "typical" fees are shown. The fee shown for Norway is for children older than 3 while fees are higher for younger children. Information is for 2001 except for Canada (1998), Portugal (2000), New Zealand, Spain, Sweden, and the United States (2002), and Belgium, France and the United Kingdom (2003). In a number of countries, available fee information relates to a particular region: Austria (Vienna), Belgium (Wallonie), Canada (Ontario), Germany (Nordrhein-Westfalen), Iceland (Reykjavík), Switzerland (Zürich), United States (Michigan). Full details underlying these numbers are shown in Annex Table A1.
24. An illustration of fees charged to parents for childcare on a full-time basis is shown in Figure 2.2 (further details are summarised in Annex Table A1). Taken across the countries shown, the average “typical” fee for one two-year old in full-time care is approximately 16% of average earnings. There are very significant deviations from this simple average, reflecting differences in market structures and government subsidies to childcare providers. Relative to average earnings, fees range from 10% and less (Denmark, Finland, Greece, Hungary, Czech and Slovak Republics, Spain, Sweden) to 30% or more (France, Ireland, Switzerland).
7. Fees can be substantially higher for infants and lower for older children.
15

DELSA/ELSA/WD/SEM(2005)10
25. Country comparisons based on such figures alone are, however, deficient in several respects. First, net childcare costs can be substantially lower, which may either moderate or further magnify the country differences shown in Figure 2.2. Childcare fees are often reduced for families in particular circumstances and, as shown below, these reductions can be both substantial and widespread. In addition, countries provide a range of cash benefits aimed at helping parents reduce the net cost of purchased childcare. Secondly, decisions about childcare and employment are generally not independent and many parents will consider the costs of childcare relative to the net gain from employment (Section 3 analyses childcare costs as one of a number of influences on the financial gains from employment). Finally, the quality of centre-based childcare invariably differs between countries. We come back to this important point in the concluding section.
26. Differentiated fee structures reflect differences in the cost of service provision (such as the additional resources required for infant care, or other characteristics of childcare quality) or other market-related pricing considerations. In addition, governments and, to some extent, semi-private not-for-profit childcare providers use differentiated fee schedules in order to target childcare subsidies or otherwise redistribute between different types of childcare users. Such measures may aim at addressing equity concerns (ensuring accessibility of childcare for families with limited means) or demographic objectives (reducing the cost of children for larger families). They may also be designed to encourage the use of non-parental care in quite specific cases. Examples are fee reductions for lone parents (to enable them to stay in employment or look for and take up a new job) or students (to allow them to complete their studies) or rebates targeted at children of certain ages (e.g. pre-school) so as to support their cognitive or social development.
27. Annex Table A1 provides an overview of family characteristics that are typically used to administer fee concessions in OECD countries. Fees per child often decrease with the child’s age. They are sometimes lower for lone parents (column “Family status”) and can differ by the number of children in care. German parents in the state of Nordrhein-Westfalen, for instance, pay no additional fees for second and further children while generous rebates are available in several countries including Denmark, Finland, France, Iceland and the Netherlands. Providers in many countries operate income-dependent fee structures aimed at making childcare more affordable for low-income families.
28. It is important to note that, while reduced fees aim at increasing demand for non-parental care, families that are targeted by these measures may be, and often are, faced with insufficient childcare capacities with providers unable to offer places to all those who need them (see column “Provision of Childcare”). That is, parents’ childcare choices are not only constrained in terms of the cost but also in terms of the availability of appropriate care. Existing schemes therefore sometimes combine fee reductions with preferential access for particular groups (column “Priority Access”). Granting priority access is easily justified in cases where an urgent need for non-parental care exists. Yet this approach shifts the under-supply problem from one group of parents to another and is therefore problematic if overall childcare-use among all families is seen as insufficient.
29. A more comprehensive policy solution would tackle the under-provision problem directly by removing supply-side barriers. One effective approach, adopted to different degrees by a number of countries, consists of replacing regulated fees with a combination of market prices, government support for providers and appropriately administered government transfers to parents (such as cash benefits that take into account the family situation, including the actual use of licensed childcare services). Properly implemented, such a strategy maintains supply incentives for providers (see Lundsgaard, 2002; Cleveland and Krashinsky, 2003). Compared to a system where prices are regulated, it can therefore be expected to ease problems of under-provision and create incentives for providers to improve the match between available services and parental needs (e.g. in terms of the hours of available care). At the same time, cash
16

DELSA/ELSA/WD/SEM(2005)10
transfers to parents can be used to moderate net childcare costs and target support to those who need it most.
2.3. Childcare-related benefits and tax concessions
30. The structure of any financial support has crucial implications for the functioning of childcare markets and, thus, the supply of available care places. Yet, for individual parents considering the cost of childcare, measures that direct financial support towards the users of childcare services can be equivalent to policies that affect the level and structure of fees charged by providers. Governments operate a number of cash transfers to encourage the use of non-parental formal childcare.
31. Certain types of financial support seek to further child developmental goals by supporting childcare patterns believed to be most appropriate for the child. These support measures tend to be widely accessible and employ little targeting towards particular families or children. Other types of support are mainly provided in recognition of the public benefits of women’s participation in the labour market and, more generally, the desire to minimise any avoidable trade-offs between fertility and employment. Policies that aim to encourage work in this way frequently target benefits towards mothers whose employment behaviour is thought to be particularly responsive to changes in childcare costs (lone parents, low-income second earners). A successful overall package ensures that parents are given a real choice about their preferred care arrangements without compromising concerns for child development or women’s employment chances. Balancing the different goals is, however, not always straightforward and is complicated by the multitude of policies that influence the attractiveness of different work and care patterns. A comprehensive perspective is needed to disentangle interactions between different policy interventions and understand their net effect.
32. Demand-side measures aimed at supporting families with children requiring care can be categorised in terms of the channels used to deliver financial support. Childcare payments may be tax-deductible, partly reflecting a view that they constitute work-related expenses. Making such expenses tax-deductible follows directly from horizontal equity considerations (taxing similar incomes similarly regardless of how they are earned), which constitute a basic principle of income taxation. In particular existing income tax systems do not tax the implicit income from home production, including the provision of parental childcare. Allowing employed parents to claim tax exemptions for childcare expenses is then consistent with aims to limit distortions of employment decisions and, more generally, achieve a more balanced tax-treatment of families with different patterns of work in the market and at home.8
33. In principle, tax deductions strengthen work incentives by lowering tax payments for those returning to work after childbirth. Yet, the targeting tends to be weak as many lower-income earners may be exempted from paying taxes altogether or pay very low rates. High-income families who are subject to high marginal income tax rates gain more so that tax deductions tend to reduce overall tax progressivity.9 Perhaps more importantly, support provided through the tax system is often not available at the time when parents actually incur childcare expenses but only after tax returns have been filed and approved (usually in the following fiscal year). Such delays weaken the perceived link between childcare use and support payments. Childcare users may see next year’s tax reductions as a windfall rather than a consequence of their childcare choices. Moreover, future tax reductions offer little help to parents with limited budgets who cannot afford non-parental childcare in the current period.
8. Minimising these distortions would involve taxing home production and making childcare expenses tax
deductible.
9. In terms of tax progressivity, there is also an effect working in the opposite direction as deductions keep some lower-income taxpayers out of tax liability altogether. See Keen et al. (2000).
17
DELSA/ELSA/WD/SEM(2005)10
34. An interesting alternative policy design makes childcare expenses deductible when computing means-tested benefits. For instance, childcare costs reduce the income basis used to assess entitlement to housing benefits in the UK. As a result, housing benefits can be higher for families purchasing non-parental care and thus reduce net childcare costs. Tax credits can be more supportive of low-income earners than tax deductions, particularly if they are refundable (i.e. any portion of the credit that exceeds gross tax liabilities is paid out in cash). In this case, they are formally equivalent to cash benefits although, as in the case of tax deductions, parents may have to wait until the next fiscal year before seeing the beneficial effects of tax credits. Other types of childcare benefits provide operate independently from the tax system and provide more immediate support. Childcare-related cash benefits may be targeted towards low-income families, working parents or socially disadvantaged groups, notably lone parents. Support may be conditional on using certain types of childcare such as that provided by approved institutions or specially qualified individuals.
35. In addition, generous support is sometimes available for parents caring for their own children at home (home-care or child-raising allowances). As long periods of complete withdrawal from the labour market harm future career prospects, these payments are detrimental to employment if they promote extended and complete career interruptions.10 Alternatively, home-care allowances may be part of more balanced policy packages that also include effective support for purchased childcare.
36. Countries often operate combinations of these measures. Annex Table A.2 gives an overview of policies adopted in OECD countries summarising relevant details on each of the policy measures. Cash benefits are available to some groups of parents of young children in Australia, Canada, France, Korea and the United Kingdom, providing partial or full compensation for certain types of childcare expenditure. This is shown in column 1, which also specifies any restrictions in terms of the types of care that are covered (i.e. institutional childcare in approved day-care or nursery centres or services of professional carers at their own or the parents’ home). Available tax concessions are shown alongside benefits.
37. While cash benefits and tax concessions help reduce the net costs of childcare to working parents, benefits available to parents engaged in care activities themselves increase their incomes while out of work. These child-raising allowances are distinct from maternity payments or benefits available as part of protected parental leave mandates, which are not considered here. In general, these allowances are only paid to parents who have “primary care” of their children, i.e. parents need to be out of work or working part-time (in which case benefits may be reduced). In Finland and Norway, the benefit payment is contingent on not using formal care facilities. A summary of policy features is shown in column 2 of Annex Table A2. In some cases benefits are (France), or have been (Austria), conditional upon past employment.11 The benefit is typically a flat monthly payment. The replacement rate with respect to
10. Evidence consistently points to a marked decline of (re-) entry wages after prolonged leave periods. Kunze and
Ejrnaes (2004) provide a summary of alternative explanations as well as German evidence for the existence of wage penalties associated with career interruptions after childbirth. A number of studies also show that those going back to work after extended leaves are, on average, unable to rebound to the same earnings levels and participation rates as those taking shorter breaks. One recent analysis using high-quality data for Austria in a “natural experiment” setting is by Lalive and Zweimüller (2005) who study the employment and fertility effects of doubling parental leave entitlements from 12 months to 24 months in the early 1990s. Regarding work patterns, findings point towards markedly lower employment rates after the leave for those taking the new, longer leave. Importantly, lower employment is found to persist even 10 years after childbirth (the authors also evaluate a subsequent reduction of maximum leave durations to 18 months and find increases in employment rates of a consistent magnitude).
11. For new parents from mid-2002 onwards, the Austrian home-care allowance is available for children aged under 2.5 (or 3 in cases where mothers and fathers share the leave mandate), regardless of employment records. Importantly, employment protection only covers periods up to 2 years (and is conditional on work
18

DELSA/ELSA/WD/SEM(2005)10
earnings lost as a result of staying at home is therefore larger for parents with low previous (or potential) earnings. Rates may also be reduced with individual or family income above certain limits. In many countries, the maximum period of benefit entitlement can be long, exceeding 12 months by a large margin and, in a few cases, extending well into compulsory school-age (Hungary and, especially, Australia12). The important point that very long periods away from work can significantly damage women’s future career prospects is discussed in the context of work incentives in Section 3.2 below.
38. Although benefits paid for parental and institutional childcare may co-exist (e.g. in Australia), many countries opt for one of the two alternatives. A small group of countries does not provide any benefits directly to families but instead subsidises childcare fees by either operating public childcare facilities, contributing towards the costs incurred by private facilities, or meeting part of the fees charged by providers. As argued earlier, the reduction of fees can be equivalent to a direct cash transfer to the family and a distinction can be difficult in these cases (like cash benefits, subsidies paid to providers may also depend on the particular situation of the family using childcare services). Column 3 summarises information on some of these supply-side subsidies and shows that these are also widespread in countries that provide direct cash benefits to parents.
2.4. Summing up: Parents’ out-of-pocket expenses
39. In order to arrive at a full characterisation of how childcare costs differ across countries and family circumstances, details of the various cost components have been integrated into the OECD’s tax-benefit models, including fees charged by the provider, benefits, rebates and tax concessions.13 Where sufficient information exists, this makes it possible to arrive at consistent estimates of childcare costs across countries and presents a microeconomic perspective on the effects of childcare on family budgets.
40. One approach for quantifying the net costs of purchasing childcare is to compare all relevant taxes and benefits between a situation where a family purchases childcare and an otherwise similar situation where no childcare services are bought (e.g. because unpaid informal care is available). Subtracting any tax concessions and benefit amounts from the gross fee charged by the childcare provider gives the net cost to the parents, i.e. the net reduction of family budgets or the “out-of-pocket” expenses resulting from the use of centre-based childcare.14 In the results presented below, we identify separately the influence of childcare use on tax burdens and “other benefits”, which are not primarily childcare-related (e.g. family or housing benefits), and show that taking them into account is indeed important.
experience). Parents receiving the allowance can earn a limited amount after a certain period (but, while on employment-protected leave, this is subject to their employer’s consent).
12. In addition to compensation for parental childcare, the means-tested Parenting Payment in Australia also serves purposes (support for children, general income maintenance, notably for lone parents) that are not within the scope of childcare-related instruments in other countries.
13. See www.oecd.org/els/social/workincentives for descriptions of these models and instructions on how to obtain them. Immervoll et al. (2004) provide a discussion of the scope and limitations of tax-benefit calculations based on “typical” households.
14. Typologies of childcare support payments are not free from ambiguities. For instance, should a lower fee payable for the second child be shown as a separate refund/rebate or should fees be shown net of the rebate? As a rule, we have attempted to break down individual components as far as possible in order to aid transparency. Hence, where it was possible to show refunds separately from fees, we have done so. For readers familiar with the childcare cost situation in a particular country, the fee components may thus appear higher than expected if they are used to seeing them net of refunds. The important point is that all relevant components are counted one way or another and that net costs therefore accurately reflect the situation in each country.
19

DELSA/ELSA/WD/SEM(2005)10
41. Results for 23 OECD countries are displayed in Figures 2.3 and 2.4 showing both the net cost of childcare and the effects of individual policy instruments. The calculations relate to full-time care for two children aged 2 and 3 in a typical childcare centre.15 All calculations make use of the information presented in Sections 2.2 and 2.3 and refer to the types of childcare setting described there (as in Sections 2.2 and 2.3 figures for some countries refer to particular cities or regions). Costs vary depending on family situation and earnings level and five situations are shown here as an illustration:
a) A married couple where both spouses work full-time, both earning average wages (100% of APW).
b) The same couple but with one average and one lower-earning spouse (67% of APW).
c) The same couple with both spouses earning below-average wages (67% of APW).
d) A full-time employed lone parent with average earnings (100% APW).
e) The same lone parent with below-average earnings (67% of APW).
42. An appropriate choice of family situations and childcare scenarios is crucial in order to ensure policy relevance. In the model calculations presented below, we consider the resource situation of families with young children and focus on centre-based childcare. Even with this restricted scope, there is considerable heterogeneity across (and within) countries with childcare provided by public and private institutions and childcare prices determined not only by market forces but also by regulations and public support payments to childcare providers and/or users. To obtain results that are informative in an international context, we derive estimates of parents’ net “out-of-pocket” expenditures irrespective of the institutional setups that determine them.
15. The calculations are therefore relevant for the period after maternity leave but before children enter (pre-)
school. The choice of ages also reflects the scope of childcare support policies, which frequently employ age cut-offs that differentiate between very young children up to two years of age and older children aged 3 and above. Clearly, even within this narrow range of family circumstances, actual patterns of childcare use will differ between households. An ideal way to account for the heterogeneity of childcare use would be to assess the costs faced by a representative set of households that captures the diversity of family situations. Yet, empirically-grounded approaches are hampered by a lack of internationally comparable and representative data. More specifically, there are no internationally comparable micro-data that contain all the information (notably income and employment status for each family member as well as childcare use and childcare costs) necessary to analyse how different employment and care patterns may affect family budgets.
20

DELSA/ELSA/WD/SEM(2005)10
Figure 2.3. Overall childcare costs including benefits and tax concessions: two-earner couple, two children (1)
(a) two earners with full-time earnings of 200 (100+100) percent of APW
6 6 6 9 8 7 813 11 10 12
16 18 1821 21 22 19 21
26 29 29
1615
8 10 10 10 11 12 1216 16 18 18
26 28 28 3034 34 34
3842
4851
2524
-50
-40
-30
-20
-10
0
10
20
30
40
50
60
70
German
y
Sweden
Greec
e
Denmark
Finlan
d
Slovak
Rep
ublic
Hunga
ry
Belgium
Norway
Korea
Icelan
d
AVERAGEJa
pan
Austria
Canad
a
France
Netherl
ands
New Zea
land
Austra
liaUSA
Portug
al UK
Switzerl
and
Irelan
d
Chi
ldca
re-re
late
d co
sts
and
bene
fits,
% o
f APW
childcare fees childcare benefitschildcare refund/rebate tax reductionsother benefits net cost
cost in % of family net income (different scale)
Source: OECD tax-benefit models.
21

DELSA/ELSA/WD/SEM(2005)10
Figure 2.3. (cont.)
(b) two earners with full-time earnings of 167 (100+67) percent of APW
6 7 6 7 10 8 914 12 12 13
18 19 18 2025 26 23 25 27 27
34
17 17
7 8 9 9 10 12 1216 16 18 18
25 26 26 2730
34 3438 38 38
51
23 23
-50
-40
-30
-20
-10
0
10
20
30
40
50
60
70
German
y
Sweden
Greec
e
Finlan
d
Denmark
Slovak
Rep
ublic
Hunga
ry
Belgium
Norway
Korea
Icelan
d
AVERAGEFran
ceJa
pan
Austra
lia
Austria
Canad
a
Netherl
ands
New Zea
land
USA
Portug
al
Switzerl
and UK
Irelan
d
Chi
ldca
re-re
late
d co
sts
and
bene
fits,
% o
f APW
childcare fees childcare benefitschildcare refund/rebate tax reductionsother benefits net cost
cost in % of family net income (different scale)
(c) two earners with full-time earnings of 133 (67+67) percent of APW
5 6 6 612 11 10 10 13 15 14 16 15 18 21 21 22 24 24 26
3227
40
17
5 6 7 710 11 12 12 14
17 18 18 18 20 2126 26 27 28
34 34 34
51
20
-50
-40
-30
-20
-10
0
10
20
30
40
50
60
70
German
y
Finlan
d
Sweden
Greec
e
Denmark
Belgium
Slovak
Rep
ublic
Hunga
ry
Norway
France
Korea
Japa
n
Icelan
d
Austra
lia
AVERAGE
Netherl
ands
Austria UK
Canad
a
Switzerl
and
USA
New Zea
land
Portug
al
Irelan
d
Chi
ldca
re-re
late
d co
sts
and
bene
fits,
% o
f APW
childcare fees childcare benefitschildcare refund/rebate tax reductionsother benefits net cost
cost in % of family net income (different scale)
1. Results are for 2001 (2002 for Belgium, France, New Zealand, Sweden, United Kingdom, United States). Two children aged 2 and 3. “Family net income” is the sum of gross earnings plus cash benefits minus taxes and social contributions. See Figure 2.2 and Annex Tables A.1 and A.2 for details and assumptions. Source: OECD tax-benefit models.
22

DELSA/ELSA/WD/SEM(2005)10
43. For parents with two young children, overall childcare costs can be very substantial, even after taking into account all relevant types of government support. Looking first at two-earner couples (Figure 2.3), the average out-of-pocket expenses for two children in full-time care are shown to be above one fifth of average earnings.16 Across countries, the range of cost estimates is very wide and, in fact, comparable to the dispersion of gross fees shown earlier.
44. Centre-based care is most expensive for working couples in English-speaking countries, Portugal and Switzerland (Zürich). In these countries, the out-of-pocket expenses of couples with two young children can consume as much as 20% to 40% of the entire family budget. This is shown by the bars at the bottom of each graph, which express childcare costs as a faction of family net income. At the other end of the spectrum is a group of mostly eastern- and northern European countries where net childcare costs for two children are close to or below 10% of overall family net incomes.17
45. For Austria (Vienna), Ireland, Portugal, New Zealand and the United States (Michigan), inspection of the dark horizontal markers in panels (a), (b) and (c) of Figure 2.3 shows that absolute costs (shown as % of APW) are practically identical for low- and higher-income families. Those on lower incomes therefore need to spend larger portions of their budgets on childcare than better-off families. The proportion of family incomes spent on childcare is driven up not only by childcare costs but also by tax burdens. For instance, while childcare costs are, relative to average earnings, lower in Belgium (Wallonie) than in Korea, much higher tax burdens in Belgium reduce family budgets so that Belgian families in panels (a) and (b) end up spending larger parts of their net income on childcare.
46. Cost considerations are arguably much more important for parents who have to make do without the support of a partner and will therefore need to rely more heavily on non-parental childcare. Support to lone parents considerably reduces out-of-pocket childcare expenses (Figure 2.4). Compared to the two-parent case, costs are almost halved on average across countries with net costs at 10 and 15% of APW for lone parents earning low and average wages, respectively.
47. But Figure 2.4 also reveals that these lower costs can nevertheless consume large parts of net income. In fact in five OECD countries, working lone parents with two children would typically have to spend more than one fourth of their available budget on childcare – an amount many of them will be unable to afford. The poverty status of lone parents is important in this context. An earlier OECD study has shown that lone parents with earnings in the 67% to 100% of APW range have net incomes only slightly above (and sometimes clearly below) commonly-used poverty thresholds.18 Even small childcare expenses will then leave the family at a very high risk of poverty. In a group of about ten countries, this constrained ability to pay for childcare is addressed through generous childcare support policies, which succeed at keeping costs for lone parents at or below one tenth of net income.
48. The ranking of countries differs considerably from the two-parent case. For instance Australian and – especially – British lone parents face below-average costs. While fees in these countries are still among the highest, lone parents are entitled to rebates or childcare-related cash transfers, which turn out to be effective at reducing net costs considerably. Two other English-speaking countries operate similar
16. Note that all cost components are shown as percentages of average (APW) earnings so their sizes are
comparable between the different panels in absolute terms.
17. Availability and use of childcare facilities vary enormously among these “low-cost” countries (Table 2.1 shows coverage rates for under-four year-olds ranging from a marginal 3% in Greece to above 70% in Sweden).
18. OECD (2004b), Figure 2.6.
23
DELSA/ELSA/WD/SEM(2005)10
support payments (New Zealand and United States) which are, however, almost entirely targeted towards low-income lone parents so that those earning even an average wage face very high childcare costs.
49. The appropriate degree of targeting depends on the aims of childcare support policies and the relative priorities between them. Given constraints on government budgets, there may be tensions between the different objectives and the extent to which they can be achieved at the same time. For instance, if the primary aim is to help parents into work in order to lower poverty risks, childcare support should be directed mainly towards those with low wage-earning potential and, especially, lone parents whose participation in the labour market has been shown to be particularly responsive to financial incentives. Another important objective is to provide education and enhance children’s development at an early stage. The structure and targeting of relevant policy measures may, in this case, be less driven by labour supply considerations and more by the desire to provide good-quality childcare for as many children as possible. In practice, different types of childcare support measures in any given country can often be seen as serving different purposes. As a tool for identifying policy reform options, an evaluation of the combined effect of these different measures can then be especially valuable.
50. Taking a closer look at the structure of childcare support revealed in Figures 2.3 and 2.4, it appears that “low-fee” countries tend to provide inexpensive childcare for everybody. For instance, childcare costs in Nordic countries are below-average in all five scenarios. In part, this is a result of the difficulty of targeting supply-side subsidies which are generally used to lower childcare prices. Targeting of family situations and income groups is more prevalent in countries where demand-side subsidies such as rebates and cash transfers are important. In some cases, childcare costs are cut by more than half for lower-income groups (Netherlands, United Kingdom19) while they are reduced to zero from high (Japan) or very high levels (United States), especially for low-income lone parents.
51. Owing to the limited tax liabilities of low-income parents, tax deductions do not perform well at targeting childcare support to those who need it most. As discussed in the previous section, making childcare expenses tax-exempt is desirable for efficiency and horizontal equity reasons. However, if these tax concessions are the main or only support available, low-income parents may not be helped much. This can, for instance, be seen in the case of low-earning Canadian (Ontario) lone parents in panel (b). They do not see the full benefit of the tax reduction and therefore face higher childcare costs than the average earner in panel (a).20
19. Several policy measures combine to reduce out-of-pocket childcare expenses in the United Kingdom. In
addition to income- and employment-tested refunds of actual childcare expenses (shown as “childcare benefits” in Figures 2.3 and 2.4), free part-time care is provided for pre-school children from age 3 (“childcare refund/rebate”). Finally, housing benefits can increase considerably for low-income lone parents using childcare as the remaining net childcare costs can be subtracted from the income base used for calculating benefit entitlements (“other benefits”)
20. In Ontario, parents not claiming childcare costs can receive the National Child Benefit Supplement (NCBS) as well as (income-tested) benefit (Ontario Childcare Supplement, OCCS). However, those using formal childcare can in certain cases claim a higher benefit instead. In the calculations, it is assumed that childcare users do claim this latter benefit and, as a result, lose the unconditional ones. Compared to the “no childcare” scenario, parents therefore lose some benefits but gain the – larger – childcare benefit. For the lone parent earning average wages, the difference between these benefits turns out to be larger than for the low-income lone parent which further reduces overall costs of the average earner relative to low-wage lone parents.
24

DELSA/ELSA/WD/SEM(2005)10
Figure 2.4. Overall childcare costs including benefits and tax concessions: lone parents, two children (1)
(a) full-time earnings = 100 percent of APW
5 4 5 6 5 9 11 9 10 12 13 15 16 17 19 19 20 2127 27
4238
53
17
3 4 4 5 5 7 8 8 912 12 13 13 15 17 17 18 18
24 26
34 34
51
16
-50
-40
-30
-20
-10
0
10
20
30
40
50
60
70
German
y
Norway
Greece
Finlan
d
Sweden
Denmark
Belgium UK
Icelan
d
Slovak
Rep
ublic
Hunga
ry
France
Netherl
ands
Austra
lia
AVERAGEAus
triaKore
a
Switzerl
and
Japa
n
Canad
a
Portug
al
New Zea
land
USAIre
land
Chi
ldca
re-re
late
d co
sts
and
bene
fits,
% o
f APW
childcare fees childcare benefitschildcare refund/rebate tax reductionsother benefits net cost
cost in % of family net income (different scale)
(b) full-time earnings = 67 percent of APW
0 2 2 3 4 5 4 6 7 7 512 12 12 12
15 16 17
25 26 28
42
58
14
0 1 2 2 3 3 3 3 4 4 48 9 9 10 12 12
17 17 17
32
51
10 10
-50
-40
-30
-20
-10
0
10
20
30
40
50
60
70
Japa
nUSA
Finlan
d
German
y
Norway
Denmark
Sweden
Greec
e
Belgium
Netherl
ands UK
France
Austria
Icelan
d
Austra
lia
New Zea
land
AVERAGE
Slovak
Rep
ublic
Hunga
ry
Switzerl
and
Portug
al
Korea
Canad
aIre
land
Chi
ldca
re-re
late
d co
sts
and
bene
fits,
% o
f APW
childcare fees childcare benefitschildcare refund/rebate tax reductionsother benefits net cost
cost in % of family net income (different scale)
1. Results are for 2001 (2002 for Belgium, France, New Zealand, Sweden, United Kingdom, United States). Two children aged 2 and 3. “Family net income” is the sum of gross earnings plus cash benefits minus taxes and social contributions. See Figure 2.2 and annex Tables A.1 and A.2 for details and assumptions.
Source: OECD tax-benefit models.
25

DELSA/ELSA/WD/SEM(2005)10
3. Care to work? The net impact of employment on family resources.
52. Calculations of childcare costs faced by working parents are useful for understanding some of the most important features of childcare-related policies. In particular, the results presented in the previous section show the additional costs incurred by parents who are already in work and consider purchasing centre-based childcare. Yet, this is not sufficient for evaluating how different employment patterns impact on family resources. Parents’ decisions about childcare use and employment will often be interconnected. In order to evaluate the financial work incentives facing parents, it is therefore necessary to integrate the analysis of childcare cost into a more comprehensive assessment of family resources in and out of work.
53. The availability and cost of childcare is a particularly important factor for parents with young children. It is, however, not the only relevant factor, particularly when thinking about the attractiveness of employment versus household work. For instance, even in countries investing heavily in childcare support, the financial payoff from employment may still be limited or non-existent if other policies fail to provide suitable work incentives. Apart from childcare costs, the financial gains from work are determined by benefit entitlements, the tax treatment of employment incomes and, most obviously, the level of in-work earnings.
54. The following two sub-sections evaluate the financial gain from employment for lone parents and second earners in two-parent households. Before looking at the overall effect of all relevant policy instruments taken together, the impact of employment on family resources is first analysed without taking into account childcare costs.21 This permits a more detailed examination of the role of non-childcare-related taxes and benefits and provides a suitable context for assessing the relative importance of childcare costs for work incentives. In addition, the financial incentives before childcare costs are relevant for parents who have access to unpaid (informal) care. More generally, a “no childcare cost” scenario provides a natural starting point for assessing the sensitivity of household resources to the choice of care arrangement.
3.1. Sharing work efforts and opportunities: The roles of family taxation and social benefits
55. For potential employees, the financial gain from taking up a job is affected by the tax treatment of their in-work incomes as well as any other mandatory charges, notably social contributions. In addition, those entitled to receive social benefits while non-employed, may experience a loss of benefit payments once they take up a job. In certain circumstances, the combination of taxes and benefit withdrawals can result in situations where available employment opportunities are less financially attractive than the alternative of no (or no formal) work. Given that numerous types of social transfers are specifically targeted towards low-income households, especially if children are present, parents in these households are particularly likely to face adverse work incentives.
56. The combined effects of taxes and benefits can be assessed by comparing net household incomes before and after a transition into employment. Figure 3.1 shows calculations using OECD tax-benefit models for selected countries22 and for the same two household situations considered earlier (a married couple with two children and an otherwise similar lone-parent household). In both cases, it is assumed that no childcare services are purchased. The net gain from work is shown by plotting the relative increase in current household income that results from taking up employment at different earnings levels. Figure 3.1a examines the percentage increase in family net income following a transition into work for a non-employed 21. Previous international studies on tax and benefit design and its implications for employment patterns tended to
ignore childcare costs. The results in this sub-section can therefore be related to this existing literature. See, for instance, O’Donoghue and Sutherland, 1999; OECD, 2002b; OECD, 2004b.
22. The full set of country-specific results is shown in Figures 3.4 and 3.5 in the next section.
26

DELSA/ELSA/WD/SEM(2005)10
spouse of an average earner while Figure 3.1b relates to a lone parent. Before the transition into employment, the non-employed individual is assumed to be labour market “inactive” and not receiving unemployment benefits. However, depending on entitlement rules in each country, other means-tested transfers such as housing benefits or social assistance, are available as applicable (certain benefits, notably in-work benefits, may also be received after the transition into work).23
57. Before discussing these results, it is important to note that, while of interest from a work-incentives perspective, the relative income gain only tells part of the story. Countries differ substantially in terms of the minimum safety nets they provide for workless households (see annex Figure A.1). For example, an examination of the income situation of workless lone-parent families shows that only a few countries provide minimum-income benefits sufficient to lift them close to 50 percent of median household incomes (a commonly-used relative poverty threshold). In five countries, these families are likely to experience deep poverty with out-of-work incomes ranging from zero to 25 percent of median incomes. These differences need to be borne in mind when interpreting relative income gains as families with extremely low incomes can be expected to be more concerned about absolute income increases.
58. With this qualification in mind, it is evident from Figure 3.1 that even low-wage employment brings substantial relative income gains in most OECD countries if work-related costs, such as for childcare, are ignored. Averaged across countries, a low-wage full-time job at half the average wage boosts household net incomes by 19 percent in the lone-parent case and by 41 percent for a married second earner (dot-shaped markers).24 The dispersion around these country averages is substantial, however.
59. Relative to the “no-work” situation, low-wage work tends to pay less for lone parents than for parents married to an average earner.25 This is a consequence of specific income-related benefits available to lone parents in many countries.26 These transfers, or large portions of them, are lost when taking up employment, leading to the well-known problem of prolonged benefit dependency. A striking case of such an inactivity trap is found for the Slovak Republic where, rather than being phased out continuously, benefits are stopped abruptly for lone parents earning more than the allowable maximum. This leads to a situation where, even before accounting for childcare costs, working lone parents with two children lose income unless they earn wages of at least 90 percent of average earnings. Other countries providing generous income support to non-working lone parents operate more moderate benefit phase-outs for those starting a new job. Yet, the withdrawal of these benefits can still result in very limited gains from work for these individuals (e.g. in France). This will be important when considering the role of childcare costs below. If gains before accounting for these additional work-related expenses are already limited, parents may face adverse work incentives even with well-developed childcare support policies in place. 23. Further details about relevant assumptions and definitions are provided in OECD (2004b), Annex A. One of
them concerns the modelling of any housing-related benefits. These are computed assuming rented accommodation with rental costs (including any service charges) equal to 20% of APW earnings throughout.
24. The “average” is the country median in order to contain the influence of the very large relative gains for lone parents in a few countries.
25. There are a few exceptions. As indicated above, benefits available to labour-market inactive lone parents are very low in several countries (e.g. United States). The relative gain from taking up employment is therefore very large in these cases.
26. For a number of countries, upward-bending graphs for lone parents indicate entitlement limits built into income-related benefits or tax advantages: larger income gains are possible once these benefits are no longer withdrawn for every additional unit of employment income. In a few countries, policy measures are in place to counter the adverse effects of benefit withdrawals on work incentives during the initial period of employment. These can take the form of additional one-off payments for those making a transition into employment (Belgium, Ireland, Netherlands) or of delayed benefit reductions so that employment initially provides a larger income (e.g. Portugal). Details on these schemes are provided in OECD (2004b), Table 1.11.
27

DELSA/ELSA/WD/SEM(2005)10
Figure 3.1. Starting employment: Relative gain in household income without childcare costs (1)
(a) married couple, OECD average and selected countries
-25
0
25
50
75
100
125
150
175
200
30 50 70 90 110 130 150earnings, % of APW
gain
in h
ouse
hold
inco
me,
%
-25
0
25
50
75
100
125
150
175
200
OECD-28
Hungary
Denmark
United States (Michigan)
New Zealand
Korea
Slovak Republic
France
United Kingdom
(b) lone parent, OECD average and selected countries
-25
0
25
50
75
100
125
150
175
200
30 50 70 90 110 130 150
earnings, % of APW
gain
in h
ouse
hold
inco
me,
%
-25
0
25
50
75
100
125
150
175
200
United States (Michigan) Hungary
OECD-28
France
UnitedKingdom
New Zealand
Korea
Denmark
1. The OECD-28 line represents the median over 28 countries. Results for year 2001 (2002 for Belgium, France, New Zealand, Sweden, United Kingdom, United States). Relative income gain resulting from a transition from labour-market inactivity into a full-time job paying various fractions of the average production worker wage (APW). Benefit provisions and other government support are not taken into account if they are only available on a temporary basis immediately following the transition into work. Children are aged 2 and 3. First earner in two-parent families is full-time employed earning the APW wage. Details on the model assumptions are provided in OECD (2004b).
Source: OECD tax-benefit models.
28

DELSA/ELSA/WD/SEM(2005)10
Figure 3.2. Moving into low-wage jobs: the role of taxes and benefits
Change in taxes and benefits relative to earnings in the new job, 2002. (1)
(a) second earner; no purchased childcare
7
14 15 16 1721 22 22 24 24 25 27 28 29 30 30
3338 40
44 4650 50
5762 63 64
69
35
-20
-10
0
10
20
30
40
50
60
70
80
90
100
110
120
130
Korea
United
States
Luxe
mbourg
Greece
Portug
alSpa
in
New Zea
land
Switzerl
and
Irelan
d
Austria
United
King
domJa
pan
Sweden
Austra
lia
Czech
Rep
ublic
Norway
Netherl
ands
AVERAGE
Canad
aIta
ly
Poland
Icelan
d
Belgium
German
y
Finlan
d
Hunga
ry
France
Slovak
Rep
ublic
Denmark
perc
ent o
f gro
ss e
arni
ngs
in n
ew jo
b
decrease in benefitsincrease in social contributionsincrease in income taxtotal increase in effective tax burden (Average Effective Tax Rate)
(b) lone parent; no purchased childcare
16
39
4953 54
58 58 59 5965 67 70 70
74 76 78 78 80 82 82 8285 88
9399
123
6868
-2
-20
-10
0
10
20
30
40
50
60
70
80
90
100
110
120
130
Italy
Greece
United S
tates
Hunga
ry
Australi
a
Irelan
dSpa
in
United K
ingdo
m
Canada
Sweden
Norway
Korea
Iceland
AVERAGE
Portuga
l
Poland
Finland
Belgium
New Zealan
d
Japa
n
Netherl
ands
Luxe
mbourg
Czech
Repu
blic
Austria
German
y
Denmark
Switzerl
and
Franc
e
Slovak R
epub
lic
perc
ent o
f gro
ss e
arni
ngs
in n
ew jo
b
decrease in benefitsincrease in social contributionsincrease in income taxtotal increase in effective tax burden (Average Effective Tax Rate)
1. Transitions from labour-market inactivity to a full-time low-wage job (67% of APW). All tax and benefit changes relate to the household as a whole. The Average Effective Tax Rate is the fraction of earnings that does not produce a net income gain as it is offset by higher taxes and lower benefits. “Benefits” include minimum-income/social assistance benefits, housing benefits, employment-conditional (“in-work”) benefits and family benefits (incl. special lone-parent benefits and childcare related benefits that do not depend on the use of purchased childcare, such as homecare or child-raising allowances; in France, it is assumed that parents have sufficient work records to be entitled to the Allocation Parentale d’Éducation). Other childcare benefits are excluded as are childcare costs, one-off employment-conditional benefits or those that are available only for a limited period following a transition into work. Calculations are consistent with those shown in Figure 3.1. See notes there for further details.
Source: OECD tax-benefit models.
29

DELSA/ELSA/WD/SEM(2005)10
60. Figure 3.2 examines the driving forces behind these results more closely and indicates which types of policy features give rise to adverse work incentives. It shows by how much income taxes, employees’ social security contributions and cash benefits change following a transition from labour market inactivity to employment. Cash benefits include minimum-income/social assistance benefits, housing benefits, employment-conditional (“in-work”) benefits and family benefits (including special lone-parent benefits and childcare-related benefits that do not depend on the use of purchased childcare, such as homecare or child-raising allowances). Changes are shown relative to gross employment incomes in the new job for a parent taking up low-wage employment (67 percent of APW). The horizontal markers indicate the fraction of in-work earnings that is effectively “taxed away” for the parent entering work. This so-called “Average Effective Tax Rate” (AETR) is the sum of tax increases and benefit losses that result from taking up employment.
61. The country average in panel (b) confirms the dominating role of benefit withdrawals in the case of lone parents. On average, lone parents starting a low-wage job lose more than half of their gross earnings to reduced social benefits and a further 17 percent due to taxes and contributions they are liable to pay as employees. This leaves only one third of gross earnings as an addition to household income, which, as shown below, may not be enough to cover work-related expenditures such as for childcare.27
62. Given the importance of benefit reductions, it is interesting to ask whether more generous out-of-work benefits are directly associated with less favourable work incentives. To what extent is a trade-off unavoidable between policies that make work pay on one hand, and poverty avoidance – the primary aim of income-tested minimum-income benefits – on the other? Reading the work incentive indicators from Figure 3.2 in conjunction with the income status of workless lone parents in Annex Figure A1, it is evident that the adverse effects of benefit claw-backs are indeed small in a number of countries with very high poverty risks for non-employed lone parents (Greece, Hungary, Italy, United States). At the same time, the results indicate that work incentives depend on both benefit levels and the particular design of tax-benefit policies. For instance, Australia, Canada, Poland, Sweden and the United Kingdom succeed at combining a relatively high degree of poverty protection with below-average benefit withdrawal rates.
63. One costly way of combining poverty avoidance with strong financial work incentives would be to make social transfers less targeted towards low-income families by increasing the generosity of so-called “universal family benefits”. A less expensive approach consists of exempting certain parts of in-work earnings from relevant income tests (e.g. Australia, Canada). While this widens the group entitled to income-related benefits (and hence the number of people affected by benefit withdrawals), it is likely to increase employment overall as it improves work incentives for individuals with low earnings potential whose labour supply is known to be particularly responsive to financial incentives.28 Similarly, low tax burdens for low-wage workers in particular help reduce the risk of discouraging individuals from taking advantage of available vacancies or actively seeking out job opportunities. Examples can be seen in the lower panel of Figure 3.2. Lone parents in some countries obtain above-average income gains in spite of very significant benefit losses upon taking up a job (Ireland, Spain) while for others, similar extents of benefit withdrawals are further aggravated by relatively large tax burdens and, overall, result in severely limited payoffs from low-wage employment (e.g. Belgium, Germany).
64. An alternative approach to improving work incentives involves paying cash benefits to low-wage employees. A number of countries have introduced such wage supplements to strengthen work incentives 27. AETRs faced by lone parents generally decline for better-paying jobs. However, additional calculations (not
shown) indicate that at 150% of APW, they frequently still exceed 60%.
28. The welfare implications of reducing barriers to work for individuals with low wage-earning potential have been studied by Immervoll et al. (2005). This study also surveys evidence on the responsiveness of labour supply to financial incentives.
30

DELSA/ELSA/WD/SEM(2005)10
for lone parents in particular. In the United States, the Earned Income Tax Credit (EITC) is the largest anti-poverty program at the federal level (the EITC is shown as a negative tax in Figure 3.2b). In other countries (Ireland, United Kingdom and, more recently, Belgium, France, New Zealand), employment-conditional benefits are operated alongside comprehensive “safety-net” benefits seeking to ensure acceptable living standards of workless households. Essentially, in-work benefits are based on a reversal of benefit conditionality where, rather than targeting transfers to the poor at large, including those with no earnings at all, employment is a pre-requisite for entitlement. In principle, these benefits will partly offset the adverse incentives associated with the loss of out-of-work benefits. However, their effectiveness at increasing employment will depend on the specific structure of labour markets and the resources governments are willing to commit to this type of measure. Except for the United States, the United Kingdom and Ireland, the size of in-work benefits is still very small compared to other social transfers. A detailed analysis of relevant policy rules in OECD countries is provided in OECD (2004b).29
65. Compared to lone parents, AETRs in the two-parent scenario are almost entirely driven by the tax and contribution burden as withdrawals of income-related transfers are largely not relevant (upper panel of Figure 3.2). In most countries, even if one parent is inactive, entitlements, if any, are low due to the earnings of the working parent. Yet the graphs also indicate the significant influence of entitlements to – sometimes generous – home-care and child-raising allowances available to stay-at-home parents (Australia, Czech Republic, Finland, France, Hungary, Slovak Republic).
66. In countries operating joint income tax systems, second earners can be particularly likely to face above-average income tax burdens when moving into work as the marginal tax rate is pushed up by the earnings of their partners (e.g. Germany, Ireland). This mechanism is particularly relevant in the case of low-wage work. While low-wage earners are often taxed at low rates or are altogether exempt from paying income tax, their marginal tax rates in a joint tax system are pushed upwards by the earnings of their partner. Large increases in household tax burdens can then significantly reduce the gains from taking up employment for potential second earners. The disincentive effects associated with joint tax systems have attracted considerable attention in policy discussions. Looking at income taxes across countries, however, it is evident that the income assessment unit is not the only driving force of second earners’ tax burdens. As Figure 3.2 illustrates, the overall size of income-related taxes (in terms of revenues) can have a larger effect on second earners’ tax liabilities than the tax assessment unit. Indeed, tax disincentives for second earners in high-tax economies using individual-based taxes (such as the Scandinavian countries) are often higher than in lower-tax countries employing joint tax systems (France, Luxembourg, Spain, United States).
67. During the past three decades, most OECD countries have moved towards individual taxation, partly in recognition of the positive externalities that increased employment of second earners can bring. To understand tax incentives and their implications for employment patterns it is necessary, however, to look beyond a simple distinction between individual or joint tax systems.30 The results above show that, whether family or individual-based, tax systems in several OECD countries continue to cause significant
29. Country information is also available on the Internet at www.oecd.org/els/social/workincentives.
30. Even if taxable income is formally assessed separately for each individual, many tax systems exhibit other “joint elements” aimed at lowering tax burdens for families with only one earner. When the previously non-employed partner takes up employment, these tax concessions are withdrawn, reducing the income gain from participation in the labour market. For instance, unused tax-free allowances are often transferable between partners (e.g. Denmark, Iceland, Netherlands). If the second spouse finds employment, a part of this allowance is no longer available to the first earner leading to relatively large income tax increases for the family as a whole. Secondly, joint tax systems could (but rarely do) incorporate measures that reduce the disincentives for second earners. These could take the form of special “second-earner” allowances or exemptions. Kleven and Kreiner (2005) show that combining a joint tax system with such an allowance can minimise efficiency losses.
31
DELSA/ELSA/WD/SEM(2005)10
work disincentives for potential second earners. Reducing them is one important ingredient of policies to remove obstacles to female employment.
3.2. Working parents: What is left after paying for childcare?
68. Unless parents are able and willing to share all childcare responsibilities between themselves, they need to find alternative care arrangements. Given existing patterns of market and domestic work31, the availability and cost of non-parental care is a crucial determinant of the feasibility of female employment in particular. Since childcare can be a major expenditure item for families, these costs should be accounted for when assessing work incentives. Box 1 summarises and discusses available evidence on the relationship between childcare costs and employment behaviour.
Box 1. Labour supply effects of the cost of purchasing childcare: Empirical evidence
Parents’ expenditures for non-parental childcare reduce family disposable income. One useful starting point is therefore to consider how responsive labour supply is to the income gain from employment in general, i.e. without distinguishing whether income changes are caused by childcare costs or, for instance, by changes in tax rates. Although results are not available for all countries, there is a vast empirical literature on the income elasticities of labour supply. The broad consensus among labour economists is that changes in participation are a more significant influence on overall labour supply than changes in the number of working hours, that labour supply is more elastic for women than for men, and that low-income groups and lone parents react more strongly to financial incentives than other groups. Looking across studies, 0.2 to 0.5 is perhaps a reasonable conservative range for the participation elasticity of women with low potential earnings (i.e. a 1% reduction of the income gap between working and not working is associated with a 0.2-0.5% decline in participation). If one would translate the percentage changes of childcare costs into a percentage change of disposable incomes, these elasticities could provide clues about the potential effects of these costs on employment.1
Yet, such estimates are in fact of limited value when considering the behavioural effects of childcare costs. Changes in these costs do not simply lead to a proportional increase in childcare expenditure (and thus an income reduction of the same absolute magnitude). Instead, there is an intervening process, whereby parents choose the quantity of childcare. With unchanged childcare quality, higher costs can be expected to lead to lower use. In addition, supply constraints (limited availability of childcare places or limited opening hours) may prevent parents from increasing the use of purchased care when prices drop. For a number of reasons, expenditure changes can thus be expected to be smaller than the variation in childcare prices. Investigating the employment effects of childcare costs therefore involves estimating parents’ behaviour in terms of both childcare demand and labour supply.
Studies following such an approach consistently find a negative impact of childcare costs on maternal employment (the impact on fathers’ employment patterns has been studied less frequently).2 Research has mostly focussed on North America (Andersen and Levine, 2000; Michalopoulos and Robins, 2002; Powell, 2002), the United Kingdom (Blundell et al., 2000) and, more recently, continental Europe (Choné et al., 2003; Del Boca and Vuri, 2004; Kornstad and Thoresen, 2005; Wrohlich, 2004) and Australia (Doiron and Kalb, 2004). From these studies, one can conclude that changes in childcare costs do not seem to produce large movements of overall employment rates but that they are important for individual sub-groups. In most cases, labour supply responses are found to be substantial for low-skilled women or low-income families, for mothers of younger children and for lone parents. Full-time employment rates react significantly more strongly to changes in childcare costs than part-time employment rates.
Yet, the precise estimates vary substantially. Depending on the study and the group of women analysed, participation elasticities range anywhere from 0 to -1. To a large extent, this variation is due to methodological and data-related differences (for instance, so-called “structural” econometric models, which are based on an explicit utility specification, are generally associated with smaller elasticities). Beyond technical differences, however, results are driven by the characteristics of existing childcare policies. These should be considered carefully to avoid misinterpreting the available evidence, especially when employment effects are compared across countries.
31. Whether voluntary or not, women still spend significantly more time on childcare and other domestic activities
than men. For evidence, see Smith (2004), Stancanelli (2003) and OECD (2001), Chapter 4.
32

DELSA/ELSA/WD/SEM(2005)10
Some of the relevant factors are listed below.
• Childcare costs faced by parents differ enormously both within and between countries. Where cost differences are large, a comparison of elasticities provides only a partial picture of the influence of childcare costs on employment. While knowing the labour supply consequences of a given percentage change of childcare costs is of interest when considering alternative childcare policies in a given country, elasticities are not sufficient to assess whether childcare costs are “more important” for employment in one country than in another. Since the percentage change of employment rates or working hours will tend to be small in countries where childcare costs are low, detailed information on these costs – as derived in this paper – is a prerequisite for making such comparisons (the same applies to cost differences within a country). In particular, elasticities are not very useful where existing costs are very low (the net costs can be zero in some cases).
• There are barriers to the use of childcare that are not primarily cost-related. Supply is severely constrained in some countries or regions. Where demand exceeds supply, costs have a limited impact on childcare use and, thus, labour supply (see Del Boca and Vuri, 2004). For similar reasons, employment effects of childcare costs will tend to be small if parents do not use available childcare services for reasons of insufficient care quality.
• Other social and fiscal policies can also present employment barriers. Results in this paper show that adverse work incentives are frequently caused by high tax burdens or the withdrawal of benefits once individuals start to work. Small labour supply effects of childcare costs then do not necessarily suggest that high childcare expenses do not present an obstacle to employment. Rather, costs may need to be brought down while at the same time re-balancing tax and benefit provisions to address existing work incentive issues.
• Labour supply studies differ with respect to the particular childcare cost variable they investigate. As shown in Section 2 above, changes in childcare fees (the prices charged by providers) are often partially compensated by tax concessions or childcare-related cash transfers to parents. Changes in these fees will then result in smaller expenditure changes than changes in the net cost to parents. As a result, studies analysing the effect of altering the net costs to parents, tend to find larger labour supply effects than those investigating the impact of higher or lower fees.
_______________
1. Doiron and Kalb (2002) use an approach along these lines to illustrate the potential labour supply effects of childcare costs in Australia.
2. Other types of evidence also suggest a negative association between childcare costs and female employment. This includes cross-country studies using aggregate data (see Jaumotte, 2003, who uses data on public childcare spending per child rather than the actual cost faced by families), as well as evidence from surveys asking parents about the reasons for not working outside the home (Woodland et al., 2004).
69. To compare the effects of childcare costs on family resources across countries, we build on the approach used in the preceding sub-section and compare incomes before and after a transition into employment for different “model families” and a range of different earnings levels. Importantly, family incomes are now measured after childcare cost assuming that households where all adults are employed purchase childcare services on a full-time basis and that families with at least one labour market inactive adult do not require any non-parental childcare. As before, children are aged 2 and 3 and childcare is assumed to be provided on a full-time basis for both children. The resulting costs estimates might therefore usefully be considered an upper bound of the costs actually faced by most parents (although the fees used as a basis for the calculations are mostly country averages so that fees charged can be even higher in some areas or for some types of care).
70. Figure 3.3 displays average income gains across these countries and shows that net childcare costs are indeed a critical factor for parents’ employment decisions. Compared to a “no childcare”
33

DELSA/ELSA/WD/SEM(2005)10
scenario, the financial reward of employment is reduced considerably – by more than half for wages at or below 70% of APW. At low earnings levels, the net gain from employment is only slightly above zero on average suggesting that parents in a number of countries face a net loss when taking up employment. A striking finding is that, on average, the gains are about the same for lone parents and second earners when the cost of childcare is taken into account while they are much lower for lone parents in a “no childcare” setting. This suggests that most countries target childcare support towards (low-wage) lone parents.
Figure 3.3. Starting employment: Income gain net of childcare cost.
Country average. (1)
-25
0
25
50
75
100
125
30 50 70 90 110 130 150earnings , % of APW
gain
in h
ouse
hold
inco
me,
%
-25
0
25
50
75
100
125second earnersecond earner; no childcarelone parentlone parent; no childcare
1. Median values over 23 countries, see Figures 3.4 and 3.5 for details.
Source: OECD tax-benefit models.
71. Detailed results for each country are reproduced in Figures 3.4 (for two-parent families) and 3.5 (for lone parents). For each country and family type, the graphs display the net income gain of employment at different earnings levels with and without childcare. The distance between the “with” and “without” childcare numbers represents the influence of childcare costs on work incentives. Since childcare fees can vary substantially within countries, alternative calculations for “low” and “high” fees are shown as a corridor around the central estimate (the central estimate corresponds to the fee information summarised in annex Table A1).32
72. Exploring the effects of alternative fee levels in this way aids in the interpretation of the calculations, especially for countries where fees are known to vary considerably, depending on childcare institution, region, etc. Another reason why it is interesting to assess work incentives for a range of different situations is that such computations can be used to examine a broad range of “what-if” questions that help shed light on the mechanics of existing policies and on the potential effectiveness of measures aimed at improving work incentives. More specifically, the results provide an indication of the effectiveness of policies aiming to influence childcare fees or wage levels. The calculations show to what 32. Note that where information on “typical” fees is missing or incomplete, Annex B provides a detailed set of
graphs which allow readers to analyse the income gain for different hypothetical or “plausible” fee levels (Czech Republic, Italy, Poland, Spain). No results are yet shown for Luxembourg as information on both fees and childcare benefits was unavailable at the time of writing.
34

DELSA/ELSA/WD/SEM(2005)10
extent lower childcare fees (or higher wages) would translate into improved work incentives while accounting for the fact that the intended effects of policy action can be either mitigated or reinforced by existing measures in other areas.
Table 3.1. Work incentives and childcare costs
married couple
low average high
lowDenmarkHungarySlovak Republic
Finland (-)Iceland
Sweden
average Finland (+) BelgiumNorway
GreeceKorea
high
Australia (+)IrelandNew Zealand (-)Portugal (-)Switzerland (Zürich)United Kingdom
Australia (-)Austria (Vienna)Canada (Ontario)France (+)Japan (-)NetherlandsPortugal (+)United States (Michigan)
France (-)Japan (+)New Zealand (+)
Financial incentives to take up employment (Net Income Gain)
Impa
ct o
f chi
ldca
re c
ost o
n in
com
e ga
in
(b) lone parent
low average high
low
Austria (Vienna) (-)DenmarkFrance (-)Slovak Republic
BelgiumFinlandGermanyIcelandJapan (-)Netherlands (-)Portugal (-)
GreeceNorwaySwedenUnited Kingdom (-)United States (Michigan) (-)
averageAustria (Vienna) (+)France (+)Netherlands (+)
Australia (-)Hungary
high
Canada (Ontario)IrelandJapan (+)Korea (-)New ZealandSwitzerland (Zürich)United Kingdom (+)
Australia (+)Portugal (+)
Korea (+)United States (Michigan) (+)Im
pact
of c
hild
care
cos
t on
inco
me
gain
Financial incentives to take up employment (Net Income Gain)
Notes: A country is classified in more than one cell if the relative position of that country differs significantly for low-wage (-) and higher-wage (+) jobs.
Source: Figures 3.4 and 3.5.
35

DELSA/ELSA/WD/SEM(2005)10
73. Existing policy regimes cause hugely different outcomes for parents across countries. For instance, for lone parents moving into low-wage employment, income gains range from plus 50% and more (Australia, Hungary, Sweden, United States) to minus 30% (Korea, Ontario, Slovak Republic, Switzerland), reflecting the heterogeneity of policy configurations across countries. It is also evident, however, that very different institutional setups can lead to remarkably similar outcomes. To facilitate the presentation of these results, individual countries can be grouped according to the net income gain and the extent to which childcare costs drive the results. A resulting set of clusters is shown in Table 3.1. Countries towards the bottom left corner are those where childcare support policies would be most crucial in order the address existing incentive issues. It is striking that the groupings do not mirror commonly-used categorisations in terms of welfare state regimes. They also show that adverse work incentives can occur as a result of childcare costs or because of other factors. Both these observations suggest that no simple set of policy prescriptions is appropriate for addressing the observed work incentive issues but that policy responses need to be multi-faceted and carefully tailored to the situation in each country.
74. Weak or non-existent financial work incentives are found in a large number of countries. In fact, in more than a third of them, lone parents with low prospective wages are better off (sometimes substantially so) staying at home collecting welfare benefits than seeking employment (negative income gains in Figure 3.5). The cost of childcare acts as a major barrier to work in some of these cases (Canada, Ireland, Korea, New Zealand, Switzerland) but inactivity traps are also a problem where childcare is much more affordable for low-wage lone parents (Austria, Denmark, France, Slovak Republic). For instance, in France where childcare support is well developed, even small childcare expenses leave working lone parents with less money to spend compared to the “no work” situation. Yet, the payoff from employment is shown to be very low even without childcare (dashed line in Figure 3.5). Clearly, childcare policies are not a suitable approach to make work pay in these cases; instead, addressing weak work incentives will involve rebalancing tax and benefit policies discussed in the previous section.
75. Conversely, an inspection of the graphs for Canada (Ontario) and Ireland identifies childcare costs as the main culprit of inactivity traps. Reducing the very high childcare fees would move income gains towards the dashed line, which would go a long way towards making employment more attractive. For instance, the graphs show that reducing fees by one third would result in above-average work incentives for Irish lone parents. Achieving price reductions of this magnitude, however, requires strong and sustained policy commitment and most likely involves a combination of supply-side measures. This includes subsidies to reduce the cost of childcare providers but also direct investment in childcare facilities as high start-up costs can hold back investment, especially in disadvantaged areas that may be less attractive to privately-owned childcare operators (but where facilitating employment for mothers can be vital to contain poverty risks).
76. Fees are also high in Canada (Ontario) but the results suggest that a broader range of make-work-pay initiatives is required to address the disincentives for low-wage lone parents in this case. Figure 3.5 shows that, in contrast to all other countries, the gap in Ontario between the “no childcare” and “childcare” scenarios narrows at higher earnings levels. This implies that childcare support is targeted towards higher-income families, who benefit disproportionately from the tax-deductibility of childcare expenses (see footnote 21). As discussed earlier, there are good reasons for treating childcare costs as work-related expenses and, as such, making them tax-deductible Yet, additional support is needed if lone parents with low prospective wages are to benefit from seeking employment. One way to achieve this would be to combine tax-deductibility with a refundable tax credit (as in Belgium or New Zealand).
36

DELSA/ELSA/WD/SEM(2005)10
Figure 3.4. Starting employment for second earners: income gain net of childcare cost
different earnings levels (1)
Australia
-50
-25
0
25
50
75
100
125
150
30 50 70 90 110 130 150earnings, % of APW
gain
in h
ouse
hold
inco
me,
%
-50
-25
0
25
50
75
100
125
150
minimum w age
Austria (Vienna)
-50
-25
0
25
50
75
100
125
150
30 50 70 90 110 130 150earnings, % of APW
gain
in h
ouse
hold
inco
me,
%-50
-25
0
25
50
75
100
125
150
Belgium (Wallonie)
-50
-25
0
25
50
75
100
125
150
30 50 70 90 110 130 150earnings, % of APW
gain
in h
ouse
hold
inco
me,
%
-50
-25
0
25
50
75
100
125
150Canada (Ontario)
-50
-25
0
25
50
75
100
125
150
30 50 70 90 110 130 150earnings, % of APW
gain
in h
ouse
hold
inco
me,
%
-50
-25
0
25
50
75
100
125
150
Denm ark
-50
-25
0
25
50
75
100
125
150
30 50 70 90 110 130 150earnings, % of APW
gain
in h
ouse
hold
inco
me,
%
-50
-25
0
25
50
75
100
125
150Czech Republic
-50
-25
0
25
50
75
100
125
150
30 50 70 90 110 130 150earnings, % of APW
gain
in h
ouse
hold
inco
me,
%
-50
-25
0
25
50
75
100
125
150
Insuf f icient information on childcare fees. See Annex Figure B.1 for scenarios incorporatingdif ferent hypothetical fee levels.
A u s t r a lia
'typical' childcare fee OECD-23 Average high/low fee: +/- 1/3 no childcare
Source: OECD tax-benefit models.
37

DELSA/ELSA/WD/SEM(2005)10
Figure 3.4. Second earners (cont.)
Finland (Hels ink i)
-50
-25
0
25
50
75
100
125
150
30 50 70 90 110 130 150earnings, % of APW
gain
in h
ouse
hold
inco
me,
%
-50
-25
0
25
50
75
100
125
150France
-50
-25
0
25
50
75
100
125
150
30 50 70 90 110 130 150earnings, % of APW
gain
in h
ouse
hold
inco
me,
%-50
-25
0
25
50
75
100
125
150
minimum w age
Germ any (Nordrhein-Westfalen)
-50
-25
0
25
50
75
100
125
150
30 50 70 90 110 130 150earnings, % of APW
gain
in h
ouse
hold
inco
me,
%
-50
-25
0
25
50
75
100
125
150Greece
-50
-25
0
25
50
75
100
125
150
30 50 70 90 110 130 150earnings, % of APW
gain
in h
ouse
hold
inco
me,
%
-50
-25
0
25
50
75
100
125
150
Ice land (Reykjavík)
-50
-25
0
25
50
75
100
125
150
30 50 70 90 110 130 150earnings, % of APW
gain
in h
ouse
hold
inco
me,
%
-50
-25
0
25
50
75
100
125
150Hungary
-50
-25
0
25
50
75
100
125
150
30 50 70 90 110 130 150earnings, % of APW
gain
in h
ouse
hold
inco
me,
%
-50
-25
0
25
50
75
100
125
150
A u s t r a lia
'typical' childcare fee OECD-23 Average high/low fee: +/- 1/3 no childcare
Source: OECD tax-benefit models.
38

DELSA/ELSA/WD/SEM(2005)10
Figure 3.4. Second earners (cont.)
Ire land
-50
-25
0
25
50
75
100
125
150
30 50 70 90 110 130 150earnings, % of APW
gain
in h
ouse
hold
inco
me,
%
-50
-25
0
25
50
75
100
125
150
minimum w age
Italy
-50
-25
0
25
50
75
100
125
150
30 50 70 90 110 130 150earnings, % of APW
gain
in h
ouse
hold
inco
me,
%-50
-25
0
25
50
75
100
125
150Insuf f icient information on childcare fees. See Annex Figure B.1 for scenarios incorporatingdif ferent hypothetical fee levels.
Japan
-50
-25
0
25
50
75
100
125
150
30 50 70 90 110 130 150earnings, % of APW
gain
in h
ouse
hold
inco
me,
%
-50
-25
0
25
50
75
100
125
150Korea
-50
-25
0
25
50
75
100
125
150
30 50 70 90 110 130 150earnings, % of APW
gain
in h
ouse
hold
inco
me,
%
-50
-25
0
25
50
75
100
125
150
Netherlands
-50
-25
0
25
50
75
100
125
150
30 50 70 90 110 130 150earnings, % of APW
gain
in h
ouse
hold
inco
me,
%
-50
-25
0
25
50
75
100
125
150Luxem bourg
-50
-25
0
25
50
75
100
125
150
30 50 70 90 110 130 150earnings, % of APW
gain
in h
ouse
hold
inco
me,
%
-50
-25
0
25
50
75
100
125
150Insuf f icient information on childcarefees and childcare-related benef its.
A u s t r a lia
'typical' childcare fee OECD-23 Average high/low fee: +/- 1/3 no childcare
Source: OECD tax-benefit models.
39

DELSA/ELSA/WD/SEM(2005)10
Figure 3.4. Second earners (cont.)
New Zealand
-50
-25
0
25
50
75
100
125
150
30 50 70 90 110 130 150earnings, % of APW
gain
in h
ouse
hold
inco
me,
%
-50
-25
0
25
50
75
100
125
150
minimum w age
Norw ay
-50
-25
0
25
50
75
100
125
150
30 50 70 90 110 130 150earnings, % of APW
gain
in h
ouse
hold
inco
me,
%-50
-25
0
25
50
75
100
125
150
Poland
-50
-25
0
25
50
75
100
125
150
30 50 70 90 110 130 150earnings, % of APW
gain
in h
ouse
hold
inco
me,
%
-50
-25
0
25
50
75
100
125
150
Insuf f icient information on childcare fees. See Annex Figure B.1 for scenarios incorporatingdif ferent hypothetical fee levels.
Portugal
-50
-25
0
25
50
75
100
125
150
30 50 70 90 110 130 150earnings, % of APW
gain
in h
ouse
hold
inco
me,
%
-50
-25
0
25
50
75
100
125
150
Spain
-50
-25
0
25
50
75
100
125
150
30 50 70 90 110 130 150earnings, % of APW
gain
in h
ouse
hold
inco
me,
%
-50
-25
0
25
50
75
100
125
150
Insuf f icient information on childcare fees. See Annex Figure B.1 for scenarios incorporatingdif ferent hypothetical fee levels.
Slovak Republic
-50
-25
0
25
50
75
100
125
150
30 50 70 90 110 130 150earnings, % of APW
gain
in h
ouse
hold
inco
me,
%
-50
-25
0
25
50
75
100
125
150
A u s t r a lia
'typical' childcare fee OECD-23 Average high/low fee: +/- 1/3 no childcare
Source: OECD tax-benefit models.
40

DELSA/ELSA/WD/SEM(2005)10
Figure 3.4. Second earners (cont.)
Sw eden
-50
-25
0
25
50
75
100
125
150
30 50 70 90 110 130 150earnings, % of APW
gain
in h
ouse
hold
inco
me,
%
-50
-25
0
25
50
75
100
125
150Sw itzerland (Zürich)
-50
-25
0
25
50
75
100
125
150
30 50 70 90 110 130 150earnings, % of APW
gain
in h
ouse
hold
inco
me,
%-50
-25
0
25
50
75
100
125
150
United Kingdom
-50
-25
0
25
50
75
100
125
150
30 50 70 90 110 130 150earnings, % of APW
gain
in h
ouse
hold
inco
me,
%
-50
-25
0
25
50
75
100
125
150
minimum w age
United States (Michigan)
-50
-25
0
25
50
75
100
125
150
30 50 70 90 110 130 150earnings, % of APW
gain
in h
ouse
hold
inco
me,
%
-50
-25
0
25
50
75
100
125
150
A u s t r a lia
'typical' childcare fee OECD-23 Average high/low fee: +/- 1/3 no childcare
1. Averages are the median values over all 23 countries. Results for year 2001 (2002 for Belgium, France, New Zealand, Sweden, United Kingdom, United States). Relative income gain resulting from a transition from labour-market inactivity into a full-time job paying various fractions of the average wage (APW). Benefit provisions and other government support are not taken into account if they are only available on a temporary basis immediately following the transition into work. Children are aged 2 and 3. Calculations assume full-time centre based care in the in-work situation and no childcare costs while out of work. In France, it is assumed that parents have sufficient work records to be entitled to the Allocation Parentale d’Éducation while out of work. The first earner in two-parent families is full-time employed with average earnings. Information on childcare fees can be found in Section 2. The earnings of full-time minimum wage earners are shown in countries where statutory minimum wages exist. Further details on the model calculations are discussed in OECD (2004b).
Source: OECD tax-benefit models.
41

DELSA/ELSA/WD/SEM(2005)10
Figure 3.5. Starting employment for lone parents: income gain net of childcare cost.
different earnings levels. (1)
Australia
-50
-25
0
25
50
75
100
125
150
30 50 70 90 110 130 150earnings, % of APW
gain
in h
ouse
hold
inco
me,
%
-50
-25
0
25
50
75
100
125
150minimum w age
Austria (Vienna)
-50
-25
0
25
50
75
100
125
150
30 50 70 90 110 130 150earnings, % of APW
gain
in h
ouse
hold
inco
me,
%
-50
-25
0
25
50
75
100
125
150
Belgium (Wallonie)
-50
-25
0
25
50
75
100
125
150
30 50 70 90 110 130 150earnings, % of APW
gain
in h
ouse
hold
inco
me,
%
-50
-25
0
25
50
75
100
125
150Canada (Ontario)
-50
-25
0
25
50
75
100
125
150
30 50 70 90 110 130 150earnings, % of APW
gain
in h
ouse
hold
inco
me,
%
-50
-25
0
25
50
75
100
125
150
Czech Republic
-50
-25
0
25
50
75
100
125
150
30 50 70 90 110 130 150earnings, % of APW
gain
in h
ouse
hold
inco
me,
%
-50
-25
0
25
50
75
100
125
150Insuf f icient information on childcare fees. See Annex Figure B.1 for scenarios incorporating dif ferent hypothetical fee levels.
Denm ark
-50
-25
0
25
50
75
100
125
150
30 50 70 90 110 130 150earnings, % of APW
gain
in h
ouse
hold
inco
me,
%
-50
-25
0
25
50
75
100
125
150
A u s t r a lia
'typical' childcare fee OECD-23 Average high/low fee: +/- 1/3 no childcare
Source: OECD tax-benefit models.
42

DELSA/ELSA/WD/SEM(2005)10
Figure 3.5. Lone parents (cont.)
Finland (Hels ink i)
-50
-25
0
25
50
75
100
125
150
30 50 70 90 110 130 150earnings, % of APW
gain
in h
ouse
hold
inco
me,
%
-50
-25
0
25
50
75
100
125
150France
-50
-25
0
25
50
75
100
125
150
30 50 70 90 110 130 150earnings, % of APW
gain
in h
ouse
hold
inco
me,
%-50
-25
0
25
50
75
100
125
150
minimum w age
Germ any (Nordrhein-Westfalen)
-50
-25
0
25
50
75
100
125
150
30 50 70 90 110 130 150earnings, % of APW
gain
in h
ouse
hold
inco
me,
%
-50
-25
0
25
50
75
100
125
150Greece
-50
-25
0
25
50
75
100
125
150
30 50 70 90 110 130 150earnings, % of APW
gain
in h
ouse
hold
inco
me,
%
-50
-25
0
25
50
75
100
125
150Relative income gains of taking up employment are too large to show up as a result of very low incomes of labour market inactive lone parents(see Section 2 and Annex Figure A1).
Ice land (Reykjavík)
-50
-25
0
25
50
75
100
125
150
30 50 70 90 110 130 150earnings, % of APW
gain
in h
ouse
hold
inco
me,
%
-50
-25
0
25
50
75
100
125
150Hungary
-50
-25
0
25
50
75
100
125
150
30 50 70 90 110 130 150earnings, % of APW
gain
in h
ouse
hold
inco
me,
%
-50
-25
0
25
50
75
100
125
150
A u s t r a lia
'typical' childcare fee OECD-23 Average high/low fee: +/- 1/3 no childcare
Source: OECD tax-benefit models.
43
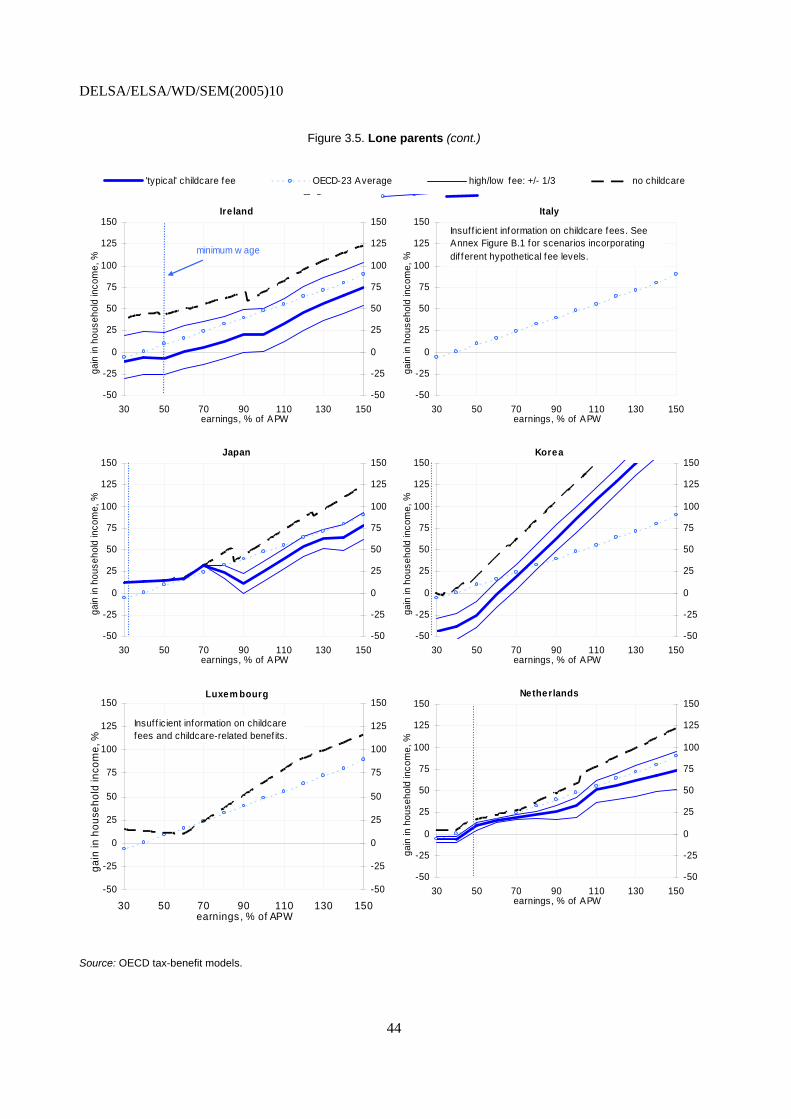
DELSA/ELSA/WD/SEM(2005)10
Figure 3.5. Lone parents (cont.)
Ire land
-50
-25
0
25
50
75
100
125
150
30 50 70 90 110 130 150earnings, % of APW
gain
in h
ouse
hold
inco
me,
%
-50
-25
0
25
50
75
100
125
150
minimum w age
Italy
-50
-25
0
25
50
75
100
125
150
30 50 70 90 110 130 150earnings, % of APW
gain
in h
ouse
hold
inco
me,
%
Insuf f icient information on childcare fees. See Annex Figure B.1 for scenarios incorporating dif ferent hypothetical fee levels.
Japan
-50
-25
0
25
50
75
100
125
150
30 50 70 90 110 130 150earnings, % of APW
gain
in h
ouse
hold
inco
me,
%
-50
-25
0
25
50
75
100
125
150Korea
-50
-25
0
25
50
75
100
125
150
30 50 70 90 110 130 150earnings, % of APW
gain
in h
ouse
hold
inco
me,
%
-50
-25
0
25
50
75
100
125
150
Netherlands
-50
-25
0
25
50
75
100
125
150
30 50 70 90 110 130 150earnings, % of APW
gain
in h
ouse
hold
inco
me,
%
-50
-25
0
25
50
75
100
125
150Luxem bourg
-50
-25
0
25
50
75
100
125
150
30 50 70 90 110 130 150earnings , % of APW
gain
in h
ouse
hold
inco
me,
%
-50
-25
0
25
50
75
100
125
150
Insuf f icient information on childcarefees and childcare-related benef its.
A u s t r a lia
'typical' childcare fee OECD-23 Average high/low fee: +/- 1/3 no childcare
Source: OECD tax-benefit models.
44

DELSA/ELSA/WD/SEM(2005)10
Figure 3.5. Lone parents (cont.)
New Zealand
-50
-25
0
25
50
75
100
125
150
30 50 70 90 110 130 150earnings, % of APW
gain
in h
ouse
hold
inco
me,
%
-50
-25
0
25
50
75
100
125
150
minimum w age
Norw ay
-50
-25
0
25
50
75
100
125
150
30 50 70 90 110 130 150earnings, % of APW
gain
in h
ouse
hold
inco
me,
%-50
-25
0
25
50
75
100
125
150
Poland
-50
-25
0
25
50
75
100
125
150
30 50 70 90 110 130 150earnings, % of APW
gain
in h
ouse
hold
inco
me,
%
-50
-25
0
25
50
75
100
125
150
Insuf f icient information on childcare fees. See Annex Figure B.1 for scenarios incorporating dif ferent hypothetical fee levels.
Portugal
-50
-25
0
25
50
75
100
125
150
30 50 70 90 110 130 150earnings, % of APW
gain
in h
ouse
hold
inco
me,
%
-50
-25
0
25
50
75
100
125
150
Spain
-50
-25
0
25
50
75
100
125
150
30 50 70 90 110 130 150earnings, % of APW
gain
in h
ouse
hold
inco
me,
%
-50
-25
0
25
50
75
100
125
150
Insuf f icient information on childcare fees. See Annex Figure B.1 for scenarios incorporating dif ferent hypothetical fee levels.
Slovak Republic
-50
-25
0
25
50
75
100
125
150
30 50 70 90 110 130 150earnings, % of APW
gain
in h
ouse
hold
inco
me,
%
-50
-25
0
25
50
75
100
125
150
A u s t r a lia
'typical' childcare fee OECD-23 Average high/low fee: +/- 1/3 no childcare
Source: OECD tax-benefit models.
45
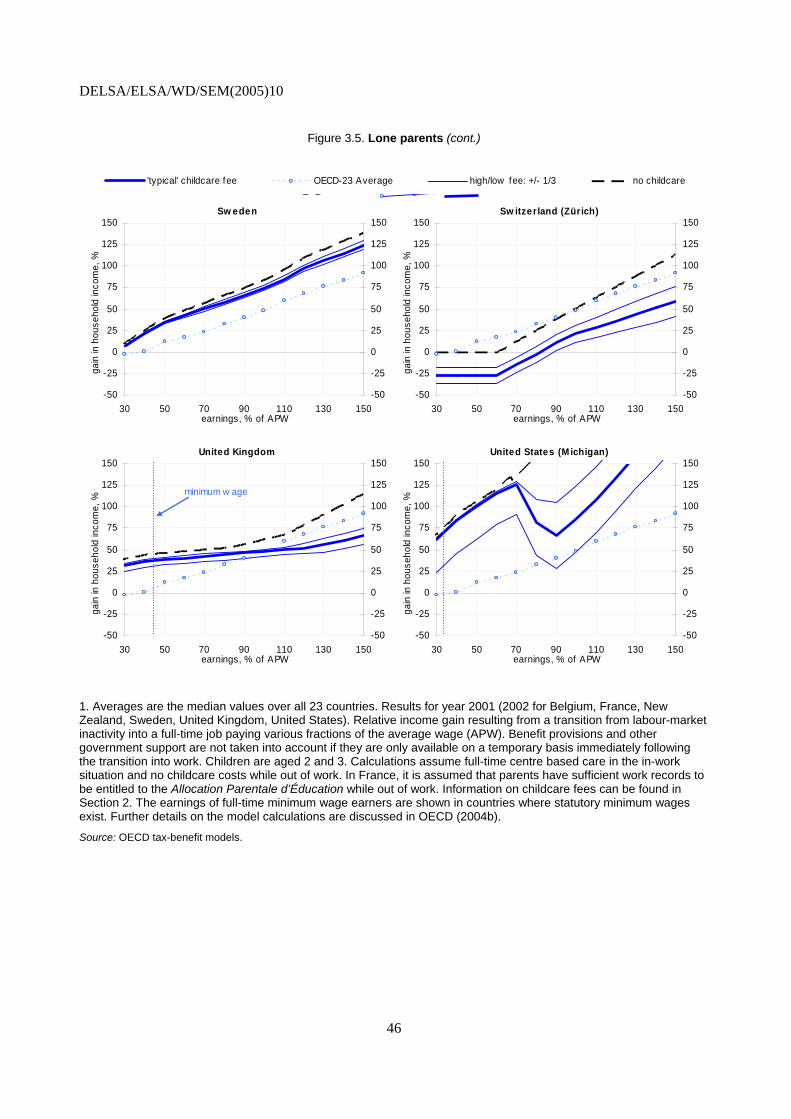
DELSA/ELSA/WD/SEM(2005)10
Figure 3.5. Lone parents (cont.)
Sw eden
-50
-25
0
25
50
75
100
125
150
30 50 70 90 110 130 150earnings, % of APW
gain
in h
ouse
hold
inco
me,
%
-50
-25
0
25
50
75
100
125
150Sw itzerland (Zürich)
-50
-25
0
25
50
75
100
125
150
30 50 70 90 110 130 150earnings, % of APW
gain
in h
ouse
hold
inco
me,
%-50
-25
0
25
50
75
100
125
150
United Kingdom
-50
-25
0
25
50
75
100
125
150
30 50 70 90 110 130 150earnings, % of APW
gain
in h
ouse
hold
inco
me,
%
-50
-25
0
25
50
75
100
125
150
minimum w age
United States (M ichigan)
-50
-25
0
25
50
75
100
125
150
30 50 70 90 110 130 150earnings, % of APW
gain
in h
ouse
hold
inco
me,
%
-50
-25
0
25
50
75
100
125
150
A u s t r a lia
'typical' childcare fee OECD-23 Average high/low fee: +/- 1/3 no childcare
1. Averages are the median values over all 23 countries. Results for year 2001 (2002 for Belgium, France, New Zealand, Sweden, United Kingdom, United States). Relative income gain resulting from a transition from labour-market inactivity into a full-time job paying various fractions of the average wage (APW). Benefit provisions and other government support are not taken into account if they are only available on a temporary basis immediately following the transition into work. Children are aged 2 and 3. Calculations assume full-time centre based care in the in-work situation and no childcare costs while out of work. In France, it is assumed that parents have sufficient work records to be entitled to the Allocation Parentale d’Éducation while out of work. Information on childcare fees can be found in Section 2. The earnings of full-time minimum wage earners are shown in countries where statutory minimum wages exist. Further details on the model calculations are discussed in OECD (2004b).
Source: OECD tax-benefit models.
46

DELSA/ELSA/WD/SEM(2005)10
77. There are a number of countries where, even after accounting for childcare costs, low-wage employment brings significant income gains for lone parents. In some of these cases, carefully balanced policy packages combine relatively generous benefits for those without a job while still maintaining incentives to take up employment – even for those having to purchase childcare services in order to find the time for paid work.33 In Finland, Norway and Sweden, this is, in part, achieved by keeping fees very low, particularly for low-income parents. Fees are much higher in Australia and the United Kingdom but financial incentives for low-wage work are nevertheless more favourable than in most other countries.34
78. For low-income lone parents in Denmark and Germany, formal childcare is also relatively inexpensive. But steep benefit withdrawals, high tax burdens for employees, or both, prevent larger gains from employment in these cases. Note that, in a few cases, benefits fully absorb variations in childcare fees charged to low-income families (for instance, the graphs for ‘typical’, ‘low’ and ‘high’ fees collapse into one single line for lone parents in Denmark and Japan). In these cases, measures aiming to lower fees will reduce government expenditure on these benefits but will have no direct influence on work incentives for the groups concerned.
79. While the payoffs from employment can be very unfavourable for lone parents, one general pattern that emerges from the clusters in Table 3.1 is that childcare costs can be a particularly powerful determinant of the net income gains in the case of second earners, especially at low wage levels. Indeed, the influence of childcare costs, indicated by the vertical distance between the “with” and “without” childcare lines in Figures 3.4 and 3.5, is frequently larger for second earners than for lone parents. One reason is that childcare benefits are frequently targeted to the poorest families so that two-earner couples may only be entitled to reduced support payments or may be ineligible altogether. As a result, childcare costs can, compared to lone-parent families, be substantially higher in absolute terms. In addition, inactivity traps for lone parents can arise from a range of different policy features, whereas for second earners, childcare costs tend to be the main cause of reduced income gains.
80. The mechanics behind disincentive problems can be seen more clearly in Figure 3.6. Similar to the “Average Effective Tax Rates” (AETR) shown earlier, these graphs examine how individual policy instruments contribute to the overall erosion of the gains from work. Relative to the earlier charts, the main difference is that it now includes the influence of childcare fees alongside tax burdens and benefit withdrawals.35 The results confirm the dominating role of childcare costs in the two-parent case. Averaged across the 23 countries where sufficient data are available, fees use up nearly 40% of the gross earnings of a low-wage second earner – more than taxes, social contributions and benefit losses combined. Only one third of gross earnings is effectively left to the family for consumption.
81. In more than half of the countries, AETRs are even higher. In some cases, tax burdens36 or the withdrawal of home-care allowances37 are the main factors causing high AETRs. But in most countries 33. Greek, Hungarian and US lone parents also gain substantially; as discussed earlier, this is mainly due to their
low incomes when out of work.
34. See footnote 20 on relevant policy features in the UK. Like in the UK, a sizable portion of the fees paid by Australian low-income users of approved childcare is also refunded as a rebate. In addition, other Australian family-related benefits employ an income disregard so that benefit withdrawals are less severe for those with very low earnings (however, the means-tests “bite” at higher earnings levels, as illustrated by the flattening of the graph around 60% of APW).
35. Differences also arise for the other income components as the use of childcare affects income taxes and, especially, benefits for those taking up a job.
36. Belgium (Wallonie), Denmark, Iceland (Reykjavík).
37. Finland (Helsinki), France, Hungary and the Slovak Republic
47

DELSA/ELSA/WD/SEM(2005)10
where AETRs are particularly high, adverse work incentives are a result of very high childcare fees. A few countries employ childcare-related tax concessions and benefits in order to neutralise most of the adverse impact of childcare fees (Australia and the United Kingdom; to a lesser extent Belgium, Netherlands and New Zealand). In the graphs, this can be seen by inspecting the gap between the “with childcare” and “without childcare” markers. Where the size of this gap is smaller than the fees, parts of these fees are compensated so that working parents do not bear the full burden. For second earners, these concessions turn out to be relatively insignificant, however. They are much more important for lone parents. In spite of the larger childcare-support payments, AETRs for lone parents exceed those of second earners in all countries except Greece, the United Kingdom and the United States.
3.2.1. Earnings potential after child-related career breaks
82. So far, the discussion of “make-work-pay” policies in this paper has focussed on the role of childcare costs and the structure of tax-benefit systems. Yet, for women balancing work and family life, the most visible influence on the attractiveness of employment is probably the potential wage they can earn in the labour market.
83. It is interesting in this context to compare the amounts parents need to earn in order to be able to achieve income gains when taking up a job. The results indicate that, relative to average earnings, lone parents in the Slovak Republic (110%), France (>90%), Switzerland (80%), Canada (70%) and Ireland, Korea and New Zealand (60%), require the highest earnings to be able to cover work-related taxes, benefit reductions and “typical” childcare fees (note that this does not account for any disutility of work). In other countries, employment starts generating net income gains already at much lower earnings levels. While inactivity traps are generally less dramatic for second earners, especially at higher earnings levels, income gains for low-wage jobs (<70% of APW) are nonetheless below 15% in six countries (Denmark, France, Hungary, Ireland, Slovak Republic, United Kingdom). In each case, higher earnings can make employment considerably more attractive (in a few countries, such as Korea, steep curves indicate that even small earnings increases can make a significant difference for family budgets).
84. Policies that enable returning parents, mainly mothers, to earn higher wages, can thus help avoid inactivity traps and provide them with both the incentives and the means to combine careers with having children. Given the more elastic labour supply of women, boosting their earnings potential is likely to result in particularly favourable returns in terms of employment levels, poverty reduction and economic growth. Relevant measures include policies that (1) help to eliminate any discriminatory components of existing gender wage-gaps; (2) promote investment in human capital; and (3) maintain earnings potential during child-related employment breaks.
85. Helping parents to reconcile child-rearing with employment therefore requires a dedicated, long-term and multi-faceted policy approach that ensures coordination and consistency of measures in a number of areas. Relevant policies include the removal of barriers to part-time work, providing flexible parental-leave arrangements to strengthen work attachment, active policies to renew or build up human capital after periods of parental leave and, arguably, measures to encourage a more equal sharing of domestic responsibilities between men and women. Yet any strategy that does not succeed at providing children with high-quality care on a regular and continuing basis runs the risk of either discouraging maternal employment, inhibiting child development or preventing parenthood altogether. Given the very large cost of childcare provision, especially for infants, childcare support policies are therefore a crucial element of a successful policy mix. To be effective, such support involves a considerable commitment of resources. Well-structured childcare support policies can pay for themselves, however. As shown in this section, a lack of support can create substantial barriers to work which, in turn, lead to higher welfare expenditure, lost tax revenues, inhibited growth and wasted human capital.
48
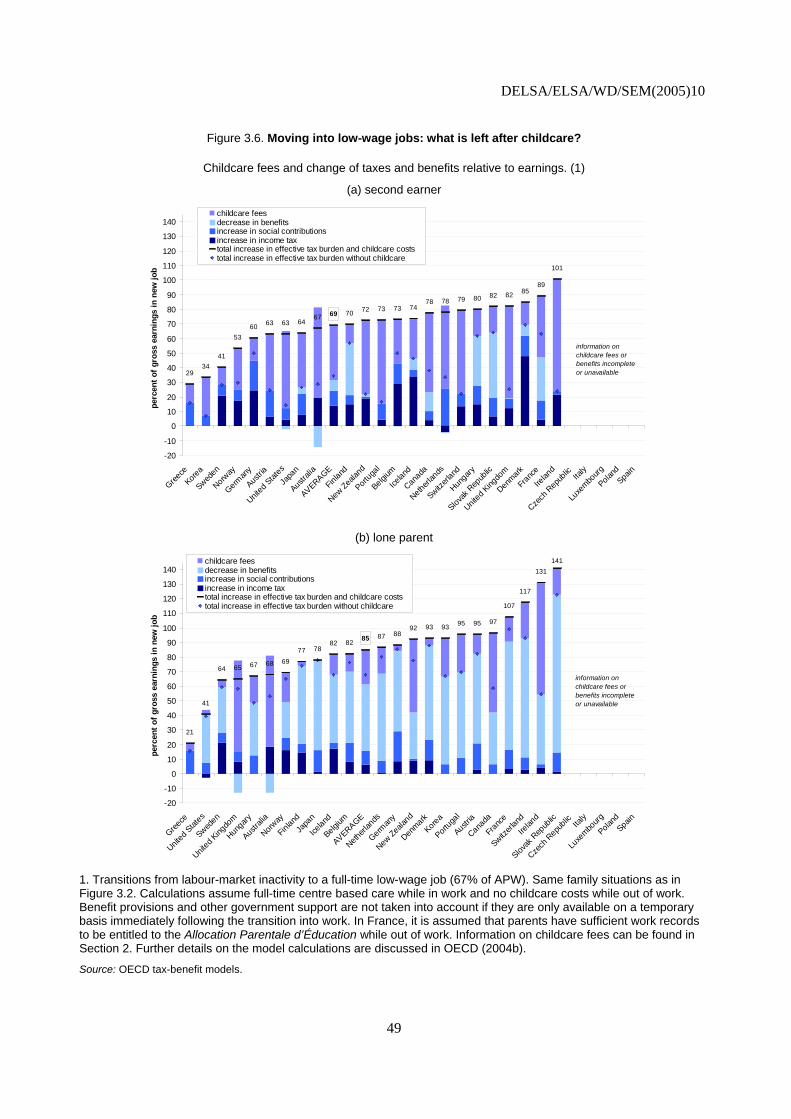
DELSA/ELSA/WD/SEM(2005)10
Figure 3.6. Moving into low-wage jobs: what is left after childcare?
Childcare fees and change of taxes and benefits relative to earnings. (1)
(a) second earner
3441
5360 63 63 64
6773 74
78 78 79 80 82 82 8589
101
69 70
29
7372
-20
-10
0
10
20
30
40
50
60
70
80
90
100
110
120
130
140
Greece
Korea
Sweden
Norway
German
y
Austria
United S
tates
Japa
n
Austra
lia
AVERAGE
Finland
New Zealan
d
Portuga
l
Belgium
Icelan
d
Canada
Netherlan
ds
Switzerl
and
Hungary
Slovak
Rep
ublic
United K
ingdo
m
Denmark
Franc
e
Irelan
d
Czech
Rep
ublic Ita
ly
Luxe
mbourg
PolandSpa
in
perc
ent o
f gro
ss e
arni
ngs
in n
ew jo
b
childcare feesdecrease in benefitsincrease in social contributionsincrease in income taxtotal increase in effective tax burden and childcare coststotal increase in effective tax burden without childcare
information on childcare fees or benefits incomplete or unavailable
(b) lone parent
21
41
64 65 67 68 6977 78
82 8287 88
92 93 93 95 95 97
107
117
131141
85
-20
-10
0
10
20
30
40
50
60
70
80
90
100
110
120
130
140
Greece
United
Stat
es
Sweden
United
Kingdo
m
Hunga
ry
Austra
lia
Norway
Finlan
dJa
pan
Icelan
d
Belgium
AVERAGE
Netherl
ands
German
y
New Ze
aland
Denmark
Korea
Portug
al
Austria
Canad
a
Fran
ce
Switzerl
and
Irelan
d
Slovak
Rep
ublic
Czech
Rep
ublic Ita
ly
Luxe
mbourg
Poland
Spain
perc
ent o
f gro
ss e
arni
ngs
in n
ew jo
b
childcare feesdecrease in benefitsincrease in social contributionsincrease in income taxtotal increase in effective tax burden and childcare coststotal increase in effective tax burden without childcare
information on childcare fees or benefits incomplete or unavailable
1. Transitions from labour-market inactivity to a full-time low-wage job (67% of APW). Same family situations as in Figure 3.2. Calculations assume full-time centre based care while in work and no childcare costs while out of work. Benefit provisions and other government support are not taken into account if they are only available on a temporary basis immediately following the transition into work. In France, it is assumed that parents have sufficient work records to be entitled to the Allocation Parentale d’Éducation while out of work. Information on childcare fees can be found in Section 2. Further details on the model calculations are discussed in OECD (2004b).
Source: OECD tax-benefit models.
49

DELSA/ELSA/WD/SEM(2005)10
4. Future work
86. Discussions in many OECD countries have recently focused on policies affecting parents with young children. Childcare policies assume a central role in these debates. This paper has analysed and compared the impact of a range of social and fiscal policies on the budgets of families with children requiring care. The aim was to address the lack of internationally comparable information on childcare affordability and, by accounting for childcare costs faced by parents, to provide a more comprehensive analysis of the attractiveness and feasibility of employment. The approach is based on extensions of the OECD’s tax-benefit models and provides a micro-economic perspective that focuses on situations faced by individual families.
87. The analysis has built on an established approach that evaluates and compares social and fiscal policies by calculating their effects on household incomes in a range of “typical” family situations. Given that comparative information on childcare arrangements and costs is still scarce, this method provides useful insights about the mechanics of social and fiscal policies. In the absence of detailed representative data, the method necessarily abstracts from a number of real-world complexities and therefore provides a stylised and partial picture of existing family circumstances. The technical aspects and limitations of the resulting indicators are discussed above and will not be repeated here. It is useful, however, to briefly consider how the results in the paper may be interpreted and how they might be used to think about a number of policy issues. These considerations also indicate possible directions for future work in this area.
• The results are based on family scenarios that are common in the sense that they correspond approximately to the circumstances faced by a significant number of families. Results are nevertheless only valid within the scope of family types and childcare arrangements considered. In a multi-country context, this scope is necessarily limited and should be seen as a first step towards a more comprehensive approach. Possible extensions include the consideration of other types of formal childcare (such as childminders), although cost information for these types of care can be particularly difficult to obtain. While purchased care is arguably most relevant for the age-group considered here38, a useful extension of the analysis might be to cover after-school care arrangements for older children. Also, both family-related benefits and childcare costs can vary with family size.39 These differences are potentially important for fertility decisions in a setting where families consider the marginal resource implications of having another child. Considering the resources of families with fewer or more than two children would give a more complete picture of the employment and fertility incentives built into existing policies. Moreover, the calculations have assumed full-time childcare while the costs of part-time care would be relevant for parents considering a part-time job or those who are able to combine centre-based care with informal care arrangements. Finally, benefits paid to parents caring for their own children can depend on previous work experience. Where this is the case, notably in France, calculations in this paper have assumed that relevant work experience conditions are satisfied. Alternative assumptions can be useful to cover a wider range of employment and family “careers”.
• An attempt has been made to maximise comparability by collecting childcare fee information for a common type of care setting across countries (full-time care in registered childcare centres). However, an additional constraint for parents is a possible shortage of non-parental childcare, particularly in heavily regulated markets. Existing data on childcare use, as
38. In some countries maternity leave, can exceed one year while pre-school is sometimes provided for children
aged four and above.
39. For instance, child-related benefits in France are substantially more generous for larger families with three or more children.
50
DELSA/ELSA/WD/SEM(2005)10
presented in this paper, cannot be used to separately analyse childcare demand and supply issues, however. Yet, the estimates of childcare affordability can provide useful contextual information as high cost can be one crucial factor contributing to the limited use of childcare, while low costs combined with small proportions of children in formal childcare indicate that factors other than cost are restricting childcare use. However, more work is necessary to be able to compare the supply of childcare services, as well as factors and policies that are associated with different supply patterns.
• The comparability of cost estimates is limited by the fact that the quality of childcare varies across and within countries. Although country differences for formal centre-based care are perhaps smaller than for other types of care, it is important to note that the present approach does not attempt to control for quality differences (while prices may signal certain quality aspects, the cost of provision would be a better indicator). Indeed, there is evidence that parents find it difficult to evaluate the quality of childcare services “correctly” or consistently.40 Yet, in addition to childcare cost and availability, childcare quality is an important factor that parents are likely to consider when deciding on the relative attractiveness of paid employment and unpaid childcare work at home.
• The focus of the present analysis is the influence of childcare affordability on financial work incentives and the feasibility of combining work and having children. In particular, the results have shown how employment and childcare impact on current family resources. In addition, there are important dynamic aspects of employment decisions, including future earnings prospects and pension entitlements, that can make employment desirable and attractive even if income gains are limited in the short term.
40. One difficulty may be related to the large number of dimensions of “quality”. In a survey of US research, Blau
and Currie (2004) report that studies finding a positive association between childcare quality and child development outcomes tend to show a stronger role of less tangible (and hard-to-measure) “process-quality” characteristics than of “structural” quality measures (group sizes, education and training of caregivers, etc.). Across countries, it is also likely that “technologies” of producing quality will vary so that differences in outcomes are perhaps smaller than differences in observable inputs.
51
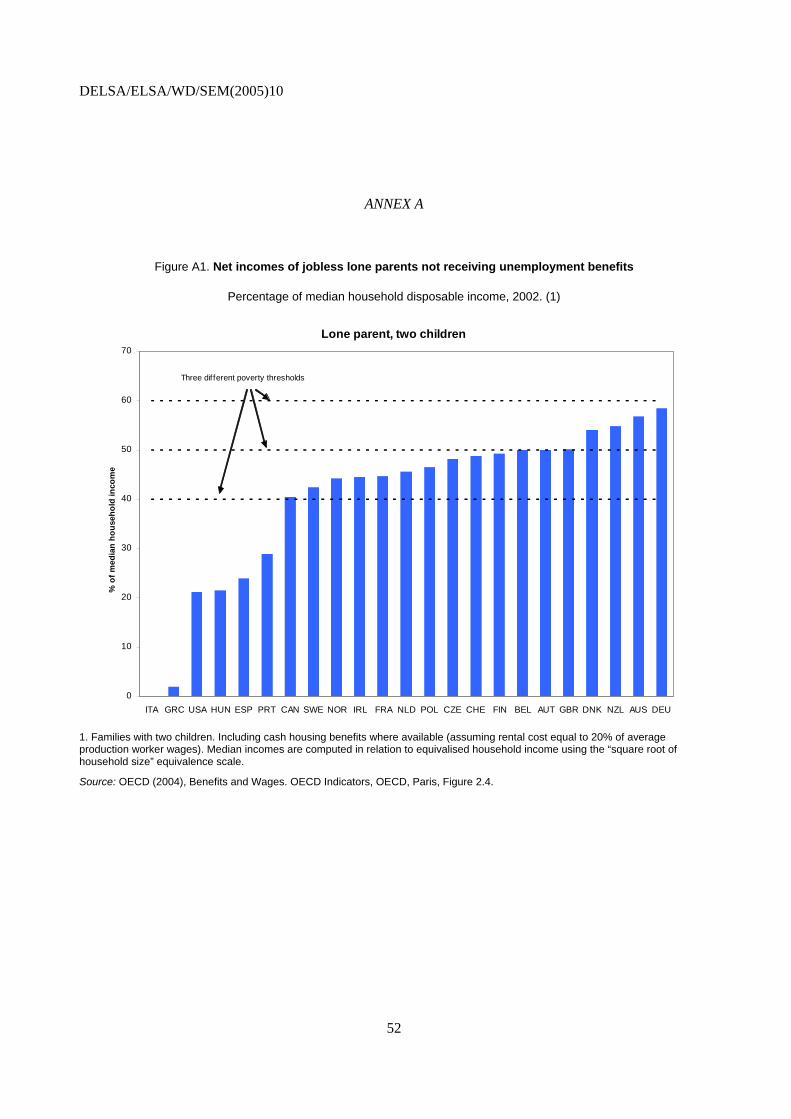
DELSA/ELSA/WD/SEM(2005)10
ANNEX A
Figure A1. Net incomes of jobless lone parents not receiving unemployment benefits
Percentage of median household disposable income, 2002. (1)
Lone parent, two children
0
10
20
30
40
50
60
70
ITA GRC USA HUN ESP PRT CAN SWE NOR IRL FRA NLD POL CZE CHE FIN BEL AUT GBR DNK NZL AUS DEU
% o
f med
ian
hous
ehol
d in
com
e
Three dif ferent poverty thresholds
1. Families with two children. Including cash housing benefits where available (assuming rental cost equal to 20% of average production worker wages). Median incomes are computed in relation to equivalised household income using the “square root of household size” equivalence scale.
Source: OECD (2004), Benefits and Wages. OECD Indicators, OECD, Paris, Figure 2.4.
52

DELSA/ELSA/WD/SEM(2005)10 Table A1. Fees and characteristics of centre-based childcare
2001 or latest year available
National currency (2)
% of APW Income Family
status
Numberof children(in care)
Ageof
childProvision of childcare Priority access for
specific groups Other Compulsory school from
age
Australia Long Day Care. 0-6 50 (20) 767 21 No(3) No No Yes(3)
Provision mainly private but government-subsidised childcare is provided in various forms, including family day care. Few children under age 1 are in formal childcare, parental and informal care predominate in this case.
Lone parents; children at risk of abuse or neglect and families in crisis or with work commitments.
Fees depend on work status of parent(s). The majority of children aged 4-6 are in pre-school.
6
Crèche (Krippe ) 1-3
Kindergarten 3-5
Belgium(French
community)Crèche 0-3 >25 (<25) 408 16 Yes Yes Yes Yes Facilities are subsidised. Shortage of places
for ages 0-3. No
Fees are regionally regulated; they are reduced (70% each) for 2+ children in care or if family has 3 children. French and Flemish systems differ slightly. Majority of children aged 4+ are in free pre-school.
6
603 19
Public crèche 0-2 40 1,500 10
State kindergarten 3-6 -- 300 2
Scheme
Additional informationFull-time fee per child (age 2 or as specified)Full (part) time
care: number of hours per week
provided
Age group
covered (years)
Fee varies with:
Families receiving SA benefits are compensated for childcare expenses up to a limit (rules for SA recipients vary considerable across provinces/territories).
6
Children aged 0-3 are mainly cared for by family, informal caregivers or in day nurseries.
Number of regulated childcare facilities can accommodate approximately 9% of children aged 0-12.
No
No
Fees are determined by locality, and are generally flat rate excepting low-income households (generally exempted from paying fees). Higher fees for non-residents of district.
Czech Republic (4)
No(3)
No
(median for age 1.5-3)Canada (Ontario)
6
Facilities in Vienna are generally open long hours. Full time fees are assessed based on a threshold usage of around 5 hours per day. At age three (some earlier), children transfer from Crèche to Kindergarten, which has both a care and learning aspect.
6Austria(Vienna)
Childcare providers are mainly private non-profit institutions. Facilities are subsidised by municipalites and the states (Länder) and are locally regulated. Sufficient number of places for ages 3-6 but not for younger children. Most children aged under 2 are looked after by a parent on parental leave at home (see also Table 2.3).
Children previously in day-care facilities and those whose family situation makes it essential.
252 13 Yes No>25 (<25)
Regulated Child Care
facilities0-6 -- No No
No(3)Yes(3)
No
Yes
Yes Yes
53

DELSA/ELSA/WD/SEM(2005)10 Table A1. (cont.)
National currency (2)
% of APW Income Family
status
Numberof children(in care)
Ageof
childProvision of childcare Priority access for
specific groups Other Compulsory school from
age
Local authority child minding
or crèche.0.5-2 >32 1,883 8
Kindergarten 3-6 >32 1,358 6
Finland Public day care. 0-6 <50 185 8 Yes Yes Yes No
Every child under compulsory school age is entitled to early care and education. This is provided by local authorities once parental leave comes to an end in general, but may be outsourced to private providers.
--
For 3+ children, cost is 20% of 1st child. Fees are a percent of family income exceeding income limit plus additional income disregard per child. Part-time care costs around 60% of full time. Fees are nationally regulated. Children aged 6 are often in free pre-school classes.
7
France Crèche 0-3 <50 618 34 Yes No Yes Yes
Shortage of childcare facilities for children under 3, especially in big cities. Care provision also through child minders or employment of a child minder at the parents' home (both highly subsidised).
--The majority of children aged 3+ are in school (maternelle ) on a full or part-time basis.
6
Crèche <3 >42.5 313 12
Kindergarten 3-6 >42.5 234 9
GreecePublic
nurseries / day care
0-6.5 -- 65 7 Yes No Yes --
Over 50% of nurseries are public but provision is insufficient for children aged under 3. Nurseries established by the MInistry of Health and Welfare are being administratively transferred to local authorities.
Families in social need (e.g. orphans, large families, lone parents, disabled parents).
Fees are subject to national guidelines and are subsidised in public nurseries; minimum fee can be zero for low-income families. 50% fee reduction for second child. Other institutions operating nurseries inlcude the Workers' Home Organisation (OEE) and the Social Insurance Institute.
6
Fees are regionally regulated and are only paid for one child irrespective of number of children in care. Minimum payment is zero for low-income families. No price differentiation between full/part time care.
6Germany
(Nordrhein-Westfalen)
Children aged 3-6 have a right to a place in a Kindergarten. Children of other ages are admitted if possible but supply does not cover demand. After-school care for children aged 6-14.
Full-time fee per child (age 2 or as specified) Additional informationFee varies with:
7
Maximum payment for parents (=the fee shown in this table) is 30-32% of full price. Fees are further reduced depending on income (see Table 2.3). For 2 or more children in care, full payment for one child (the one subject to the highest fee), half payment for other children. Municipalities can decide to provide further rebates. Kindergarten classes for age group 6-7 are free and considered as pre school classes.
Childcare facilities are heavily subsidised; provision is predominantly a public service supervised by local authorities. Some municipalities offer guaranteed childcare for children aged under 12 months. After school care at school or in special centres is available for children aged 6-13.
Assessed by municipalities on a case-by-case basis.
Scheme
Full (part) time care: number of hours per week
provided
No
No Yes
Denmark
YesYesSocially and economically disadvantaged groups.
Age group
covered (years)
Yes Yes Yes
54

DELSA/ELSA/WD/SEM(2005)10 Table A1. (cont.)
National currency (2)
% of APW Income Family
status
Numberof children(in care)
Ageof
childProvision of childcare Priority access for
specific groups Other Compulsory school from
age
Hungary Public nurseries. 0-3 40 4,875 6 No No Yes No Shortage of childcare facilities especially in
rural areas. --
Majority of nurseries are public and mainly cater for children aged 2+. Fees are regulated by the government and reviewed on an annual basis. Socially indigent or disabled children and children growing up in large families can be eligible for a 50% to 100% discount.
6
Iceland (Reykjavík)
Day care centres / pre-
school.2-6 40 (20) 22,700 11 No Yes Yes No(3)
For children aged under 2, full time care is generally provided by parents or child minders ("day mothers") whose fees are subsidised by municipalities. Pre-school / day care centres do not fully cover demand; gap is filled by "day mothers".
None.
Fees locally regulated for day care centres. Cost for "day mothers" is similar (after subsidy). Discount: 33% (75%) for 2nd (3rd) child. Fees lower for single parents or if parent is a student or disabled.
6
0-2 592 30
3-5 540 27
0-2 490 25
3-5 429 22
Italy (4) -- 0-2 <50 (20) -- -- Yes(3) Yes(3) Yes(3) No
Availability and fees of public childcare for children under 3 differ significantly across municipalites; most nurseries are public and subsidised but the majority of children are cared for by family or informal care-givers.
--90% of children aged 3-5 attend public pre-school (scuola materna ), which is free of charge.
6
0-2 80,000 22
3-5 77,000 21
<2 225,000 13
2 186,000 11
3-5 115,000 7
SA recipients, lone parents and other low income families, disabled parents.
YesYes(3)
Yes
Fee varies with:
Scheme
Age group
covered (years)
Yes No
Community orPublic
No No
Full-time fee per child (age 2 or as specified)Full (part) time
care: number of hours per week
provided
Additional information
No formal rules. In practice local authorities grant preferential access to lone parents and children requiring special assistance.
Amount of fee depends on income tax position of parent(s) . Minimum amount when family pays no local or central income tax. Fee is waived for persons receiving SA.
Formal childcare not well developed and most facilities have waiting lists. Very limited public support/subsidies. Informal childcare important for under-three year-olds. Little provision of after-school care.
--
Fees determined by providers, often 10% reduction for siblings. Half-time pre-school classes (infant school) for children aged 4-6.
6
6--Japan 40
Private sector*
40Ireland
Public sector childcare is the most important but there is also non-profit, private and employer-sponsored care.
Korea -- <60 No
Use of childcare is low for age 0-3. Subsidies are paid to childcare facilities.
Fees are nationally regulated and subsidised. 6No
Yes
No Yes
55

DELSA/ELSA/WD/SEM(2005)10 Table A1. (cont.)
National currency (2)
% of APW Income Family
status
Numberof children(in care)
Ageof
childProvision of childcare Priority access for
specific groups Other Compulsory school from
age
Luxembourg -- -- -- -- -- Yes -- Yes -- -- -- compulsory pre-school from age 4 (being extended to also cover 3-year-olds). 6
719 29
Licensed early childcare centres.*
<5 40 624 19 No No Yes Yes
Kindergarten 3-4 <20 -- -- No No No No
Norway Kindergarten <6 >41 2,807 12 Yes(3) No(3) Yes Yes(4)
All public and most private childcare centres are subsidised. Enough places for age 3+ but not for children under 3. Children aged under 1 are predominantly cared for by parents at home.
--
Fees are locally regulated and vary between municipalites. They are higher for younger children (the fees used here relate to a child older than 3 due to data limitations). Fees are higher for those private facilities that do not receive subsidies.
6
Nurseries <3 -- -- -- -- -- Yes -- Fees for nurseries are paid by parents in full. --
Fees vary by municipality (gmina ) and are sometimes set in relation to the social assistance level (e.g. 20% in the case of Olsztyn). They are usually lower for 2nd children (by 25-50%).
Nursery schools 3-6 -- -- -- -- -- Yes --
Attendance mandatory for 6-year-olds. For public nursery schools, local governments cover costs for 5 hours per day (excluding board).
-- --
PortugalPublic or non-profit private
crèches.0.5-3 40 128 19 Yes No Yes Yes
Subsidies only for public or non-profit private facilities. Kindergartens provide free childcare for 5 hours/day for 3-6 year olds.
Parents whose financial or social situation is considered precarious.
No benefits paid directly to parents. Generally no fee reduction for part time care.
6
Scheme
Age group
covered (years)
Full (part) time care: number of hours per week
provided
0-4
Additional fees can be charged by providers for certain types of childcare services. Fees tend to be higher for very young children. Most children start school at age 5.
No
Subsidised by both government and/or employers. Shortage of (subsidised and non-subsidised) childcare places for children aged 0-4. Extracurricular care for children aged 5-12 is available.
--
Additional information
5
There are large variations around the recommended fee levels. Actual average fees are higher than the maximum specified in national guidelines. Part time fees are often 1/3 lower; max. fees for first child can be more than 3 times that for further children. Most children are in part-time childcare. Those aged 4+ are usually in pre-school.
Fee varies with:
New Zealand
Netherlands
Day care
(or "Continu-ous Care")
Full-time fee per child (age 2 or as specified)
All official centres are subsidised. Kindergartens are mostly attended by 3-4 year olds and are run by associations that are often linked together in umbrella organisations; attendance is 3-5 half days per week.
6
No strict rules. Government attempts to ensure provision of childcare or financial assistance for specific groups or those in need.
Yes25-50 (average fee across all childcare users; rates can be significantly
higher for full-time, full-year childcare)
Yes
Poland 7
Yes
56

DELSA/ELSA/WD/SEM(2005)10 Table A1. (cont.)
National currency (2)
% of APW Income Family
status
Numberof children(in care)
Ageof
childProvision of childcare Priority access for
specific groups Other Compulsory school from
age
Nursery schools <2 -- -- -- -- -- -- --
Kindergarten 2-5 -- 625 6 Yes(4) -- No --
Private 0-2 35 88 6 -- -- -- -- -- -- --
116 9
1,140 6
1,950 37
404 25
555 34
516 32
Kindergartens are administered by the ministry of education. Nursery schools, on which no further information is available, are established by municipalities.
5-year olds; children with delayed start of compulsory schooling; and other criteria as determined by the facility.
The monthly parental contribution is regulated (excluding board) and can be reduced or waived for parents earning less than the a specified minimum income.
6
Yes(3)
During term-time (33 out of 52 weeks), 5 sessions/week of 2.5 hours of free care is provided for 3-5 year-olds in nursery school education or reception class (labelled "rebate/refund" in Figure 4.2). Informal care is widely used.
None.
No
Fees determined by private providers. 5
Undersupply of childcare places in many regions. Some facilities are subsidised. Terms are at the discretion of municipalities.
None at national level but may exist at local level for lone parents or low-income families.
Coverage and fees vary significantlty between cantons and regions. 6
(average)
Slovak Republic
Scheme
Age group
covered (years)
Fee varies with:
Fees locally regulated. Maximum fee is 1/3 of total cost depending on income. Income limits vary regionally and are often specified relative to minimium wages.
6
Additional information
Mostly for lone or working parents. Free childcare for families in serious difficulty.
Spain (4)
Switzerland(Zürich) Nursery 0-5
Sweden
3-5
Public facilities are subsidised. Coverage for age group 0-2 is very low but vast majority of age 3-5 are in subsidised public childcare.
Public
0-5 36 (<36)Pre-School("maximum charge" system. See add.
comments)
Yes(3)
Yes
Yes(3)
Yes
United Kingdom No No No(3)<2 50
2-5 50
(UK)
(England average)
-- Yes(3)
7
Childcare facilities cover demand in most areas. Almost all children aged 0-1 are looked after by a parent on parental leave at home.
Working or student parents; 15 hours per week for job seekers (receipients of UB/SA) and those on maternity leave.
"Maximum charge" system: fees are income-based (1st, 2nd, 3rd child: 3%, 2%, 1% of income) with an upper limit. Adoption of this system is encouraged, but not required. Free pre-school for 4-6 year-olds (35 weeks/year; 15 hours/week). Fees are generally waived for SA recipients.
400-5Nursery*
(England average)Nursery
(Daycare Trust data)
Full (part) time care: number of hours per week
provided
Yes(3)
Full-time fee per child (age 2 or as specified)
40(lower except for very
high incomes)
Yes
Yes(3) Yes
35 Yes
57

DELSA/ELSA/WD/SEM(2005)10 Table A1. (cont.)
National currency (2)
% of APW Income Family
status
Numberof children(in care)
Ageof
childProvision of childcare Priority access for
specific groups Other Compulsory school from
age
United States
(Michigan)
Centre-based care. <13 >30 479 18 Yes -- Yes --
Child Care and Development Fund (CCDF) day care. Available in most States only to families with very low income (measured relative to State Median Income or to poverty line).
Priorities are decided by each State, often given to children with special needs.
Varies considerably across States. Several programmes fund childcare facilities.
5-7(varies by
State)
Fee varies with: Additional information
Scheme
Age group
covered (years)
Full (part) time care: number of hours per week
provided
Full-time fee per child (age 2 or as specified)
1. Fees are for one month of full-time care not taking into account reductions due to periods where childcare may not be available or required, such as vacation. Where fee information is provided per hour of care, full-time care is assumed to cover 40 hours per week. The rates refer to the gross amounts charged to parents, i.e. after any subsidies paid to the provider but before any childcare-related cash benefits, tax advantages available to parents or childcare refunds/rebates that are akin to benefits. Fees include board where applicable. Where prices depend on income or family characteristics, the relevant maximum fees are shown. Unless fees are rule-based or uniform across institutions, averages or "typical" fees are shown. Information is for 2001 except for Canada (1998), Portugal (2000), New Zealand, Spain, Sweden, and the United States (2002), and Belgium, the United Kingdom and France (2003). "--" indicates that information is unavailable. "SA" refers to social assistance, or equivalent minimum income benefits. "APW" refers to the earnings of an average production worker. Where more than one estimate of childcare fees is shown, the one marked with an asterisk (*) is used for the model calculations in this paper.
2. In euros for euro-area countries.
3. In general but varies regionally or by provider.
4. Excluded from the calculations of net childcare costs in Sections 2 and 3 due to insufficient information.
Sources: Information provided by delegates to the OECD Working Party on Social Policy. Additional data are from the City of Vienna (Austria), the National Children's Nurseries Association (Ireland), Child Care Resource and Research Unit (1998), "Early Childhood Care and Education in Canada, Provinces and Territories", University of Toronto (Canada), Institute for Child and Family Policy (2001), "Early Childhood Education and Care: International Perspectives" (Belgium) and the Daycare Trust (United Kingdom).
58

DELSA/ELSA/WD/SEM(2005)10 Table A2. Childcare benefit schemes
2002 Cash benefits and tax reductions for users of non-
parental childcareBenefits for parental care at home
("home care" and "child-raising" allowances) Childcare facilities subsidised? Income test?
[1] [2] [3] [4]
Australia
Benefits paid for approved care (institutions) and registered care (child carer is officially registered). If both parents (or a lone parent) are working they are eligible for both types of CB. If neither parent is working they are eligible for up to 20 hours of approved care only.
Parenting payment provides income support to low-income persons who have primary care of children under 16 years of age. Families must receive no other income support payments. However, recipients can work while receiving the benefit (subject to a means test).
For approved care the benefit may be paid directly to the institution to reduce the fees charged.
Both rebates for approved care and parenting payments are family income tested (No income test for registered care fees).
Austria --
Childcare benefit is combined with the post-natal parental leave scheme and entitlement is linked to previous employment record. The benefit is payable for 18 months for one parent plus (optionally) another 6 for the other parent and is independent of the other parent's income or work status. May be combined with part-time work.(2)
Yes, varies by state (Land ). Yes, for child-raising allowances.
Belgium
Costs are tax deductible (up to a limit) if the care is in approved centres and only for children up to age 3 (free school starts at age 4). The alternative is a refundable tax credit.
-- Yes, varies by province (Communauté ). Yes for fees paid in centres.
Canada
Federal tax allowance for expenses up to limit. The Canada Child Tax Benefit includes a supplement for families with children aged under 7: full amount for those not claiming the childcare expenses as a tax allowance, reduction of 25% of childcare costs for those claiming it. Provincial governments may cover all or part of the cost if SA beneficiaries are involved in training or similar programmes. Some benefits available at provincial level, e.g. Ontario Child Care Supplement for Working Families (OCCS).
--Varies by province. Individual jurisdictions legislate maximum subsidy amounts, based on age of child, type of care setting, and duration of care (full/part time).
For Federal tax allowance: least of childcare expenses, 2/3 of earned income (of spouse with lowest earnings) or limits based on age of child. For OCCS (greater of 50% of childcare expenses or percentage of earnings over a limit which varies with number of children).
Czech Republic --
Parental allowance for full-time care for at least one child up to age 4. Rate is individual SA rate plus 10%. A parent with low work income may be eligible under certain conditions (e.g. maximum 5 days of childcare per month).
No Yes for working parent (maximum 1.5 times individual SA amount).
DenmarkFor low-income families, a graduated pay-scale reduces the (subsidised) fees by up to 100%. Reductions are shown as refund/rebate in Fig. 2.3 and 2.4.
--Heavily subsidised day care is available to all households with young children (parents only pay 30-32% of provider costs).
59
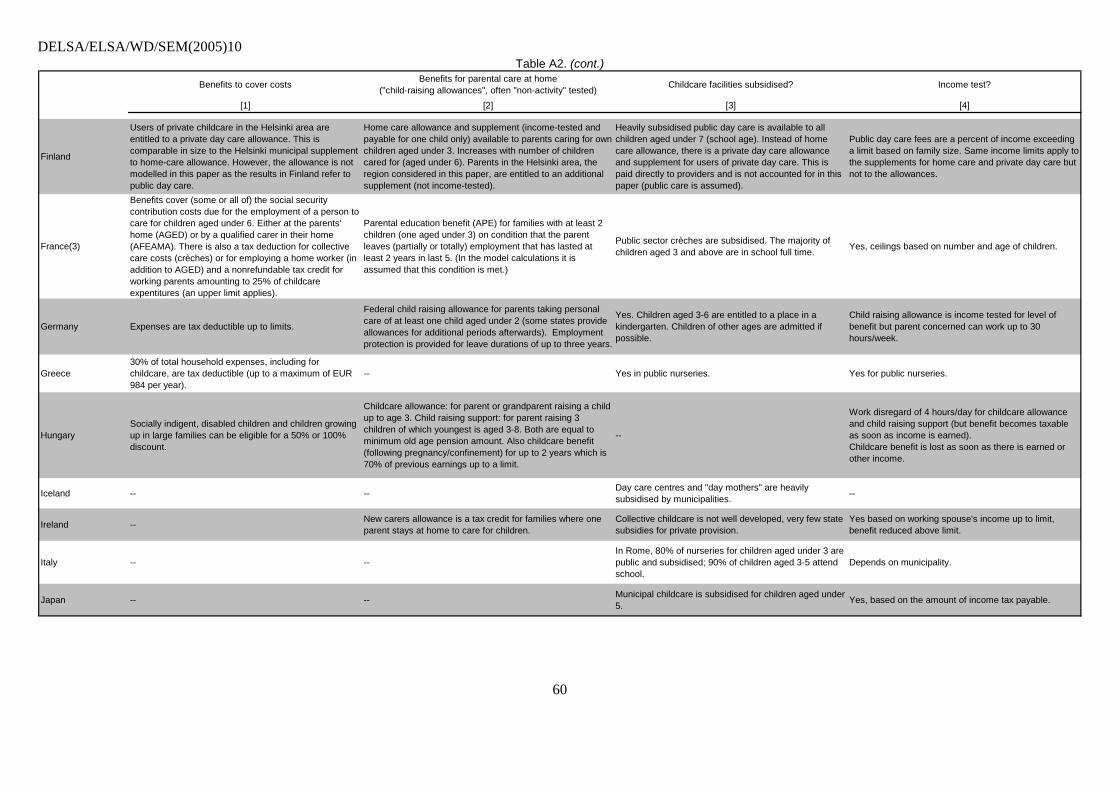
DELSA/ELSA/WD/SEM(2005)10 Table A2. (cont.)
Benefits to cover costs Benefits for parental care at home ("child-raising allowances", often "non-activity" tested) Childcare facilities subsidised? Income test?
[1] [2] [3] [4]
Finland
Users of private childcare in the Helsinki area are entitled to a private day care allowance. This is comparable in size to the Helsinki municipal supplement to home-care allowance. However, the allowance is not modelled in this paper as the results in Finland refer to public day care.
Home care allowance and supplement (income-tested and payable for one child only) available to parents caring for own children aged under 3. Increases with number of children cared for (aged under 6). Parents in the Helsinki area, the region considered in this paper, are entitled to an additional supplement (not income-tested).
Heavily subsidised public day care is available to all children aged under 7 (school age). Instead of home care allowance, there is a private day care allowance and supplement for users of private day care. This is paid directly to providers and is not accounted for in this paper (public care is assumed).
Public day care fees are a percent of income exceeding a limit based on family size. Same income limits apply to the supplements for home care and private day care but not to the allowances.
France(3)
Benefits cover (some or all of) the social security contribution costs due for the employment of a person to care for children aged under 6. Either at the parents' home (AGED) or by a qualified carer in their home (AFEAMA). There is also a tax deduction for collective care costs (crèches) or for employing a home worker (in addition to AGED) and a nonrefundable tax credit for working parents amounting to 25% of childcare expentitures (an upper limit applies).
Parental education benefit (APE) for families with at least 2 children (one aged under 3) on condition that the parent leaves (partially or totally) employment that has lasted at least 2 years in last 5. (In the model calculations it is assumed that this condition is met.)
Public sector crèches are subsidised. The majority of children aged 3 and above are in school full time. Yes, ceilings based on number and age of children.
Germany Expenses are tax deductible up to limits.
Federal child raising allowance for parents taking personal care of at least one child aged under 2 (some states provide allowances for additional periods afterwards). Employment protection is provided for leave durations of up to three years.
Yes. Children aged 3-6 are entitled to a place in a kindergarten. Children of other ages are admitted if possible.
Child raising allowance is income tested for level of benefit but parent concerned can work up to 30 hours/week.
Greece30% of total household expenses, including for childcare, are tax deductible (up to a maximum of EUR 984 per year).
-- Yes in public nurseries. Yes for public nurseries.
HungarySocially indigent, disabled children and children growing up in large families can be eligible for a 50% or 100% discount.
Childcare allowance: for parent or grandparent raising a child up to age 3. Child raising support: for parent raising 3 children of which youngest is aged 3-8. Both are equal to minimum old age pension amount. Also childcare benefit (following pregnancy/confinement) for up to 2 years which is 70% of previous earnings up to a limit.
--
Work disregard of 4 hours/day for childcare allowance and child raising support (but benefit becomes taxable as soon as income is earned). Childcare benefit is lost as soon as there is earned or other income.
Iceland -- -- Day care centres and "day mothers" are heavily subsidised by municipalities. --
Ireland -- New carers allowance is a tax credit for families where one parent stays at home to care for children.
Collective childcare is not well developed, very few state subsidies for private provision.
Yes based on working spouse's income up to limit, benefit reduced above limit.
Italy -- --In Rome, 80% of nurseries for children aged under 3 are public and subsidised; 90% of children aged 3-5 attend school.
Depends on municipality.
Japan -- -- Municipal childcare is subsidised for children aged under 5. Yes, based on the amount of income tax payable.
60
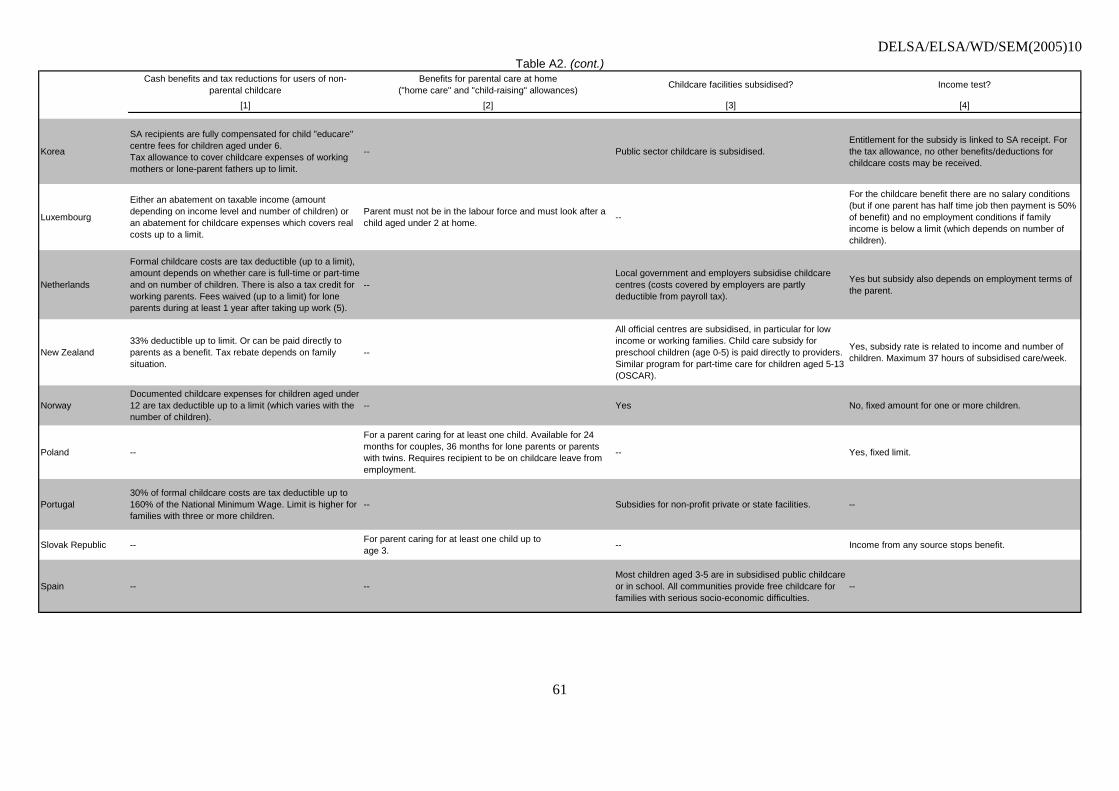
DELSA/ELSA/WD/SEM(2005)10 Table A2. (cont.)
Cash benefits and tax reductions for users of non-parental childcare
Benefits for parental care at home ("home care" and "child-raising" allowances) Childcare facilities subsidised? Income test?
[1] [2] [3] [4]
Korea
SA recipients are fully compensated for child "educare" centre fees for children aged under 6.Tax allowance to cover childcare expenses of working mothers or lone-parent fathers up to limit.
-- Public sector childcare is subsidised.Entitlement for the subsidy is linked to SA receipt. For the tax allowance, no other benefits/deductions for childcare costs may be received.
Luxembourg
Either an abatement on taxable income (amount depending on income level and number of children) or an abatement for childcare expenses which covers real costs up to a limit.
Parent must not be in the labour force and must look after a child aged under 2 at home. --
For the childcare benefit there are no salary conditions (but if one parent has half time job then payment is 50% of benefit) and no employment conditions if family income is below a limit (which depends on number of children).
Netherlands
Formal childcare costs are tax deductible (up to a limit), amount depends on whether care is full-time or part-time and on number of children. There is also a tax credit for working parents. Fees waived (up to a limit) for lone parents during at least 1 year after taking up work (5).
--Local government and employers subsidise childcare centres (costs covered by employers are partly deductible from payroll tax).
Yes but subsidy also depends on employment terms of the parent.
New Zealand33% deductible up to limit. Or can be paid directly to parents as a benefit. Tax rebate depends on family situation.
--
All official centres are subsidised, in particular for low income or working families. Child care subsidy for preschool children (age 0-5) is paid directly to providers. Similar program for part-time care for children aged 5-13 (OSCAR).
Yes, subsidy rate is related to income and number of children. Maximum 37 hours of subsidised care/week.
NorwayDocumented childcare expenses for children aged under 12 are tax deductible up to a limit (which varies with the number of children).
-- Yes No, fixed amount for one or more children.
Poland --
For a parent caring for at least one child. Available for 24 months for couples, 36 months for lone parents or parents with twins. Requires recipient to be on childcare leave from employment.
-- Yes, fixed limit.
Portugal30% of formal childcare costs are tax deductible up to 160% of the National Minimum Wage. Limit is higher for families with three or more children.
-- Subsidies for non-profit private or state facilities. --
Slovak Republic -- For parent caring for at least one child up to age 3. -- Income from any source stops benefit.
Spain -- --Most children aged 3-5 are in subsidised public childcare or in school. All communities provide free childcare for families with serious socio-economic difficulties.
--
61
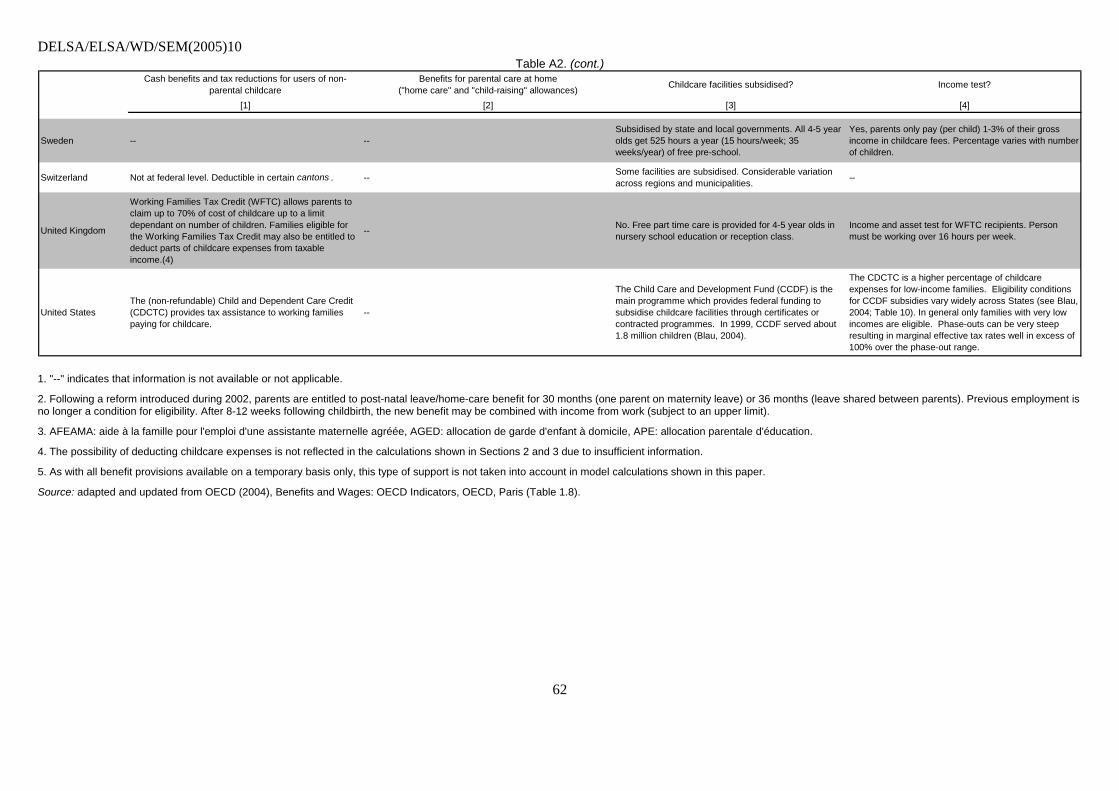
DELSA/ELSA/WD/SEM(2005)10 Table A2. (cont.)
Cash benefits and tax reductions for users of non-parental childcare
Benefits for parental care at home ("home care" and "child-raising" allowances) Childcare facilities subsidised? Income test?
[1] [2] [3] [4]
Sweden -- --Subsidised by state and local governments. All 4-5 year olds get 525 hours a year (15 hours/week; 35 weeks/year) of free pre-school.
Yes, parents only pay (per child) 1-3% of their gross income in childcare fees. Percentage varies with number of children.
Switzerland Not at federal level. Deductible in certain cantons . -- Some facilities are subsidised. Considerable variation across regions and municipalities. --
United Kingdom
Working Families Tax Credit (WFTC) allows parents to claim up to 70% of cost of childcare up to a limit dependant on number of children. Families eligible for the Working Families Tax Credit may also be entitled to deduct parts of childcare expenses from taxable income.(4)
-- No. Free part time care is provided for 4-5 year olds in nursery school education or reception class.
Income and asset test for WFTC recipients. Person must be working over 16 hours per week.
United StatesThe (non-refundable) Child and Dependent Care Credit (CDCTC) provides tax assistance to working families paying for childcare.
--
The Child Care and Development Fund (CCDF) is the main programme which provides federal funding to subsidise childcare facilities through certificates or contracted programmes. In 1999, CCDF served about 1.8 million children (Blau, 2004).
The CDCTC is a higher percentage of childcare expenses for low-income families. Eligibility conditions for CCDF subsidies vary widely across States (see Blau, 2004; Table 10). In general only families with very low incomes are eligible. Phase-outs can be very steep resulting in marginal effective tax rates well in excess of 100% over the phase-out range.
1. "--" indicates that information is not available or not applicable.
2. Following a reform introduced during 2002, parents are entitled to post-natal leave/home-care benefit for 30 months (one parent on maternity leave) or 36 months (leave shared between parents). Previous employment is no longer a condition for eligibility. After 8-12 weeks following childbirth, the new benefit may be combined with income from work (subject to an upper limit).
3. AFEAMA: aide à la famille pour l'emploi d'une assistante maternelle agréée, AGED: allocation de garde d'enfant à domicile, APE: allocation parentale d'éducation.
4. The possibility of deducting childcare expenses is not reflected in the calculations shown in Sections 2 and 3 due to insufficient information.
5. As with all benefit provisions available on a temporary basis only, this type of support is not taken into account in model calculations shown in this paper.
Source: adapted and updated from OECD (2004), Benefits and Wages: OECD Indicators, OECD, Paris (Table 1.8).
62

DELSA/ELSA/WD/SEM(2005)10
ANNEX B
88. This annex provides estimates of the work incentive impact of childcare costs for those countries where no reliable information on typical childcare centre fees was available (Czech Republic, Italy, Poland, Spain) and which have, therefore, not been included in Figures 3.4 and 3.5. For these countries, these results can nevertheless be valuable as a basis for evaluating work incentives if it is feasible to establish a plausible range of fees.
89. The format of Figure B1 is similar to Figures 3.4 and 3.5, except that childcare fees have been added as an additional dimension and incomes are shown after childcare costs. The light dashed lines represent combinations of in-work earnings and childcare fees where incomes net of childcare costs are the same as without work and no formal childcare. It is an “iso-income” curve in the sense that all combinations of earnings and childcare fees on this curve produce the same income net of childcare costs. For instance, for a Czech lone parent, 80% of average earnings and total childcare fees for both children amounting to 20% of APW result in the same family net income after childcare costs as a job paying 100% of APW combined with childcare fees at 30% of APW. Since both these points are on the dashed “break-even” line, they would both result in an income levels similar to a labour market inactive lone parent (with zero childcare costs).
90. Relative to this break-even boundary, parents considering taking up employment need to be further right/below (they need to earn more and/or find less expensive childcare) in order to gain. Additional iso-income curves (solid lines) are shown in order to identify such income gains with each curve indicating a further 10 percentage point increase as one moves away from the break-even boundary (the line closest to the break-even line represents a 10% gain relative to the “no-work/no childcare” situation, the next line indicates a 20% gain, and so on). For instance, the Czech lone parent spending 20% of APW on childcare fees and increasing her earnings from 80% to 120% of average earnings would be able to increase family income net of childcare costs by about 40% (fourth solid line). Finally, a dark dashed line indicates a doubling of family income relative to the no-work scenario (100% increase).
91. Where iso-income curves are closer together, small changes in fees (vertical distance) or earnings (horizontal distance) are sufficient to bring about a given percentage change in family resources. Benefits and tax reductions that move in parallel with childcare expenditure can moderate the influence of changing childcare fees on family resources in the same way as means-tested benefits and progressive taxes cushion the impact of earnings changes. Where benefits or tax reductions compensate for changing fees to some extent, vertical gaps are more pronounced (fees have to change by more in order to make a given difference in terms of net incomes). Downward sloping lines (as for lone parents in Poland) indicate very steep benefit withdrawals: increasing earnings can, over a certain earnings range, lead to declining net incomes if a number of benefits are lost simultaneously above a certain earnings level (housing benefits and childcare benefits in the case of Poland).
63
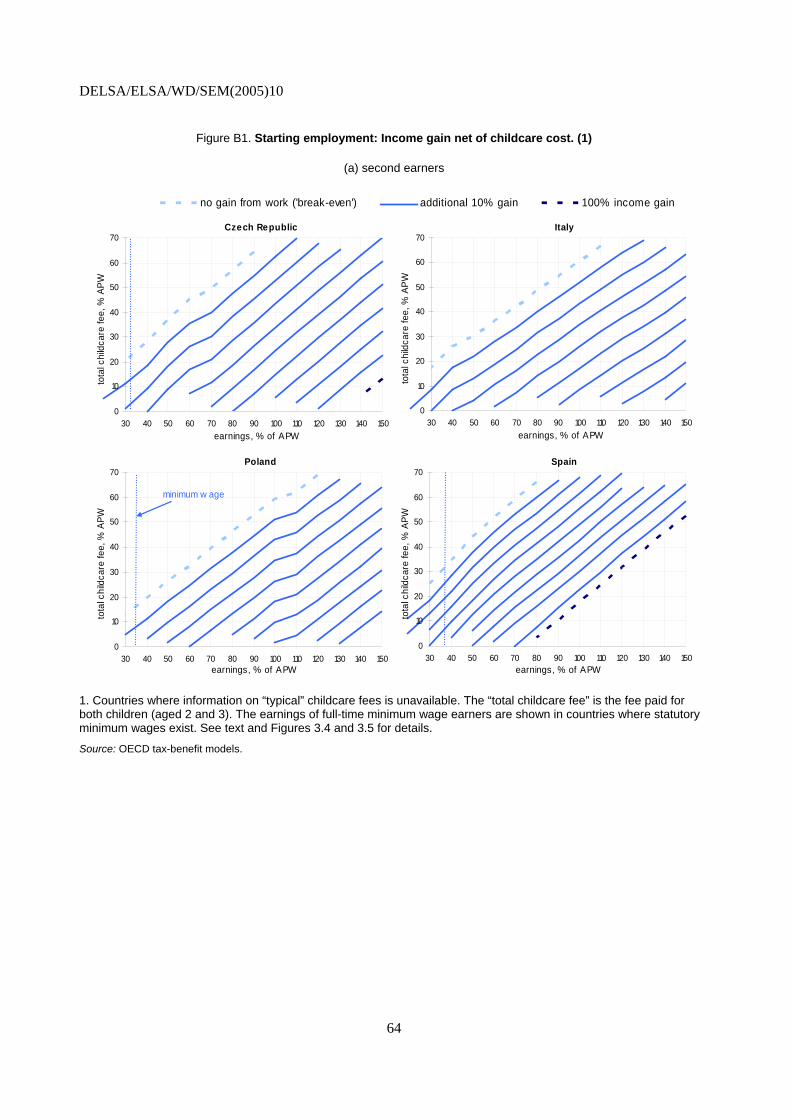
DELSA/ELSA/WD/SEM(2005)10
Figure B1. Starting employment: Income gain net of childcare cost. (1)
(a) second earners
Czech Republic
0
10
20
30
40
50
60
70
30 40 50 60 70 80 90 100 110 120 130 140 150earnings, % of APW
tota
l chi
ldca
re fe
e, %
APW
no gain from work ('break-even') additional 10% gain 100% income gain
Italy
0
10
20
30
40
50
60
70
30 40 50 60 70 80 90 100 110 120 130 140 150earnings, % of APW
tota
l chi
ldca
re fe
e, %
APW
Poland
0
10
20
30
40
50
60
70
30 40 50 60 70 80 90 100 110 120 130 140 150earnings, % of APW
tota
l chi
ldca
re fe
e, %
APW
minimum w age
Spain
0
10
20
30
40
50
60
70
30 40 50 60 70 80 90 100 110 120 130 140 150earnings, % of APW
tota
l chi
ldca
re fe
e, %
APW
1. Countries where information on “typical” childcare fees is unavailable. The “total childcare fee” is the fee paid for both children (aged 2 and 3). The earnings of full-time minimum wage earners are shown in countries where statutory minimum wages exist. See text and Figures 3.4 and 3.5 for details.
Source: OECD tax-benefit models.
64

DELSA/ELSA/WD/SEM(2005)10
Figure B1. (cont.)
(b) lone parents
no gain from work ('break-even') additional 10% gain 100% income gain
Czech Republic
0
10
20
30
40
50
60
70
30 40 50 60 70 80 90 100 110 120 130 140 150earnings, % of APW
tota
l chi
ldca
re fe
e, %
APW
Italy
0
10
20
30
40
50
60
70
30 40 50 60 70 80 90 100 110 120 130 140 150earnings, % of APW
tota
l chi
ldca
re fe
e, %
APW
Relative income gains are very large as a result of very low incomes of labour market inactive lone parents (see Section 2 and Annex Figure A1).
Poland
0
10
20
30
40
50
60
70
30 40 50 60 70 80 90 100 110 120 130 140 150earnings, % of APW
tota
l chi
ldca
re fe
e, %
APW
minimum w age
Spain
0
10
20
30
40
50
60
70
30 40 50 60 70 80 90 100 110 120 130 140 150earnings, % of APW
tota
l chi
ldca
re fe
e, %
APW
1. Countries where information on “typical” childcare fees is unavailable. The “total childcare fee” is the fee paid for both children (aged 2 and 3). The earnings of full-time minimum wage earners are shown in countries where statutory minimum wages exist. See text and Figures 3.4 and 3.5 for details.
Source: OECD tax-benefit models.
65

DELSA/ELSA/WD/SEM(2005)10
BIBLIOGRAPHY
Algan, Y. and P. Cahuc (2005), “The roots of low European employment: Family culture?”, CEPR Discussion Paper, No. 5169, Centre for Economic Policy Research, London.
Anderson, P.M. and P.B. Levine (2000), “Child care and mothers' employment decisions”, in D. Card and R. Blank (eds.), Finding Jobs: Work and Welfare Reform, Russell Sage, New York.
Apps, P. and R. Rees (2004), “Fertility, taxation and family policy”, Scandinavian Journal of Economics, 106(4), pp. 745-763.
Balestrino, A., A. Cigno and A. Pettini (2002), “Endogenous fertility and the design of family taxation”, International Tax and Public Finance, 9, pp. 175-193.
Becker, G.S. (1960), “An economic analysis of fertility”, in A. Coale (ed.), Demographic and Economic Change in Developed Countries, Universities-National Bureau Conference Series 11, Princeton University Press, Princeton, NJ, pp. 209–231.
Becker, G.S. (1965), “A theory of the allocation of time”, Economic Journal, 75, pp. 493-517.
Bennett, J. (2002), “Data needs in early childhood education and care”, paper presented at an OECD Early Childhood Education and Care workshop, 14-15 October, Paris.
Berger, L.M., J. Hill and J. Waldvogel (2005), “Maternity leave, early maternal employment and child health and development in the US”, Economic Journal (Feature: Parental Leave, Early Maternal Employment and Child Outcomes), 115, pp. F29-F47.
Blau, D. and J. Currie (2004), “Preschool, day care, and afterschool care: Who’s minding the kids”, NBER Working Paper No. 10670, National Bureau of Economic Research, Cambridge, MA.
Blundell, R., A. Duncan, J. McCrae and C. Meghir (2000), “The labour market impact of the Working Families’Tax Credit”, Fiscal Studies, 21, pp. 75-104.
Burgess, S., P. Gregg, C. Propper and E. Washbrook (2002), “Maternity rights and mothers’ return to work”, CMPO Working Paper, No. 02/055.
Choné, P., D. Le Blanc and I. Robert-Bobée (2003), “Female labor supply and child care in France”, CESifo Working Paper, No. 1059, Center for Economic Studies and Ifo Institute for Economic Research, Munich.
Cigno, A. (1986), “Fertility and the tax-benefit system: A reconsideration of the theory of family taxation”, Economic Journal, 96, pp. 1035-1051.
Cigno, A. (1996), “Cost of children, parental decisions and family policy”, Labour, 10, pp. 461-474.
Chatterji, P. and S. Markowitz (2005), “Does the length of maternity leave affect maternal health?”, Southern Economic Journal, 72, pp. 16-41.
66

DELSA/ELSA/WD/SEM(2005)10
Cleveland, G. and M. Krashinsky (2003), “Financing ECEC services in OECD countries”, paper presented at an OECD Early Childhood Education and Care workshop in Rotterdam, January.
D’Addio, A.C. and M. Mira D’Ercole (2005), “Trends and determinants of fertility rates: The role of policies”, OECD Social, Employment and Migration Working Paper, OECD, Paris, forthcoming.
Dang, T.T., P. Antolín and H. Oxley (2001), “Fiscal implications of ageing: Projections of age-related spending”, Working Paper No. 305, Economics Department, OECD, Paris.
Del Boca, D. and D. Vuri (2004), “Labor supply and child care costs”, paper presented at the IZA conference Women and the Labor Market in Europe, December 10-11, IZA, Bonn.
Dex, S., H. Joshi, A. McCulloch and S. Macran (1998), “Women’s employment transitions around childbearing”, Oxford Bulletin of Economics and Statistics, 60, pp. 79-98.
Doiron, D. and G. Kalb (2002), “Demands for childcare services and labour supply in Australian families”, Australian Economic Review, 35, pp. 204-213.
Doiron, D. and G. Kalb (2004), “Demands for childcare and household labour supply in Australia”, Melbourne Institute Working Paper, No. 6/04, University of Melbourne, Victoria.
Gregg, P., M. Guiterrez-Domenech and J. Waldfogel, Jane (2003), “The employment of married mothers in Great Britain 1974–2000”, CMPO Working Paper, No. 03/78.
Gregg, P., E. Washbrook, C. Propper and S. Burgess (2005), “The effects of a mother’s return to work decision on child development in the UK”, Economic Journal (Feature: Parental Leave, Early Maternal Employment and Child Outcomes), 115, pp. F48-F80.
Gutiérrez-Domènech, M. (2005), “Employment after motherhood: a European comparison”, Labour Economics, 12, pp. 99-123.
Immervoll, H., H. Kleven, C.T. Kreiner and E. Saez (forthcoming), “Welfare reform in Europe. A microsimulation analysis”, Economic Journal (an earlier version is available as OECD Social, Employment and Migration Working Paper No. 28).
Immervoll, H., P. Marianna and M. Mira D’Ercole (2004), “Benefit coverage rates and household typologies: Scope and limitations of tax-benefit indicators”, OECD Social, Employment and Migration Working Papers, No. 20, OECD, Paris.
James-Budumy, S. (2005), “The effect of maternal labor force participation on child development”, Journal of Labour Economics, 23, pp. 177-211.
Jaumotte, F. (2003), “Labour force participation of women: Empirical evidence on the role of policy and other determinants in OECD countries”, OECD Economic Studies, 37, pp. 51-108.
Kamerman, S.B., M. Neumann, J. Waldvogel and J. Brooks-Gun (2003), “Social policies, family types and child outcomes in selected OECD countries”, OECD Social, Employment and Migration Working Papers, No. 6, OECD, Paris.
Keen M., H. Papapanagos and A. Shorrocks (2000), “Tax reform and progressivity”, Economic Journal, 110, pp. 50-68.
67

DELSA/ELSA/WD/SEM(2005)10
Kleven, H.J. and C.T. Kreiner (2005), “A note on the efficient taxation of couples”, unpublished manuscript, Economic Policy Research Unit (EPRU), University of Copenhagen.
Kornstad, T. and T.O. Thoresen (2005), “A discrete choice model for labor supply and child care”, Journal of Population Economics, forthcoming.
Kunze, and Ejrnaes (2004), “Wage dips and drops around first birth”, IZA Discussion Paper, No. 1011, Institute for the Study of Labor, Bonn.
Lalive, R. and J. Zweimüller (2005), “Does Parental Leave Affect Fertility and Return-to-Work? Evidence from a ‘True Natural Experiment’“, IZA Discussion Paper, No. 1613, Institute for the Study of Labor, Bonn.
Lundsgaard, J. (2002), “Competition and efficiency in publicly funded services”, OECD Economic Studies, 35, pp. 79-128.
Michalopoulos, C. and P.K. Robins (2002), “Employment and child-care choices of single parent families in Canada and the United States”, Journal of Population Economics, 15, pp. 465-493.
O’Donoghue, C. and H. Sutherland (1999), “Accounting for the family in European income tax systems”, Cambridge Journal of Economics, 23 (5), pp. 565-598.
OECD (1999), Employment Outlook, OECD, Paris.
OECD (2001a), Employment Outlook, OECD, Paris.
OECD (2002a), Babies and Bosses - Reconciling Work and Family Life (Volume 1): Australia, Denmark and the Netherlands, Paris.
OECD (2002b), “Taxing the family”, Taxing Wages, Paris, pp. 25-40.
OECD (2003), Babies and Bosses - Reconciling Work and Family Life (Volume 2): Austria, Ireland and Japan, Paris.
OECD (2004a), Babies and Bosses - Reconciling Work and Family Life (Volume 3): New Zealand, Portugal and Switzerland, Paris.
OECD (2004b), Benefits and Wages: OECD Indicators, Paris.
OECD (2004c), Early Childhood Education and Care Policy in Germany: Country Note, OECD, Paris.
OECD (2005), Babies and Bosses - Reconciling Work and Family Life (Volume 4): Canada, Finland, Sweden and United Kingdom, Paris.
OECD (2006), Babies and Bosses - Reconciling Work and Family Life (Volume 5): Earning and Caring in OECD Countries, Paris, forthcoming.
Powell, L.M. (2002), “Joint labor supply and child care choice decisions of married mothers”, Journal of Human Resources, 37, pp. 106-28.
68

DELSA/ELSA/WD/SEM(2005)10
Pronzato, C.D. (2005), “Employment decisions of European women after childbirth”, paper presented at a conference of the European Panel Users Network, Institute for Social and Economic Research, University of Essex, Colchester, June 30-July 2.
Ronsen, M. and M. Sundstrom (1996), “Maternal employment in Scandinavia: A comparison of the after-birth employment activity of Norwegian and Swedish women”, Journal of Population Economics, 9, pp. 267-285.
Ruhm, C.J. (1998), “The Economic Consequences of Parental Leaves Mandates: Lessons From Europe”, Quarterly Journal of Economics, 113, pp. 285-317.
Ruhm, C.J. (2005), “Maternal employment and adolescent development”, IZA Discussion Paper, No. 1673, Institute for the Study of Labor, Bonn.
Sleebos, J. (2003), “Low fertility rates in OECD countries: facts and policy responses”, OECD Social, Employment and Migration Working Papers, No. 13, OECD, Paris.
Smith, A. (2004), “Who cares? Fathers and the time they spend looking after children”, Department of Sociology Working Paper, No. 2004-05, Nuffield College, University of Oxford.
Stancanelli, E. (2003), “Do fathers care?”, OFCE Working Paper, No. 2003-08, Observatoire Français des Conjonctures Economiques, Paris.
Tanaka, S. (2005), “Parental leave and child health across OECD countries”, Economic Journal (Feature: Parental Leave, Early Maternal Employment and Child Outcomes), 115, pp. F7-F28.
Taylor, B.A., E. Dearing and K. McCartney (2004), “Incomes and outcomes in early childhood”, Journal of Human Resources, 34 (4), pp. 980-1007.
Thibault, F., F. Legendre, J.P. Lorgnet and R. Mahieu (2004), “De l’APE à la PAJE: comment apprehender les effets sur l’emploi des femmes?”, Revue de l’OFCE, 90, 276-82.
Vlasblom, J.D. and J.J Schippers (2004), “The dynamics of female employment around childbirth”, University of Utrecht.
Vlasblom, J.D. and J.J Schippers (2005), “Motherhood and labour market participation: generational dynamics”, University of Utrecht.
Woodland, S., M. Miller and S. Tipping (2004), Repeat Study of Parents’ Demand for Childcare, National Centre for Social Research, Research Report No. 348 (revised version).
Wrohlich, K. (2004), “Child care costs and mothers’ labor supply: An empirical analysis for Germany”, DIW Discussion Paper, No. 412, German Institute for Economic Research, Berlin.
69

DELSA/ELSA/WD/SEM(2005)10
OECD SOCIAL, EMPLOYMENT AND MIGRATION WORKING PAPERS
Most recent releases are:
No. 30 CHALLENGES FACING LABOUR OFFICES AND SOCIAL INSURANCE (2005) Anders Reutersward
No. 29 NET SOCIAL EXPENDITURE, 2005 EDITION Willem Adema & Maxime Ladaique
No. 28 WELFARE REFORM IN EUROPEAN COUNTRIES: A MICROSIMULATION ANALYSIS (2005) Herwig Immervoll, Henrik Jacobsen Kleven, Claus Thustrup Kreiner and Emmanuel Saez
No. 27 TRENDS AND DETERMINANTS OF FERTILITY RATES: THE ROLE OF POLICIES (2005) Cristina d'Addio & Marco Mira d'Ercole
No. 26 THE “ENABLING STATE?” (2005) Neil Guilbert
No. 25 COUNTING IMMIGRANTS AND EXPATRIATES IN OECD COUNTRIES: A NEW PERSPECTIVE (2005) Jean-Christophe Dumont and Georges Lemaître
No. 24 TAXATION, ETHNIC TIES AND THE LOCATION CHOICE OF HIGHLY SKILLED IMMIGRANTS (2005) Thomas Liebig and Alfonso Sousa-Poza
No. 23 SHOULD WE EXTEND THE ROLE OF PRIVATE SOCIAL EXPENDITURE? (2005) Mark Pearson and John P. Martin
No. 22 INCOME DISTRIBUTION AND POVERTY IN OECD COUNTRIES IN THE SECOND HALF OF THE 1990S (2005) Michael Förster and Marco Mira d'Ercole
No. 21 DESIGN CHOICES IN MARKET COMPETITION FOR EMPLOYMENT SERVICES FOR THE LONG-TERM UNEMPLOYED (2004) Ludo Struyven
No. 20 BENEFIT COVERAGE RATES AND HOUSEHOLD TYPOLOGIES: SCOPE AND LIMITATIONS OF TAX-BENEFIT INDICATORS (2004) Herwig Immervoll, Pascal Marianna and Marco Mira D’Ercole
No. 19 AVERAGE AND MARGINAL EFFECTIVE TAX RATES FACING WORKERS IN THE EU. A MICRO-LEVEL ANALYSIS OF LEVELS, DISTRIBUTIONS AND DRIVING FACTORS (2004) Herwig Immervoll
No. 18 INDICATORS OF UNEMPLOYMENT AND LOW-WAGE TRAPS (Marginal Effective Tax Rates on Employment Incomes) (2004) Giuseppe Carone, Herwig Immervoll, Dominique Paturot and Aino Salomäki
No. 17 TAKE-UP OF WELFARE BENEFITS IN OECD COUNTRIES: A REVIEW OF THE EVIDENCE (2004) Virginia Hernanz, Franck Malherbet and Michele Pellizzari
No. 16 THE SWEDISH ACTIVITY GUARANTEE (2004) Anders Forslund, Daniela Froberg and Linus Lindqvist
No. 15 LOW FERTILITY RATES IN OECD COUNTRIES: FACTS AND POLICY RESPONSES (2003) Joëlle Sleebos
No. 14 NATIONAL VERSUS REGIONAL FINANCING AND MANAGEMENT OF UNEMPLOYMENT AND RELATED BENEFITS: THE CASE OF CANADA (2003) David Gray
Recent available working papers can be found on the OECD website: http://www.oecd.org/els/workingpapers.
Other series of working papers available from the OECD include: OECD HEALTH WORKING PAPERS
70

DELSA/ELSA/WD/SEM(2005)10
RECENT RELATED OECD PUBLICATIONS:
BABIES AND BOSSES: Reconciling Work and Family Life, Volume 4 Canada, Finland, Sweden and the United Kingdom (2005)
PENSIONS AT A GLANCE: Public policies across OECD countries (2005)
EXTENDING OPPORTUNITIES – How active social policy can benefit us all (2005)
SOCIETY AT A GLANCE: OECD Social Indicators (2005)
OECD EMPLOYMENT OUTLOOK (2005)
AGEING AND EMPLOYMENT POLICIES: AUSTRALIA (2005)
AGEING AND EMPLOYMENT POLICIES: AUSTRIA (2005)
AGEING AND EMPLOYMENT POLICIES: CANADA (2005)
AGEING AND EMPLOYMENT POLICIES: DENMARK (2005)
AGEING AND EMPLOYMENT POLICIES: FRANCE (2005)
AGEING AND EMPLOYMENT POLICIES: GERMANY (2005)
AGEING AND EMPLOYMENT POLICIES: NETHERLANDS (2005)
AGEING AND EMPLOYMENT POLICIES: UNITED STATES (2005)
MIGRATION, REMITTANCES AND DEVELOPMENT (2005)
TRENDS IN INTERNATIONAL MIGRATION: SOPEMI (2004)
MIGRATION FOR EMPLOYMENT: BILATERAL AGREEMENTS AT A CROSSROADS (2004)
INCOME DISPARITIES IN CHINA: AN OECD PERSPECTIVE (2004)
BENEFITS AND WAGES: OECD Indicators (2004)
REFORMING PUBLIC PENSIONS: SHARING THE EXPERIENCES OF TRANSITION AND OECD COUNTRIES (2004)
BABIES AND BOSSES: Reconciling Work and Family Life, Volume 3, New Zealand, Portugal, Switzerland (2004)
ASSET BUILDING AND THE ESCAPE FROM POVERTY: A NEW WELFARE POLICY DEBATE (2003)
MANAGING DECENTRALISATION: A NEW ROLE FOR LABOUR MARKET POLICY (2003)
COMBATING CHILD LABOUR: A REVIEW OF POLICIES (2003)
BABIES AND BOSSES: Reconciling Work and Family Life, Volume 2, Austria, Ireland and Japan (2003)
TRANSFORMING DISABILITY INTO ABILITY: Policies to Promote Work and Income Security for Disabled People (2003)
For a full list, consult the OECD On-Line Bookstore at www.oecd.org
71