can it disappear? should it disappear? - igc · sole owners 35% firm with paid workes onyl 12% ....
TRANSCRIPT
Can it disappear? Should it disappear?

Sources of Information The Private Sector Landscape Characteristics of MSMEs in Zambia- differences within the MSME sector Factors determining Growth and
Formalization How to formalize the Informals?

Zambia’s Informal Sector employs 90% of its workforce.
Key questions we pose are: Is there one homogeneous informal sector in
Zambia, with low productivity and low capacity to pay taxes? Does this sector need to disappear, and be replaced by “modern industries and farms”?
Or, does this sector contain a mix of firms, some of whom need to “disappear”, with others being brought into the Government’s tax net? What can be done to increase formalization? What is the role of Government provided public services in this process?

World Bank Enterprise Survey Zambia Business Survey Conducted in Late
2007 Includes 603 formal
firms in Manufacturing, Retail and Services.
Includes a separate survey of 119 urban microenterprises in Lusaka and Kitwe.
No coverage in rural areas or in Agriculture
Conducted in Late 2008 Has two components: A
Small Business Survey of 4800 mostly rural microenterprises. Includes the self employed, household firms and firms in Agriculture.
Also includes a separate survey of 169 Large firms.

Firm Mobility: Percentage of firms in Each Startup Size group Current Size
5-9 workers
10-49 workers
50-99 workers 100+ workers
Star
tup
Size
1-4 workers 60% 11% 1% 0%
5-9 workers 35% 37% 9.00% 32%
10-49 workers 4% 49% 56% 33%
50-99 workers 1% 2% 28% 22%
100+ workers 0% 1% 6% 43%
Source: World Bank Enterprise Survey, 2008

0%
10%
20%
30%
40%
50%
60%
70%
80%
90%
100%
Informal Micro Small Medium Large
ZSBS Micro Survey Formal Enterpise Survey
44%
17%
4% 1% 0%
46%
45%
17%
4% 5%
9%
22%
30%
26%
5%
1% 17%
49%
70%
91%
Primary Secondary Vocational University
Source: ZBS 2008, World Bank Enterprise Survey, 2008

Both the large firm Zambia Business Survey and the World Bank Enterprise Surveys report all firms registered for taxes.
Within the urban and rural microenterprise surveys, firms with higher sales are significantly more likely to register operations compared to others.

Enterprise Survey Microenterprises
ZBS Urban
Microenterprises a
ZBS All Microenterprise
Registered with any agency 79% 20% 6%
Registered with PACRA 61% 11% 3%
Have operating license from
local government 74% 18% 5%
Have TPIN from Zambia
Revenue Authority 50% 6% 2%
Even compared to the microenterprise survey component of the ICA Enterprise Survey, the household based sampling used in the ZBS meant that more small and informal enterprises are identified. We use the ZBS database to examine the characteristics of the MSME sector.

The Private Sector in Zambia comprises of: Approximately 500 Large Enterprises with
more than 50 employees, accounting for about 400,000 workers.
Remainder are located in about 1million MSMEs, employing about 4 million workers.
Of these1million enterprises, majority are either sole proprietors (35%) or family firms run by owner with unpaid family members (32%).

Eastern Province has the most MSME...
And 70% of them are in Agriculture..
Northern 14%
North Western 6%
Copperblt 8%
Central 9%
Lusaka 8%
Luapula 10%
Eastern 21%
Southern 11%
Western 13%
Distribution of MSMEs by Province
Agriculture 70%
Retail 21%
Manufacturing 3%
Hotel and Restaurant
2%
Other 4%
Distribution of MSMEs by Sector
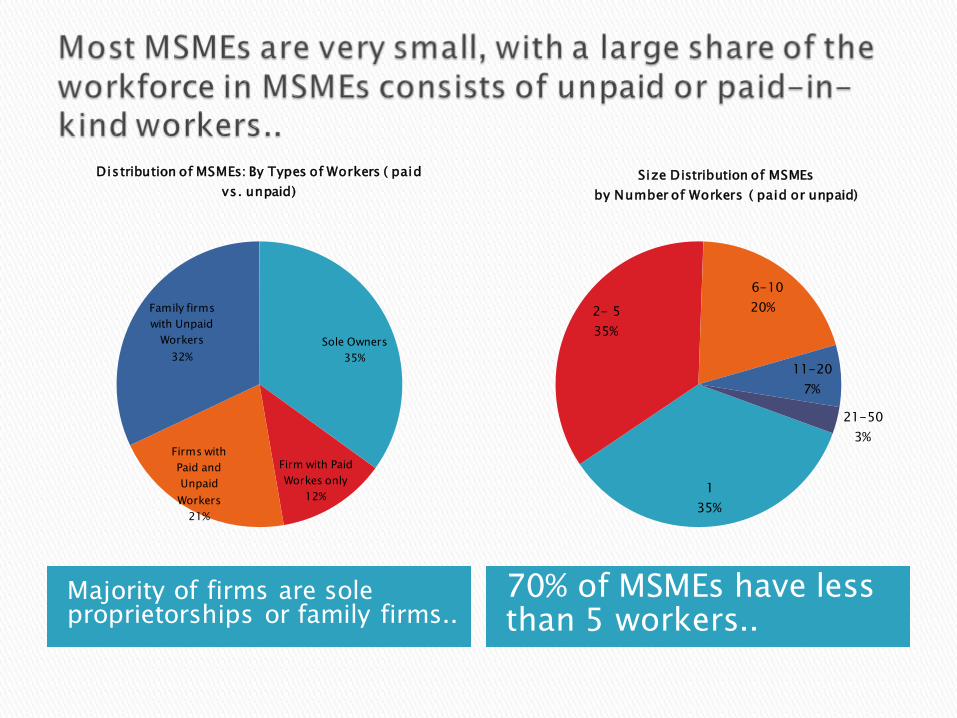
Majority of firms are sole proprietorships or family firms..
70% of MSMEs have less than 5 workers..
Sole Owners 35%
Firm with Paid Workes only
12%
Firms with Paid and Unpaid Workers
21%
Family firms with Unpaid
Workers 32%
Distribution of MSMEs: By Types of Workers ( paid vs. unpaid)
1 35%
2- 5 35%
6-10 20%
11-20 7%
21-50 3%
Size Distribution of MSMEs by Number of Workers ( paid or unpaid)

<100K ZMK 36%
100K-500K ZMK 37%
500K-1M ZMK 12%
IM-5M ZMK 12%
>5M ZMK 3%
Distribution of MSMEs-by Monthly Revenues

We’ve seen that only 2% of firms in the MSME sector pay any type of income taxes. How different are these firms from those that remain informal? Why did they choose to register?

Formal Firms have higher labor productivity..
But also correspondingly higher labor costs
0
100000
200000
300000
400000
500000
600000
700000
800000
900000
Agriculture Non-Agriculture
Average Productivity Median Monthly Sales per Worker
Informal Formal
0
100000
200000
300000
400000
500000
600000
Agriculture Non-Agriculture
Labor Costs per Worker (Monthly)
Informal Formal

Non-Agriculture Agriculture
0%
20%
40%
60%
80%
100%Electricity
Water
Bank A/CMobile Phone
Access toTransport
Informal Formal
0%
20%
40%
60%
80%
100%Electricity
Water
Bank A/CMobile Phone
Access toTransport
Informal Formal

0%
5%
10%
15%
20%
Pct reportingInspector Visits
Pct reporting BribePayments
Pct reporting Taxrates to be major
Constraint
Pct reporting TaxAdministration to be
Major constraint
Informal Formal
Multivariate regression results indicate that on average, firms that are registered are larger than unregistered firms. Controlling for firm size, these firms have more educated owners, and better access to financial and infrastructure facilities. But these firms are also more significantly more likely to complain about tax rates, tax administration and regulatory burden.

But Averages mask the dispersions: there is large area of overlap in size between Formal and Informal MSMES

Larger Informal Sector firms have
entrepreneurs with higher education, greater access to infrastructure facilities, and greater use of mobile phones and banking services.
The informal sector in Zambia is not a
residual sector with low productivity survival enterprises only.

The potential tax base is enormous. Currently, there are only 9,029 firms listed with the ZRA
paying Turnover taxes. Of these 8,173 firms are in Lusaka. Assuming a threshold annual revenue of 12M
ZMK (currently the level below which income tax=0%), we find that there are about 99,000 farmers, and 51,000 firms in other sectors-primarily retail-that are eligible to pay Turnover taxes.

Who has information? Business owner(s) or managers Third parties ◦ Banks and Other lenders ◦ Suppliers and Customers ◦ External accountants/auditors
Government ◦ •Regulatory, audit or service agency ◦ •Tax agency
Available Channels of Information about the Informal sector are through the Owner, Banks (if they use banks) and Customers or Suppliers.

Compliance Capacity: Do firms have the information, education to understand and pay taxes? Location and Sectors of Activity: Urban versus rural, tradable or non-tradable goods, producing intermediate or final goods Business Size: Revenues and Employment Each of these are discussed next.

0
5
10
15
20
25
30
35
40
The business does not make
enough money
The business doesn’t need to be registered
Don’t know
how to register
Unable to comply w
ithrequirem
ents
It costs too much m
oney
It's too complicated
Informal firms: Reasons for not registering
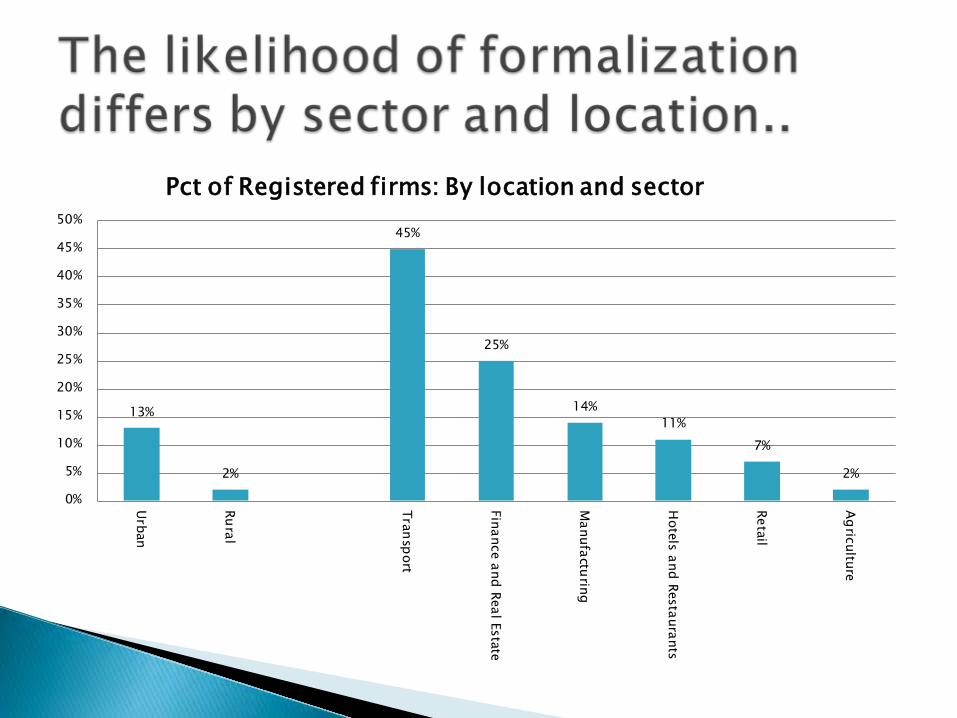
13%
2%
45%
25%
14% 11%
7%
2%
0%
5%
10%
15%
20%
25%
30%
35%
40%
45%
50%
Urban
Rural
Transport
Finance and Real Estate
Manufacturing
Hotels and Restaurants
Retail
Agriculture
Pct of Registered firms: By location and sector

10%
3%
10%
3% 3%
0%
9% 8%
18%
8%
4%
1% 2%
1%
9%
1% 2%
0% 0%
2%
4%
6%
8%
10%
12%
14%
16%
18%
20%
Non
-Agr
icul
ture
Agric
ultu
re
Non
-Agr
icul
ture
Agric
ultu
re
Non
-Agr
icul
ture
Agric
ultu
re
Non
-Agr
icul
ture
Agric
ultu
re
Non
-Agr
icul
ture
Agric
ultu
re
Non
-Agr
icul
ture
Agric
ultu
re
Non
-Agr
icul
ture
Agric
ultu
re
Non
-Agr
icul
ture
Agric
ultu
re
Non
-Agr
icul
ture
Agric
ultu
re
Central Copperbt Eastern Lupala Lusaka Northern Nwestern Southern Western

There are 15%, or about 150,000 large MSMEs (defined as those with annual sales > 12 M Kwachas).
These firms are more likely to be located in provinces along the Line of Rail (60%, compared to 34% of MSMEs overall).
66%, or almost 100,000 firms are agricultural enterprises, rest are in retail (23%), hotels and restaurants (2%) and manufacturing (1%).

28255
12514
10415 4683
3307
17870
5594
11633 4732
1316
12969
2142
2259
16381
5952
377
4070
5534
0
5000
10000
15000
20000
25000
30000
35000
Central Copperbt Eastern Lupala Lusaka Northern Nwestern Southern Western
Estimated Number of Large Informal Enterprises ( Annual Sales >12M Kwachas)
Agriculture Non-Agriculture

Only 5% of firms, or about 50,000 enterprises, report VAT payment
Only 2% of firms report having a cash register, indicating limited scope for VAT collection.
But 63% of firms report buying inputs from other businesses or government, rather than individuals, indicating possible VAT payments.

27%
12%
44%
34%
12%
2%
30%
16%
33%
17%
41%
20% 23%
7%
29%
39%
33%
6%
0%5%
10%15%20%25%30%35%40%45%50%
Non
-Agr
icul
ture
Agric
ultu
re
Non
-Agr
icul
ture
Agric
ultu
re
Non
-Agr
icul
ture
Agric
ultu
re
Non
-Agr
icul
ture
Agric
ultu
re
Non
-Agr
icul
ture
Agric
ultu
re
Non
-Agr
icul
ture
Agric
ultu
re
Non
-Agr
icul
ture
Agric
ultu
re
Non
-Agr
icul
ture
Agric
ultu
re
Non
-Agr
icul
ture
Agric
ultu
re
Central Copperbt Eastern Lupala Lusaka Northern Nwestern Southern Western
Percentage of Firms paying Income or Informal Taxes
Income Taxes Informal Taxes

The Informal sector in Zambia has a mix of larger productive firms along with small survival enterprises.
The larger firms can be brought under the tax umbrella through greater education and enforcement. Enforcement is particularly poor in provinces off the line of rail.
Increasing education, infrastructure and banking sector access will increase microenterprise revenues and have the complementary effect of increasing formalization.