can institutional investors improve corporate governance ... · can institutional investors improve...
TRANSCRIPT

Can Institutional Investors Improve Corporate Governance Through Collective Action?
Craig Doidge, Alexander Dyck, Hamed Mahmudi, and Aazam Virani∗
April 2015
Abstract
Can institutional investors generate sufficient power through collective action to drive improvements in governance? We use proprietary data on the private communications of a coalition of Canadian institutional investors and find that its private engagements influence firms’ adoption of shareholder democracy measures, say-on-pay advisory votes, improve compensation structure and disclosure, and influence CEO incentive intensity. Spillovers from engaged firms to non-engaged firms through board interlocks and informal regulation through definition and dissemination of performance relative to best practices, suggest a broader impact. This form of activism is both a substitute and complement to other interventions to address governance concerns.
∗ Doidge and Dyck are at the Rotman School of Management, University of Toronto. Mahmudi is at the Price College of Business, University of Oklahoma. Virani is at the Eller College of Management, University of Arizona. We thank the Canadian Coalition for Good Governance for making their information available to us and Matt Fullbrook and the Shareholder Association for Research and Education (SHARE.ca) for providing data. Anita Anand, David Beatty, Susan Christoffersen, Craig Dunbar, Stephen Erlichman, Bing Han, Ed Iacobucci, Wayne Kozun, Randall Morck, and Michael Robinson provided many useful comments as did seminar participants at Imperial College London, Rotman-ICPM Discussion Forum, University of Alberta, University of Calgary, UC San Diego, University of South Florida, and Warwick University. Mary Lou, Ashley Newton, Livia Nguyen, and Eric Wilson provided excellent research assistance. We are grateful to the Rotman International Centre for Pension Management for financial support.

1
In The Modern Corporation and Private Property (1932), Berle and Means warned that with the
separation of corporate ownership and control, the interests of shareholders and managers may diverge
and that “no shareholder is in the position to place important pressure upon the management...” (p. 84).
However, over the last few decades, ownership has been transformed by the emergence and growth of
institutional investors. In aggregate, these investors now own substantial stakes in many firms and could
have significant influence if they coordinated their efforts. But, do institutional investors work
collectively? If so, are they effective in engaging firms to represent shareholder interests and address
governance concerns? What mechanisms are important for success and are there limitations of
shareholder engagement through collective action? These questions are of more than academic interest.
Effective institutional investor activism provides a potentially attractive alternative to regulated solutions
to governance concerns, as advocated by Berle and Means and others.
In this paper we examine the formation of a collective action organization that seeks to increase
institutional investors’ power and test whether it has been effective in influencing firms’ governance. We
focus on the Canadian Coalition for Good Governance (CCGG) over the period from 2005 to 2013. The
CCGG is a collective action organization comprised of some of the largest institutional investors in
Canada. Its mandate is to promote good governance among Canadian firms by acting as the “Voice of the
Shareholder” and there is considerable anecdotal support for the CCGG’s importance. The announcement
of the formation of the CCGG in 2002 was covered in the press globally, including The Wall Street
Journal and Financial Times. In 2006, activist and governance expert Ira Millstein called the CCGG “an
example for the rest of the world to emulate,” and in 2008, the Global Proxy Watch described it as “a
powerhouse in Canada and global model of collective investor activism”.
To identify investor-led governance changes, our setting offers several key advantages. First, the
CCGG serves as a focal point for institutional investor activism and its members use the CCGG rather
than shareholder proposals or proxy fights to advance their agenda. Second, the CCGG has the potential
to have significant influence with firms. Collectively, its members hold an average stake of 14% (21% by
value-weight) in Canadian firms included in the leading index. Third, the CCGG privately engages
specific firms through letter writing campaigns, phone calls, and meetings with independent directors. It
made its records available to us so that we could form a complete picture of its activism efforts and

2
construct tests that estimate the influence of collective institutional investor activism on governance. Our
tests exploit the fact that only some firms were engaged by the CCGG on a specific governance issue in a
given year. Finally, interpretation of our results is not confounded by concurrent regulatory changes.
Governance in Canada is largely guideline based with a comply-or-explain requirement and there were no
mandated governance changes on the issues the CCGG focused on during our sample period.
We first look at which institutional investors chose to form, and belong, to the CCGG. The
institutional investor activism literature predicts that net benefits of activism are higher for institutions
that hold large, long-term stakes, are independent, and are foreign. These institutions are classified as
“independent” or “active”. Others are classified as “grey” or “passive”. CCGG members are all Canadian-
domiciled institutions by constraint, and aside from scale, these characteristics have limited power to
explain CCGG membership. Thus, institutions traditionally viewed as passive because of potential
conflicts, e.g., bank-affiliated asset managers, are members.
During our sample period, the CCGG engaged firms on three main governance issues that it
considers important. We examine the extent to which its engagements resulted in governance changes. In
each case, we find that CCGG engagement is associated with a statistically significant and economically
meaningful increase in the likelihood of adoption.
We begin with simple comparisons of adoption rates with and without engagement by the CCGG. In
2005, the CCGG engaged 42% of the firms in the S&P/TSX Composite Index on majority voting.
Engaged firms were more likely to subsequently adopt majority voting compared to firms not engaged by
32 percentage points. In subsequent engagements from 2008 to 2012, the CCGG engaged about 13% of
index firms each year. It frequently pushed firms to adopt say-on-pay and for specific improvements to
compensation structure and disclosure, including capped pension payouts, clawback provisions, and using
and disclosing performance peer groups (“compensation policies”). For both say-on-pay and
compensation policies, engaged firms were more likely to adopt by about 45 percentage points compared
to firms not engaged. Finally, we test whether engagements focused on compensation were followed by
changes in performance-based incentives. We find that the CEO’s equity pay ratio (EPR) and pay-for-
performance sensitivity (PPS) increased, but with no change in total pay.
3
These differences are large and attributing them to the influence of the CCGG faces at least two
potential concerns. First, firms that adopted may have done so absent CCGG engagement and/or because
of external pressures other than the CCGG. We estimate logit regressions and control for other external
pressures and firm characteristics. With these controls, we continue to find that CCGG engagements are
associated with subsequent adoptions. The probability of adopting majority voting is 17% higher for
engaged firms and it is 11% and 22% higher for say-on-pay and compensation policies, respectively.
After controlling for other influences on EPR and PPS, we find an 18% increase in EPR and a 38%
increase in PPS.
Second, there are concerns about endogeneity. The timing of CCGG engagements and firms’
subsequent adoptions rules out reverse causality. Although we include a broad set of control variables,
there could be unobservable differences between engaged and non-engaged firms that lead engaged firms
to adopt the governance changes, absent engagement by the CCGG. Of course, if this was the case, it is
not clear why the CCGG would spend its limited resources engaging these firms in the first place.
Nonetheless, we verify that the results for the 2008 to 2012 engagements and for changes in EPR and PPS
hold after controlling for unobservable differences.
In general, improving internal governance creates value (Cunat, Gine, and Guadalupe (2012)), but do
the specific governance changes sought by the CCGG matter? The fact that CCGG members devoted
financial resources and scarce management time to these activities indicates their importance and the
evidence is consistent with this view. We examine abnormal returns around the date when the formation
of the CCGG was first announced. We find statistically and economically significant higher abnormal
returns for firms in which CCGG members held higher stakes, e.g., those firms that were more likely to
be subsequently engaged by the CCGG. Evidence from other countries provides further support. For
example, majority voting and say-on-pay are valued by shareholders (e.g., Cunat, Gine, and Guadalupe
(2014), Cai and Walkling (2011), Ertimur, Ferri, and Oesch (2013), and Ferri and Maber (2013)) although
this conclusion is not unanimous (e.g., Cai, Garner, and Walkling (2013) and Larcker, Ormazabal, and
Taylor (2011)). There are benefits and costs to having clawback provisions in compensation contracts, but
on net, they are associated with higher valuations (e.g., Chen, Greene, and Owers (2015) and Iskandar-
Datta and Jia (2013)) while performance peer groups filter out the common factor of firms’ performance

4
measures to ensure that executives are not paid for luck (e.g., Holmstrom (1982)) and improves
executives’ incentives (Bettis, Bizjak, Coles, and Young (2014)). There is an extensive literature dating
back to Jensen and Meckling (1976) that advocates pay-for-performance as a mechanism to provide
value-increasing incentives for managers.
Does the CCGG’s impact extend beyond engaged firms? One potential channel to create a broader
influence is the spillover of governance practices to non-engaged firms through board interlocks (e.g.,
Bouwman (2011)). We test for such spillovers by focusing on firms not engaged by the CCGG and
identify which firms share at least one director with a firm previously engaged by the CCGG on a
particular governance issue. We find that non-engaged firms with overlapping directors are more likely to
adopt than other non-engaged firms and that this effect is stronger when the overlapping directors are
more powerful (e.g., Fogel, Ma, and Morck (2014)). We also document one important regulatory change
and efforts towards “informal regulation” by defining best practices, measuring firms’ governance
relative to these practices, and sharing this information, which was subsequently incorporated into widely
reported governance scores.
Did the CCGG make strategic and organizational decisions that helped make firms responsive to its
requests for governance changes? The decision to seek large investors as members, regardless of type,
ensured that the CCGG had a substantial stake in many firms, and mitigated the concern that its requests
were not representative of their investor base. The choice to focus much of its effort on engagement
meetings with independent directors was also important because insiders who might oppose such changes
were not part of the conversation. Finally, in addition to economic incentives, the CCGG leveraged social
incentives to encourage firms to adopt governance changes. These efforts include repeat engagements
with the same firms and restricting membership to Canadian-domiciled investors. Both decisions created
a higher likelihood of repeated face-to-face contact that create reputational and social penalties for
directors that do not respond to CCGG requests.
Does the CCGG’s collective action approach to activism offer a compelling substitute for other
governance mechanisms, or is it complementary? For large, widely-held firms, the CCGG had
considerable success with majority voting, say-on-pay, and improved compensation structure and
disclosure. These firms were responsive and had some flexibility as to when and how to respond, likely

5
lowering adoption costs. The CCGG is less likely to engage controlled corporations and has less influence
with them. We find some evidence that, when engaged, controlled corporations are less likely to respond.
Therefore, other interventions may be required for these firms. Compared to hedge fund activism (e.g.,
Brav, Jiang, Partnoy, and Thomas (2008)), the CCGG appears to be a complement. As a matter of policy,
the CCGG does not to engage firms on issues such as business strategy, financial policy, or leadership.
Instead, it restricts its focus to issues that do not require significant firm-specific information or analysis
and on which its members can reach consensus. Compared to proxy advisors, the CCGG is more
proactive on the issues we examine but focuses on a narrower range of issues and firms, suggesting it is
both a substitute and complement.
Our paper contributes to the literature on institutional investor activism and governance (see Gillan
and Starks (2007) and Yermack (2010) for reviews)). Prior research typically focuses on total institutional
ownership or ownership concentration (e.g., Hartzell and Starks (2003)), but cannot identify specific
coordination mechanisms. Black and Coffee (1994) and McCahery, Sautner, and Starks (2014) survey
institutional investors and find evidence of a willingness to coordinate and provide examples of informal,
event driven coordination. The Council of Institutional Investors’ Focus List of underperforming firms is
a well-known example of limited coordination (e.g., Opler and Sokobin (2000) and Song and Szewczyk
(2003)). Huang (2013) infers when institutional investors are more likely to coordinate and concludes that
there are benefits to coordination. There is also a literature that identifies and examines proxy advisory
firms’ voting recommendations as an alternative coordination mechanism (e.g., McCahery et al. (2014),
Choi, Fisch, and Kahan (2010)). We provide new evidence that firms change their governance practices in
response to a formal collective action organization of institutional investors. We highlight the scope for
collective action to proactively improve governance through non-legal channels, as well as the
limitations. We also confirm the importance of engagements through private channels (e.g., Carleton,
Nelson, and Weisbach (1998) and Becht, Franks, Mayer, and Rossi (2008)). Without access to
information about CCGG’s private engagements, one would reach different conclusions.
Finally, our paper highlights that it is possible for an umbrella group of institutional investors to be
active in governance, given the right organizational structure. This evidence complements prior research
that focuses on identifying which institutional investors are more active (e.g. Almazan, Hartzell, and

6
Starks (2005), Chen, Harford, and Li (2007), Ferreira and Matos (2008), and Aggarwal, Erel, Ferreira,
and Matos (2011)). Issues that appear to be important for the CCGG’s success are consistent with prior
work on collective action (Olson (1965)). Group size, the use of social norms, and creating and
dissemination information support group functioning.
The paper is organized as follows. Section 1 provides some evidence on institutional ownership of
Canadian firms and discusses some of the challenges that limit institutional investor activism. Section 2
describes the CCGG and the private data on engagement records we exploit in our empirical tests. Section
3 presents our main empirical results on the impact of engagements on adoptions. In Section 4 we
consider broader impacts, including spillovers to non-engaged firms, informal regulation, and event study
results. We discuss organizational choices, why firms respond to the CCGG, and whether the CCGG is a
substitute or complement for other governance mechanisms in Section 5. Section 6 concludes.
1. Institutional Ownership in Canada and Challenges that Limit Activism
In this section we introduce some basic facts about institutional ownership in Canada, and outline
three important challenges for institutional investor activism. To provide context, we also highlight some
similarities and differences with the U.S. and U.K.
For Canadian firms, we focus on firms included in the S&P/TSX index, the leading index for the
Canadian equity market. It includes the largest, most liquid Canadian publicly-listed firms. We use
institutional ownership data from Factset, downloaded via the Stock Ownership Summary application in
WRDS. This application uses the classification scheme of institutional owners developed by Ferreira and
Matos (2008). We supplement data missing from Factset by using information from Capital IQ.
Institutional ownership is sufficiently high that if institutional investors spoke with one voice they
could have a significant influence on decision making in most firms. Figure 1A provides a snapshot in
2005 and in 2012, the first and last years of our sample period. In 2005 institutional investors held 51% of
the shares of Canadian firms. To facilitate comparisons, we present similar data for U.S. and U.K. firms
included in the leading indices in those countries (S&P 500 for the U.S. and FTSE 350 for the U.K.).
Institutional ownership in the U.S. is higher than in Canada whereas it is lower in the U.K. (81% and
30%, respectively). The holdings are similar if we use value-weights, and for 2012.
7
Although aggregate institutional ownership is substantial, each individual institution typically holds a
small stake, leading to the well-known free rider problem. An individual investor bears all of the costs of
governance engagements but reaps only a small percentage of the benefits, leading to limited engagement
activity in equilibrium (e.g., Admati, Pfleiderer, and Zechner (1994)). The extent to which ownership is
concentrated may influence activism. To measure concentration we use the Hirschman-Herfindahl index
(HHI). It squares and sums the ownership stakes and ranges from 0 to 10,000. For example, if there are
100 institutional owners and each owns 1% of a firm, the HHI is 100. Figure 1B shows that in Canada the
HHI of institutional investors is 196 in 2005. In comparison the HHI for the U.S. and U.K. is 256 and 78,
respectively. Again, results are similar in 2012.
Some institutional investors face additional costs of activism and as a result are more inclined to be
passive. For example, investors that have business relationships with firms that extend beyond their
ownership stakes may be reluctant to take active steps to address governance issues. This concern was
developed in Brickley, Lease, and Smith (1988) and extended in Chen et al. (2007), Ferreira and Matos
(2008), and Aggarwal et al. (2011). Institutional investors are classified as either independent or grey
(alternatively, active or passive). Ferreira and Matos (2008) focus on the type of institution and label
pressure-sensitive institutions such as banks, insurers, pension plans, and governments as grey. Aggarwal
et al. (2011) focus on geography. The idea is that foreign institutional investors are less likely to face
potential conflicts and are more likely to be active compared to domestic institutional investors. Figures
1C and 1D show that the percentage of institutional ownership that is expected to be passive in Canada,
either by virtue of institutions being grey or domestic, generally lies between similar measures for the
U.S. and the U.K. Grey institutions account for 10% of total institutional holdings in Canada in 2005
while domestic institutions account for 61%.
A third challenge for institutional investors is the need to overcome legal and regulatory obstacles.
Meetings and communications between investors could be considered a ‘solicitation’ or a ‘joint action’ by
securities regulators in which case there are public disclosure obligations, a potentially costly public
formal solicitation, and takeover rules can be triggered. Meetings between investor groups and insiders
raise the potential for improper disclosure and insider dealing. Similar concerns are also important in the
U.S. and U.K. (see Black (1998), McCaherty et al. (2014), and the Collective Engagement Working

8
Group (2013)). Legal changes have reduced but not entirely eliminated such concerns. The U.S.
introduced changes to proxy rules in 1992. Canada followed in 2001 with changes to the proxy
solicitation provisions in the Canada Business Corporation Act (CBCA), relieving doubts that
communications between investors, within the meaning of the statute, would constitute a ‘solicitation’.
2. The CCGG as a Collective Action Organization and its Engagement Campaigns
In this section we first describe the CCGG, its members, and the source of its voice. We then discuss
the CCGG’s engagement strategy and the governance changes sought in its engagement campaigns.
2.1. The CCGG as a Focal Point for Governance Activism
On June 27, 2002 two prominent investors that were active in governance announced the intention to
form the CCGG. They were joined by a number of other important institutional investors. The
announcement was covered in the national and international press. The press releases, as well as media
commentary, noted that the recent change in legal rules facilitated the creation of such an organization.1
The founders hoped that the CCGG would act as ‘the voice of the shareholder.’ By the spring of 2003, the
organization hired a prominent Canadian independent director as managing director and created a high
profile board. The board was chaired by the chair of UBS Canada, previously a Federal finance minister,
and included chief executives of the institutional investors that joined the CCGG.
Over our sample period from 2005 to 2012, the CCGG was the main vehicle that its members used to
advocate for the governance changes that are the focus of this paper. To confirm the importance of the
CCGG we searched for signs of investor activity through other channels on these governance issues. First,
we gathered data on shareholder proposals and found 108 related proposals.2 However, only two (small)
CCGG members were active, filing eight of these proposals. Second, we looked for evidence of investor
involvement in lawsuits on these issues and found one case.3 Finally, we looked through 13D filings
1 See Dan Westell, “Canadian investors focus on governance,” Financial Times, July 1, 2002. 2 We use a list compiled by SHARE.ca. We code each shareholder proposal by category and restrict our attention to proposals related to majority voting, say-on-pay, and compensation structure and disclosure. 3 Three CCGG members (the Canada Pension Plan Investment Board, RBC Global Asset Management, and Connor, Clark, and Lunn Investment Management) filed a lawsuit to force disclosure of director voting results for Magna in 2011. See Janet McFarland, “Mike Harris lacked shareholder support as Magna chairman,” The Globe and Mail, December 7, 2011.

9
which indicate potential activity for firms with U.S. listings. We found two filings by CCGG members,
but neither filing was related to governance issues addressed by the CCGG.4
For our study, another attractive feature of the Canadian setting is that governance is largely
principles-based with a mandatory “comply or explain” approach for some governance issues (Anand,
Milne, and Purda (2012)). During our sample period none of the governance changes advocated by the
CCGG (at the time of the engagements) were required by corporate law, listing rules, or by securities
regulators. Canada does not have a national securities regulator. Instead, the formal regulatory structures
include provincial security commissions and stock exchange listing requirements. This contrasts with the
U.S. where legislators and regulators periodically impose new governance requirements on firms (e.g.,
changes following from Sarbanes-Oxley and Dodd-Frank). If investors in Canadian firms put a lower
probability on such regulatory interventions this enhances their incentives to act on their own, while
making it easier for researchers to identify the impact of investors’ actions because there is less concern
that governance changes followed from mandatory requirements, or anticipation of their introduction.
2.2. Who Joins the Collective Action Group?
To predict which institutions are active, the institutional investor activism literature focuses on the
tradeoff between the costs and benefits of activism for an individual investor. The characteristics of
institutional investors that join the CCGG could be the same as those identified in this literature, e.g.,
independent institutions with large, long-term holdings. The collective action literature focuses more
directly on factors that allow groups to avoid an uncooperative outcome. Olson (1965) discusses the
importance of small group size and the ability of the group to provide specific benefits to members
separate from the shared benefits that arise from the group’s activities. Ostrom (2000), in a review of the
evidence, highlights the role of mutual trust in overcoming the free rider problem. It is aided by some
actors who are “norm using” and willing to initiate cooperative behavior with the belief that a sufficient
proportion of others will reciprocate. Both Olson (1965) and Ostrom (2000) point to the importance of
face-to-face communication for the creation of social rewards and penalties. If social incentives are
4 In 2007, two CCGG members, the Canada Pension Plan Investment Board and the Ontario Teachers’ Pension Plan made bids as part of an unsuccessful private equity purchase of BCE In 2009, the Ontario Teachers’ Pension Plan was involved in the merger of PetroCanada.

10
important, we predict membership by domestic rather than foreign investors as domestic investors are
likely to have more frequent and repeated face-to-face contact.
We first examine the characteristics of institutions that join the CCGG. We then examine the
characteristics of the institutions that are active members of the CCGG (sit on the board and/ or a
working-group of the CCGG). These roles require additional time and effort from a top executive (the
member’s representative with the CCGG is almost always the CEO or Chief Investment Officer).
According to Factset, in 2005 there were 2,357 institutional investors in Canadian firms included in
the S&P/TSX index. When the CCGG announced its intention to form, 12 of these investors expressed an
interest in joining. It incorporated with 19 members in 2003 and by its first annual report in 2004 it had 34
full members. As of 2012 it had 50 members, the highest number of members since formation. All
members are Canadian-domiciled investors, a requirement of the CCGG’s bylaws.
In Table 1 we estimate logit regressions to identify the characteristics of CCGG members (models
(1) to (4)) and active CCGG members (models (5) to (8)). We use Factset and CCGG annual reports to
construct a dataset of institutional investors that could potentially be members of the CCGG over the
period from 2003 to 2012. Most, but not all CCGG members, are mentioned by name in Factset. In some
cases, we obtain information on holdings of Canadian equities from an institution’s annual reports.5
Given the CCGG’s bylaws, we exclude foreign institutional investors. This reduces the sample in these
tests to a maximum of 191 institutional investors per year in our sample period. Because an institutions’
decision to join or not is likely persistent across years, we cluster standard errors by investor.
Institutions that join the CCGG have a larger economic interest in Canadian firms, measured by the
dollar value of an institution’s total equity holdings in S&P/TSX Index firms (“Log(1+$ Ownership)”).
The coefficient on this variable is positive and significant in model (1) through (4). It is also significant in
models (5) through (8) and is about twice the size of those in (1) to (4). An institution’s economic interest
is an important determinant of CCGG membership and activity.
Controlling for economic interest, are other characteristics important? In models (1) and (5) we
introduce a dummy to identify banks, insurers, pension plans, endowments, and sovereign wealth funds
5 We have data for 43 out of 49 distinct CCGG members in 2007. Members with missing data include five asset management companies and one pension plan.

11
from other institutions. Ferreira and Matos (2008) classify these institutions as grey, and thus, more likely
to be passive (“Grey Institution”). In models (2) and (6), we use an alternative definition of grey that also
includes bank-affiliated asset managers. Regardless of the definition, we find no evidence that grey
institutions are less likely to join or be an active member of the CCGG. In (1) and (2), the coefficient is
positive and significant while it is not significant in (5) or (6).
We next estimate logit regressions that include dummy variables for each type of institution. We
split the grey group into its two main constituents of bank-insurer-affiliated institutions and pension
funds. We also include a separate category for investment management companies. The omitted category
is mutual and hedge funds. The positive and significant coefficient on pension funds in model (3)
indicates that they are more likely to join the CCGG though the coefficient in model (5) is not significant.
They are not more likely to be an active member. None of the coefficients on the other institution type
dummies are significant. In models (4) and (8), we introduce a dummy that equals one during 2008 to
2012 (“Late Period”) and interact it with dummies for each type of institution. In models (4) and (8) the
coefficient on the pension fund interaction is positive and significant. These results are consistent with
Coffee (1991) and Chen et al. (2007) who argue that pension funds’ long horizon and significant stakes
make them good candidates to be active investors, if political influence can be addressed.
Perhaps more interesting is the result that bank-insurer-affiliated institutions are more likely to join
the CCGG and take an active role in the later period after the CCGG established itself. The coefficient on
the interaction term for bank-insurer-affiliated institutions is positive and significant in both models (4)
and (8). These institutions were more willing to join the CCGG in later years and were more willing to
take an active role. This is important because in terms of equity holdings, bank-affiliated asset managers
account for a significant fraction of Canadian institutional equity holdings.
These results show that a central factor in participation is the economic interest of the institution,
with independence not playing a significant role. Not only are active involvement costs (e.g., senior
management time) focused on those with the most significant economic interest, so are direct fees,
making costs roughly proportional to benefits.6 One interpretation is that this collective action vehicle
6 The absolute dollar amount of fees changes over time, but the process has remained the same. “Fees are based on total assets under management (AUM). The annual fee for members with total AUM below $3.5 billion is $5,458.
12
provides a mechanism that enables investors that are otherwise presumed to be passive or conflicted to
become more active. As a result of the involvement of various types of owners, we also find that no one
type of investor dominates decision making. We return to this later, as it may help explain why firms are
responsive to CCGG requests for governance changes.7
2.3. The CCGG’s Voice
Black (1992) argues that institutional voice requires that not only institutions join forces, but that the
group include different types of institutions. The previous section shows that the CCGG pursued this
approach. One benefit of having large shareholders, regardless of investor type, is that the CCGG’s
members control a substantial percentage of Canadian equities. The size and importance of its members,
along with the broad representation of institutional investor types, gives the CCGG influence with firms it
engages and a strong claim as “the voice of the shareholder”.
Figure 2A shows CCGG members’ combined percentage stakes of Canadian firms in the S&P/TSX
index from 2005 to 2012. In 2005, CCGG members held an average stake of 14% (21% by value-weight)
in Canadian firms. These holdings represent more than a quarter of total institutional investor holdings.
The figure also shows ownership by investor types. The largest owners are investment advisors, with
bank-affiliated asset managers constituting more than half of this group, followed by investment
companies (e.g., mutual funds) and finally pension funds. The biggest change over time is the decrease in
pension plan holdings following a rule change in 2005 that allowed Canadian pension funds greater
flexibility to diversify outside of Canada.
Figure 2B shows there is variation in CCGG ownership across firms at the beginning of the sample
period in 2005 and at the end in 2012. In 2005, in more than 15% of firms, CCGG members held stakes
of less than 4% while at the same time their stakes exceeded 20% in 20% of firms. Finally, CCGG
members invest similarly compared to other Canadian institutional investors but invest in different types
As the AUM increases above $3.5 billion, the fee escalates on a straight line basis, for $1,516 for every billion to a maximum of $38,202.” (CCGG Annual Report, 2012, p. 23). 7 In unreported regressions, we also examine the potential explanatory power of the speed of turnover of the investors’ portfolio, using classifications provided in Factset. The coefficient on higher turnover indicators was consistently negative, but never significant.

13
of firms compared to foreign institutional investors (not reported). The correlation between CCGG
ownership and foreign ownership is only 0.136. For CCGG members there is no statistically significant
difference in their ownership of widely-held firms and controlled firms (those with a shareholder with a
stake of 20% or more, a significant minority of Canadian firms). Foreign institutional investors own
significantly smaller stakes in controlled corporations. This is consistent with prior literature that finds
foreign investors invest less in firms with weaker governance (e.g., Leuz, Lins, and Warnock (2009)).
2.4. Private Engagements on Measurable Governance Policies Facilitate Identification of Impact
The CCGG’s strategic agenda includes working in the policy arena, developing and broadcasting
best practices and guidelines, and directly engaging with firms’ boards to promote good corporate
governance policies and practices. Our empirical analysis focuses on the engagements. These
engagements were done privately and information about them was not made public. These records specify
the timing of the engagements, the identity of the engaged firms, the meeting attendees, and the specific
governance changes discussed.
In these engagements, the CCGG pursued several specific governance campaigns. The first
campaign focused on majority voting for directors, with the goal of improving shareholder democracy. In
2003, directors in all Canadian firms (except one) were elected by a plurality of votes cast so that in
uncontested elections, directors could be elected with a single vote. There were no votes for individual
directors and no required publication of the vote totals. As the CCGG stated in its letters to firms and in
subsequent publicly posted board policies, the existing system “does not permit shareholders to vote
against an underperforming director and allows an entrenched board to continue to be in charge of the
company, even if they are opposed by a majority of the owners of the company. The only option … is to
undertake a costly and confrontational proxy fight”.8 Instead, the CCGG suggested that “to ensure
effective shareholder democracy in the election of directors, the CCGG recommends that the board of
every public company adopt a majority voting bylaw or board policy”.9 Such policy changes can be
tracked, as they are reported in the proxies associated with the annual reports.10
8 CCGG Majority Voting Policy, March 2011, available at www.ccgg.ca. 9 It further specified this should include provisions for individual elections, disclosure of votes, use a majority standard whereby board members that failed by this standard submitted their resignation which would be accepted

14
The second campaign focused on firms’ compensation practices, with concerns about structure,
disclosure, and accountability. The CCGG provided financial resources that supported the collection of
data on current practices and began a dialogue with firms. In 2007 the CCGG issued its principles of
executive compensation and provided user-friendly examples through “best practices in compensation
disclosure”. As part of these efforts, the CCGG identified gaps in the mandated disclosures, in choices
around uncapped pension payments, the absence of clawback provisions, and the fact that few firms used
meaningful performance peers when awarding performance-based executive compensation. The adoption
of these measures is likewise reported in annual disclosures.
A related, but distinct campaign started in 2008 and became clear in April 2009 when the CCGG
publicly advocated for firms to introduce an advisory say-on-pay vote, stating that it would give
shareholders “an opportunity to express directly to the board their satisfaction with the prior years’
compensation plan and actual awards”.11 Similar to its majority voting policy, after consulting with firms
and legal experts, the CCGG issued a “model form on say-on-pay” in September 2010.
To summarize, the CCGG’s distinct governance campaigns and its engagement strategy provide
additional advantages to identify investor-led governance changes. First, each of its campaigns focused on
specific governance issues that we can measure. Second, these campaigns, executed through private
engagements, represent the bulk of its activity. Thus we have a complete picture of the CCGG’s activism
efforts. Third, the engagements in each campaign focused on a targeted group of firms in any given year.
Thus we can compare subsequent actions of firms engaged by the CCGG on a specific issue with those
not engaged. After controlling for other factors that could influence governance changes, we can better
identify the impact of collective institutional investor activism on governance.
by the board absent extraordinary circumstances. With these changes, investors could focus their discontent on specific directors, thereby raising reputational and real costs for directors and firms. 10 An issue perhaps notable for its absence was an initiative on anti-takeover devices or staggered boards. This reflects the fact that in Canada a number of features limit the impact of anti-takeover efforts. First, investors can call an Extraordinary General Meeting and replace directors, thus effectively eliminating staggered boards. Though they are rarely used, EGMs do make investors potentially more powerful. Second, in Canada investors can appeal to the Securities regulator to cease trade poison pills which makes it more difficult for directors to just say no to potential takeover offers. 11 CCGG Shareholder Engagement and “Say-on-pay” Policy, April 2009, available at www.ccgg.ca.

15
2.5. The CCGG’s Private Engagements With Firms
The private data we have access to consists of file records from the time period, including
engagement letters with firms, ex post reports of those engagements, and assorted other information. With
this data, we assembled a comprehensive record of the CCGG’s engagements with firms, the specific
items raised in the discussions, the identities of the meeting attendees (the specific CCGG members and
the engaged firm’s board members), and the timing of such communications.
For the majority voting campaign, we first identify the CCGG’s efforts to convey its views to firms
through letters and meetings. The 2005/2006 private engagement campaign had two related stages. It
began in the fall of 2005 when the CCGG contacted the boards of the five major Canadian banks (RBC,
TD Bank, Scotiabank, CIBC, and BMO) and two major insurers (Manulife and Sun Life). The lead
contact at the CCGG was its managing director David Beatty, a prominent Canadian business leader who
also sat on the board of a leading bank. In the letter to each bank the CCGG stated the total shareholdings
of its members and provided a model majority voting provision. The model provision was drafted by one
of Canada’s leading corporate law firms and was pre-vetted by the financial regulator. All seven firms
committed to adopt majority voting by the spring of 2006 and it was widely acknowledged that the
CCGG was the driving force behind the adoptions.12 The CCGG then sent letters to 81 additional firms in
which they identified majority voting for directors as an important issue. In many cases, the letters stated
CCGG members’ combined stakes and noted that the seven major financial institutions had agreed to
adopt majority voting. Finally, the letter provided examples of ways to improve. The engaged firms were
sent a follow up letter, sometimes accompanied by a phone call, or other communication. Following these
contacts with specific firms, the CCGG also published its policy guidelines on Majority Voting (in
August 2006) to provide additional guidance on best practices.
For the CCGG’s say-on-pay initiative and its efforts to encourage changes in compensation policies,
we focus on a second round of CCGG activity that started in 2008 and involved more intensive
engagements between the CCGG and firms’ boards. As it stated: “the CCGG believes that institutional
shareholders should have regular, constructive engagement with the boards and board compensation
12 See for example, “Big banks to allow election of individual directors,” National Post, November 9, 2005. A few of the banks also mentioned CCGG by name in their proxy statements when they disclosed adoption of the policy.

16
committees of public companies to explain their perspectives on governance, compensation and
disclosure practices, and to provide detailed comment on the company’s practices to the board. CCGG
expects boards will welcome this direct constructive interaction with large shareholders, which will
normally be held without management or advisors, and that it will lead to a better alignment of the
interests of shareholders with the interest of the board and management”.13
Over a period of five years from 2008 to 2012, the CCGG conducted (attempted) 143 (146)
engagements. It met with 76 different firms so that 65 of the engagements were repeated, providing some
form of accountability. The CCGG has an escalation protocol that it follows when firms decline to meet.14
In advance of most meetings, CCGG staff compiled a briefing report on the company that was shared
with CCGG members attending the meeting. After the meeting CCGG staff prepared a meeting report that
summarized the issues discussed and who was present. To ensure accuracy and a form of accountability,
meeting reports were sent to the independent directors of the engaged firm and to CCGG members who
checked it for accuracy before it was posted on the members’ only version of the web site. We read each
report and identified the issues raised. We identified four issues that were commonly raised in the
engagements: say-on-pay, capped pensions, clawbacks, and performance peer groups. Table 2, Panel A
provides summary statistics on the number of engagements by year as well as the issues raised.
Table 2, Panel B provides summary statistics on meeting attendees. The CCGG typically met with
independent directors without interference from management. In almost all cases at least two independent
directors attended the meetings (93% of meetings). The independent chair of the board or the lead
independent director was at 82% of the meetings. In 75% of the engagements, the meeting took place
without any members of management, legal counsel, or investor relations staff allowing for direct
communication between shareholders and board members. CCGG staff members attended all meetings. In
55% of the meetings, a senior executive from a prominent Canadian pension plan also attended.
13 CCGG Shareholder Engagement and “Say-on-pay” Policy. 14 Three firms declined to meet with the CCGG. Requests to meet, sent in writing by the CCGG managing director to the lead independent director were followed by phone calls from CCGG staff to the corporate secretary. If this failed, the CCGG’s managing director proposed to call directly, emphasizing the percentage of equity held by CCGG members and to express surprise at the board’s lack of interest in the views of major shareholders and to reiterate the need for a meeting. Failing this, the CCGG chair would notify all members advising them of the process that was followed and to ask members to consider this in their voting decisions for the board at the next AGM. [CCGG internal email March 11, 2011]

17
2.6. Data on Adoptions and Other Variables
To identify whether firms adopted the governance practices raised in the engagements, we read
firms’ proxy circulars which are circulated in advance of annual shareholder meetings and are available
on SEDAR.15 In particular, we identified whether the proxy circulars disclosed that the firm had an
internal policy requiring the resignation of a director receiving a majority of withheld votes during
director elections (majority voting); had a policy of holding shareholder advisory votes (say-on-pay); had
a policy to allow for it recoup performance-based executive compensation in the event of a restatement of
performance metrics (clawback); imposed a limit on the pension or retirement benefits that could be paid
out as a part of executive compensation packages (capped pensions); evaluated performance relative to a
specified group of peer firms when determining performance-based compensation (performance peer
groups). Table 2, Panel C provides a summary of adoptions for engaged and non-engaged firms. The
adoptions sample is smaller than the engagements sample because not all firms survive over the
subsequent two years.
We use several additional variables in our analysis. Table A.I provides definitions. We collect data
on institutional investor holdings for firms included in the S&P/TSX index from Factset and use Capital
IQ to fill in missing data for a small number of firms. Each year we categorize institutions as CCGG
members and compute their total holdings in each firm (“Log(1+CCGG $ Ownership)” or “CCGG %
Ownership”). We do the same for Canadian non-CCGG institutional investors (“Canadian Institutional %
Ownership ex CCGG”) and foreign institutional investors (Foreign Institutional % Ownership). We
identify as controlled corporations those that have multiple voting shares or a shareholder (or affiliated
shareholders) that controls 20% or more of a firm’s votes (“Controlled Corporation”).16 As an alternative
to the controlled corporation dummy, we use a good governance dummy. Our results are robust to using
15 The System for Electronic Document Analysis and Retrieval (SEDAR) is a document system operated by the Canadian Securities Administrators which contains filings made by Canadian public companies. It is similar to EDGAR, operated by the Securities and Exchange Commission in the U.S. 16 A 20% cutoff to define control is commonly used in the literature, e.g., La Porta, Lopes-de-Silanes, and Shleifer (1999). The CCGG uses a 30% cutoff to identify controlled corporations. Our results are robust with this cutoff.

18
this measure (not reported). In regressions where the coefficient on the controlled corporation dummy is
negative and significant, the coefficient on the good governance dummy is positive and significant.17
Firm size (“Log(Assets)”) and the financing deficit (“Financing Deficit”) are from Worldscope. We
follow Frank and Goyal (2003) and construct the financing deficit as the sum of dividends, investment
and change in net-working capital less cash flow, deflated by total assets. We use data from Datastream to
measure stock returns (“1-year Stock Return”) and compute a proxy for liquidity (“Turnover”).
Information on shareholder proposals is collected from SHARE.ca, the website of the Shareholder
Association for Research and Education. We focus on shareholder proposals specifically related to the
governance practices that the CCGG discussed with firms in their engagements (“Majority Voting
Proposal”, “Say-on-pay Proposal”, “Compensation Policy Proposal”). We use a variety of sources to
identify U.S.-listed firms and create a dummy that equals one for firms cross-listed on a U.S. stock
exchange in a given year (“U.S. Listed Firm”). For media exposure we use the log of one plus the number
of media citations (“Log(1+Firm Media Cites)”) found in The Globe and Mail and The Financial Post
during a given year. Finally, we use data from proxy circulars, annual reports. and data collected by the
Clarkson Centre for Business Ethics and Board Effectiveness to construct measures of CEO
compensation and incentive intensity and to construct a measure of board interlocks.
3. Empirical Results
In this section, we present the results of tests that examine the CCGG’s influence on the adoption of
governance changes, including majority voting, say-on-pay, compensation policies, and CEO incentives.
We first examine the determinants of CCGG engagements, i.e., which firms did the CCGG choose to
engage? We estimate logit regressions, where the dependent variable equals one if a firm was engaged on
a given policy by the CCGG in a given year and zero otherwise. The majority voting engagements and
explanatory variables are from 2005. The logit regressions for say-on-pay and compensation policies use
17 We use governance scores, reported by Canada’s national business paper, The Globe and Mail. The governance practices of firms included in the S&P/TSX index are rated based on four categories (board composition, shareholding and compensation, shareholder rights, and disclosure). Firms are rated based on information from their most recent annual shareholder proxy circulars. By construction, the scores also capture some of the governance differences between controlled corporations and widely-held firms. Because the criteria for these scores change over time, we set a dummy equal to one for firms ranked in the top third in a given year.
19
data on engagements and explanatory variables from 2008 to 2012. To test for an impact of CCGG
engagements on firms’ adoptions of governance policies, we estimate logit regressions where the
dependent variable is a dummy that equals one if a firm adopted a given governance policy within the
subsequent two years and zero otherwise. The key explanatory variable of interest is the engagement
dummy variable that equals one if the CCGG previously engaged the firm. The other explanatory
variables are also lagged in the adoption logit regressions.
The majority voting logit regressions include industry fixed effects based on one digit SIC codes and
we report robust standard errors. The logit regressions for say-on-pay and compensation policies include
industry and year fixed effects and the standard errors are clustered at the firm-level.
3.1. Majority Voting: Engagements and Adoptions
The sample we use for majority voting engagements includes 212 firms in the S&P/TSX index with
complete data for 2005 (we exclude income trusts throughout). Of these, 88 firms were sent letters by the
CCGG requesting that the firm adopt majority voting (see Table 2). The dependent variable is set to one
for these firms (“Engaged on Majority Voting”). Models (1) and (2) of Table 3 present the results of logit
regressions that examine the determinants of the majority voting engagements. In this table we want to
understand better the importance of the economic incentives of the CCGG to engage firms, captured by
either CCGG members’ dollar or percentage stakes in a firm. The choice of firms to engage could also be
influenced by other factors that could affect the success of the engagement. For example, ownership by
other institutions could provide the CCGG with additional influence, U.S.-listed firms might be more
receptive to engagements, while controlled corporations might be more difficult to influence. We also use
firm size as a catch-all measure for openness to external influences. Finally, the CCGG might engage
underperforming firms.
Consistent with statements made by the CCGG in annual reports, the driving force behind
engagements is its members’ stake in a firm. The coefficient on Log(1+CCGG $ Ownership) in model (1)
is significant at the 1% level and the Pseudo R2 is 0.479. In model (2) CCGG % Ownership is statistically
significant also at the 1% level. The Pseudo R2 is 0.413. Other factors also play a role. The coefficient on
1-year Stock Return is negative and significant at the 10% level in model (1) but not model (2). The
coefficient on the U.S. Listed Firm dummy is negative and significant in both models. In model (2) the

20
coefficients on Log(Assets) and Foreign Institutional % Ownership are positive and significant.18 Finally,
the coefficient on the Controlled Corporation dummy is positive but not significant in both models.
The majority voting adoption results are in models (3) to (6). We focus on adoptions in the two years
subsequent to the engagements (2006 and 2007). The letters were sent in December 2005 which left little
time for firms to make changes to their proxy for spring 2006. More generally, such governance changes
are discussed over several meetings, first in the governance committee then with the full board.19 The
sample includes the same set of firms but is smaller because 16 firms died in 2006 and 2007. These firms
could not potentially adopt majority voting and are dropped. Of the 85 engaged firms that survived
through 2007, 40 adopted majority voting. Of the 111 firms that were not engaged, 17 adopted.
The coefficient on the Engaged on Majority Voting dummy is positive and significant in each model.
In model (3), which includes the Engaged on Majority Voting dummy without any controls other than
industry fixed effects, the marginal effect is 0.303, e.g., CCGG engagement increases the probability of
adoption by 30%. We next estimate specifications that include controls for other internal factors that
could influence adoptions as well as other external influences. To capture key internal factors, we first
add the Controlled Corporation dummy. Model (4) shows that controlled corporations are significantly
less likely to adopt majority voting. Model (5) is similar but also controls for firm size as a catch-all
measure for internal factors and openness to external influences. The coefficient on Log(Assets) is
positive and significant, but the results are otherwise similar to those in models (3) and (4).
In model (6) we consider specific factors that could influence adoption decisions. Higher percentage
ownership by CCGG members and by other institutional investors could influence firms’ adoption
decisions. With higher turnover, institutional investors can more easily express their displeasure by
exiting, which could put pressure on firms to consider the CCGG’s request. Firms with poor prior
performance may be more readily influenced by investor pressures as might firms with a greater need to
raise external capital. The coefficient on CCGG % Ownership is positive and significant while that on
Financing Deficit is significant at the 10% level but is negative, contrary to expectations. None of the
other variables are significant. Other external factors that could lead to adoptions are media exposure,
18 We do not include Log(Assets) in model (1) because the correlation with Log(1+CCGG $ Ownership) is 0.78. 19 Results are similar with a one year window but are less robust than those with a two year window.
21
pressure from shareholder proposals, or pressure from the U.S. markets. The coefficients on Log(1+Firm
Media Cites), Majority Voting Proposal, and U.S.-Listed Firm are all positive, but only that on
Log(1+Firm Media Cites) is significant, and only at the 10% level. In this model, the marginal effect for
the Engaged on Majority Voting dummy is 0.17. We also estimated a model that includes an interaction
of the engaged dummy with the controlled corporation dummy (not reported). It is negative and
significant at the 10% level. That is, controlled corporations were less likely to respond to the engagement
than widely-held firms.
Overall, the variables that reliably explain the decision to adopt majority voting are whether or not
the firm was engaged by the CCGG and whether or not it is controlled by insiders. Our catch-all variable,
firm size, is statistically significant, but most of the specific proxies we use for internal factors and
external pressures are not. Because we use prior engagements to explain subsequent adoptions, reverse
causality cannot explain the results. However, we cannot rule out that there are unobservable differences
between firms engaged by the CCGG and those not engaged and it these differences that explain
adoptions rather than CCGG engagements. Unfortunately, all majority voting engagements occurred in
2005 and there is little we can do to formally address this issue. However, we note that the most important
determinant of majority voting engagement is the aggregate dollar stake of CCGG members and that
these members acquired their holdings independently from each other. Thus concerns about causality
must stem from unobserved differences between firms in which CCGG members held larger dollar stakes
and those in they held smaller stakes. In the next sub-section that examines say-on-pay and compensation
policies, we can more formally examine the potential impact of unobserved differences.
3.2. Say-on-pay and Compensation Policies: Engagements and Adoptions
In its second campaign, the CCGG focused on engagement meetings with firms’ boards to discuss
governance issues. To facilitate the engagements, CCGG staff contacted the board and requested a
meeting. These meetings involved a considerable time commitment for the CCGG’s board members, e.g.,
reading an analysis of the firm’s most recent proxy before the meeting, attending a meeting that usually
lasted one hour, and reading and commenting on briefing notes summarizing the meeting. These notes
were subsequently made available to all CCGG members. For the firm’s board members, the meetings
were, at least initially, an unusual event. Because they met directly with the CCGG without top executives
22
present, the meetings often required additional preparation. And, there was the possibility of a follow-on
meeting where the board members would be asked to describe steps, if any, taken in response to the
CCGG’s previous requests.
Over the period from 2008 to 2012, the CCGG conducted 143 such engagement meetings. In 40% of
these engagements the CCGG informed firms of its preference for the firm to introduce say-on-pay. It
also raised concerns about the firms’ policies related to compensation structure and disclosure (including
capping pension payouts, introducing clawback provisions, and using performance peer groups) in half of
these engagements. For our analysis, we include firms in the S&P/TSX index during 2008 to 2012 with
complete data. For the say-on-pay engagement logits in models (1) and (2) of Table 4, there are 894
observations. The dependent variable equals one for 57 observations (“Engaged on Say-on-pay”).
Similarly, for compensation policies in Table 5, there are 989 observations and the dependent variable
equals one for 69 observations (“Engaged on Compensation Policies”).20 We focus on the same
explanatory variables we used for majority voting engagements in Table 3, but we now have a five-year
panel. We cluster the standard errors at the firm-level.
Do the determinants of engagements differ for these more time consuming meetings compared to the
letter writing and phone call engagements for majority voting? As with majority voting, the total dollar
stake of CCGG members in a firm drives engagements. In model (1) of both Tables 4 and 5, the
coefficient on Log(1+CCGG $ Ownership) is statistically significant at the 1% level. However, in model
(2), the CCGG % Ownership is positive but not significant. More interesting, in these engagements, the
evidence suggests that the CCGG sought to economize its time by avoiding firms least likely to respond.
In particular, the Controlled Corporation dummy is negative and statistically significant in both tables.
We also find robust evidence of a negative and significant coefficient on 1-year Stock Return, suggesting
that the CCGG focused on weaker performing firms. Aside from these variables, we find engagements are
more likely for larger firms and in Table 5 we find a significant impact of foreign ownership.
The logit regressions that examine say-on-pay adoptions are in models (3) – (7) of Table 4. The
sample construction is the same as with the engagements, but drops firms that die in the two years 20 In Table 4, firms that adopt say-on-pay are dropped from the sample in subsequent years. For Table 5, compensation policies include capped pensions, clawback provisions, and performance peer groups. We drop a firm from the sample only after it has adopted all three of these policies.

23
following a potential engagement. Of the 49 engaged firms that survived, 28 adopted say-on-pay within
two years of the engagement. We focus on adoptions from 2009 to 2013 so that engagements and
explanatory variables are lagged. We also drop firms in the years after they adopt say-on-pay as they no
longer face a choice to adopt or not. This leaves a sample 751 firm-year observations.
The coefficient on the Engaged on Say-on-Pay dummy is positive and significant in each model. The
marginal effect in model (3) is 0.24, e.g., CCGG engagement increases the probability of adopting say-
on-pay by 24%. Model (4) shows that controlled corporations are less likely to adopt say-on-pay and this
inference holds no matter whether we control for internal factors and external pressures with firm size in
model (5) or whether we use more explicit proxies in model (6). In model (5) the coefficient on
Log(Assets) is positive and significant but CCGG members’ percentage stakes and ownership by other
institutions does not influence adoption. Model (6) shows that prior stock returns, turnover or need to
raise external finance do not influence adoptions either. However, media attention, whether or not a firm
received a say-on-pay proposal, and cross-listing status, are all positively related to adoptions. Note that
cross-listed firms are exempt from U.S. legislation that mandated say-on-pay in 2010. In (6), the marginal
effect for the Engaged on Say-on-pay dummy is 0.11. We also estimated a model that includes an
interaction of the engaged dummy with the controlled corporation dummy (not reported). The coefficient
is negative as expected, but not significant.
As with majority voting, the specific timing of the CCGG’s engagements and firms’ subsequent
adoptions allows us to rule out reverse causality as an explanation for the results. However, the potential
concern that adoption decisions could be driven by unobservable differences between engaged and non-
engaged firms remains. In its second campaign, the CCGG engaged firms in different years and on
different issues. We exploit these differences to address endogeneity concerns and set a dummy variable
that equals one for firms that were engaged by the CCGG on any issue in any year between 2008 and
2012 (“Engaged Firm”). For example, if a firm was engaged in 2010 on any issue, we set the dummy to
one each year from 2009 to 2013. When we include the Engaged Firm dummy in the say-on-pay adoption
regressions, it controls for unobservable differences between engaged and non-engaged firms and allows
the Engaged on Say-on-pay dummy to identify the specific impact of the say-on-pay engagements. The

24
results are in model (7). Although the Engaged Firm dummy is positive and significant, the Engaged on
Say-on-pay dummy remains significant at the 1% level and our earlier inferences are similar.
We provide similar results for the adoption of compensation policies in models (3) – (7) in Table 5.
Of the 66 engaged firms that survived, 40 adopted at least one of capped pensions, clawbacks, or
performance peer groups within two years of the engagement. A firm is dropped from the sample once it
adopts all three of these policies. The final sample includes 920 firm-year observations. Inferences are
similar and we do not discuss them in detail though we note that the marginal effects are larger. The
marginal effect on the Engaged on Compensation Policies dummy in model (3) is 0.29 implying that an
engaged firm is 29% more likely to adopt the proposed changes in compensation policies than a non-
engaged firm. Compared to say-on-pay, adding control variables does little to reduce the estimated
economic impact. There were a lot of say-on-pay shareholder proposals during this period and to be
conservative we allow them to influence our estimates even though many were not effective (out of 79
proposals, only 26 received at least 50% of the votes or were withdrawn because the company adopted
say-on-pay). In contrast to say-on-pay, there were few outside influences pushing for changes to
compensation polices aside from the CCGG. The marginal effect in model (6) is 22%. Finally, we
estimated a model that includes an interaction of the engaged dummy with the controlled corporation
dummy (not reported). It is negative and significant at the 5% level. That is, controlled corporations were
less likely to respond to the engagement than widely-held firms.
3.3. CEO Compensation and Incentive Intensity
The regressions so far focus on the specific issues raised in the engagements and adoption of those
issues. Through their dialogue with firms’ board members, the CCGG could also influence related
choices. One important choice is the incentive intensity in the top executives’ compensation plan. The
CCGG actively promotes executive compensation principles that align long-term firm and shareholder
success.21
We expect that engaged firms increase the proportion of CEO compensation that is sensitive to firm
performance following an engagement that discusses improvements in compensation practices. We
21 See Executive Compensation Principles, January 2013, available at www.ccgg.ca.

25
measure CEO incentive pay with two different proxies that are standard in the literature. First, we use the
equity pay ratio, which is the ratio of equity pay to total pay (EPR). Second, we use the pay-performance
sensitivity (PPS) of the CEO’s compensation contract. PPS (i.e., compensation delta) is the change in the
dollar value of CEO wealth derived from ownership of stock and stock options in the firm when the
firm’s stock price changes by one percent (see Jensen and Murphy (1990), Core and Guay (1999), and
Baker and Hall (2004)). To ensure that the results are not driven by outliers, we winsorize both measures
at the 1% and 99% tails each year and for PPS, we use a log transformation. The log transformation
significantly improves the explanatory power of the regression.
To conduct these tests we use hand-collected data on CEO compensation contracts from firms’
disclosures, some of which we collected and some compiled by the Clarkson Centre at the University of
Toronto. Each year we compute total pay (salary, bonus, stock, and options) and equity-based pay (stock
plus options plus performance share units (PSUs) and plus restricted share units (RSUs)). We value
options using standard methods and follow the methodology developed in Core and Guay (1999, 2002) to
estimate CEO PPS. We identify annual grants of PSUs and RSUs and make assumptions about hold
periods and other factors. Table A.I provides further details. The mean (median) CEO earns $4.4 million
($2.8), has an EPR of 44% (49%), and PPS of $687,000 ($176,000).
Table 6 presents regressions estimated over the period from 2008 to 2013. We start in 2008 as this
was the first year the CCGG engaged firms on compensation-related issues. The dependent variable is
either EPR (models (1) to (4)) or PPS (models (5) to (8)). The main variable of interest is whether or not a
firm was engaged by the CCGG on compensation policies during this period (“Engaged on
Compensation”). It equals one in year t and all subsequent years if a firm was engaged on compensation
polices in year t-1. Each model includes year and industry fixed effects. Models (4) and (8) include the
Engaged Firm dummy to control for differences in unobservable firm characteristics between engaged
and non-engaged firms.
In Model (1), the coefficient on the Engaged on Compensation dummy is 18.70 and is significant at
the 1% level. That is, CEO EPR of engaged firms increases by 18.70 percentage points in the years

26
following the engagement. This is economically significant when compared to the mean EPR of 44% and
standard deviation of 27%. Model (2) adds controls for whether or not a firm is in the S&P/TSX index
that year, whether or not it is controlled, and firm size.22 The coefficient on the Engaged on
Compensation dummy is 9.05 and remains statistically significant. Model (3) controls for variation in a
larger set of lagged observable firm characteristics and model (4) includes these variables as well as the
engaged firm dummy. The coefficient on the Engaged on Compensation dummy is 7.35 in (3) and 6.96 in
(4), both statistically significant at the 1% level. The coefficients of the control variables are generally
consistent with existing empirical studies. In particular, CEO EPR tends to be higher for firms with better
stock performance and more growth opportunities. These results are economically significant. The results
in model (3) imply an increase in EPR of 18%.
In Models (5) to (8), we replace CEO EPR with the log of one plus CEO PPS and re-estimate the
previous regressions. The main results are unchanged: CEO incentives, as measured by PPS increase
significantly following engagements by the CCGG. In models (7) and (8) the coefficient on the Engaged
on Compensation dummy is 0.324 and 0.338, respectively, and both are significant at the 10% level. The
results in model (7) imply that PPS increases by 38% following engagement by the CCGG. In unreported
regressions, we also examined the potential impact of engagements on total CEO pay using the same
approach. There is no statistically significant change in total pay. Overall, the results in Table 6 are
consistent with the prediction that CCGG engagements are followed by improvements to the structure of
CEO pay.
4. The CCGG’s Broader Influence
The CCGG engagement actions focus on firms in which its members have the most dollars invested.
However, in any year, engaged firms constitute a relatively small fraction of all publicly-traded firms and
the CCGG’s members interests extend beyond them. To what extent does it have a broader impact beyond
22 The sample focuses on S&P/TSX index firms but the group of firms included in the index changes from year to year. Rather than drop and add firms from the sample, we include all firms that were in the index during the sample period and include this dummy variable to indicate the specific years a firm is included.

27
the firms it directly engages? In this section we consider three channels. First we examine potential
governance spillovers through board interlocks. Next, we describe and discuss two other strategies the
CCGG employed. These latter two strategies actions likely impacted governance practices but
identification is more of a challenge. Finally, we present event study evidence from the announcement of
the formation of the CCGG to provide an assessment of its expected impact on firm values.
4.1. Spillovers to Firms Not Engaged by the CCGG: Director Interlocks
Prior research finds that governance practices spill over across firms through board interlocks
(Bouwman (2011)). Interviews with CCGG staff and the CCGG’s internal correspondence suggest that it
believed interlocks would help magnify its impact and that it sought to leverage these interlocks in some
of its engagements. Engaging the major financial institutions and getting them to be the first adopters of
majority voting was important. Directors of these institutions were viewed as influential as they sit on
more boards of other firms. In its initial engagement letters to firms on majority voting, for example, the
CCGG stated that these seven financial institutions had agreed to adopt majority voting. In some letters
the CCGG also mentioned that the board might want to consult with a particular director who sat on the
board of another firm that had recently adopted majority voting. An excerpt from a letter sent by the
CCGG on November 26 to a firm targeted in the majority voting campaign illustrates the idea: “Your
most recently appointed director, [director name], may be familiar with some of the issues surrounding
the adoption of a majority vote standard, as [firm name] has adopted a majority vote policy.”
We examine whether firms not engaged by the CCGG are more likely to adopt governance policies
advocated by the CCGG if they share a director with a firm that was engaged by the CCGG. To test
whether board interlocks affected the probability of adoption, we focus on majority voting and say-on-
pay, as the CCGG engaged a reasonably large number of firms on these issues. The CCGG also engaged
firms on three policies related to compensation structure and disclosure (capped pensions, clawbacks, and
performance peer groups) but each issue was raised with a smaller number of firms. We use data from
Clarkson Centre for Business Ethics and Board Effectiveness to construct a professional network of

28
directors of Canadian public firms. The data indicates directorship positons and starting dates and end
dates for each position that each director holds.23
Table 7, Panel A provides summary statistics on interlocks for firms that were not engaged by the
CCGG on majority voting in 2005. The summary statistics highlight the majority voting sample because
data for this campaign is cross-sectional and is easily summarized compared to say-on-pay which uses
firm-year data. For the majority voting campaign, 111 firms were not engaged in 2005 and survived
through 2007. Of these 111 firms 17 adopted majority voting in 2006 or 2007. Firms with an interlocking
director to a firm engaged by the CCGG were over twice as likely to adopt compared to firms without an
interlocking director. Firms with an interlocking director to one of the major seven financial institutions
(for brevity we refer to these as “big banks”) were almost five times more likely to adopt.
Table 7, Panel B provides evidence consistent with the idea that the big bank directors are indeed
influential directors in the Canadian equity markets. They hold more additional board seats and sit on the
boards of other firms that are larger. For example, in 2005, the mean (median) number of other board
seats on other S&P/TSX index firms held by a big bank director is 1.3 (1) compared to 0.3 (0) for
directors from other firms. The average size of the other firms on which a director sits on the board
(measured by the natural logarithm of market capitalization) is 37.2 (31.0) versus 32.8 (29.4). These
differences are statistically significant at the 1% level.
We also construct an interlock measure that utilizes concepts and tools from the network theory
literature to capture a director’s influence. This literature suggests interlock measures that are weighted by
the power of the interlocked director(s) within the network of all directors (e.g., Milgram (1967), Watts
and Strogatz (1998), and Banerjee et al. (2012)). Like El-Khatib, Fogel, and Jandik (2015), we use a
director’s network centrality to measure the power of engaged directors. Directors with high centrality
measures have more connections with other more connected directors and this means that they have the
potential to receive more information and pass it to other directors. Of the four common measures of
network centrality, degree centrality, betweenness centrality, and closeness centrality, we focus on 23 The advantage of focusing on professional connections is that they are objective and comparable across individuals. The disadvantage is that it misses other types of social connections that could also facilitate the flow of information and affect the power of a director in the network. Thus, the true unobservable network of directors has more connections than our professional network.

29
eigenvector centrality. It most closely captures the importance of an individual in the network. It weights
the power of the interlocked director(s) within the network of all directors (see Fogel, Ma, and Morck
(2014)). Table 7, Panel B shows that this measure is significantly higher for big bank directors.
Table 8 first presents the results for majority voting. The sample includes 111 firms with complete
data that were not engaged on majority voting by the CCGG in 2005. It examines factors that influenced
their decision to adopt majority voting in 2006 or 2007. We focus on a dummy that equals one if a firm
has a director that also sits on the board of a firm that was engaged on majority voting by the CCGG in
2005 (“Interlock”). We do not include industry fixed effects in these regressions. With this smaller
sample, some industries are not represented. Models (1) and (2) show that the coefficient on the Interlock
dummy is positive but not statistically significant, either with or without controls. In models (3) and (4)
we separate the Interlock dummy into overlapping directors that sat on the boards of one of the big banks
originally targeted by the CCGG (“Big Bank Interlock”) and those that sat on the boards of other firms
engaged by the CCGG (“Non Big Bank Interlock”). In both models (4) the coefficient on Big Bank
Interlock dummy is positive and significant while that on the Non Big Bank Interlock dummy is not (we
drop the Majority Voting Proposal dummy from model (4) because only one firm received a proposal). In
model (4), the marginal effect for the Big Bank Interlock dummy implies that having an influential
director that also sits on the board of a firm engaged by the CCGG increases the probability a firm adopts
majority voting by 14%. In Model (5) we use the summed eigenvector centrality of directors who sat on a
board which was engaged by CCGG (“Interlock Eigenvalue”). The coefficient on this variable is positive
and significant.
The sample for say-on-pay also focuses on firms not engaged by the CCGG and as before, once a
firm adopts say-on-pay it is dropped. The final sample includes 615 firm-year observations from 2009 to
2013. For say-on-pay we do not estimate regressions that examine interlocks of big bank and non-big
bank directors separately. The CCGG did not begin this campaign with a specific focus on the big banks.
In these regressions, we include industry and year fixed effects. The Interlock dummy equals one for
firms with a director who was also on the board of a firm that was engaged on say-on-pay by the CCGG
during the prior two years. The coefficient is positive and significant in models (6) and (7) and that on the

30
Interlock Eigenvalue is significant in (8), all at the 10% level. Compared to majority voting, the influence
of overlapping directors is smaller, perhaps because the CCGG did not focus on more influential directors
in this campaign. The bottom line, however, is that the CCGG’s influence extends beyond the firms that it
directly engages and one way it does so is through overlapping directors.
4.2. Impact on Governance Regulation
Engaging individual firms is costly and firms may adopt different or incomplete responses. An
alternative is to mandate change through regulation so that all firms adopt the same approach. Potential
regulatory channels include national legislation, securities regulation, or stock exchange listing
requirements. In 2014 the TSX made majority voting a listing requirement. This rule not only required
listed firms (with exemptions for firms where one holder or group controlled 50% or more of the voting
shares) to adopt majority voting, it strengthened the majority voting policies many firms had previously
adopted voluntarily. The CCGG’s actions cannot be ignored in this change. As we showed in Section 3,
its actions increased the likelihood of voluntary adoption and the TSX rule was close to the model first
publicly advocated by the CCGG in 2006. External commentators, such as The Globe and Mail and Glass
Lewis give the CCGG credit for this change.24
4.3. Informal Regulation Using Guidelines and Measurement to Change Norms
A second strategy the CCGG uses is a type of informal regulation. The goal is to shape norms
through the creation and dissemination of good governance guidelines and related activities. The first
CCGG guidelines focused on building high performance boards. Since then it has issued best practice
guidelines on a variety of issues, including majority voting and executive compensation. An advantage of
this approach is that the CCGG controls the agenda in setting these principles. It consults with firms and
outside experts, but it is not a political process open to other interest groups that invites comment letters
or seeks a compromise across opposing views. As the CCGG’s first chair stated: “… [regulators] can only
enforce minimum standards. They cannot enforce best practices…. It is our mandate to establish best
24 The rule required that majority voting be embedded in statutes, articles, bylaws or similar instruments (rather than a board policy), and required that the board accept the resignation absent exceptional circumstances whereas in many voluntary policies boards had more latitude in how to respond. See Erlichman (2014), “TSX to make majority voting rule mandatory”, The Globe and Mail, February 13, 2014, and www.glasslewis.com/tag/majority-voting/ [accessed May 23, 2014].

31
practices and encourage boards to adopt and live by these.” (CCGG annual report (2005)) The Managing
Director of the CCGG described this as the Drucker Wagon Train approach where you learn from the fast
movers at the front of the train, and you take that information to those in the middle, hoping to speed
them up, whilst ignoring those at the end who are unlikely to survive or listen to you.” (David Beatty,
CCGG board presentation (2006)).
Not only did the CCGG devise such norms, it also collected and helped publicize data that facilitated
measurement against these norms. The CCGG’s managing director summarized this approach to the
CCGG’s board: “measurement + best practices + exposure = board behavioural change.” (Report to the
Board of Directors of CCGG (2007)). For example, changes in publicly-reported governance scores and
criteria coincide with CCGG-subsidized data collection efforts around later stages in the majority voting
and compensation campaigns. The Globe and Mail rates firms’ governance each year and reports on them
in a series of articles, a fact well-known by corporate secretaries and board members. The categories and
scoring system were originally devised by Globe and Mail reporters, but given the costs and need for
standardization of collection of information for this exercise, The Globe and Mail relied on the Clarkson
Centre at the University of Toronto to collect the raw data. CCGG members and the CCGG itself
provided the bulk of the financing for the data collection and for several years, the managing director of
the CCGG was also the director of the Clarkson Centre. The CCGG managing director described this as
the Brandeis strategy, referring to Louis Brandeis famous phrase that “sunlight is the best disinfectant.”
New CCGG governance principles influenced new data collection and measurement. In Figure 3, the
grey dashed line (bottom line) shows that average governance scores increase over time but periodically
decrease sharply. The downward inflection points coincide with new criteria and new data being made
available in 2005 largely around majority voting, and in 2008 largely around compensation issues. What
might have happened to governance scores absent proposing new governance issues and data? The top
lines in the figure provide an indication. They show the average score for a constant set characteristics
that were in the scores overall all years. They steadily increased over time.

32
4.4. Event Study Results
A natural question is whether the CCGG’s engagements and its broader impacts are value
enhancing.25 As discussed in the introduction, evidence from other countries and settings provides support
for the value impact of majority voting, say-on-pay, and clawbacks. In addition, performance peer groups
and other pay-for-performance mechanisms provide value increasing incentives for managers.
We provide additional evidence that focuses on the announcement of the intention to form the CCGG.
To the extent that market participants anticipated the CGGG’s approach and the changes it would seek,
we expect higher abnormal returns for firms that were more likely to be engaged and respond to the
CCGG. The press release announcing the formation of the CCGG on June 27, 2002 attracted international
attention including The Wall Street Journal and The Financial Times. Twelve institutions were named as
potential CCGG members in this press release. We collected information on their ownership of Canadian
firms and test whether abnormal returns were higher for firms in which prospective CCGG members
owned larger stakes. We focus on the three-day abnormal announcement return surrounding this event.
Table A.I. provides further details on how we computed abnormal returns.
Table 9 provides the results. Firms expected to be the focus of CCGG activism, measured either by
dollar holdings (model (1)) or with percentage holdings (model (3)), have significantly higher abnormal
returns. These results hold when we include control variables in models (2) and (4). Because the CCGG’s
organizational structure, membership, activities, and its actual impact were not known at the time of the
announcement we place more emphasis on the sign and statistical significance of these coefficients rather
than the specific magnitudes, although we note that the coefficients are economically significant. For
example, in model (2), the coefficient on Log(1+$ ownership) is 0.436 which implies that a one standard
deviation increase in the log of CCGG dollar holdings is associated with a 0.91% higher abnormal return.
25 We do not perform an event study around the adoption of specific governance issues. News of adoption is usually in the annual proxy along with other information which makes identification difficult. Gillan and Starks (2007) and Ertimur, Ferri, and Oesch (2013) discuss the challenges of identifying a causal relationship between investor activism, governance changes, and value.

33
5. Discussion: Why Was the CCGG Effective?
Our results show that CCGG engagements are associated with subsequent improvements to specific
governance issues. This suggests that the CCGG’s actions increased the perceived net benefits of change
for directors. Several questions remain: Why do firms respond? Has the CCGG been a complement or a
substitute for other efforts or mechanisms to improve firms’ governance?
5.1. Why Do Firms Respond? Economic Incentives, Information, and Social Incentives
Three different reasons why directors’ perceived net benefits of adoption might have changed with
engagement are: expected firm-level costs of inaction arising from investors’ use of voting power or
voting with their feet; new or better information to directors about the benefits and costs of governance
changes; and, expected social and reputational incentives for directors arising from CCGG engagements.
The CCGG made explicit the threat that it could use its voting power to drive change. When its
formation was announced, one of the founders stated: “The organizations forming this coalition are the
large shareholders of Canadian companies. We have the voting power to influence governance practices
that should benefit all shareholders.” In almost all engagements with firms, the CCGG reminded directors
of its members’ ownership stakes. In Section 3, a number of the findings are consistent with the threat of
voting power being important. The CCGG has no ability to force change on controlled corporations and
controlled corporations were less likely to improve their governance. We also found some weaker
evidence that controlled corporations, where CCGG stakes would matter less, were less like to respond to
engagements. But the evidence is not particularly strong. In the adoption regressions, the coefficient on
CCGG % Ownership is always positive but is significant only for majority voting (although cross-
sectional differences in CCGG ownership across firms may be secondary in importance to its status as a
major shareholder). As discussed earlier, the CCGG prefers to engage in private and its members rarely
file shareholder proposals.
We next examine whether CCGG members create explicit economic consequences for firms that do
not respond to their private engagements. For example, CCGG members could exit, or threaten to exit, by
selling shares. In fact, when the CCGG was formed, the threat to sell shares was discussed as a weapon in
its arsenal. For the majority voting and say-on-pay engagement campaign, we examine whether CCGG
members sell more shares in firms that did not respond compared to those that did. We examine CCGG

34
member holdings in the quarter before the engagement and up to six quarters after (the last quarter where
we have a constant sample of firms). CCGG member holdings decreased more in firms that did not
respond. For majority voting, the difference is 1.55 percentage points (p-value=0.13) and for say-on-pay
it is 0.17 percentage points (p-value=0.45). While the direction of change is consistent with investors
voting with their feet, the change is not statistically significant.
The CCGG documentary record, interviews with CCGG members and staff, as well as directors at
engaged firms, suggest that the information channel is also important. Absent CCGG engagement,
directors may not know about a particular governance issue or may rely on insiders for information about
benefits and costs. The engagements help overcome these information problems by creating a direct
dialogue between shareholders and independent directors. The CCGG conducted research on a
governance issue, collected data, used credible third parties to certify the information, and shared it with
directors. For example, the CCGG raised majority voting as an important governance issue in advance of
any public discussion or introduction by proxy advisory firms. It solicited a legal opinion from a leading
corporate law firm on how firms could adopt majority voting without raising legal concerns and it
solicited and shared regulators’ endorsement of the change.26 In addition, the CCGG’s membership and
operating policies help make it a trusted source of information. To make a governance issue a priority
requires support from its members. The CCGG’s members include all types of institutional investors from
across the country. This helped alleviate concerns that the CCGG has a particular bias or speaks for only
certain types of investors. Finally, the CCGG has a policy of not publicly criticizing firms, filing
shareholder proposals, or taking other more aggressive actions. This policy likely facilitates the CCGG’s
efforts to engage with firms, to get them to voluntarily share information, and to take part in data
collection around new and evolving guidelines and best practices. Although we cannot construct specific
tests, it seems likely that all of these steps increased the perceived net benefits of the changes proposed by
the CCGG.
Finally, we consider social or reputation concerns for directors arising from engagements as another
channel. CCGG membership is restricted to Canadian domiciled institutional investors and the members’
26 CCGG correspondence, Explanatory notes attached to Suggested form of policy statement that accompanied letters to directors, sent Dec. 12, 2005.

35
top executives that are involved in the engagements are prominent Canadian individuals. The
engagements created face-to-face interactions between these executives and independent directors. Many
of these engagements are repeated, creating a circumstance where directors are asked to explain why they
have not responded to ‘reasonable’ requests of their shareholders. These same top executives and
independent directors are also likely to meet in social circles given the concentration of Canadian
publicly-traded firms in a few Canadian cities. Finally, the CCGG subsidized the creation of information
that enhanced such social penalties. This information was shared with the leading business newspaper and
poorly performing firms were highlighted in the press.
5.3. Complement or Substitute?
What relevance does the effectiveness of a privately-organized collective action organization such as
the CCGG have for a broader discussion about alternative mechanisms to address governance concerns?
Specifically, does the CCGG offer a reasonable substitute to regulation, proxy advisors, or hedge fund
activism, or is it sufficiently different that it should be viewed as a complement.
The CCGG focuses on firms in which its members have large dollar stakes, mainly large, widely-
held firms, and it had a significant impact on their governance choices. For these firms and the
governance issues the CCGG engaged them on, it appears to be a substitute, with an advantage relative to
regulatory solutions and proxy advisors. Regulatory responses are slower and less predictable in their
outcome because they involve a public call for comments that provide an opportunity for insiders, and
groups that support them, to lobby against change. For example, regulatory change for majority voting
was implemented in 2014, nine years after the initial CCGG campaign. There has been no regulatory
movement on say-on-pay or on the other compensation issues identified in CCGG engagements. For the
issues we focus on, the CCGG is proactive whereas proxy advisors are more reactive.
More broadly, however, the CCGG appears to be more of a complement than a substitute. Mid-size
and smaller traded firms that do not attract significant investment from CCGG members, and controlled
corporations, are less likely to be engaged by the CCGG in the first place. We also find that controlled
corporations are less likely to adopt the requested governance changes, and in some cases, find that they
are less responsive to CCGG engagements. The CCGG’s strategy of focusing on firms it would most
likely have success with and interviews with CCGG staff suggest both factors play a role. The bottom line

36
is that the CCGG has had less influence to promote governance changes at these firms and other
mechanisms are required. For example, proxy advisors provide recommendations for all firms, even those
in which CCGG members hold small stakes. Regulators can force change on controlled corporations.
The CCGG engaged a large number of firms on a common, but limited set of governance issues that
do not require significant firm-specific information and that are measurable. In contrast, activist hedge
funds typically engage individual firms on specific issues such as business strategy, financial policy, or
leadership (Brav et al. (2008)). In an interview with the CCGG’s managing director, a number of
arguments are offered to explain the CCGG’s different focus. The first is that the CCGG’s mission is
governance and nothing else. Second, the CCGG is a non-profit organization with limited resources.
Third, it would be more difficult to reach sufficient consensus among CCGG members on more complex
issues. Finally, its members have legal concerns about learning material non-public information in
engagements. We found only a small number of firms that were engaged (almost) simultaneously by the
CCGG and by activist hedge funds. There was no overlap in the topics of the engagements. Thus,
compared to hedge fund activism the CCGG is a complement.
6. Conclusion
In this paper we examine whether collective action by institutional investors can improve firms’
governance. We exploit the fact that in Canada, a broad group of investors of different types, including
public pension plans and asset managers, formed an organization called the Canadian Coalition for Good
Governance (CCGG) and used it as the primary vehicle to pursue governance reforms. We test whether
the organization had an impact on governance by focusing on its engagement strategy with individual
firms. We exploit information on private communications between the CCGG and firms to test whether
these private engagements influenced the adoption of governance improvements advocated by the CCGG.
The changes we focus on include the adoption of majority voting, say-on-pay, improved compensation
structure and disclosure, and incentive intensity. We provide additional discussion and some related
evidence on the CCGG’s strategies to influence governance more broadly through public policy,
publishing good governance guidelines, and measuring firms’ governance practices against principles.
37
CCGG engagements had a statistically significant and economically meaningful impact on the
likelihood of subsequent adoption of majority voting, say-on-pay, on compensation disclosure and
structure, and on incentives. These results are robust to a large set of control variables as well as
unobservable differences between engaged and non-engaged firms. Through board interlocks, we find the
CCGG’s influence extends beyond the engaged firms. An event study of the announcement of the intent
to form the CCGG shows firms most likely to be engaged by the CCGG had positive and significant
abnormal returns.
Our evidence suggests that a collective action organization can have an impact on governance
through activism. The CCGG’s structure facilitated activism by all types of domestic institutional
investors, including those that are traditionally expected to be more passive. The factors that contributed
to CCGGs effectiveness may have relevance elsewhere. These include forming a powerful group with a
small number of members by focusing on investor scale rather than type and harnessing social incentives,
in addition to economic incentives, to improve group functioning and firms’ responses.
The results also raise questions about the potential future for such investor groups in a world with
increasingly large international capital flows. If trust plays an important role and face-to-face interaction
between leading investors and directors, either formally through engagement meetings or more informally
at social events, is an important channel for creating social rewards and penalties, these interactions will
be more difficult with foreign rather than domestic owners. Moreover, it suggests that efforts to
encourage collective action among all institutional investors, regardless of country of origin, may not be
successful (see e.g., the Kay Report (2012) in the U.K.). It could also pose a problem for the CCGG in the
future as founding members, such as the large pension plans, have substantially reduced the percentage of
their assets in Canadian equities.

38
References
Admati, A., Pfleiderer, P., and Zechner, J., 1994, Large shareholder activism, risk sharing, and financial market equilibrium, Journal of Political Economy 102,1097–1130
Aggarwal, R., Erel, I., Ferreira, M. and Matos, P., 2011, Does governance travel around the world? Evidence from institutional investors, Journal of Financial Economics 100, 154-181.
Almazan, A., Hartzell, J., and Starks, L., 2005, Active institutional investors and costs of monitoring: Evidence from executive compensation, Financial Management 34, 5-34.
Anand, A., I., Milne, F., and Purda, L., 2012, Domestic and international influences on firm-level governance: Evidence from Canada, American Law and Economics Review 14, 68-110.
Baker, P., and Hall, J., 2004, CEO incentives and firm size, Journal of Labor Economics 22, 767–798.
Banerjee, A., Chandrasekhar, A., Duflo, E., and Jackson, M., 2012, The diffusion of microfinance, NBER working paper 17743.
Becht, M., Franks, J., Mayer, C., and Rossi, S., 2010, Returns to shareholder activism: Evidence from a clinical study of the Hermes UK Focus Fund, Review of Financial Studies 23, 3093-3129.
Bettis, J., Bizjak, J., Coles, J., and Young, B., 2014, The presence, value, and incentive properties of relative performance evaluation in executive compensation contracts, Working paper, University of Utah.
Brickley, J., Lease, R., and Smith, C., 1988, Ownership structure and voting on antitakeover amendments, Journal of Financial Economics 20, 267-291.
Black, B., 1992, Agents watching agents: the promise of institutional investor voice, UCLA Law Review 39, 811-893.
Black, B., 1998, Shareholder activism and corporate governance in the United States, The New Palgrave Dictionary of Economics and the Law 3, 459-465.
Black, B. and Coffee, J., 1994, Hail Britannia?: Institutional investor behavior under limited regulation, Michigan Law Review 92, 1997-2087.
Bouwman, C., 2011, Corporate governance propagation through overlapping directors. Review of Financial Studies 24, 2358-2394.
Brav, A., Jiang, W., Partnoy, F., and Thomas, R., 2008, Hedge fund activism, corporate governance, and firm performance, Journal of Finance 63, 1729-1775.
Cai, J., Garner, J., and Walkling, R., 2013, A paper tiger? An empirical analysis of majority voting, Journal of Corporate Finance 21, 119-135.
Cai, J., and Walkling, R., 2011, Shareholders’ say-on-pay: Does it create value?, Journal of Financial and Quantitative Analysis 46, 299-339.
Carleton, W. T., Nelson, J., and Weisbach, M., 1998, The influence of institutions on corporate governance through private negotiations: Evidence from TIAA‐CREF, Journal of Finance 53, 1335-1362.

39
Chen, M., Greene, D., and Owers, J., 2015, The costs and benefits of clawback provisions in CEO compensation, Review of Corporate Finance Studies, forthcoming.
Chen, X., Harford, J., and Li, K., 2007, Monitoring: Which institutions matter? Journal of Financial Economics , 86, 279-305.
Choi, S., J. Fisch, and Kahan, M., 2010, The power of proxy advisors: Myth or reality?, Emory Law Journal 59, 869.
Coffee, J., 1991, Liquidity versus control: The institutional investor as corporate monitor, Columbia Law Review 91, 1277-1368.
Core, J., and Guay, W., 1999, The use of equity grants to manage optimal equity incentive levels, Journal of Accounting and Economics 28, 151–184.
Core, J., and Guay, W., 2002, Estimating the value of employee stock option portfolios and their sensitivities to price and volatility, Journal of Accounting and Research 40, 613–630.
Cuñat, V., Gine, M., and Guadalupe, M., 2012, The vote is cast: The effect of corporate governance on shareholder value, Journal of Finance 67, 1943-1977.
Cuñat, V., Gine, M., and Guadalupe, M., 2014, Say pays! Shareholder voice and firm performance, Working paper, LSE.
El-Khatib, R., Fogel, K., and Jandik, T., 2015, CEO network centrality and merger performance, Journal of Financial Economics, forthcoming.
Erlichman, S., 2014, Majority voting finally arrives in Canada. The Harvard Law School Forum on Corporate Governance and Financial Regulation, Link to website, accessed May 20, 2014.
Ertimur, Y., Ferri, F., and Oesch, D., 2013, Shareholder votes and proxy advisors: Evidence from say-on-pay, Journal of Accounting Research 51, 951-996.
Ferri, F., and Maber, D., 2013, Say-on-pay votes and CEO compensation: Evidence from the UK, Review of Finance 17, 527-563.
Fogel, K., Ma, L., and Morck, R., 2014, Powerful independent directors, NBER working paper 19809.
Frank, M., and Goyal, V., 2003, Testing the pecking order theory of capital structure, Journal of Financial Economics 67, 217-248.
Gillan, S., and Starks, L., 2007, The evolution of shareholder activism in the United States, Journal of Applied Corporate Finance 19, 55.
Global Proxy Watch. 2008, The Newsletter of International Corporate Governance and Shareowner Value 12.
Hartzell, J., and Starks, L., 2003, Institutional investors and executive compensation, Journal of Finance 58, 2351-2374.
Holmstrom, B., 1982, Moral hazard in teams, Bell Journal of Economics 13, 324-340.
Huang, J., 2013, Coordination costs, institutional investors, and firm value, Working paper, University of Illinois.

40
Iskandar-Datta, M., and Jia, Y., 2012, Valuation consequences of clawback provisions, The Accounting Review 88, 171-198.
Jensen, M., and Murphy, K., 1990, Performance pay and top-management incentives, Journal of Political Economy 98, 225–264.
La Porta, R., Lopes-de-Silanes, F., and Shleifer, A., 1999, Corporate ownership around the world, Journal of Finance 54, 471–517.
Larcker, D., Ormazabal, G., and Taylor, D., 2011, The market reaction to corporate governance regulation, Journal of Financial Economics 101, 431-448.
Leuz, C., Lins, K., and Warnock, F., 2009, Do foreigners invest less in poorly governed firms, Review of Financial Studies 22, 3245-3285.
McCahery, J., Sautner, Z., and Starks, L., 2014, Behind the scenes: The corporate governance preferences of institutional investors, Working paper, University of Texas.
Milgram, S., 1967, The small world problem, Psychology Today 2, 60-67.
Millstein, I., 2006, A perspective on corporate governance-rules, principles or both, The Accountable Corporation 1, 3-14.
Olson, M., 1965, The logic of collective action: Public goods and the theory of group. Cambridge: Harvard University Press.
Opler, T., and Sokobin, J., 2000, Does coordinated institutional activism work? An analysis of the activities of the Council of Institutional Investors, Working paper, Ohio State University.
Ostrom, E., 2000, Collective action and the evolution of social norms, Journal of Economic Perspectives
14, 137-158. Song, W., and Szewczyk, S., 2003,. Does coordinated institutional investor activism reverse the fortunes
of underperforming firms? Journal of Financial and Quantitative Analysis 38, 317-336. Watts, D., and Strogatz, S, 1998, Collective dynamics of ‘small-world’ networks, Nature, 393, 440-442. Yermack, D., 2010, Shareholder voting and corporate governance, Annual Review of Financial.
Economics 2, 103-125.
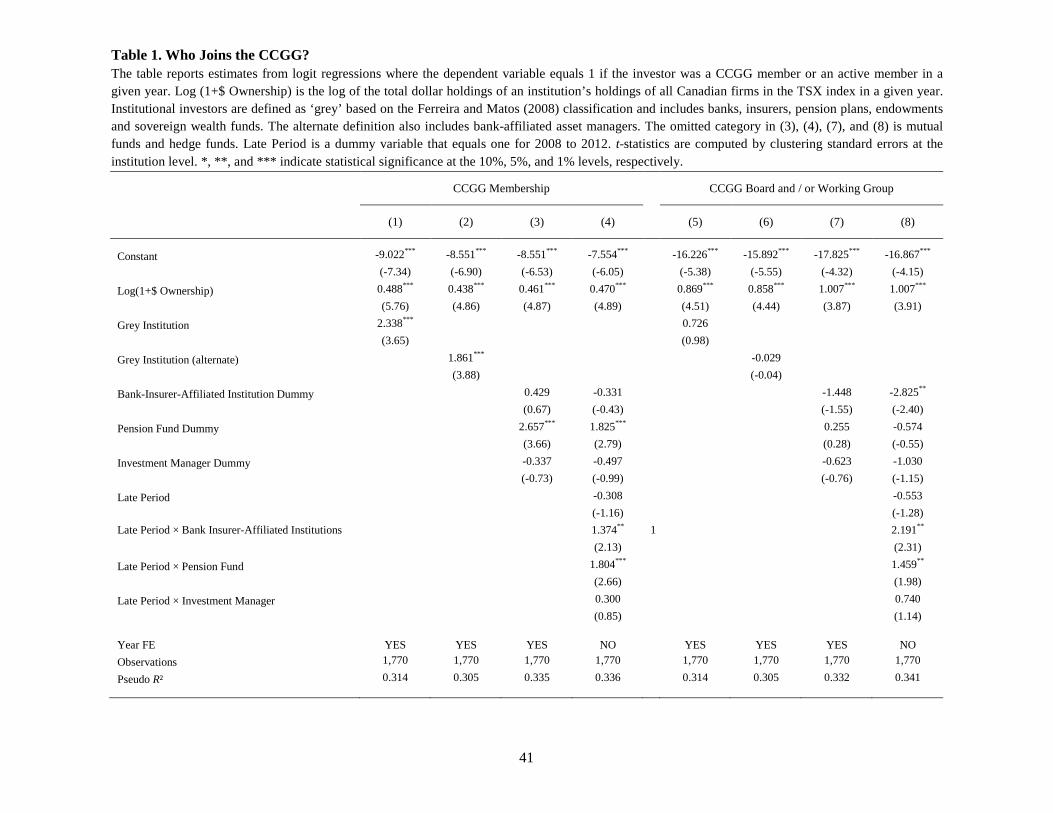
41
Table 1. Who Joins the CCGG? The table reports estimates from logit regressions where the dependent variable equals 1 if the investor was a CCGG member or an active member in a given year. Log (1+$ Ownership) is the log of the total dollar holdings of an institution’s holdings of all Canadian firms in the TSX index in a given year. Institutional investors are defined as ‘grey’ based on the Ferreira and Matos (2008) classification and includes banks, insurers, pension plans, endowments and sovereign wealth funds. The alternate definition also includes bank-affiliated asset managers. The omitted category in (3), (4), (7), and (8) is mutual funds and hedge funds. Late Period is a dummy variable that equals one for 2008 to 2012. t-statistics are computed by clustering standard errors at the institution level. *, **, and *** indicate statistical significance at the 10%, 5%, and 1% levels, respectively.
CCGG Membership CCGG Board and / or Working Group
(1) (2) (3) (4) (5) (6) (7) (8)
Constant -9.022*** -8.551*** -8.551*** -7.554*** -16.226*** -15.892*** -17.825*** -16.867***
(-7.34) (-6.90) (-6.53) (-6.05) (-5.38) (-5.55) (-4.32) (-4.15)
Log(1+$ Ownership) 0.488*** 0.438*** 0.461*** 0.470*** 0.869*** 0.858*** 1.007*** 1.007***
(5.76) (4.86) (4.87) (4.89) (4.51) (4.44) (3.87) (3.91)
Grey Institution 2.338*** 0.726
(3.65) (0.98)
Grey Institution (alternate) 1.861*** -0.029
(3.88) (-0.04)
Bank-Insurer-Affiliated Institution Dummy 0.429 -0.331 -1.448 -2.825**
(0.67) (-0.43) (-1.55) (-2.40)
Pension Fund Dummy 2.657*** 1.825*** 0.255 -0.574
(3.66) (2.79) (0.28) (-0.55)
Investment Manager Dummy -0.337 -0.497 -0.623 -1.030
(-0.73) (-0.99) (-0.76) (-1.15)
Late Period -0.308 -0.553
(-1.16) (-1.28) Late Period × Bank Insurer-Affiliated Institutions 1.374** 1
2.191**
(2.13) (2.31)
Late Period × Pension Fund 1.804*** 1.459**
(2.66) (1.98)
Late Period × Investment Manager 0.300 0.740
(0.85) (1.14) Year FE YES YES YES NO YES YES YES NO Observations 1,770 1,770 1,770 1,770 1,770 1,770 1,770 1,770
Pseudo R² 0.314 0.305 0.335 0.336 0.314 0.305 0.332 0.341

42
Table 2. CCGG Engagement Meetings and Adoptions. Panel A shows the number of CCGG engagements with firms included in the S&P/TSX Composite Index in 2005, and from 2008 to 2012. The sample includes firms with complete data on firm characteristics, measured at the end of each year. The columns show the number of engagements in which the CCGG requested firms to adopt a majority voting policy, say-on-pay, or compensation policies (clawbacks, capped pensions, and performance peer groups). Panel B summarizes who attended the engagement meetings. Panel C summarizes adoptions during 2009 to 2013. The adoptions sample is smaller than the engagements sample because not all firms survive over the subsequent two years. It compares adoptions by firms engaged by the CCGG with this not engaged. For majority voting, the counts correspond to the number of firms. For say-on-pay and compensation policies, the yes counts correspond to the number of firms and the no counts correspond to firm-years. Variables are defined in Table A.I.
Panel A. CCGG Engagements
2005
2008 to 2012
Year N Majority Voting
Total Engagements Say-on-pay Compensation
Policies Capped Pension Performance Peer Groups Clawbacks
2005 212 88
2008 186
5 5 5 5 3 5
2009 169 26 15 15 14 4 7
2010 190 25 9 8 6 2 3
2011 237 49 18 20 7 7 11
2012 223 38 10 22 4 12 12
Total 88 143 57 70 36 28 38
Panel B. Participants in CCGG Engagement Meetings: 2008 to 2012
Yes No Yes %
Unimpeded board 105 35 75%
Unimpeded board with long-term investor at meeting 57 83 41%
CCGG represented by pension plan 77 63 55%
Chair or lead director present 115 25 82%
Two or more directors present at meeting 130 10 93%
Panel C. Adoptions: 2009 to 2013
Majority Voting Say-on-pay Compensation Policies
Yes No Total % Adopted Yes No Total %
Adopted Yes No Total % Adopted
Engaged Firms 40 45 85 47% 28 21 49 57% 40 26 66 61%
Non-Engaged Firms 17 94 111 15% 64 638 702 9% 124 730 854 15% Total (Difference) 57 139 196 (32%) 92 659 751 (48%) 164 756 920 (46%)
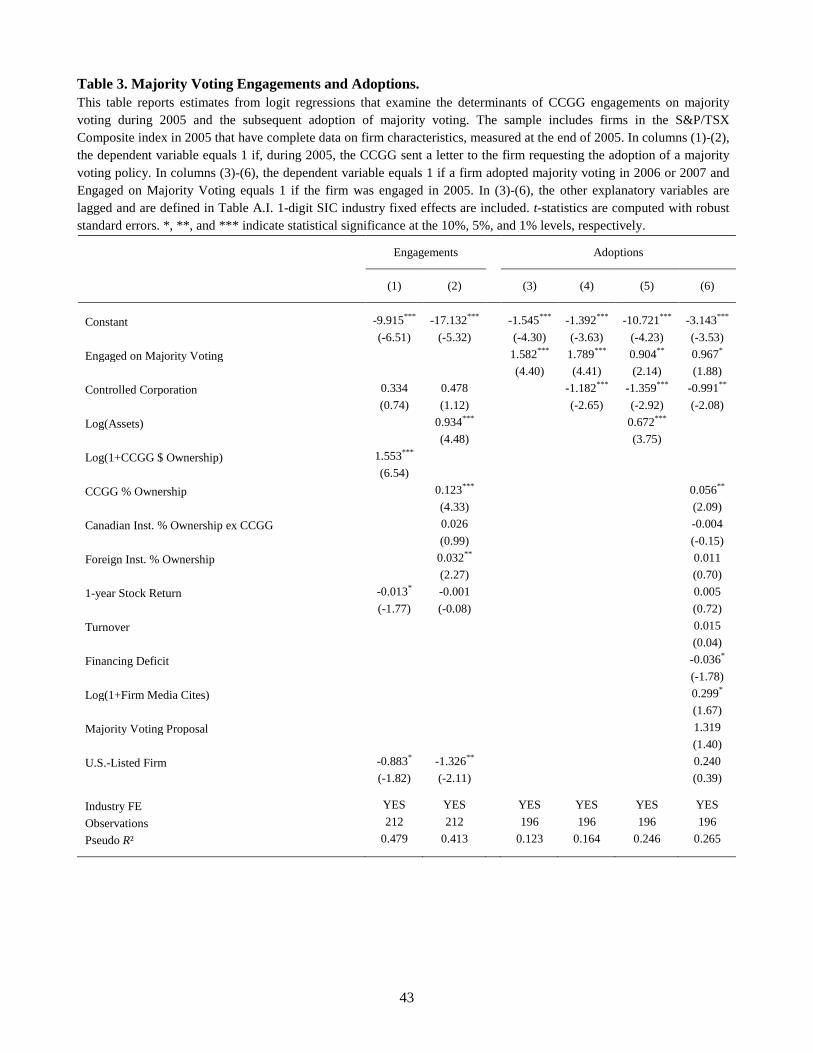
43
Table 3. Majority Voting Engagements and Adoptions. This table reports estimates from logit regressions that examine the determinants of CCGG engagements on majority voting during 2005 and the subsequent adoption of majority voting. The sample includes firms in the S&P/TSX Composite index in 2005 that have complete data on firm characteristics, measured at the end of 2005. In columns (1)-(2), the dependent variable equals 1 if, during 2005, the CCGG sent a letter to the firm requesting the adoption of a majority voting policy. In columns (3)-(6), the dependent variable equals 1 if a firm adopted majority voting in 2006 or 2007 and Engaged on Majority Voting equals 1 if the firm was engaged in 2005. In (3)-(6), the other explanatory variables are lagged and are defined in Table A.I. 1-digit SIC industry fixed effects are included. t-statistics are computed with robust standard errors. *, **, and *** indicate statistical significance at the 10%, 5%, and 1% levels, respectively.
Engagements Adoptions
(1) (2) (3) (4) (5) (6)
Constant -9.915*** -17.132*** -1.545*** -1.392*** -10.721*** -3.143***
(-6.51) (-5.32) (-4.30) (-3.63) (-4.23) (-3.53)
Engaged on Majority Voting 1.582*** 1.789*** 0.904** 0.967*
(4.40) (4.41) (2.14) (1.88)
Controlled Corporation 0.334 0.478 -1.182*** -1.359*** -0.991**
(0.74) (1.12) (-2.65) (-2.92) (-2.08)
Log(Assets) 0.934*** 0.672***
(4.48) (3.75)
Log(1+CCGG $ Ownership) 1.553***
(6.54)
CCGG % Ownership 0.123*** 0.056**
(4.33) (2.09)
Canadian Inst. % Ownership ex CCGG 0.026 -0.004
(0.99) (-0.15)
Foreign Inst. % Ownership 0.032** 0.011
(2.27) (0.70)
1-year Stock Return -0.013* -0.001 0.005
(-1.77) (-0.08) (0.72)
Turnover 0.015
(0.04)
Financing Deficit -0.036*
(-1.78)
Log(1+Firm Media Cites) 0.299*
(1.67)
Majority Voting Proposal 1.319
(1.40)
U.S.-Listed Firm -0.883* -1.326** 0.240
(-1.82) (-2.11) (0.39)
Industry FE YES YES YES YES YES YES Observations 212 212 196 196 196 196 Pseudo R² 0.479 0.413 0.123 0.164 0.246 0.265
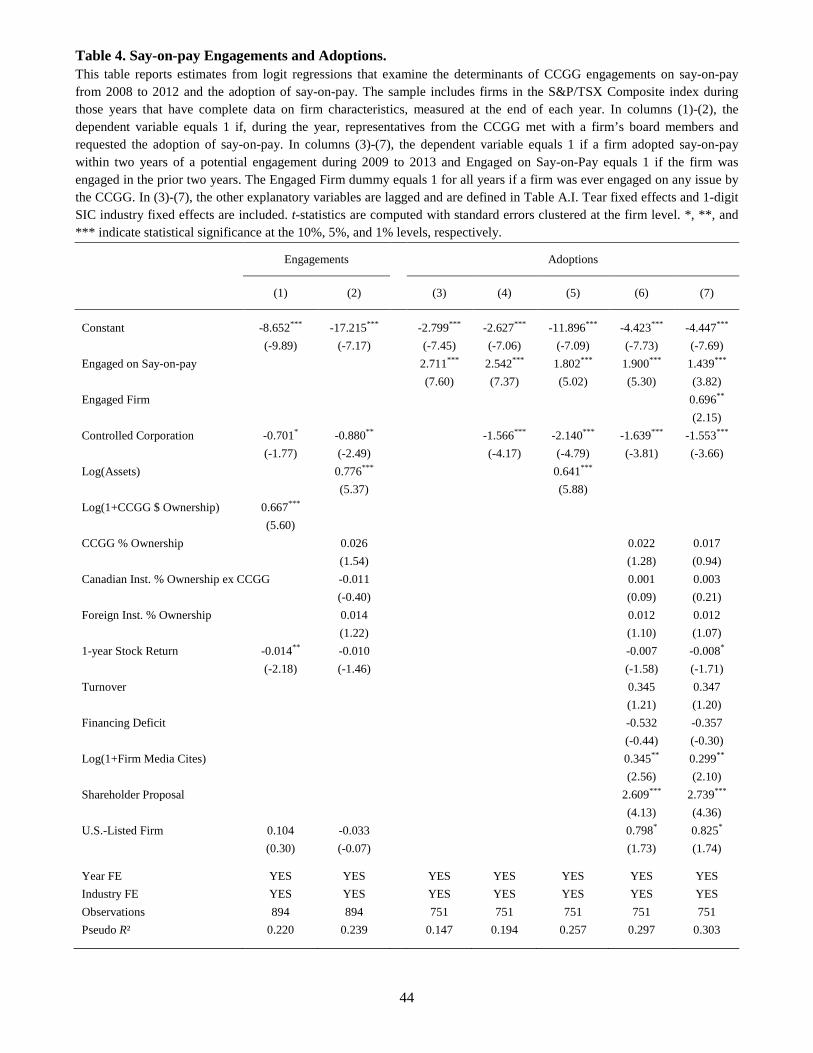
44
Table 4. Say-on-pay Engagements and Adoptions. This table reports estimates from logit regressions that examine the determinants of CCGG engagements on say-on-pay from 2008 to 2012 and the adoption of say-on-pay. The sample includes firms in the S&P/TSX Composite index during those years that have complete data on firm characteristics, measured at the end of each year. In columns (1)-(2), the dependent variable equals 1 if, during the year, representatives from the CCGG met with a firm’s board members and requested the adoption of say-on-pay. In columns (3)-(7), the dependent variable equals 1 if a firm adopted say-on-pay within two years of a potential engagement during 2009 to 2013 and Engaged on Say-on-Pay equals 1 if the firm was engaged in the prior two years. The Engaged Firm dummy equals 1 for all years if a firm was ever engaged on any issue by the CCGG. In (3)-(7), the other explanatory variables are lagged and are defined in Table A.I. Tear fixed effects and 1-digit SIC industry fixed effects are included. t-statistics are computed with standard errors clustered at the firm level. *, **, and *** indicate statistical significance at the 10%, 5%, and 1% levels, respectively.
Engagements Adoptions
(1) (2) (3) (4) (5) (6) (7)
Constant -8.652*** -17.215*** -2.799*** -2.627*** -11.896*** -4.423*** -4.447***
(-9.89) (-7.17) (-7.45) (-7.06) (-7.09) (-7.73) (-7.69) Engaged on Say-on-pay 2.711*** 2.542*** 1.802*** 1.900*** 1.439***
(7.60) (7.37) (5.02) (5.30) (3.82) Engaged Firm 0.696**
(2.15) Controlled Corporation -0.701* -0.880** -1.566*** -2.140*** -1.639*** -1.553***
(-1.77) (-2.49) (-4.17) (-4.79) (-3.81) (-3.66) Log(Assets) 0.776*** 0.641*** (5.37) (5.88) Log(1+CCGG $ Ownership) 0.667*** (5.60) CCGG % Ownership 0.026 0.022 0.017
(1.54) (1.28) (0.94) Canadian Inst. % Ownership ex CCGG -0.011 0.001 0.003
(-0.40) (0.09) (0.21) Foreign Inst. % Ownership 0.014 0.012 0.012
(1.22) (1.10) (1.07) 1-year Stock Return -0.014** -0.010 -0.007 -0.008*
(-2.18) (-1.46) (-1.58) (-1.71) Turnover 0.345 0.347
(1.21) (1.20) Financing Deficit -0.532 -0.357
(-0.44) (-0.30) Log(1+Firm Media Cites) 0.345** 0.299**
(2.56) (2.10) Shareholder Proposal 2.609*** 2.739***
(4.13) (4.36) U.S.-Listed Firm 0.104 -0.033 0.798* 0.825*
(0.30) (-0.07) (1.73) (1.74)
Year FE YES YES YES YES YES YES YES Industry FE YES YES YES YES YES YES YES Observations 894 894 751 751 751 751 751 Pseudo R² 0.220 0.239 0.147 0.194 0.257 0.297 0.303

45
Table 5. Compensation Policy Engagements and Adoptions. This table reports estimates from logit regressions that examine the determinants of CCGG engagements on Compensation Policies (one or more of clawbacks, capped pensions, or performance peer groups) from 2008 to 2012. The sample includes firms in the S&P/TSX Composite index during those years that have complete data on firm characteristics, measured at the end of each year. In columns (1)-(2), the dependent variable equals 1 if, during the year, representatives from the CCGG met with a firm’s board members and requested the adoption of a compensation policy. In columns (3)-(7), the dependent variable equals 1 if a firm adopted a compensation policy during 2009 to 2013 within two years of a potential engagement on that particular policy and Engaged on Compensation Policies equals 1 if the firm was engaged on a particular policy in the prior two years. The Engaged Firm dummy equals 1 for all years if a firm was ever engaged on any issue by the CCGG. In (3)-(7), the other explanatory variables are lagged and are defined in Table A.I. Year fixed effects and 1-digit SIC industry fixed effects are included. t-statistics are computed with standard errors clustered at the firm level. *, **, and *** indicate statistical significance at the 10%, 5%, and 1% levels, respectively.
Engagements Adoptions
(1) (2) (3) (4) (5) (4) (7)
Constant -8.484*** -17.040*** -1.913*** -1.825*** -6.074*** -1.985*** -1.998***
(-9.88) (-7.53) (-7.93) (-7.70) (-5.68) (-5.38) (-5.44) Engaged on Compensation Policies 2.147*** 2.069*** 1.658*** 1.763*** 1.865***
(6.95) (7.02) (5.62) (5.85) (6.08) Engaged Firm -0.197
(-0.91) Controlled Corporation -0.722* -0.803** -0.744*** -0.804*** -0.769*** -0.797***
(-1.86) (-2.00) (-3.16) (-3.37) (-3.20) (-3.23) Log(Assets) 0.784*** 0.292*** (5.78) (4.08) Log(1+CCGG $ Ownership) 0.739*** (5.35) CCGG % Ownership 0.024 0.011 0.012
(1.20) (0.89) (0.98) Canadian Inst. % Ownership ex CCGG 0.004 -0.011 -0.012
(0.22) (-0.89) (-0.91) Foreign Inst. % Ownership 0.025** -0.015** -0.015**
(2.30) (-2.06) (-2.05) 1-year Stock Return -0.017*** -0.011** -0.006* -0.006*
(-3.04) (-2.05) (-1.88) (-1.87) Turnover 0.029 0.029
(0.14) (0.14) Financing Deficit -0.053 -0.089
(-0.05) (-0.09) Log(1+Firm Media Cites) 0.221** 0.244***
(2.55) (2.63) Shareholder proposal 0.631 0.626
(0.60) (0.62) U.S.-Listed Firm -0.390 -0.653 0.313 0.308
(-1.00) (-1.40) (1.08) (1.07) Year FE YES YES YES YES YES YES YES Industry FE YES YES YES YES YES YES YES Observations 989 989 920 920 920 920 920 Pseudo R² 0.229 0.241 0.095 0.109 0.128 0.135 0.136

46
Table 6. Changes in CEO Incentives After CCGG Engagements. This table reports estimates from OLS regressions that examine changes in CEO equity pay ratio (EPR) and pay-for-performance sensitivity (PPS) following CCGG engagements. The sample period is from 2008 to 2013 and includes firms that were included in the S&P/TSX index during any of those years and have complete data on lagged firm characteristics. In models (1) to (4), the dependent variable is the CEO’s EPR and in (5) to (8) it is Log(1+PPS). Engaged on Compensation equals 1 in year t and in all subsequent years if a firm was engaged on a compensation issue in year t. The Engaged Firm dummy equals 1 for all years if a firm was ever engaged on any issue by the CCGG. The other explanatory variables are lagged and are defined in Table A.I. Year fixed effects and 1-digit SIC industry fixed effects are included. t-statistics are computed with standard errors clustered at the firm level. *, **, and *** indicate statistical significance at the 10%, 5%, and 1% levels, respectively.
Equity Pay Ratio Pay-for-performance Sensitivity
(1) (2) (3) (4) (5) (6) (7) (8)
Constant 45.407*** -13.425 -35.951** -35.256**
4.211*** -2.364*** -4.793*** -4.819***
(20.03) (-1.34) (-2.45) (-2.32)
(24.99) (-3.17) (-4.29) (-4.23)
Engaged on Compensation 18.696*** 9.047*** 7.351*** 6.964***
1.366*** 0.441*** 0.324* 0.338*
(7.58) (3.56) (2.91) (2.73)
(7.22) (2.63) (1.90) (1.90)
Engaged Firm
0.632
-0.024
(0.21)
(-0.10)
CEO Turnover -2.638 -3.024 -3.181 -3.185
-0.457*** -0.460*** -0.485*** -0.485***
(-1.11) (-1.25) (-1.33) (-1.33)
(-2.71) (-3.17) (-3.63) (-3.62)
TSX Index Member
5.032** 2.561 2.566
0.975*** 0.622*** 0.622***
(2.12) (0.93) (0.94)
(4.80) (2.99) (2.99)
Controlled Corporation
-7.055*** -5.631** -5.584**
-0.086 0.001 -0.001
(-2.85) (-2.30) (-2.27)
(-0.38) (0.00) (-0.00)
Log(Assets)
3.991*** 4.880*** 4.824***
0.413*** 0.492*** 0.494***
(5.42) (5.30) (4.94)
(7.41) (6.38) (6.20)
1-year Stock Return
0.042** 0.042**
0.001 0.001
(2.24) (2.24)
(1.18) (1.20)
Institutional Ownership %
0.056 0.055
0.010* 0.010*
(0.93) (0.91)
(1.83) (1.85)
Volatility
0.267 0.269
0.032 0.032
(0.49) (0.50)
(0.88) (0.87)
Tobin's Q
2.788** 2.772**
0.316*** 0.316***
(2.47) (2.44)
(3.88) (3.85)
Leverage
-0.027 -0.026
0.008 0.008
(-0.39) (-0.38)
(1.32) (1.32)
Cash/Assets
0.000 0.000
0.005 0.005
(0.00) (0.00)
(0.86) (0.86)
Dividend Paid
-2.573 -2.643
0.157 0.160
(-0.92) (-0.94)
(0.66) (0.67)
U.S.-Listed Firm
2.553 2.559
-0.177 -0.177
(0.89) (0.89)
(-0.77) (-0.78)
Year FE YES YES YES YES
YES YES YES YES
Industry FE YES YES YES YES
YES YES YES YES
Observations 1,303 1,303 1,303 1,303
1,303 1,303 1,303 1,303
Adjusted R² 0.079 0.144 0.165 0.165
0.104 0.268 0.303 0.303

47
Table 7. Board Interlocks and Director Influence. Panel A reports summary statistics on the adoption of majority voting by firms included in the S&P/TSX Composite index in 2005 that were not engaged by the CCGG. The sample includes firms that are yet to adopt majority voting and have complete data on firm characteristics, measured at the end of each year. The panel compares firms that have director interlocks with engaged firms to firms that do not have such director interlocks. Panel B presents summary statistics on the number of other directorships held by a director and size of the other firms, measured by the log of market capitalization. The panel also reports the eigenvector network centrality measure for directors. Big banks include the seven major financial institutions that were initially engaged by the CCGG on majority voting. Test statistics for the differences in means (medians) are t-statistics (Wilcoxon signed-rank z-statistics). *, **, and *** indicate statistical significance at the 10%, 5%, and 1% levels, respectively. All variables are defined in Table A.I.
Panel A. Board Interlocks and Majority Voting Adoptions By Non-Engaged Firms
N Adopted % Adopted
All non-engaged firms 111 17 15%
Non engaged firms without interlocks with engaged firms 36 3 8%
Non engaged firms with interlocks with engaged firms 75 14 19%
Non-engaged firms with interlocks with engaged big banks 27 10 37%
Non-engaged firms with interlocks with engaged non-big banks 71 13 18%
Panel B. Big Bank vs. Non-Big Bank Directors
Number of
directorships Log(Market capitalization) Eigenvector network
centrality of directorships
Mean Median Mean Median Mean Median
Big bank directors 1.3 1 37.2 31.0 0.040 0.036
Non-big bank directors 0.3 0 32.8 29.4 0.011 0.007
Difference 1.0*** 1.0*** 4.4*** 1.6*** 0.029*** 0.029***
Test statistic for difference 3.73 3.60 7.68 6.48 16.056 16.104

48
Table 8. Board Interlocks and Adoptions By Non-engaged Firms. This table reports estimates from logit regressions that examine majority voting and say-on-pay adoptions by firms not engaged by the CCGG. For majority voting, the sample includes firms included in the S&P/TSX Composite index in 2005 and have complete data on firm characteristics, measured at the end of the year. For say-on-pay, the sample includes that are in the S&P/TSX Composite index between 2009 and 2013. Firms that adopt say-on-pay are excluded in subsequent years. The dependent variable equals 1 if a firm adopted majority voting (say-on-pay) in 2006 or 2007 (2009 to 2013). The explanatory variables are lagged. All variables are defined in Table A.I. For say-on-pay, year fixed effects and 1-digit SIC industry fixed effects are included. t-statistics are computed with robust standard errors for majority voting and with standard errors clustered at the firm-level for say-on-pay. *, **, and *** indicate statistical significance at the 10%, 5%, and 1% levels, respectively.
Majority Voting Adoptions Say-on-pay Adoptions
(1) (2) (3) (4) (5) (6) (7) (8)
Constant -2.398*** -3.187** -2.475*** -2.984* -2.639* -2.755*** -4.747*** -4.613***
(-3.96) (-1.97) (-4.32) (-1.80) (-1.73) (-7.22) (-7.41) (-7.15)
Interlock 0.926 1.097 0.519* 0.535*
(1.37) (1.60) (1.78) (1.68) Big Bank Interlock 1.635*** 1.943**
(2.83) (2.16) Non Big Bank Interlock 0.434 0.801
(0.67) (1.10) Interlock Eigenvalue 5.330** 6.136*
(1.96) (1.75)
Controlled Corporation -0.625 -0.744 -0.453 -1.834*** -1.797***
(-1.06) (-1.13) (-0.74) (-3.64) (-3.62)
CCGG % Ownership 0.078 0.094* 0.077 0.023 0.020
(1.57) (1.86) (1.34) (1.15) (0.96)
Canadian Inst. % Ownership ex CCGG -0.031 -0.039 -0.018 0.005 0.004
(-0.65) (-0.76) (-0.31) (0.27) (0.27)
Foreign Inst. % Ownership 0.018 0.006 0.019 0.026** 0.027**
(0.99) (0.31) (1.02) (2.30) (2.35)
1-year Stock Return 0.024** 0.024** 0.020** -0.007 -0.007
(2.31) (2.14) (1.98) (-1.54) (-1.45)
Turnover -0.286 0.032 0.077 0.345 0.372
(-0.46) (0.05) (0.11) (1.19) (1.29)
Financing Deficit -0.048 -0.040 -0.053* -1.091 -1.036
(-1.48) (-1.24) (-1.73) (-0.83) (-0.76)
Shareholder Proposal 1.898** 1.948***
(2.50) (2.64)
Log(1+Firm Media Cites) -0.197 -0.439 -0.402 0.433*** 0.397**
(-0.53) (-1.15) (-1.02) (2.60) (2.26)
U.S.-Listed Firm 0.813 1.093 0.628 0.191 0.168
(1.06) (1.24) (0.78) (0.40) (0.36) Year FE NO NO NO NO NO YES YES YES
Industry FE NO NO NO NO NO YES YES YES
Observations 111 111 111 111 111 615 615 615
Pseudo R² 0.023 0.199 0.096 0.271 0.213 0.054 0.217 0.220
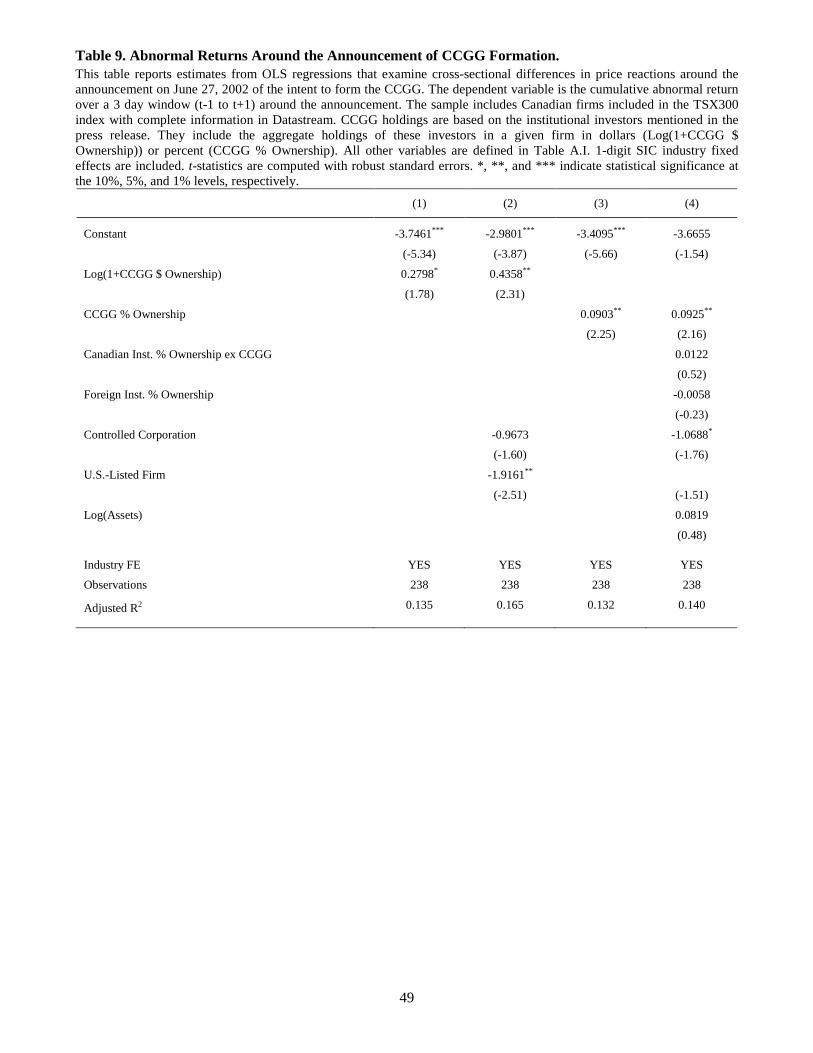
49
Table 9. Abnormal Returns Around the Announcement of CCGG Formation. This table reports estimates from OLS regressions that examine cross-sectional differences in price reactions around the announcement on June 27, 2002 of the intent to form the CCGG. The dependent variable is the cumulative abnormal return over a 3 day window (t-1 to t+1) around the announcement. The sample includes Canadian firms included in the TSX300 index with complete information in Datastream. CCGG holdings are based on the institutional investors mentioned in the press release. They include the aggregate holdings of these investors in a given firm in dollars (Log(1+CCGG $ Ownership)) or percent (CCGG % Ownership). All other variables are defined in Table A.I. 1-digit SIC industry fixed effects are included. t-statistics are computed with robust standard errors. *, **, and *** indicate statistical significance at the 10%, 5%, and 1% levels, respectively.
(1) (2) (3) (4)
Constant -3.7461*** -2.9801*** -3.4095*** -3.6655
(-5.34) (-3.87) (-5.66) (-1.54)
Log(1+CCGG $ Ownership) 0.2798* 0.4358**
(1.78) (2.31)
CCGG % Ownership 0.0903** 0.0925**
(2.25) (2.16)
Canadian Inst. % Ownership ex CCGG 0.0122
(0.52)
Foreign Inst. % Ownership -0.0058
(-0.23)
Controlled Corporation -0.9673 -1.0688*
(-1.60) (-1.76)
U.S.-Listed Firm -1.9161**
(-2.51) (-1.51)
Log(Assets) 0.0819
(0.48)
Industry FE YES YES YES YES
Observations 238 238 238 238
Adjusted R2 0.135 0.165 0.132 0.140

50
Figure 1. Institutional Ownership of Canadian, U.S., and U.K. Index Firms in 2005 and 2012 This figure presents data on institutional ownership of firms included in the major indices in Canada (S&P/TSX), the U.S. (S&P 500), and the U.K. (FTSE 350). Institutional owners classified as ‘grey’ include banks, insurance companies, pension plans, endowments, and sovereign wealth funds. See Ferreira and Matos (2008). Variables are defined in Table A.1.
0
100
200
300
400
500
U.S. (S&P500) Canada(S&P/TSX)
U.K. (FTSE350)
1B. Institutional Investor Ownership Concentration (HHI)
2005 2012
0%
20%
40%
60%
80%
100%
U.S. (S&P500) Canada(S&P/TSX)
U.K. (FTSE350)
1D. % of Domestic Institutional Investor Ownership
2005 2012
0%
20%
40%
60%
80%
100%
U.S. (S&P500) Canada(S&P/TSX)
U.K. (FTSE350)
1A. Aggregate Institutional Investor % Ownership
2005 2012
0%
20%
40%
60%
80%
100%
U.S. (S&P500) Canada(S&P/TSX)
U.K. (FTSE350)
1C. % of 'Grey' Institutional Investor Ownership
2005 2012

51
Figure 2. CCGG Members’ Ownership of Canadian Firms. The solid lines in Figure 2A show the average, aggregate percentage holdings CCGG members in S&P/TSX index firms over time and by type of member. The dashed line shows the value-weighted aggregate percentage holdings. Figure 2B shows the distribution of CCGG ownership stakes in S&P/TSX index firms in 2005 and 2012. CCGG % Ownership is defined in Table A.I
0%
5%
10%
15%
20%
25%
30%
2005
2006
2007
2008
2009
2010
2011
2012
2A. CCGG % Holdings Over Time and By Type
Investment Companies Investment Advisors
Pension Plans Value weighted % held
0%
5%
10%
15%
20%
25%
30%
<4% 4-8% 8-12% 12-16% 16-20% >20%
2B. Distribution of Aggregate CCGG % Holdings Across Firms
2005 2012

52
Figure 3. Changes in Governance Scores Over Time. This figure shows the changes in the governance games scores from 2002 to 2012. The governance scores are described under “Good Governance Dummy” in Table A.I. Scoring criteria are added and dropped from the scores each year. 18 criteria are part of the scores since their inception.
60%
65%
70%
75%
80%
85%
90%
2002
2003
2004
2005
2006
2007
2008
2009
2010
2011
2012
Governance Scores: Adjusted and Unadjusted
Mean (Adjusted Score), 18 Qns. Mean (Raw Score), 18 Qns. Mean (Score), all questions

53
APPENDIX Table A.I – Variable Definitions This table contains the definitions and descriptions of the variables used in the paper. Variable Description
1-year Stock Return Buy-and-hold stock return in the 1-year period ending June 30 of the current year. (Source: Datastream).
Adopted Compensation Policies Equals 1 if within the subsequent two years of a potential engagement, the firm adopted at least one of the following "compensation policies" during 2009 to 2013; a clawback policy, a provision that allows a firm to recoup performance-based executive compensation in cases where financial information upon which the performance payments are made need to be restated; a capped pension, a policy that limits the pension/retirement benefits awarded to a firm's CEO; performance peer groups, the practice of evaluating firm performance relative to a disclosed group of peer firms when determining performance-based executive compensation. For firms that adopted all three policies, this variable is set to missing in subsequent years. (Source: Firms’ proxy circulars).
Adopted Majority Voting Equals 1 if within two years of the majority voting campaign in 2005, the firm adopted a majority voting policy. Firms should lists individual directors on the Registered Form of Proxy or the Voting Instruction form, adopt an internal policy which states that for any director receiving 50% + 1 withheld votes, those votes would be considered votes “against” the director, and such directors immediately resign, which the board is expected to accept absent extraordinary circumstances. (Source: Firms’ proxy circulars).
Adopted Say-on-pay Equals 1 if, within the subsequent two years of a potential engagement, the firm adopted a policy to hold a non-binding shareholder advisory vote on the firm's approach a executive compensation (say-on-pay) during 2009 to 2013. Equals 0 if the firm did not adopt such a policy. For firms that adopted such a policy, this variable is set to missing in subsequent years. (Source: Firms’ proxy circulars).
Canadian Inst. Ownership % ex CCGG
The percentage of a firm's outstanding shares owned in aggregate by institutions domiciled in Canada excluding CCGG members in a given year. (Source: FactSet, Capital IQ).
Cash/Assets The ratio of the cash held by the firm to Total Assets. (Source: Worldscope).
CCGG % Ownership The percentage of a firm's outstanding shares owned in aggregate by CCGG member institutions in a given year. (Source: FactSet, Capital IQ).
CEO Turnover Equals 1 if the CEO is changed during the year. Equals 0 otherwise. (Source: Firms' proxy circulars and annual reports).
Controlled Corporation Equals 1 if a firm has multiple classes of shares or if the fraction of the closely held shares exceeds 20%. Closely held shares include shares held by officers, directors, and their immediate families, shares held in trust, shares of the company held by any other corporation (except shares held in a fiduciary capacity by banks or other financial institutions), shares held by pension/benefit plans and shares held by individuals with ownership exceeding 5%. Equals 0 otherwise. (Source: Worldscope; CCGG records).
Cumulative abnormal returns The cumulative abnormal returns, in percent, are estimated for the 3-day window around the announcement on June 27, 2002 of the intent to form the CCGG. Each firm’s abnormal return is defined relative to returns on the Canadian market (Canada-DS market). A beta for each firm is estimated from 60 days prior to x days before the event date. (Source: Datastream)
Dividend Paid Equals 1 if the firm paid a dividend during the year. Equals 0 otherwise. (Source: Worldscope).
Engaged on Compensation Equals 1 in year t and in all subsequent years if a firm was engaged on a compensation issue in year t. Equals 0 otherwise. (Source: Private CCGG records).
Engaged on Compensation Policies
Equals 1 if, the CCGG engaged a firm’s board between 2008 and 2012 and requested that the firm adopt one more of capped pensions, clawbacks, or performance peer groups. (Compensation Policies). Equals 0 otherwise. (Source: Private CCGG records).
Engaged on Majority Voting Equals 1 if, during 2005, the CCGG sent a letter to a firm’s board requesting that the firm adopt a majority voting policy. Equals 0 otherwise. (Source: Private CCGG records).
Engaged on Say-on-pay Equals 1 if, the CCGG engaged a firm’s board between 2008 and 2012 and requested that the firm adopt say-on-pay. Equals 0 otherwise. (Source: Private CCGG records).
Engaged Firm Equals 1 for all years for firms that were engaged on any issue in any year between 2008 and 2012. Equals 0 otherwise. (Source: Private CCGG records).
Equity Pay Ratio The fraction of the total compensation awarded to the firm's CEO during the year consisting of either shares or options. (Source: Firms' proxy circulars and annual reports; Clarkson Centre for Business Ethics and Board Effectiveness).
Foreign Inst. % Ownership The percentage of a firm's outstanding shares owned in aggregate by institutions domiciled outside Canada in a given year. (Source: FactSet, Capital IQ).

54
Table A.I, continued. Variable Description
Financing Deficit Financing deficit defined as the sum of dividends, investment and change in net-working capital less cash flow, all
deflated by total assets. See Frank and Goyal (2003). (Source: Worldscope).
Grey institution Equals 1 for institutional investors defined as ‘grey’ based on the Ferreira and Matos (2008) classification scheme. It includes banks, insurers, pension plans, endowments and sovereign wealth funds. The alternate definition also includes bank-affiliated asset managers.
Institutional Ownership % The percentage of a firm's outstanding shares held in aggregate by institutional investors in a given year. (Source: FactSet and Capital IQ).
Institutional Investor HHI The sum of the squared percentage ownership stakes held by the institutional shareholders in a given year. (Source: FactSet and Capital IQ).
Interlock For firms not engaged by the CCGG, it equals 1 if the firm has a director who also sits on the board of a firm that was engaged by the CCGG to adopt majority voting (say-on-pay) during the prior two years. Equals 0 otherwise. (Source: Clarkson Centre for Business Ethics and Board Effectiveness).
Interlock – Big Bank For firms included in the majority voting sample that were not engaged by the CCGG, this dummy equals 1 if the firm shares a director with one of the seven major financial institutions that were initially engaged by the CCGG on majority voting (Bank of Montreal, Bank of Nova Scotia, Canadian Imperial Bank of Commerce, Toronto-Dominion Bank, Manulife Financial, Sunlife Financial). Equals 0 otherwise. (Source: Clarkson Centre for Business Ethics and Board Effectiveness).
Interlock Eigenvalue Equals the combined (summed) eigenvector centrality of directors who sat on a board which was engaged by CCGG to adopt a majority voting policy (say-on-pay) in the prior year. Eigenvector centrality of director i is his power in the network, weighed by the similarly calculated power of all his direct contacts, each weighted by the power of their direct connections, and so on. The recursions in the calculation process result in estimation of an eigenvector of connections matrix. The eigenvector centrality values of the directors in the network are taken as the elements of the eigenvector associated with the connections matrix’s principal eigenvalue. The centrality measure is calculated using directors sitting on the same board in the same year as a connection within the directors’ network. Equals 0 otherwise. (Source: Clarkson Centre for Business Ethics and Board Effectiveness).
Interlock – Non Big Bank For firms included in the majority voting sample that were not engaged by the CCGG, this dummy equals 1 if the firm shares a director with a firm engaged by the CCGG on majority voting excluding the seven major financial institutions. Equals 0 otherwise. (Source: Clarkson Centre for Business Ethics and Board Effectiveness).
Leverage The ratio of Total Debt to Total Assets. (Source: Worldscope).
Log(Assets) Natural logarithm of Total Assets. (Source: Worldscope).
Log (1+$ Ownership) Natural logarithm of 1 + the total dollar holdings of an institution’s holdings of all Canadian firms in the TSX index in a given year .
Log(1+CCGG $ Ownership) Natural logarithm of 1 + the dollar value of CCGG's members' shareholdings in the firm (see CCGG % Ownership).
Log(1+Firm Media Cites) Natural logarithm of 1 + the number of news articles appearing in The Globe and Mail or Financial Post during a given year that mention the firm. (Source: LexisNexis).
Pay-for-performance Sensitivity The change in the value of a CEO’s stock and option portfolio per 1% increase in stock price (thousands of dollars). Pay-Performance Sensitivity from outstanding option grants is calculated based on the methodology in Core and Guay (1999) and Core and Guay (2002). RSUs and PSUs are treated similarly as they are assumed to be held for three years. (Source: Firms' proxy circulars and annual reports; Datastream; Clarkson Centre for Business Ethics and Board Effectiveness).
Shareholder Proposal Equals 1 if a shareholder proposal requesting adoption of Majority Voting/Say-on-pay/Compensation Policies was filed with the firm during the year. Equals 0 otherwise. (Source: SHARE.ca).
Tobin's Q The ratio of the sum of a firm's market value of equity and book value of debt to Total Assets. (Source: Worldscope).
TSX Index Member Equals 1 if the firm was a member was included in the S&P/TSX Composite Index as of June 30 that year. Equals 0 otherwise. (Source: Datastream).
Turnover Number of shares traded during the year divided by the number of shares outstanding. (Source: Datastream).
U.S.-Listed Firm Equals 1 if the firm was cross-listed on an exchange in the United States (AMEX, NYSE or NASDAQ) in a given year. Equals 0 otherwise. (Sources: Bank of New York, Citibank, JP Morgan, the NYSE, NASDAQ, CRSP and SEC).
Volatility The volatility of the firm's stock returns during the 104-week period ending in June 30 of the current year. (Source: Datastream).