can europe respond to its challenges? josé viñals director general banco de españa iese, madrid,...
TRANSCRIPT

CAN EUROPE RESPOND TO ITS CHALLENGES?
José ViñalsDirector GeneralBanco de España
IESE, Madrid, July 8th 2004

2IESE, July 8th 2004
Contents
European integration and the process of globalisation
EU´s Economic Performance: The European Model
Challenges
What should economic policy do?
Conclusions

3IESE, July 8th 2004
European integration and the process of globalisation
Europe is favourably contributing to globalisation
(One Market, One Money)
Considerable institutional success
-Central-Eastern European enlargement May 2004-European Constitution
-Enlargements 1986 (Sp, Post) and 1995 (Sw, Aus, Fin)-Single Internal Market 1993-Monetary Union 1999
Present:
Past:

4IESE, July 8th 2004
How is the EU economy performing?
Long-term evolution is most useful also to
understand present European problems and
future prospects
The European economic and social model

5IESE, July 8th 2004
The European economic and social model
Economic and socialcohesion
Macroeconomicstability
Growth

6IESE, July 8th 2004
1
1.5
2
2.5
3
3.5
4
4.5
5
1961-1970 1971-1980 1981-1990 1991-2000
%
Economic growth EU 15 (1960-2000)

7IESE, July 8th 2004
Growth malaise most worrying
In spite of institutional progress
Frustrating relative to the past
Frustrating relative to expectations
Frustrating relative to the US

8IESE, July 8th 2004
1
1.5
2
2.5
3
3.5
4
4.5
5
1961-1970 1971-1980 1981-1990 1991-2000
%
US
EU
Economic growth: EU vs US
9IESE, July 8th 2004
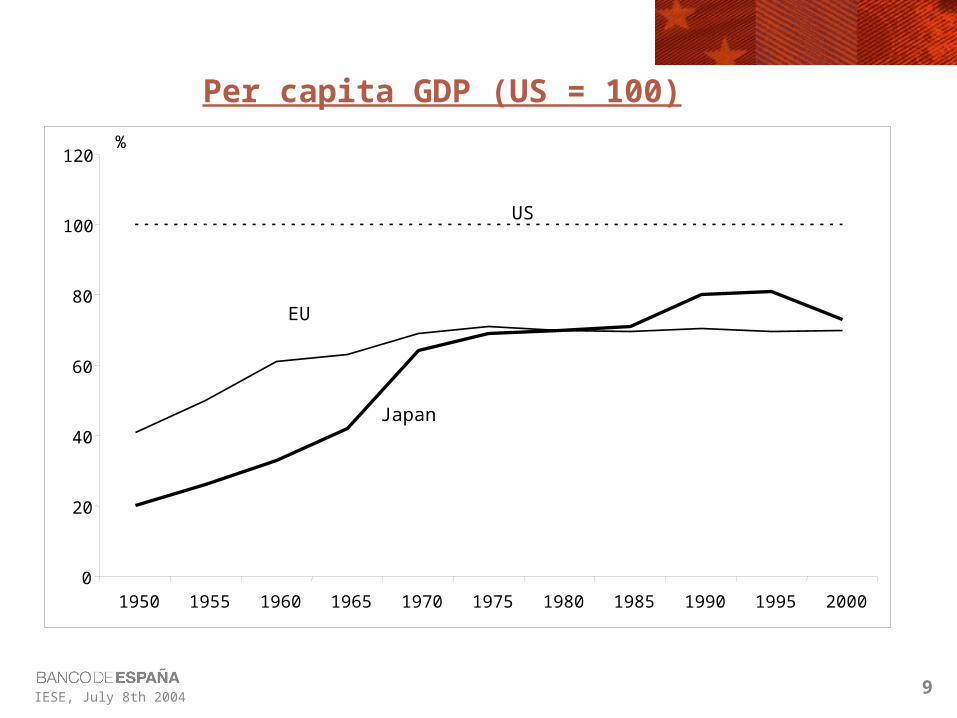
0
20
40
60
80
100
120
1950 1955 1960 1965 1970 1975 1980 1985 1990 1995 2000
%
US
EU
Japan
Per capita GDP (US = 100)
10IESE, July 8th 2004
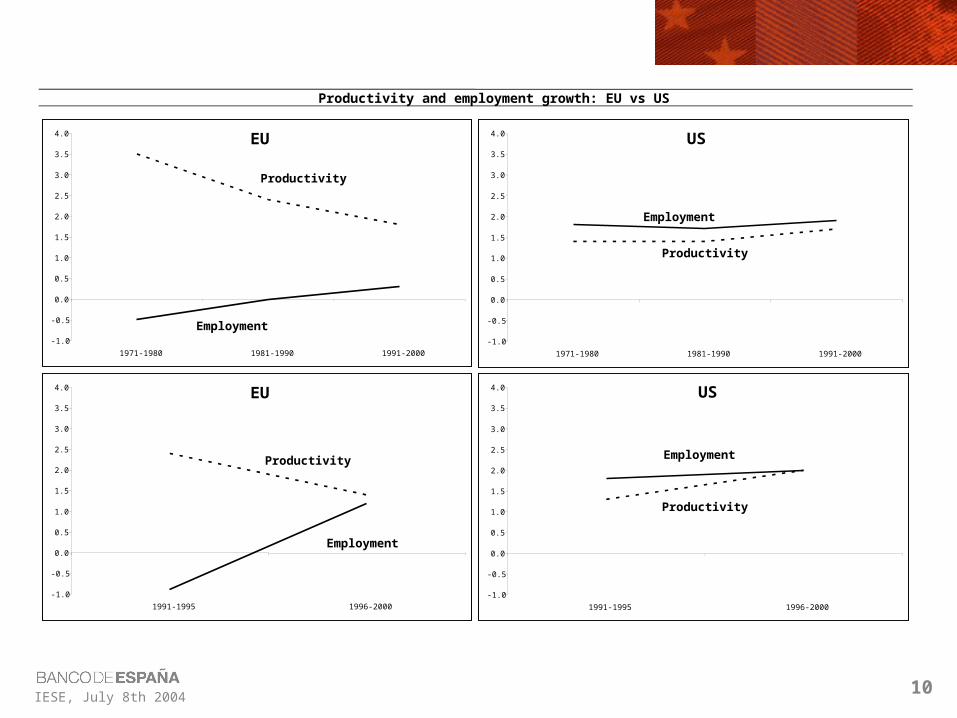
Productivity and employment growth: EU vs US
-1.0
-0.5
0.0
0.5
1.0
1.5
2.0
2.5
3.0
3.5
4.0
1971-1980 1981-1990 1991-2000
Productivity
Employment
EU
-1.0
-0.5
0.0
0.5
1.0
1.5
2.0
2.5
3.0
3.5
4.0
1971-1980 1981-1990 1991-2000
Productivity
Employment
US
-1.0
-0.5
0.0
0.5
1.0
1.5
2.0
2.5
3.0
3.5
4.0
1991-1995 1996-2000
Productivity
Employment
EU
-1.0
-0.5
0.0
0.5
1.0
1.5
2.0
2.5
3.0
3.5
4.0
1991-1995 1996-2000
Productivity
Employment
US
11IESE, July 8th 2004
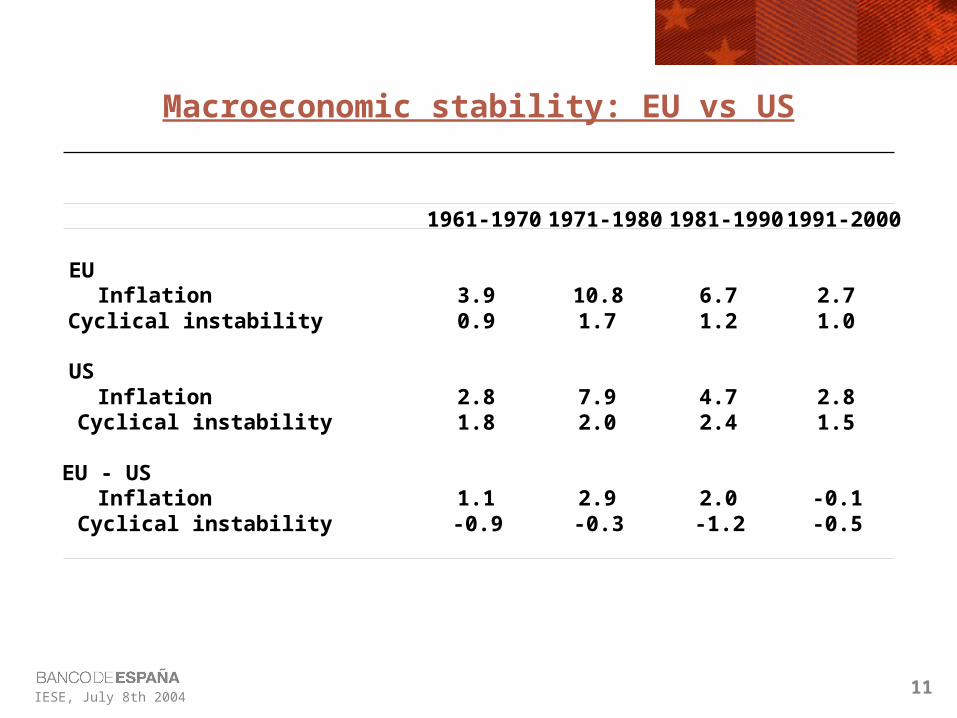
Macroeconomic stability: EU vs US
1961-19701971-19801981-19901991-2000
EU Inflation 3.9 10.8 6.7 2.7
Cyclical instability 0.9 1.7 1.2 1.0
US Inflation 2.8 7.9 4.7 2.8
Cyclical instability 1.8 2.0 2.4 1.5
EU - US Inflation 1.1 2.9 2.0 -0.1
Cyclical instability -0.9 -0.3 -1.2 -0.5

12IESE, July 8th 2004
1.7
1.8
1.9
2
2.1
1970 1980 1990 1995 2000
Ratio of 5% richest over 20% poorest incomes
0.295
0.3
0.305
0.31
0.315
0.32
0.325
1970 1980 1990 1995 2000
Gini Coefficient
Lower is less unequal
Lower is less unequal
Income inequality in EU

13IESE, July 8th 2004
European long-term economic performance:where do we stand?
Mixed performance of the European model
Lights-macro stability and cohesion
Shadows-growth
Other factors?

14IESE, July 8th 2004
Whan can explain such low growth?
Demography?
Preference for leisure?
Stability-oriented macropolicies?
Other factors?

15IESE, July 8th 2004
Other factors
EU is not a country
Growth has not been a priority
Unfavourable European economic environment Supply-side problems
Innovation and competitiveness failures
• Little R+D+i
• Insufficient tertiary education of quality
• Uncompetitive product-markets
Socio-economic cohesion systems very inefficient at both EU and national levels
• Inflexible labour markets
• Inadequate tax systems
Single market incomplete and not dynamic
• Financial system

16IESE, July 8th 2004
R + D expenditure (% GDP)
EU US
Total 1.9 2.6
Private 1.2 1.8
Public 0.7 0.8

17IESE, July 8th 2004
Expenditure in tertiary education (% GDP)
EU US
Total 1.4 3.0
Private 0.3 1.6
Public 1.1 1.4
18IESE, July 8th 2004
Europe recognises its problems
Lisbon Agenda (2000)
Ambitious goal: to become the most dynamic economic area by 2010 …
… but inadequate means: voluntarism, no teeth.
19IESE, July 8th 2004
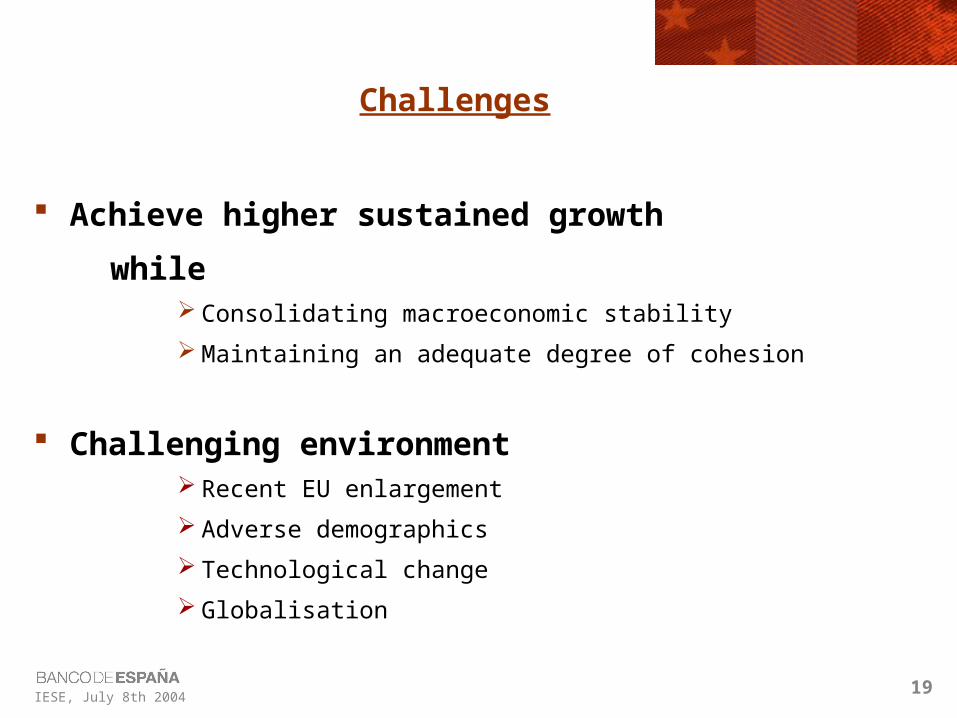
Challenges
Achieve higher sustained growth
while Consolidating macroeconomic stability
Maintaining an adequate degree of cohesion
Challenging environment Recent EU enlargement
Adverse demographics
Technological change
Globalisation

20IESE, July 8th 2004
What is at stake?
• Success of enlargement
Future standards of living of European
citizens
Sustainability of the European model
Process of European integration
Role of Europe in the world

21IESE, July 8th 2004
The European model under strain
Cornerstone
●Threat to macro stability (budget deficits, inflation)
Low growth even lower growth
● Cohesion can no longer be financed
● Stable macro policies•High growth needs
● Modernised cohesion (incentive-compatible)
Economic and socialcohesion
Macroeconomicstability
Growth↑

22IESE, July 8th 2004
What should be done?
Growth must become the top priority for policy European
National
But fostering growth requires massive reforms Of economic policies at European and national levels
Of European economic governance (EU as a catalyst-facilitator)
Absolute need for a minimum degree of political consensus
So far, very difficult to achieve (Germany, France, Italy)

23IESE, July 8th 2004
To do list: National level
Essential
Germany is key to unblock reforms
Which reforms? Goods and (particularly) services markets
Labour markets and cohesion policies
R+D+i+e

24IESE, July 8th 2004
To do list: European level
1. Complete Single Market and make it more dynamic
2. Boost investment in knowledge (R+D+i+e)
3. Redesign-modernise cohesion policies
4. Improve macroeconomic policy framework (more symmetry in fiscal and monetary policies)
5. Improve methods of economic governance
6. Refocus the EU budget

25IESE, July 8th 2004
Conclusions
Europe is nowadays at a cross-roads
Economic problems are deep and structural
Unless decisive change of course to place growth as the top
priority Standards of living of European citizens will stagnate or fall
The European model will not survive
The very process of European integration will be at risk
The role of Europe in the world will shrink further
Diagnosis of problems and solutions is clear: fundamental growth problems requires focus on growth
Will there be the political will to act?
So far, no …. but some hope
• European Constitution is a positive step
• Best way to ensure a reaction is to identify the very painful consequences of failing to react

26IESE, July 8th 2004
xxxxxxxxxx

27IESE, July 8th 2004
1. Complete and make more dynamic the Single Market
Financial services and integrated capital markets
Regulatory & competition policies for new entry
Policies to facilitate intra-EU labour mobility
“Green cards” for 3rd country nationals
Infrastructure for connecting up markets

28IESE, July 8th 2004
2. More investment in knowledge
Higher spending in R+D+i [1.9%=>3%] & higher
education [1.4%=>3%]
Better spending [several centres of excellence]
Independent European Agency for Science and
Research
Tax credits for small start-ups

29IESE, July 8th 2004
3. Redesign cohesion policy
Fundamental change needed
Cohesion and convergence The best cohesion is to achieve real convergence
Goal: nations and not regions
Funding criteria: efficiency in generating value-added
Restructuring Deeply affects the Common Agricultural Policy
Eligibility criteria: restructuring need and a good proposal (value added rather than rents maintenance)
Comprises affected individuals in all Member States

30IESE, July 8th 2004
4. More symmetric macro policy
More effective & flexible implementation of SGP Reinforce the role of the Commission
Create independent national Fiscal Auditing Boards
Foster higher surpluses-lower deficits in good times
Better policy coordination A consistent fiscal stance for the euro area
Reinforced dialogue euro area Council/ECB/Commission

31IESE, July 8th 2004
5. Better economic governance
Simpler and more effective decision-making needed
in large, heterogeneous Europe
Stronger EU enforcement of the Single Market
(independent EU bodies, like Competition Agency)
Better descentralisation of regulatory functions
Incentives for implementing the Lisbon Agenda (role
of the EU budget)
Qualified majority voting

32IESE, July 8th 2004
6. Refocus the EU budget
Cohesion should be consistent with growth, not an
impediment to it
Reorganise radically economic expenditures,
focussing on limited areas: Growth fund (for the EU)
Convergence fund (for low-income countries)
Restructuring fund (for affected individuals)
Revenues: target tax bases with EU dimension

33IESE, July 8th 2004
-2
-1
0
1
2
3
4
5
6
1990q1 1992q1 1994q1 1996q1 1998q1 2000q1 2002q1 2004q1
%
US
EU
Cyclical evolution EU vs US (1990-2004)

34IESE, July 8th 2004
Países candidatos: indicadores básicos (a)
PIB PIB per cápita (b) Población Tasa de paro(% PIB UE) (% media UE) (millones) (% pobl.activa)
Chipre 0.11 74 0.6 3.9Eslovaquia 0.25 47 5.4 19.4Eslovenia 0.23 70 2.0 5.7Estonia 0.07 40 1.4 12.4Hungría 0.65 53 10.0 5.7Letonia 0.15 33 2.4 13.1Lituania 0.09 38 3.7 16.5Malta 0.04 58 0.4 6.5Polonia 2.23 40 38.6 18.4República Checa 0.71 59 10.3 8.0Países en adhesión 4.57 47 74.8 14.5
Bulgaria 0.17 24 8.5 19.7Rumanía 0.50 24 22.4 6.6Países candidatos 5.25 45 105.6 13.1
UE 100 100 377.5 7.2
Fuente: Eurostat y Banco de España.(a) Datos correspondientes a 2001.(b) Medida en paridad del poder de compra.
35IESE, July 8th 2004
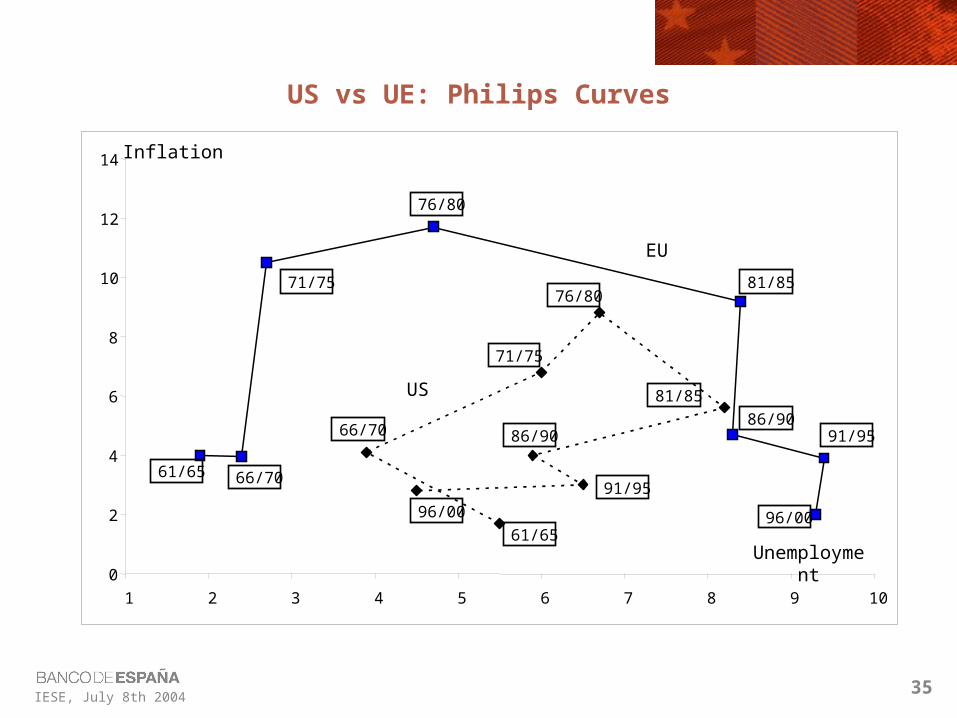
0
2
4
6
8
10
12
14
1 2 3 4 5 6 7 8 9 10
Inflation
US
EU
61/65 66/70
71/75
76/80
81/85
86/9091/95
96/0061/65
66/70
71/75
76/80
81/85
86/90
91/95
96/00
Unemployment
US vs UE: Philips Curves

36IESE, July 8th 2004
Per capita GDP (% EU average)
40
50
60
70
80
90
100
2002 2004 2006 2008 2010 2012 2014 2016 2018 2020 2022 2024 2026 2028 2030 2032 2034 2036 2038 2040 2042 2044
%
Spain 1986
Greece 1981New member states

37IESE, July 8th 2004
Income inequality “within” and “between” countries in EU before and after Enlargement
“Within” “Between"UE - 15 0,152 0,008 0,160
UE - 27 0,149 0,064 0,213
Total