campus climate data from isu surveys - illinois statecampus climate data from isu surveys university...
TRANSCRIPT

Campus Climate Data from ISU Surveys
University Assessment Services – July 2015 – UAS: Surveys of Student Engagement/Data Requests , 1
Background
Results included in this report are based on data from the following surveys1:
Table 1. Survey Results Used in This Report
Survey Target Population/Sample Last Administration at ISU
NSSE: National Survey of Student Engagement First-year and senior students Spring 2013
BCSSE: Beginning College Survey of Student Engagement Pre-college students Summer 2012
FSSE: Faculty Survey of Student Engagement Faculty Spring 2013
FOE: Foundations of Excellence survey Faculty, staff, & first-time ISU students2
Spring 2012
Pre-College Expectations
Before entering college, ISU students expect
to engage in more frequent conversations
and interactions with people from other
races and ethnicities, political opinions,
religious beliefs, and personal values than
they did in high school. For the most part,
this is what happens. As the example in
figure 1 shows, ISU student pre-college
expectations for engaging in serious
conversations with people from different
backgrounds are largely consistent with
frequencies reported by ISU first-year and
senior students. This finding is consistent
with a majority of universities that
participate in NSSE.3
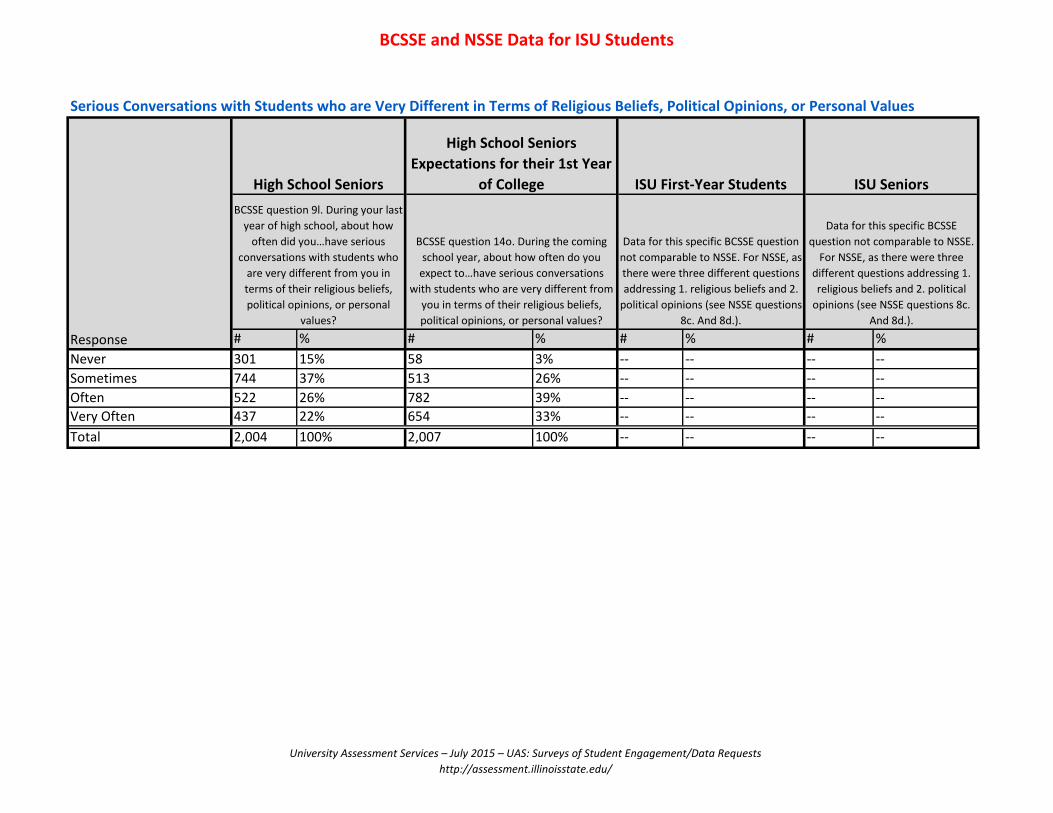
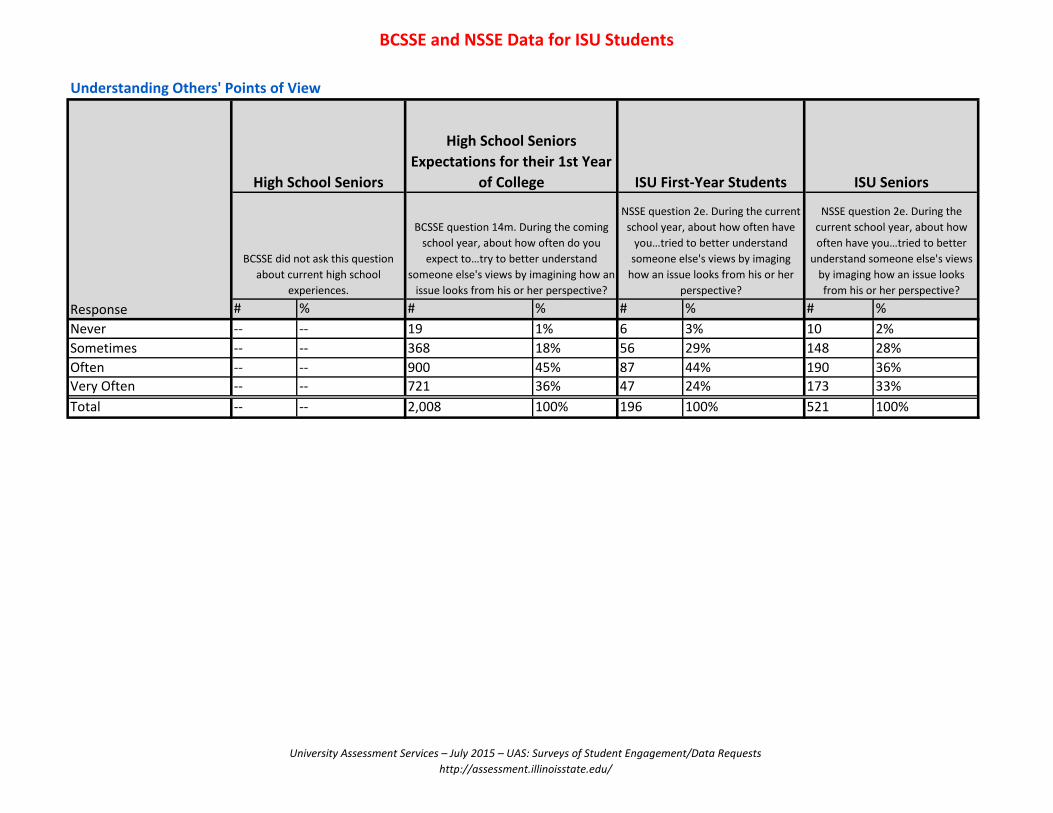
An area where ISU pre-college student
expectations are slightly higher than what
ISU first-year and senior students report is
understanding another’s point of view by
imagining an issue from their perspective,
as shown in figure 2.
1 The NSSE, FSSE, and BCSSE are developed and coordinated through the Indiana University Center for Postsecondary Research. The FOE survey is developed and coordinated through the John Gardner Institute for Excellence in Higher Education. 2 The FOE survey was administered to both first-year and new transfer students. Both groups matriculated as first-time students to ISU. 66% of respondents were first-year and 33% transfer students. 3 NSSE. (2014). Bringing the Institution Into Focus: Annual Results 2014. Bloomington, IN: IU Center for Postsecondary Research.
0%
10%
20%
30%
40%
50%
60%
70%
80%
90%
100%
H.S. Seniors H.S. SeniorExpectations for1st-yr. of College
ISU 1-st Yr.Students
ISU Seniors
Figure 1. Percent of Students Who Have Had or Expect to Have Serious Conversations with People of a Different Race or
Ethnicity
Never Sometimes Often/Very Often
0%
10%
20%
30%
40%
50%
60%
70%
80%
90%
100%
H.S. Senior Expectationsfor 1st-yr. of College
ISU 1-st Yr. Students ISU Seniors
Figure 2. Percent of students who have tried to better understand someone else's views by imagining how an issue
looks from his or her perspective
Never Sometimes Often/Very Often

Campus Climate Data from ISU Surveys
University Assessment Services – July 2015 – UAS: Surveys of Student Engagement/Data Requests , 2
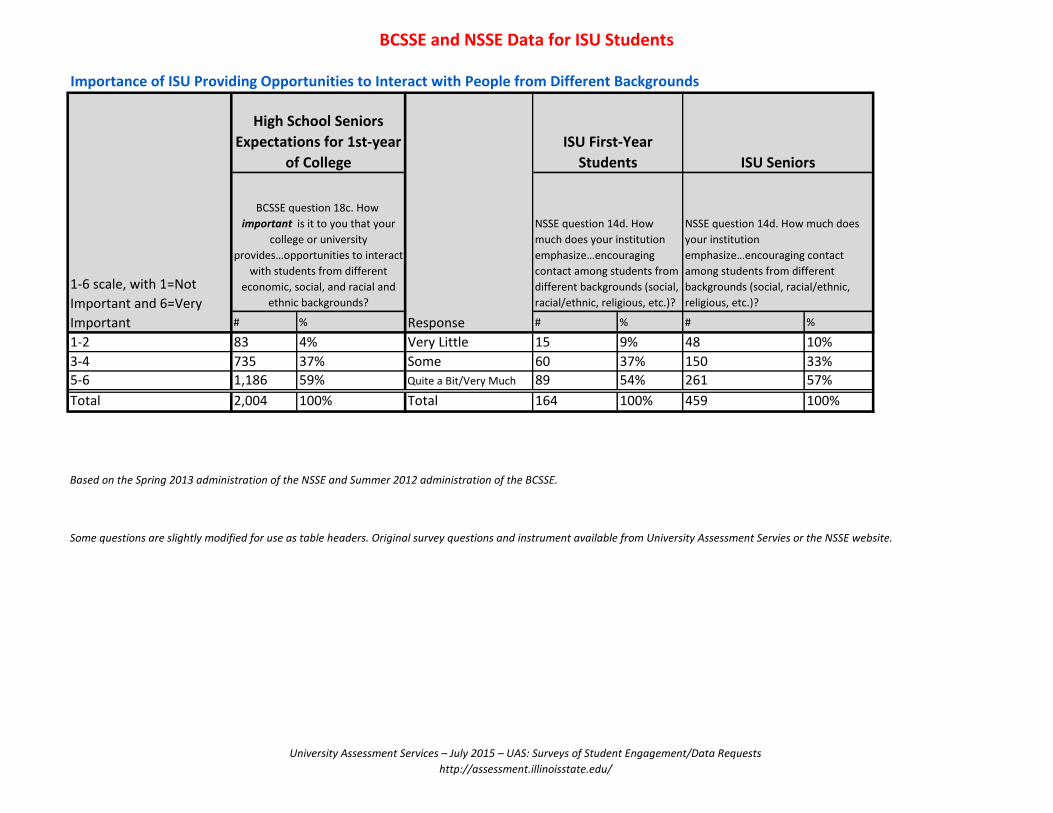
ISU students not only expect to have more
interactions with people who come from different
backgrounds, but also feel it is important that ISU
provides opportunities for them to interact with
people from different backgrounds, as shown in
Table 2.
NSSE Data National Comparisons
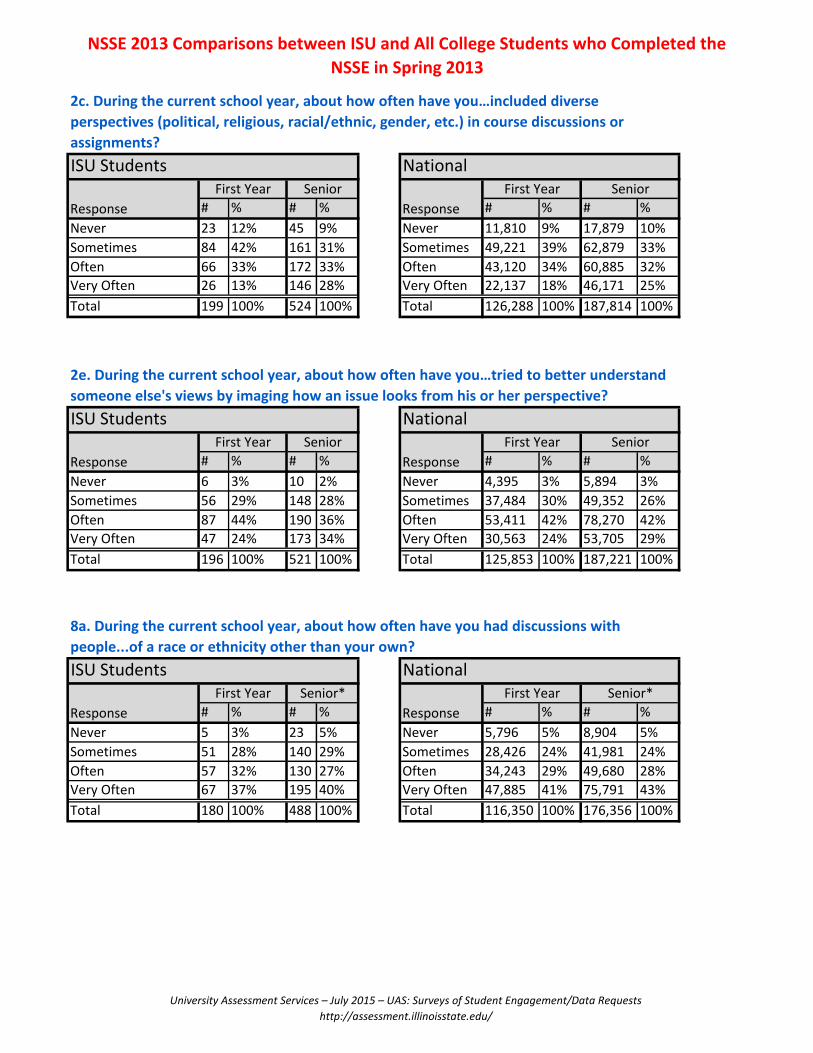
The NSSE asks a series of questions about student interactions with people who come from different backgrounds
(racial/ethnic, religious, economic, etc.), institutional emphasis on diversity, and contributions to knowledge and
understanding of people from different backgrounds. For the purposes of this report, eight questions from the NSSE
were utilized (2c, 2e, 8a, 8b, 8c, 8d, 14d, and 17h ). These questions, along with ISU and national survey results, are
presented at the end of this report in the NSSE 2013 comparisons.
There were no significant differences between ISU first-year students and all first-year students who completed the
NSSE in 2013 for the eight questions examined in this report.
For seniors, significant differences were found in eight of the three questions. These are displayed in table 3.
Table 3. Significant Differences between ISU Seniors and All Senior Students who Completed the NSSE in Spring 2013 Question Results
NSSE Question 8a: During the current school year, about how often have you had discussions with people from the following groups? People of a race or ethnicity different than your own?
ISU significantly lower
NSSE Question 14d. How much does your institution emphasize the following? Encouraging contact among students from different backgrounds (social, racial/ethnic, religious, etc.)
ISU significantly higher
NSSE Question 17h. How much has your experience at this institution contributed to your knowledge, skills, and personal development in the following areas? Understanding people of other backgrounds (economic, racial/ethnic, political, religious, nationality, etc.)
ISU significantly higher
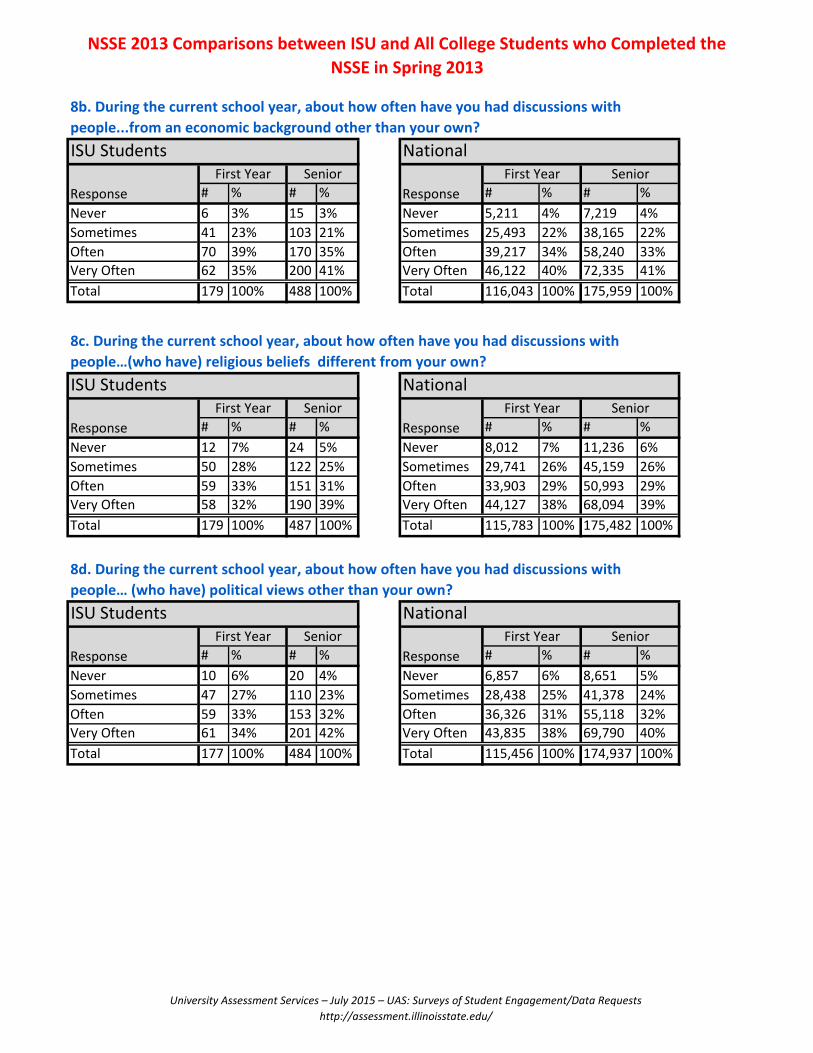
According to NSSE, “collaborating with others in mastering difficult material and developing interpersonal and social competence prepare students to deal with complex, unscripted problems they will encounter during and after college. Two Engagement Indicators make up this theme: Collaborative Learning and Discussions with Diverse Others.”4 Questions related to Discussions with Diverse Others engagement indicator are: Percentage of students who responded that they "Very often" or "Often" had discussions with
8a. People from a race or ethnicity other than your own.
8b. People from an economic background other than your own.
8c. People with religious beliefs other than your own.
8d. People with political views other than your own.
4 See NSSE Engagement Indicators report, available from UAS.
Table 2. How important is it to you that your college or university provides…opportunities to interact with students from different economic, social, and racial and ethnic backgrounds? (BCSSE question 18c; high school seniors only)
1-6 scale, with 1=Not Important and 6=Very Important
# %
1-2 83 4%
3-4 735 37%
5-6 1,186 59%
Total 2,004 100%

Campus Climate Data from ISU Surveys
University Assessment Services – July 2015 – UAS: Surveys of Student Engagement/Data Requests , 3
Data related to the Discussions with Diverse Others indicators are included in the data tables at the end of this report.
Based on the type of benchmark comparison, there were significant differences between ISU and other benchmark
groups (all NSSE 2013 institutions, Great Lakes institutions, and institutions from the same Carnegie Class).
Foundations of Excellence: First-Year Student Experiences
In spring 2012, ISU participated in the Foundations of Excellence (FOE) self-study process. Part of the process involved
a survey of first-year students at ISU. The FOE results are similar to NSSE in that they illustrate that, in general, ISU
students report moderate interactions with people from backgrounds different from their own, as shown in Table 4.
Table 4. To what degree is (ISU) exposing you to different… (FOE survey questions 38-41)
Response
38. World Cultures 39. World Religions 40. Political Perspectives
41. Issues related to social class or
economic status (poverty v. privilege)
# % # % # % # %
Not at all/Slightly 183 37% 227 46% 157 32% 154 32%
Moderately 164 33% 167 34% 163 33% 161 33%
High/Very High 144 29% 94 19% 170 35% 170 35%
Total 491 100% 488 100% 490 100% 485 100%
The FOE self-study process utilizes a 1-5 scale that evaluates an institution’s performance, from “least effective (1)“ to
“most effective (5).“ Figure 3 illustrates ISU’s performance on the FOE benchmarks for the diversity dimension.
Comparisons can also be made among various dimensions in the FOE process. As figure 4 illustrates, the two diversity
factors (interaction and exposure) were the only two dimension factor areas that fell .25 below the effective
performance benchmark of 3.5. This result is consistent with how ISU seniors responded to question 8a. on the NSSE
survey (During the current school year, about how often have you had discussions with people from the following
groups? People of a race or ethnicity different than your own?); ISU seniors reported significantly lower discussions
with people of a different race or ethnicity than national NSSE respondents (see table 3 on the previous page).

Campus Climate Data from ISU Surveys
University Assessment Services – July 2015 – UAS: Surveys of Student Engagement/Data Requests , 4
Green - Institution has a higher mean than the goal (3.5) Yellow - Institution is within .25 of the goal (3.5) Red - Institution has a lower mean than the goal (3.5) by more than .25
3.79
3.75
3.39
3.07
3.03
3.01
2.89
2.73
2.60
0.0 1.0 2.0 3.0 4.0 5.0
Q.46 Standards of Behavior: To what degree does thisinstitution communicate the importance of standards of
behavior in an academic community?
Q.45 Standards of Behavior: To what degree does thisinstitution communicate the importance of respecting
others with differing opinions?
Q.42 Interactions: Within the following groups, to whatdegree does this institution provide opportunities for
interaction with individuals from differing backgrounds andcultures? (specifically other students at ISU)
Q.43 Interactions: Within the following groups, to whatdegree does this institution provide opportunities for
interaction with individuals from differing backgrounds andcultures? (specifically faculty and staff at ISU)
Q.41 Focus on Diversity: To what degree is this institutionexposing you to different issues related to social
class/economic status (poverty vs. privilege)?
Q.40 Focus on Diversity: To what degree is this institutionexposing you to different political perspectives?
Q.40 Focus on Diversity: To what degree is this institutionexposing you to different world cultures?
Q.44 Interactions: Within the following groups, to whatdegree does this institution provide opportunities for
interaction with individuals from differing backgrounds andcultures? (specifically people out of ISU)
Q.39 Focus on Diversity: To what degree is this institutionexposing you to different world religions?
Figure 3. FOE Diversity Dimension Question Results and Benchmark Performance

Campus Climate Data from ISU Surveys
University Assessment Services – July 2015 – UAS: Surveys of Student Engagement/Data Requests , 5
Green - Institution has a higher mean than the goal (3.5) Yellow - Institution is within .25 of the goal (3.5) Red - Institution has a lower mean than the goal (3.5) by more than .25
3.96
3.99
3.90
3.84
3.83
3.80
3.79
3.73
3.73
3.63
3.62
3.54
3.25
3.24
2.89
0.0 1.0 2.0 3.0 4.0 5.0
Overall Evaluation (institution)
Standards of Behavior (transitions)
Campus Environment (all students)
Pre-enrollment (transitions)
Transfer: Campus Environment (all students)
Quality of Instruction (learning)
Academic Advising (transitions)
Transfer: Transfer Process (transitions)
Overall Evaluation: Transition Support
Motivation and Goals (roles and purposes)
Overall Evaluation: Academic Gains
Structure and Support (organization)
Making Connections (transitions)
Interaction (diversity)
Exposure (diversity)
Figure 4. Comparisons of All FOE Dimensions Based on Survey of Students

Campus Climate Data from ISU Surveys
University Assessment Services – July 2015 – UAS: Surveys of Student Engagement/Data Requests , 6
ISU Student and Faculty & Staff Comparisons
This report utilizes results from two surveys in regard to faculty and staff perceptions about campus climate:
1. FSSE – faculty only. NSSE and FSSE responses to similar questions are compared in a report. As of 2014,
faculty questions generally center around the importance of and opportunities for student engagement with
diverse experiences. The FSSE also asks faculty to think about a specific undergraduate course they teach,
while the NSSE generally asks students to respond in terms of more broad, institution-level experiences.
2. FOE Survey – faculty and staff. Some questions between the faculty and the student surveys are similar, but
are not compiled and compared in a report.
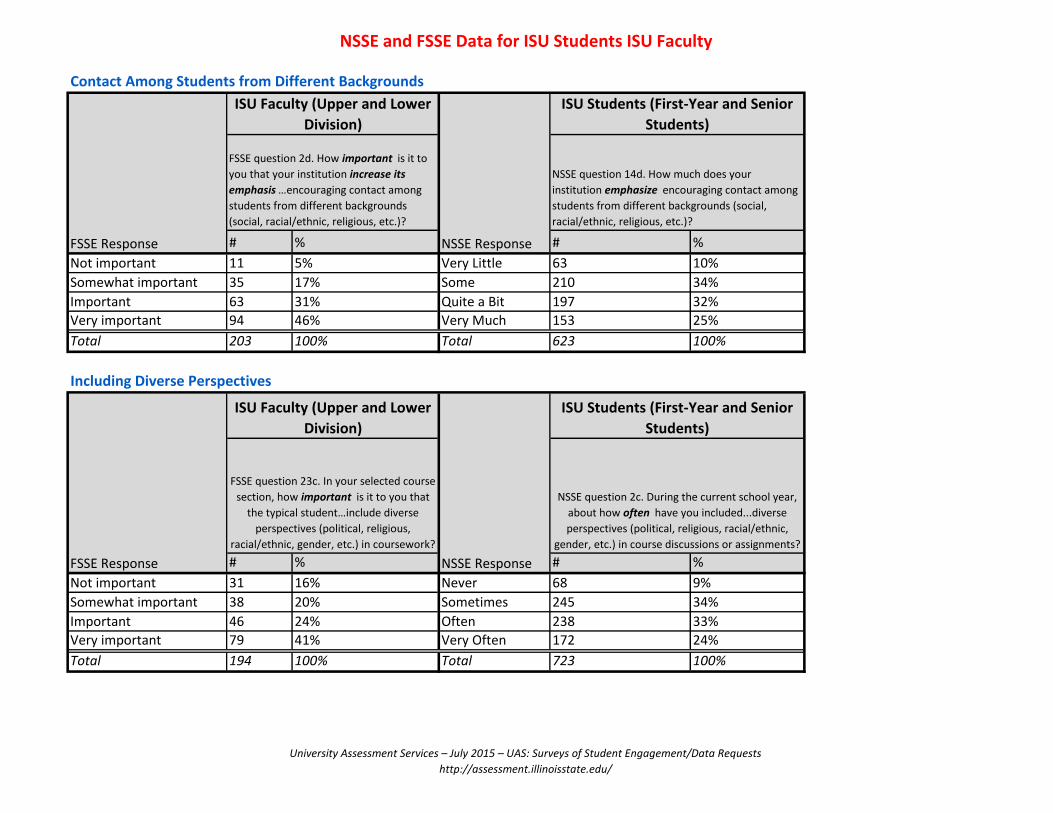
NSSE and FSSE Results
Using NSSE and FSSE results, Table 5 compares faculty importance placed on increasing institutional emphasis on
encouraging contact among people from different backgrounds with how much students feel ISU emphasizes this
contact.
Table 5. Faculty Importance Placed on Increasing ISU’s Emphasis on Encouraging Contact Among Students from Different Backgrounds and Student Perceptions About Emphasis Placed
FSSE Response
ISU Faculty (Upper and Lower Division)
NSSE Response
ISU Students (First-Year and Senior Students)
FSSE question 2d. How important is it to you that your institution increase its emphasis…encouraging contact among students from different backgrounds (social, racial/ethnic, religious, etc.)?
NSSE question 14d. How much does your institution emphasize encouraging contact among students from different backgrounds (social, racial/ethnic, religious, etc.)?
# % # %
Not important 11 5% Very Little 63 10%
Somewhat important 35 17% Some 210 34%
Important/Very important 157 77% Quite a Bit/Very Much 350 57%
Total 203 100% Total 623 100%
While reporting high levels of importance, most faculty report lower amounts of opportunities for students in their
courses to engage in discussions with students from different backgrounds, as shown in the attached data tables.
However, this may be the result of different wording with the questions. Faculty are asked to respond in terms of a
course they teach, while students are asked to respond in terms of broad, institution-level experiences. The FSSE and
NSSE questions also use different response categories [importance (FSSE) versus frequency (NSSE), for example].

Campus Climate Data from ISU Surveys
University Assessment Services – July 2015 – UAS: Surveys of Student Engagement/Data Requests , 7
FOE Results
Student responses to the FOE survey can be compared to faculty and staff responses. In some areas, the answers
were similar. Students and faculty both largely agree, for example, that ISU places a high importance on respecting
others with differing opinions, with 91% of students and 88% of faculty and staff at least moderately agreeing.
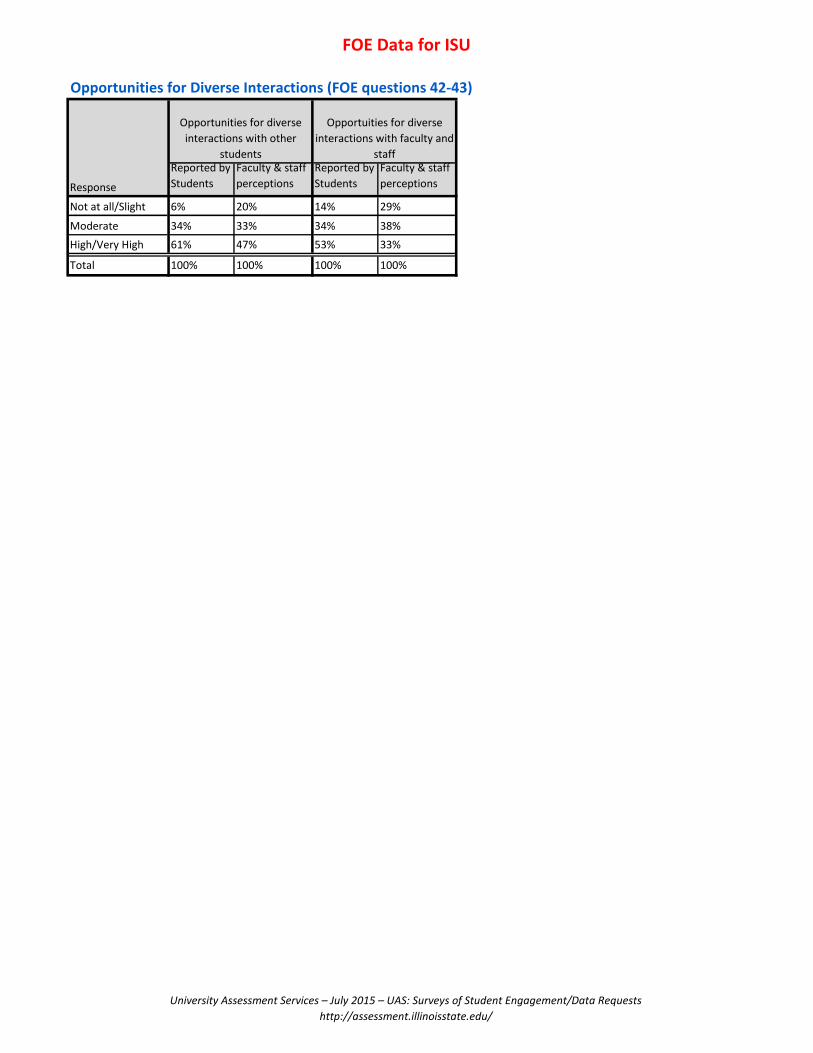
Faculty and staff tend to underestimate the amount of opportunities students have to engage in diverse interactions.
In Figure 5, for example, students report higher levels of opportunities interactions with students from different
backgrounds than faculty and staff perceive. Because the FOE results were not compared with national results,
student reports of opportunities for interactions or actual interactions with other students from different
backgrounds could still be lower than other institutions (as reported in table 3, page 2).
In figure 6, students again report higher levels of opportunities for diverse interactions with faculty and staff than
faculty and staff perceive.
0%
10%
20%
30%
40%
50%
60%
70%
80%
90%
100%
Reported by Students Faculty & staff perceptions
Figure 5. Opportunities for Diverse Interactions with Other Students
Not at all/Slight
Moderate
High/Very High
0%
10%
20%
30%
40%
50%
60%
70%
80%
90%
100%
Reported by Students Faculty & staff perceptions
Figure 6. Opportunities for Diverse Interactions with Faculty and Staff
Not at all/Slight
Moderate
High/Very High
Campus Climate Data from ISU Surveys
University Assessment Services – July 2015 – UAS: Surveys of Student Engagement/Data Requests , 8
Summary
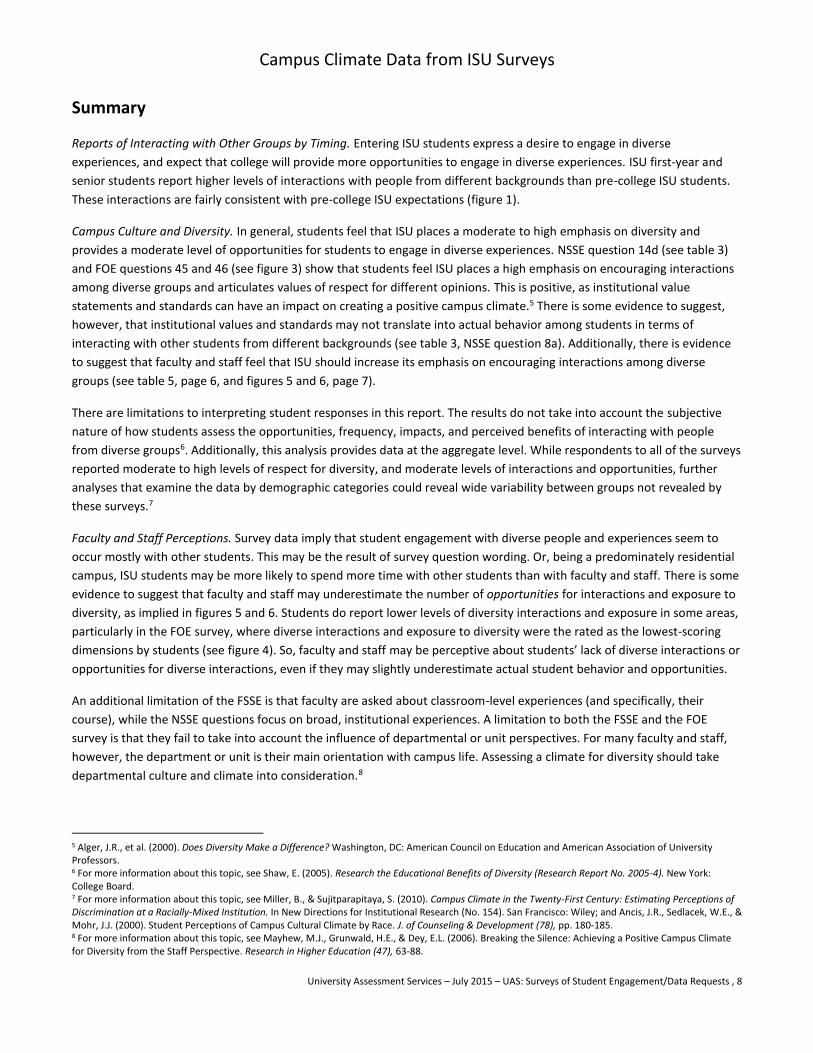
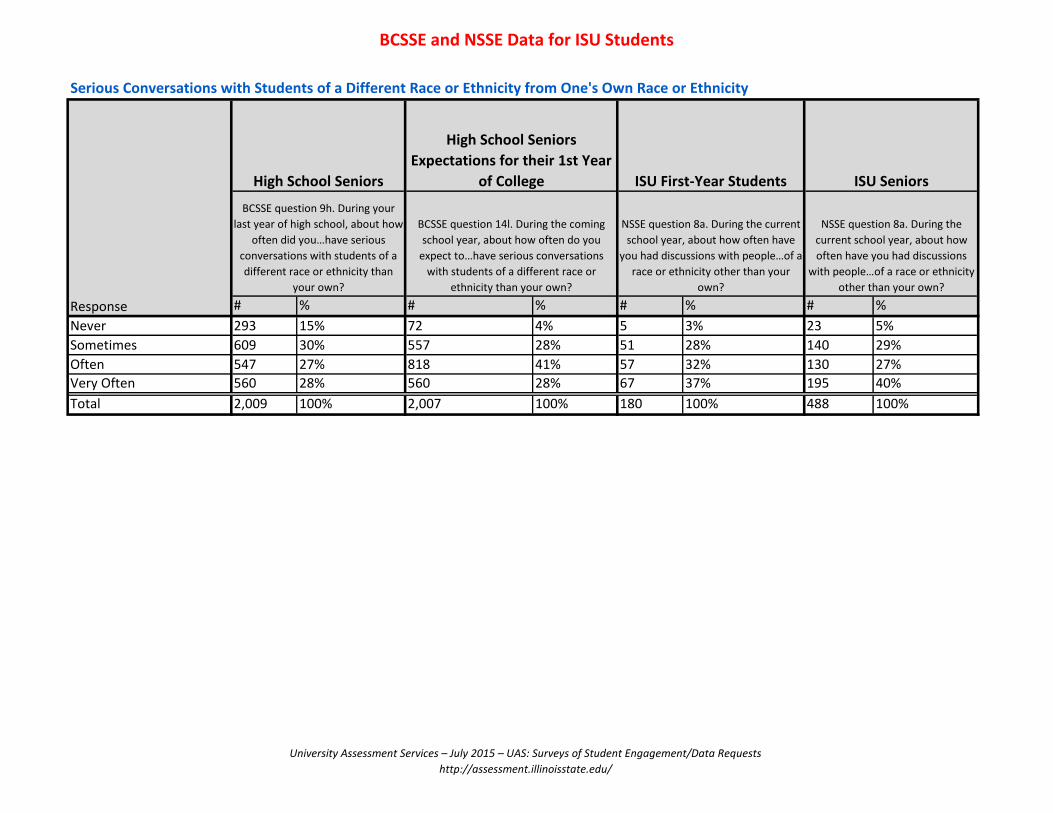
Reports of Interacting with Other Groups by Timing. Entering ISU students express a desire to engage in diverse
experiences, and expect that college will provide more opportunities to engage in diverse experiences. ISU first-year and
senior students report higher levels of interactions with people from different backgrounds than pre-college ISU students.
These interactions are fairly consistent with pre-college ISU expectations (figure 1).
Campus Culture and Diversity. In general, students feel that ISU places a moderate to high emphasis on diversity and
provides a moderate level of opportunities for students to engage in diverse experiences. NSSE question 14d (see table 3)
and FOE questions 45 and 46 (see figure 3) show that students feel ISU places a high emphasis on encouraging interactions
among diverse groups and articulates values of respect for different opinions. This is positive, as institutional value
statements and standards can have an impact on creating a positive campus climate.5 There is some evidence to suggest,
however, that institutional values and standards may not translate into actual behavior among students in terms of
interacting with other students from different backgrounds (see table 3, NSSE question 8a). Additionally, there is evidence
to suggest that faculty and staff feel that ISU should increase its emphasis on encouraging interactions among diverse
groups (see table 5, page 6, and figures 5 and 6, page 7).
There are limitations to interpreting student responses in this report. The results do not take into account the subjective
nature of how students assess the opportunities, frequency, impacts, and perceived benefits of interacting with people
from diverse groups6. Additionally, this analysis provides data at the aggregate level. While respondents to all of the surveys
reported moderate to high levels of respect for diversity, and moderate levels of interactions and opportunities, further
analyses that examine the data by demographic categories could reveal wide variability between groups not revealed by
these surveys.7
Faculty and Staff Perceptions. Survey data imply that student engagement with diverse people and experiences seem to
occur mostly with other students. This may be the result of survey question wording. Or, being a predominately residential
campus, ISU students may be more likely to spend more time with other students than with faculty and staff. There is some
evidence to suggest that faculty and staff may underestimate the number of opportunities for interactions and exposure to
diversity, as implied in figures 5 and 6. Students do report lower levels of diversity interactions and exposure in some areas,
particularly in the FOE survey, where diverse interactions and exposure to diversity were the rated as the lowest-scoring
dimensions by students (see figure 4). So, faculty and staff may be perceptive about students’ lack of diverse interactions or
opportunities for diverse interactions, even if they may slightly underestimate actual student behavior and opportunities.
An additional limitation of the FSSE is that faculty are asked about classroom-level experiences (and specifically, their
course), while the NSSE questions focus on broad, institutional experiences. A limitation to both the FSSE and the FOE
survey is that they fail to take into account the influence of departmental or unit perspectives. For many faculty and staff,
however, the department or unit is their main orientation with campus life. Assessing a climate for diversity should take
departmental culture and climate into consideration.8
5 Alger, J.R., et al. (2000). Does Diversity Make a Difference? Washington, DC: American Council on Education and American Association of University Professors. 6 For more information about this topic, see Shaw, E. (2005). Research the Educational Benefits of Diversity (Research Report No. 2005-4). New York: College Board. 7 For more information about this topic, see Miller, B., & Sujitparapitaya, S. (2010). Campus Climate in the Twenty-First Century: Estimating Perceptions of Discrimination at a Racially-Mixed Institution. In New Directions for Institutional Research (No. 154). San Francisco: Wiley; and Ancis, J.R., Sedlacek, W.E., & Mohr, J.J. (2000). Student Perceptions of Campus Cultural Climate by Race. J. of Counseling & Development (78), pp. 180-185. 8 For more information about this topic, see Mayhew, M.J., Grunwald, H.E., & Dey, E.L. (2006). Breaking the Silence: Achieving a Positive Campus Climate for Diversity from the Staff Perspective. Research in Higher Education (47), 63-88.
BCSSE and NSSE Data for ISU Students
# % # % # % # %
Never 293 15% 72 4% 5 3% 23 5%
Sometimes 609 30% 557 28% 51 28% 140 29%
Often 547 27% 818 41% 57 32% 130 27%
Very Often 560 28% 560 28% 67 37% 195 40%
Total 2,009 100% 2,007 100% 180 100% 488 100%
BCSSE question 14l. During the coming
school year, about how often do you
expect to…have serious conversations
with students of a different race or
ethnicity than your own?
Serious Conversations with Students of a Different Race or Ethnicity from One's Own Race or Ethnicity
ISU First-Year Students ISU Seniors
NSSE question 8a. During the current
school year, about how often have
you had discussions with people…of a
race or ethnicity other than your
own?
NSSE question 8a. During the
current school year, about how
often have you had discussions
with people…of a race or ethnicity
other than your own?
Response
High School Seniors
High School Seniors
Expectations for their 1st Year
of College
BCSSE question 9h. During your
last year of high school, about how
often did you…have serious
conversations with students of a
different race or ethnicity than
your own?
University Assessment Services – July 2015 – UAS: Surveys of Student Engagement/Data Requests
http://assessment.illinoisstate.edu/
BCSSE and NSSE Data for ISU Students
# % # % # % # %
Never 301 15% 58 3% -- -- -- --
Sometimes 744 37% 513 26% -- -- -- --
Often 522 26% 782 39% -- -- -- --
Very Often 437 22% 654 33% -- -- -- --
Total 2,004 100% 2,007 100% -- -- -- --
Serious Conversations with Students who are Very Different in Terms of Religious Beliefs, Political Opinions, or Personal Values
Response
High School Seniors
High School Seniors
Expectations for their 1st Year
of College ISU First-Year Students ISU Seniors
Data for this specific BCSSE question
not comparable to NSSE. For NSSE, as
there were three different questions
addressing 1. religious beliefs and 2.
political opinions (see NSSE questions
8c. And 8d.).
BCSSE question 9l. During your last
year of high school, about how
often did you…have serious
conversations with students who
are very different from you in
terms of their religious beliefs,
political opinions, or personal
values?
BCSSE question 14o. During the coming
school year, about how often do you
expect to…have serious conversations
with students who are very different from
you in terms of their religious beliefs,
political opinions, or personal values?
Data for this specific BCSSE
question not comparable to NSSE.
For NSSE, as there were three
different questions addressing 1.
religious beliefs and 2. political
opinions (see NSSE questions 8c.
And 8d.).
University Assessment Services – July 2015 – UAS: Surveys of Student Engagement/Data Requests
http://assessment.illinoisstate.edu/
BCSSE and NSSE Data for ISU Students
# % # % # % # %
Never -- -- 19 1% 6 3% 10 2%
Sometimes -- -- 368 18% 56 29% 148 28%
Often -- -- 900 45% 87 44% 190 36%
Very Often -- -- 721 36% 47 24% 173 33%
Total -- -- 2,008 100% 196 100% 521 100%
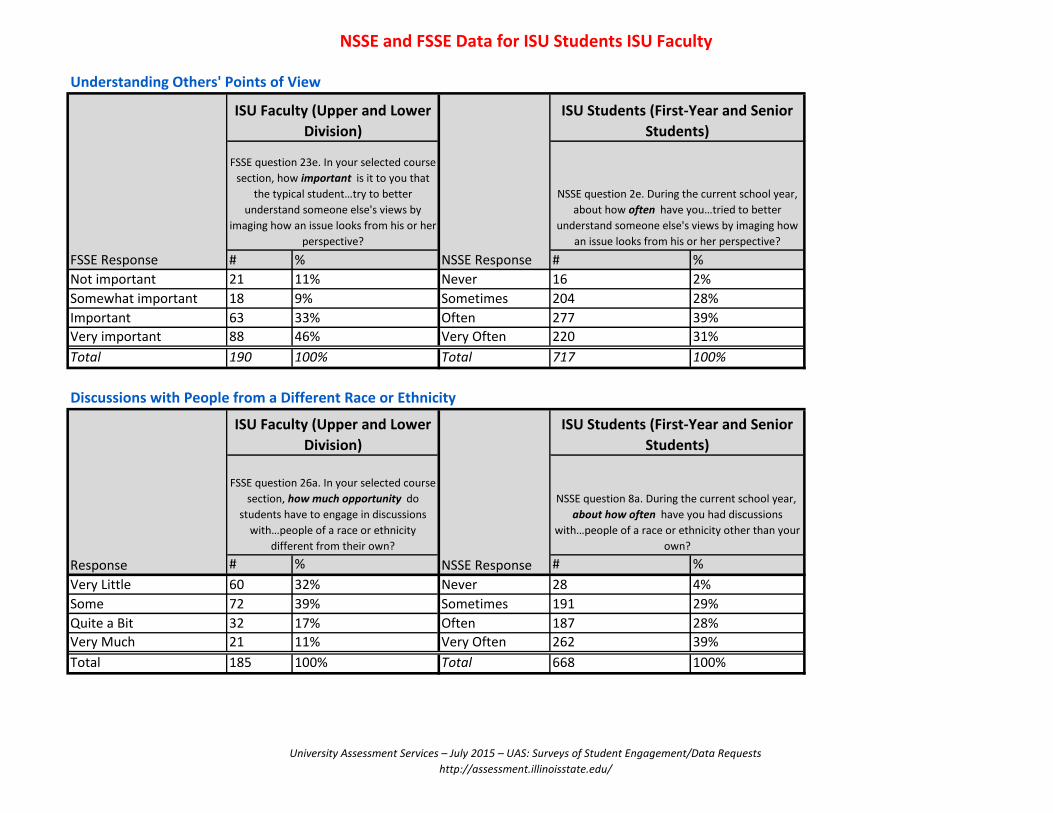
Understanding Others' Points of View
Response
High School Seniors
High School Seniors
Expectations for their 1st Year
of College ISU First-Year Students ISU Seniors
BCSSE did not ask this question
about current high school
experiences.
BCSSE question 14m. During the coming
school year, about how often do you
expect to…try to better understand
someone else's views by imagining how an
issue looks from his or her perspective?
NSSE question 2e. During the current
school year, about how often have
you…tried to better understand
someone else's views by imaging
how an issue looks from his or her
perspective?
NSSE question 2e. During the
current school year, about how
often have you…tried to better
understand someone else's views
by imaging how an issue looks
from his or her perspective?
University Assessment Services – July 2015 – UAS: Surveys of Student Engagement/Data Requests
http://assessment.illinoisstate.edu/
BCSSE and NSSE Data for ISU Students
# % # % # %
1-2 83 4% Very Little 15 9% 48 10%
3-4 735 37% Some 60 37% 150 33%
5-6 1,186 59% Quite a Bit/Very Much 89 54% 261 57%
Total 2,004 100% Total 164 100% 459 100%
Based on the Spring 2013 administration of the NSSE and Summer 2012 administration of the BCSSE.
Some questions are slightly modified for use as table headers. Original survey questions and instrument available from University Assessment Servies or the NSSE website.
1-6 scale, with 1=Not
Important and 6=Very
Important
High School Seniors
Expectations for 1st-year
of College
BCSSE question 18c. How
important is it to you that your
college or university
provides…opportunities to interact
with students from different
economic, social, and racial and
ethnic backgrounds?
Importance of ISU Providing Opportunities to Interact with People from Different Backgrounds
Response
NSSE question 14d. How
much does your institution
emphasize…encouraging
contact among students from
different backgrounds (social,
racial/ethnic, religious, etc.)?
NSSE question 14d. How much does
your institution
emphasize…encouraging contact
among students from different
backgrounds (social, racial/ethnic,
religious, etc.)?
ISU First-Year
Students ISU Seniors
University Assessment Services – July 2015 – UAS: Surveys of Student Engagement/Data Requests
http://assessment.illinoisstate.edu/
NSSE 2013 Comparisons between ISU and All College Students who Completed the
NSSE in Spring 2013
# % # % # % # %
Never 23 12% 45 9% Never 11,810 9% 17,879 10%
Sometimes 84 42% 161 31% Sometimes 49,221 39% 62,879 33%
Often 66 33% 172 33% Often 43,120 34% 60,885 32%
Very Often 26 13% 146 28% Very Often 22,137 18% 46,171 25%
Total 199 100% 524 100% Total 126,288 100% 187,814 100%
# % # % # % # %
Never 6 3% 10 2% Never 4,395 3% 5,894 3%
Sometimes 56 29% 148 28% Sometimes 37,484 30% 49,352 26%
Often 87 44% 190 36% Often 53,411 42% 78,270 42%
Very Often 47 24% 173 34% Very Often 30,563 24% 53,705 29%
Total 196 100% 521 100% Total 125,853 100% 187,221 100%
# % # % # % # %
Never 5 3% 23 5% Never 5,796 5% 8,904 5%
Sometimes 51 28% 140 29% Sometimes 28,426 24% 41,981 24%
Often 57 32% 130 27% Often 34,243 29% 49,680 28%
Very Often 67 37% 195 40% Very Often 47,885 41% 75,791 43%
Total 180 100% 488 100% Total 116,350 100% 176,356 100%
2c. During the current school year, about how often have you…included diverse
perspectives (political, religious, racial/ethnic, gender, etc.) in course discussions or
assignments?
8a. During the current school year, about how often have you had discussions with
people...of a race or ethnicity other than your own?
2e. During the current school year, about how often have you…tried to better understand
someone else's views by imaging how an issue looks from his or her perspective?
ISU Students National
Response
First Year Senior
Response
First Year Senior
ISU Students National
Response
First Year Senior*
Response
First Year Senior*
ISU Students National
Response Response
First Year Senior First Year Senior
University Assessment Services – July 2015 – UAS: Surveys of Student Engagement/Data Requests
http://assessment.illinoisstate.edu/
NSSE 2013 Comparisons between ISU and All College Students who Completed the
NSSE in Spring 2013
# % # % # % # %
Never 6 3% 15 3% Never 5,211 4% 7,219 4%
Sometimes 41 23% 103 21% Sometimes 25,493 22% 38,165 22%
Often 70 39% 170 35% Often 39,217 34% 58,240 33%
Very Often 62 35% 200 41% Very Often 46,122 40% 72,335 41%
Total 179 100% 488 100% Total 116,043 100% 175,959 100%
# % # % # % # %
Never 12 7% 24 5% Never 8,012 7% 11,236 6%
Sometimes 50 28% 122 25% Sometimes 29,741 26% 45,159 26%
Often 59 33% 151 31% Often 33,903 29% 50,993 29%
Very Often 58 32% 190 39% Very Often 44,127 38% 68,094 39%
Total 179 100% 487 100% Total 115,783 100% 175,482 100%
# % # % # % # %
Never 10 6% 20 4% Never 6,857 6% 8,651 5%
Sometimes 47 27% 110 23% Sometimes 28,438 25% 41,378 24%
Often 59 33% 153 32% Often 36,326 31% 55,118 32%
Very Often 61 34% 201 42% Very Often 43,835 38% 69,790 40%
Total 177 100% 484 100% Total 115,456 100% 174,937 100%
ISU Students National
Response
First Year Senior
Response
First Year Senior
ISU Students National
Response
First Year Senior
8b. During the current school year, about how often have you had discussions with
people...from an economic background other than your own?
8c. During the current school year, about how often have you had discussions with
people…(who have) religious beliefs different from your own?
8d. During the current school year, about how often have you had discussions with
people… (who have) political views other than your own?
ISU Students National
Response
First Year Senior
Senior
Response
First Year Senior
Response
First Year
University Assessment Services – July 2015 – UAS: Surveys of Student Engagement/Data Requests
http://assessment.illinoisstate.edu/

NSSE 2013 Comparisons between ISU and All College Students who Completed the
NSSE in Spring 2013
# % # % # % # %
Very Little 15 9% 48 10% Never 12,407 12% 26,355 16%
Some 60 37% 150 33% Sometimes 31,391 29% 52,812 32%
Quite a bit 51 31% 146 32% Often 35,057 33% 49,915 30%
Very much 38 23% 115 25% Very Often 28,746 27% 37,296 22%
Total 164 100% 459 100% Total 107,601 100% 166,378 100%
# % # % # % # %
Very Little 15 9% 32 7% Never 11,485 11% 17,635 11%
Some 50 31% 128 28% Sometimes 30,589 29% 44,855 27%
Quite a bit 60 37% 142 31% Often 36,569 34% 52,495 32%
Very much 37 23% 154 34% Very Often 28,016 26% 50,275 30%
Total 162 100% 456 100% Total 106,659 100% 165,260 100%
*Significant difference between ISU and National NSSE results
Some questions are slightly modified for use as table headers. Original survey questions and instrument available
from University Assessment Servies or the NSSE website. Based on the spring 2013 administration of the NSSE.
Senior*
Response
First Year Senior*
Response
First Year
ISU Students National
14d. How much does your institution emphasize…encouraging contact among students
from different backgrounds (social, racial/ethnic, religious, etc.)?
17h. How much has your experience at this institution contributed to your knowledge,
skills, and personal development (in terms of) understanding people of other backgrounds
(economic, racial/ethnic, political, religious, nationality, etc.)?
ISU Students National
Response
First Year Senior*
Response
First Year Senior*
University Assessment Services – July 2015 – UAS: Surveys of Student Engagement/Data Requests
http://assessment.illinoisstate.edu/
NSSE and FSSE Data for ISU Students ISU Faculty
# % # %
Not important 11 5% Very Little 63 10%
Somewhat important 35 17% Some 210 34%
Important 63 31% Quite a Bit 197 32%
Very important 94 46% Very Much 153 25%
Total 203 100% Total 623 100%
# % # %
Not important 31 16% Never 68 9%
Somewhat important 38 20% Sometimes 245 34%
Important 46 24% Often 238 33%
Very important 79 41% Very Often 172 24%
Total 194 100% Total 723 100%
FSSE question 2d. How important is it to
you that your institution increase its
emphasis …encouraging contact among
students from different backgrounds
(social, racial/ethnic, religious, etc.)?
NSSE question 14d. How much does your
institution emphasize encouraging contact among
students from different backgrounds (social,
racial/ethnic, religious, etc.)?
Contact Among Students from Different Backgrounds
ISU Faculty (Upper and Lower
Division)
ISU Students (First-Year and Senior
Students)
FSSE Response
FSSE Response
ISU Faculty (Upper and Lower
Division)
ISU Students (First-Year and Senior
Students)
FSSE question 23c. In your selected course
section, how important is it to you that
the typical student…include diverse
perspectives (political, religious,
racial/ethnic, gender, etc.) in coursework?
NSSE question 2c. During the current school year,
about how often have you included...diverse
perspectives (political, religious, racial/ethnic,
gender, etc.) in course discussions or assignments?
Including Diverse Perspectives
NSSE Response
NSSE Response
University Assessment Services – July 2015 – UAS: Surveys of Student Engagement/Data Requests
http://assessment.illinoisstate.edu/
NSSE and FSSE Data for ISU Students ISU Faculty
# % # %
Not important 21 11% Never 16 2%
Somewhat important 18 9% Sometimes 204 28%
Important 63 33% Often 277 39%
Very important 88 46% Very Often 220 31%
Total 190 100% Total 717 100%
# % # %
Very Little 60 32% Never 28 4%
Some 72 39% Sometimes 191 29%
Quite a Bit 32 17% Often 187 28%
Very Much 21 11% Very Often 262 39%
Total 185 100% Total 668 100%
Understanding Others' Points of View
NSSE question 2e. During the current school year,
about how often have you…tried to better
understand someone else's views by imaging how
an issue looks from his or her perspective?
Discussions with People from a Different Race or Ethnicity
FSSE Response
ISU Faculty (Upper and Lower
Division)
ISU Students (First-Year and Senior
Students)
FSSE question 23e. In your selected course
section, how important is it to you that
the typical student…try to better
understand someone else's views by
imaging how an issue looks from his or her
perspective?
Response
ISU Faculty (Upper and Lower
Division)
ISU Students (First-Year and Senior
Students)
FSSE question 26a. In your selected course
section, how much opportunity do
students have to engage in discussions
with…people of a race or ethnicity
different from their own?
NSSE question 8a. During the current school year,
about how often have you had discussions
with…people of a race or ethnicity other than your
own?
NSSE Response
NSSE Response
University Assessment Services – July 2015 – UAS: Surveys of Student Engagement/Data Requests
http://assessment.illinoisstate.edu/
NSSE and FSSE Data for ISU Students ISU Faculty
# % # %
Very Little 53 29% Never 21 3%
Some 76 41% Sometimes 144 22%
Quite a Bit 35 19% Often 240 36%
Very Much 20 11% Very Often 262 39%
Total 184 100% Total 667 100%
# % # %
Very Little 61 34% Never 36 5%
Some 76 42% Sometimes 172 26%
Quite a Bit 28 15% Often 210 32%
Very Much 17 9% Very Often 248 37%
Total 182 100% Total 666 100%
Response
ISU Faculty (Upper and Lower
Division)
ISU Students (First-Year and Senior
Students)
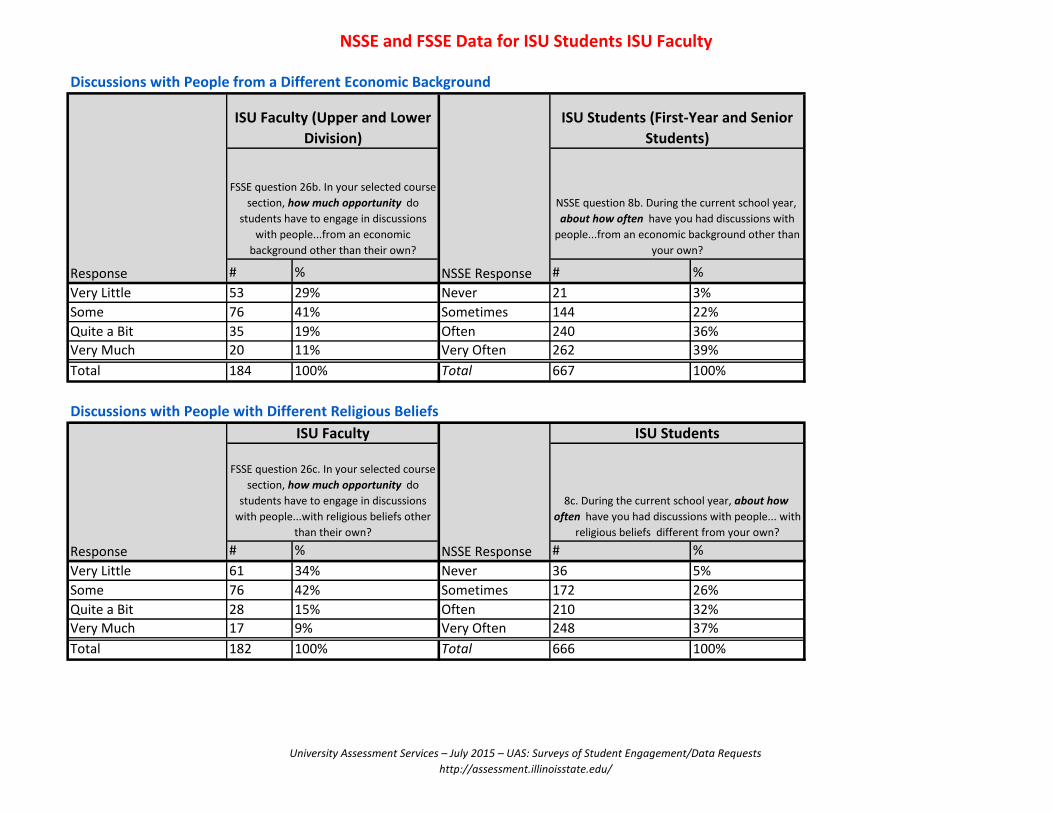
Discussions with People from a Different Economic Background
NSSE Response
NSSE Response
Discussions with People with Different Religious Beliefs
FSSE question 26b. In your selected course
section, how much opportunity do
students have to engage in discussions
with people...from an economic
background other than their own?
NSSE question 8b. During the current school year,
about how often have you had discussions with
people...from an economic background other than
your own?
Response
ISU Faculty ISU Students
FSSE question 26c. In your selected course
section, how much opportunity do
students have to engage in discussions
with people...with religious beliefs other
than their own?
8c. During the current school year, about how
often have you had discussions with people... with
religious beliefs different from your own?
University Assessment Services – July 2015 – UAS: Surveys of Student Engagement/Data Requests
http://assessment.illinoisstate.edu/
NSSE and FSSE Data for ISU Students ISU Faculty
# % # %
Very Little 48 26% Never 30 5%
Some 83 46% Sometimes 157 24%
Quite a Bit 32 18% Often 212 32%
Very Much 19 10% Very Often 262 40%
Total 182 100% Total 661 100%
# % # %
Very Little 70 39% -- -- --
Some 69 38% -- -- --
Quite a Bit 28 15% -- -- --
Very Much 14 8% -- -- --
Total 181 100% -- -- --
NSSE Response
NSSE Response
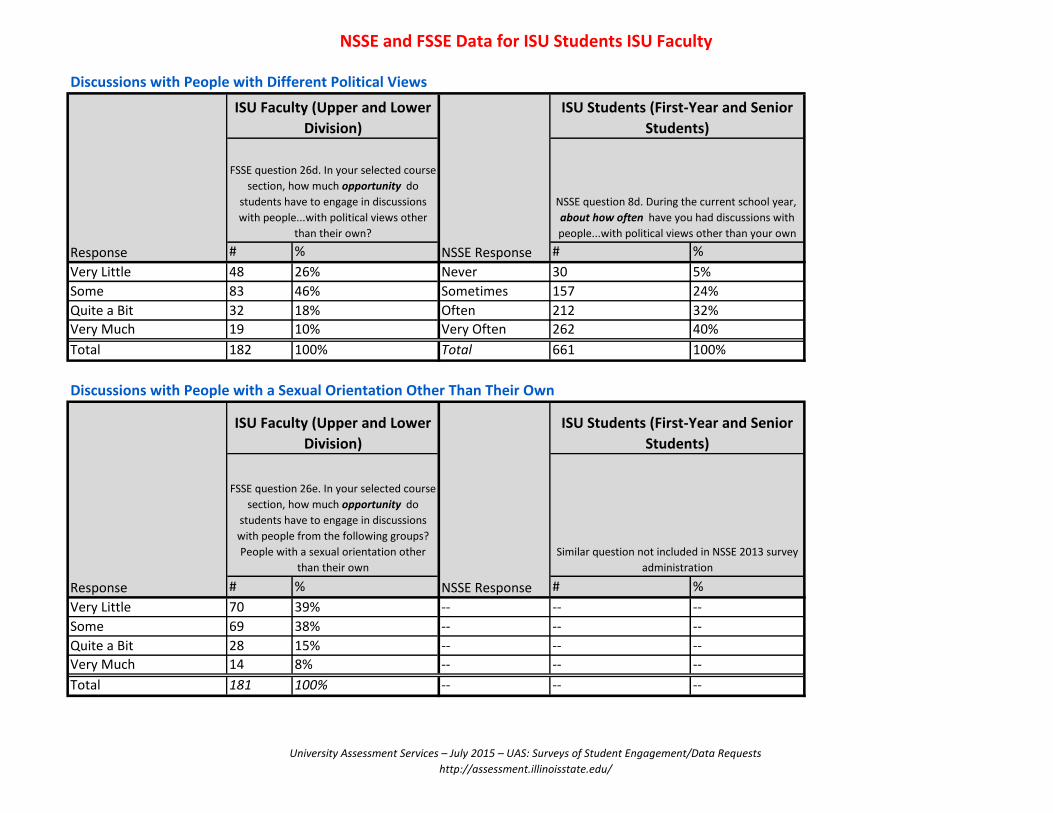
NSSE question 8d. During the current school year,
about how often have you had discussions with
people...with political views other than your own
Discussions with People with Different Political Views
ISU Faculty (Upper and Lower
Division)
ISU Students (First-Year and Senior
Students)
ISU Faculty (Upper and Lower
Division)
ISU Students (First-Year and Senior
Students)
Response
FSSE question 26e. In your selected course
section, how much opportunity do
students have to engage in discussions
with people from the following groups?
People with a sexual orientation other
than their own
Similar question not included in NSSE 2013 survey
administration
Discussions with People with a Sexual Orientation Other Than Their Own
Response
FSSE question 26d. In your selected course
section, how much opportunity do
students have to engage in discussions
with people...with political views other
than their own?
University Assessment Services – July 2015 – UAS: Surveys of Student Engagement/Data Requests
http://assessment.illinoisstate.edu/

NSSE and FSSE Data for ISU Students ISU Faculty
# % # %
Very Little 46 25% Very Little 47 8%
Some 50 27% Some 178 29%
Quite a Bit 36 19% Quite a Bit 202 33%
Very Much 53 29% Very Much 191 31%
Total 185 100% Total 618 100%
Some questions are slightly modified for use as table headers. Original survey questions and instrument available from University Assessment
Servies (UAS) or the NSSE website.
Student first-year and senior, and faculty upper and lower division, responses added together for comparison purposes.
Based on the spring 2013 administration of the NSSE and spring 2014 administration of the FSSE.
NSSE ResponseResponse
FSSE question 29h. To what extent do you
structure your selected course section so
that students learn and develop
(an)…understanding (of) people of other
backgrounds (economic, racial/ethnic,
political, religious, nationality, etc.)?
NSSE question 17h. How much has your experience
at this institution contributed to your knowledge,
skills, and personal development in…understanding
people of other backgrounds (economic,
racial/ethnic, political, religious, nationality, etc.)?
Understanding People of Other Backgrounds
ISU Faculty (Upper and Lower
Division)
ISU Students (First-Year and Senior
Students)
University Assessment Services – July 2015 – UAS: Surveys of Student Engagement/Data Requests
http://assessment.illinoisstate.edu/
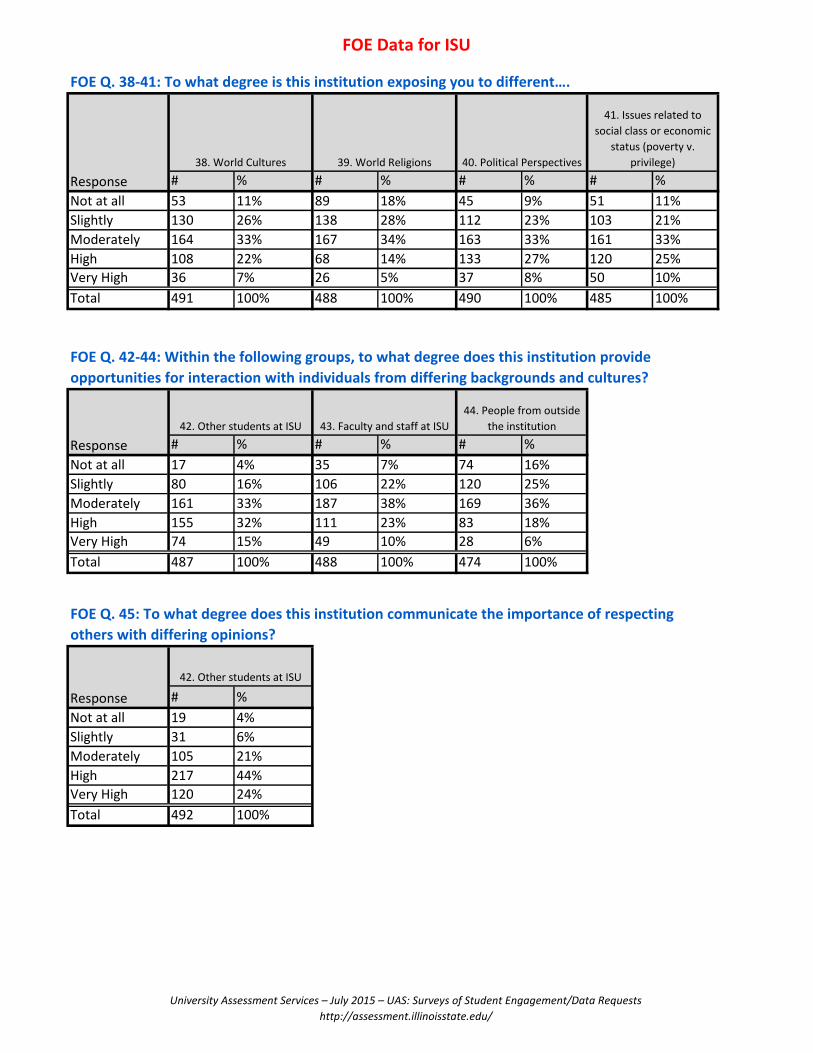
FOE Data for ISU
# % # % # % # %
Not at all 53 11% 89 18% 45 9% 51 11%
Slightly 130 26% 138 28% 112 23% 103 21%
Moderately 164 33% 167 34% 163 33% 161 33%
High 108 22% 68 14% 133 27% 120 25%
Very High 36 7% 26 5% 37 8% 50 10%
Total 491 100% 488 100% 490 100% 485 100%
# % # % # %
Not at all 17 4% 35 7% 74 16%
Slightly 80 16% 106 22% 120 25%
Moderately 161 33% 187 38% 169 36%
High 155 32% 111 23% 83 18%
Very High 74 15% 49 10% 28 6%
Total 487 100% 488 100% 474 100%
# %
Not at all 19 4%
Slightly 31 6%
Moderately 105 21%
High 217 44%
Very High 120 24%
Total 492 100%
FOE Q. 38-41: To what degree is this institution exposing you to different….
41. Issues related to
social class or economic
status (poverty v.
privilege)39. World Religions38. World Cultures
Response
40. Political Perspectives
FOE Q. 45: To what degree does this institution communicate the importance of respecting
others with differing opinions?
FOE Q. 42-44: Within the following groups, to what degree does this institution provide
opportunities for interaction with individuals from differing backgrounds and cultures?
Response
42. Other students at ISU
Response
42. Other students at ISU 43. Faculty and staff at ISU
44. People from outside
the institution
University Assessment Services – July 2015 – UAS: Surveys of Student Engagement/Data Requests
http://assessment.illinoisstate.edu/
FOE Data for ISU
Reported by
Students
Faculty & staff
perceptions
Reported by
Students
Faculty & staff
perceptions
Not at all/Slight 6% 20% 14% 29%
Moderate 34% 33% 34% 38%
High/Very High 61% 47% 53% 33%
Total 100% 100% 100% 100%
Response
Opportunities for diverse
interactions with other
students
Opportuities for diverse
interactions with faculty and
staff
Opportunities for Diverse Interactions (FOE questions 42-43)
University Assessment Services – July 2015 – UAS: Surveys of Student Engagement/Data Requests
http://assessment.illinoisstate.edu/