from surveys to data capture: new data collection ... surveys to data capture_michael lin… ·...
TRANSCRIPT
From Surveys to Data Capture: New Data Collection
Strategies Leveraging Nonprobability Sampling,
Mobile Devices, & Big Data
Michael Link, PhD Division Vice President Data Science, Surveys & Enabling Technologies
OECD Conference Paris, France May 11-12, 2017

Research World Is Rapidly Changing
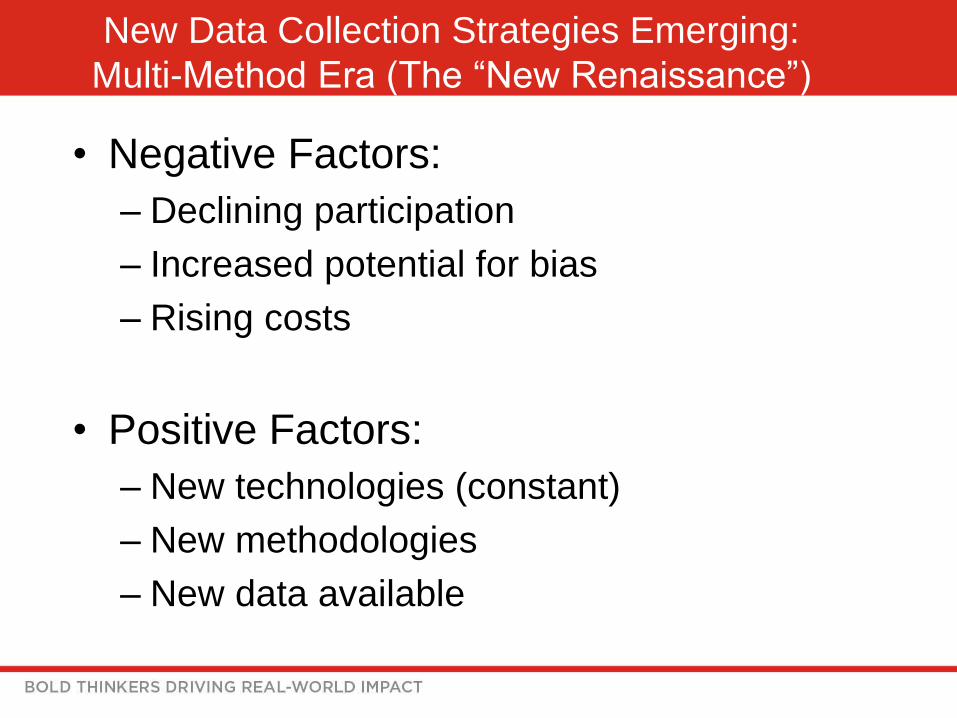
New Data Collection Strategies Emerging:
Multi-Method Era (The “New Renaissance”)
• Negative Factors:
– Declining participation
– Increased potential for bias
– Rising costs
• Positive Factors:
– New technologies (constant)
– New methodologies
– New data available

Major Trends in Data Collection Strategies
• Non-Probability Sampling
• Mobile Data Collection tools
• Data Science & Big Data

Trend 1: Non-Probability Sampling
• Probability Sampling Designs: – Definition: Units (people, households, businesses, etc.) are sampled
with a known probability of selection from a complete (or nearly so) listing of all such units
– Benefits: Permits projection to a broader population with confidence and the ability to estimate the potential for sampling error
– Drawbacks: Increasingly difficult to do in operation and meet basic assumptions (due primarily to non-response); increasing costs
• Non-Probability Sampling Designs: – No shared framework – common element is that the probability of
selection is unknown and estimation of potential bias more difficult
– Typically has the benefits of speed, lower costs, easier implementation
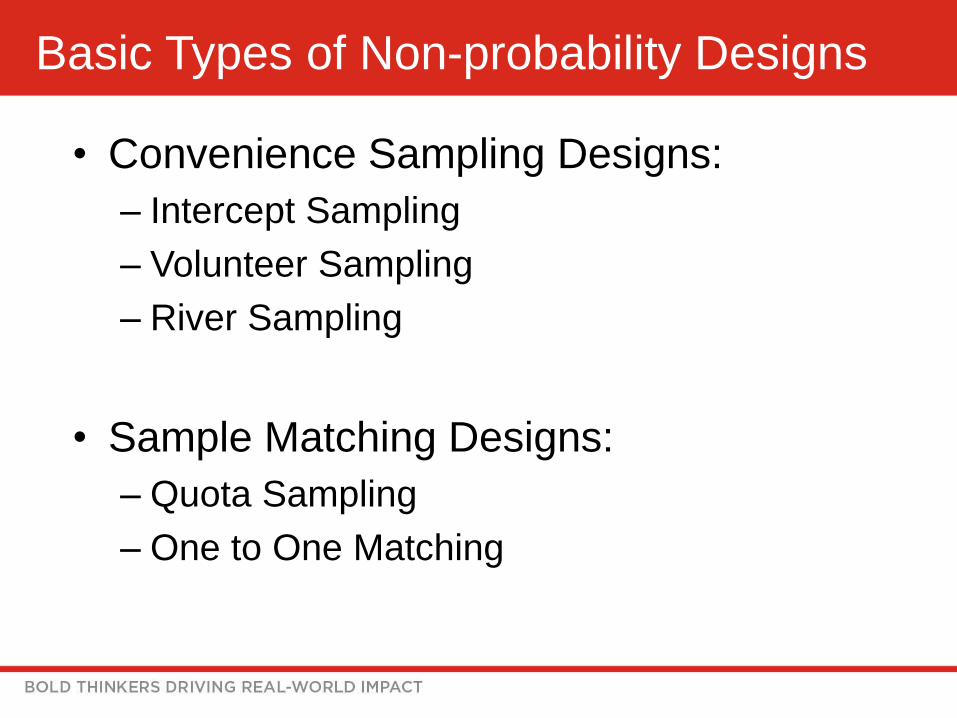
Basic Types of Non-probability Designs
• Convenience Sampling Designs:
– Intercept Sampling
– Volunteer Sampling
– River Sampling
• Sample Matching Designs:
– Quota Sampling
– One to One Matching

Potential Benefits of Non-Probability Sampling
• Lower costs – Lower cost recruitment method and/or
– Leverage same sample members multiple times (panel design)
• Speed of implementation – Quicker into and out of the field
• Often easier logistics – Often online recruitment
– Less rigorous recruitment protocols

Potential Issues with Non-Probability Sampling
• Unclear who is represented
– how well resulting sample represents the larger population of interest;
– Problem often confounded if little is done to adjust the results (assumes method of selecting participants is ignorable)
• Difficult to measure data quality
– No response rate measure
– No margin of sampling error

Approaches for Improving Quality of Non-
Probability Samples
• Before the study: – Sample matching – attempt to select a sample at the outset
which closely matches the target population
• Demographic, attitudinal & behavioral characteristics
• After the study:
– Standard post-stratification adjustments (typically on key demographics)
– More complex adjustment designs tend to reduce bias further – demographics + behavioral / attitudinal characteristics
– Numerous comparisons of techniques: post-stratification vs Raking + Inverse Propensity Weighting etc.
• No clear agreed-upon method
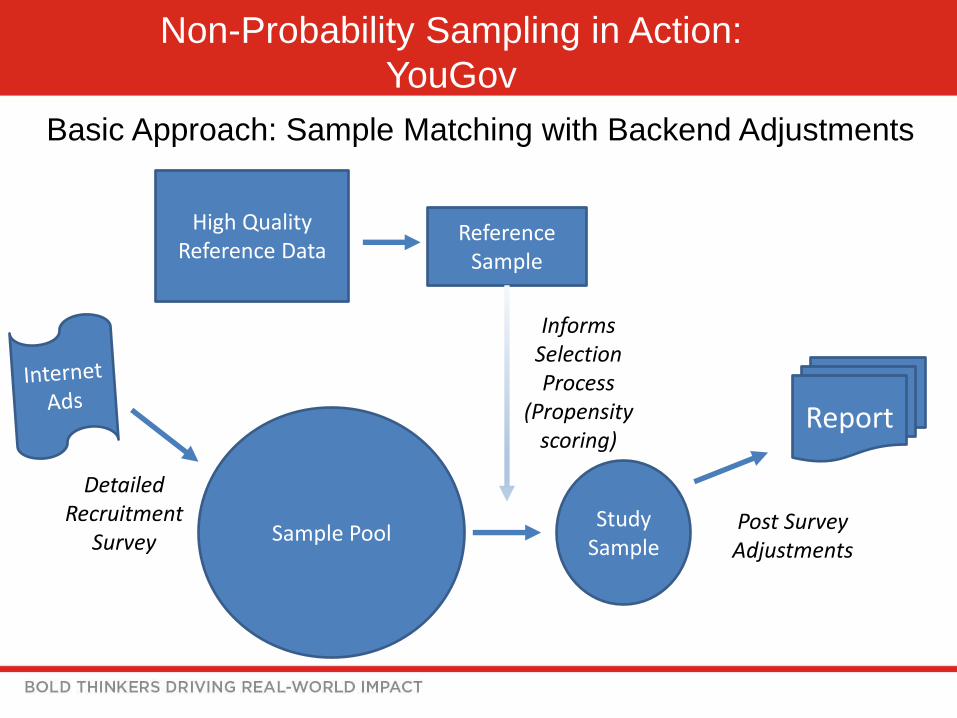
Non-Probability Sampling in Action:
YouGov
Basic Approach: Sample Matching with Backend Adjustments
Sample Pool
Detailed Recruitment
Survey
High Quality Reference Data
Reference Sample
Study Sample
Report
Informs Selection Process
(Propensity scoring)
Post Survey Adjustments

Trend 2: Mobile Data Collection
• Overwhelming majorities of people in 40 countries
surveyed indicated they have a “mobile device” (Pew
Research Center, 2016)
– Smartphone growth in emerging economies: 21% (2013) to 37%
(2015)
• “Mobile devices”: Feature phones vs smartphones vs
tablets vs everything in-between
• Potential multi-method “toolbox” – voice, text, email,
image, video, scanning, Blue-tooth, etc.
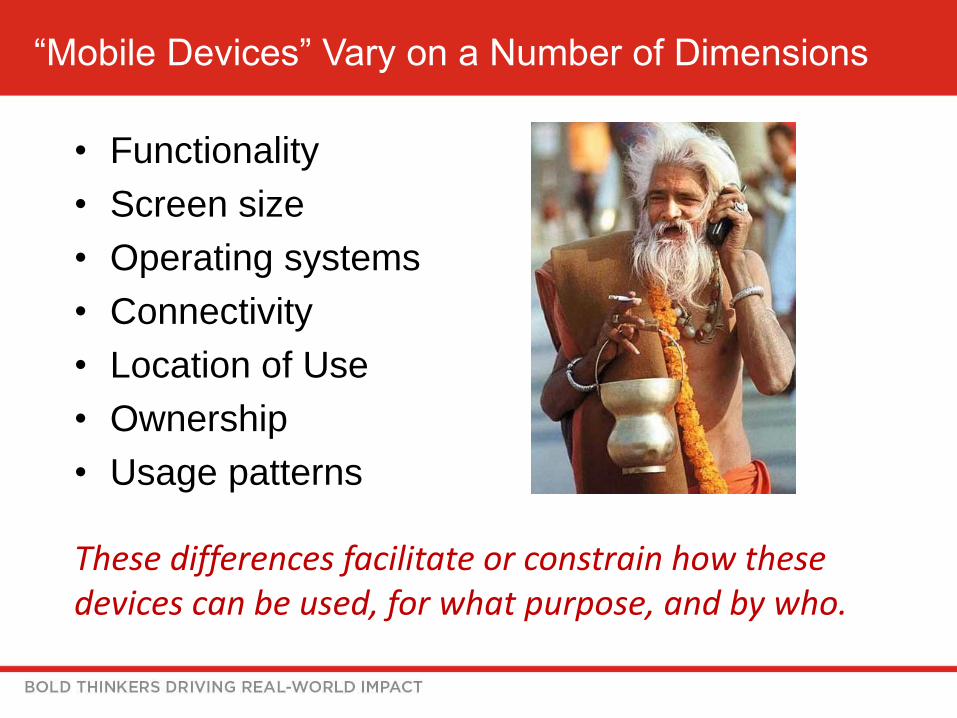
“Mobile Devices” Vary on a Number of Dimensions
• Functionality
• Screen size
• Operating systems
• Connectivity
• Location of Use
• Ownership
• Usage patterns
These differences facilitate or constrain how these devices can be used, for what purpose, and by who.

Key Mobile Designs: Text/SMS
• Texting / Short Message System (SMS)
– Two way communication: participant & researcher
– Survey administration: text or push URL
– “Experience sampling” / In-the-moment data collection
• Benefits:
– SMS is the most widely used mobile service in the world
– People respond on their schedule
• Drawbacks:
– Access to telephone numbers (varies by country)
– Character limits

Key Mobile Designs: Mobile Web Designs
• Web-based surveys completed by participants on their internet-enabled mobile device – By design: push a url to respondent (via text, email, mail, etc.) – participant
initiates & completes the survey on their mobile device
– Not by design: participant completes the survey on their mobile device even though it may have been designed for a larger screen
• Large & growing understanding of how to design mobile web surveys to reduce potential bias – Mobile friendly designs / Mobile optimization
– Mobile First Designs
• Benefits: – People are becoming increasingly comfortable with (and have capacity for) the
use of mobile devices for internet activity
– Allow greater flexibility for response – day / time / place
• Drawbacks: – Even with best designs, surveys can be difficult on smaller screens
– Higher break-offs and typically longer administration times
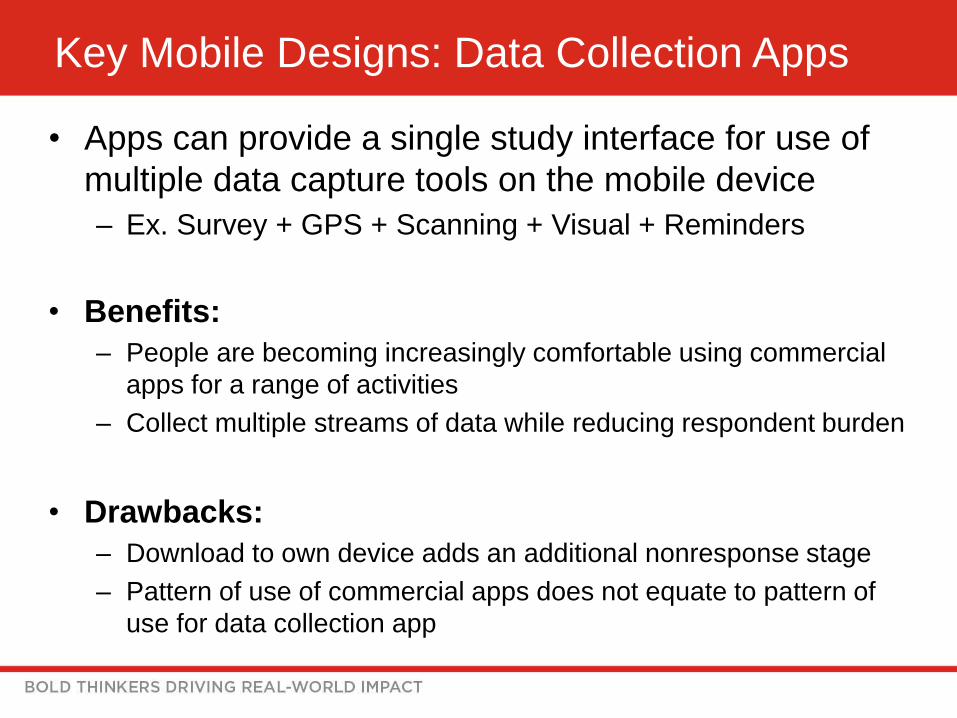
Key Mobile Designs: Data Collection Apps
• Apps can provide a single study interface for use of
multiple data capture tools on the mobile device
– Ex. Survey + GPS + Scanning + Visual + Reminders
• Benefits:
– People are becoming increasingly comfortable using commercial
apps for a range of activities
– Collect multiple streams of data while reducing respondent burden
• Drawbacks:
– Download to own device adds an additional nonresponse stage
– Pattern of use of commercial apps does not equate to pattern of
use for data collection app
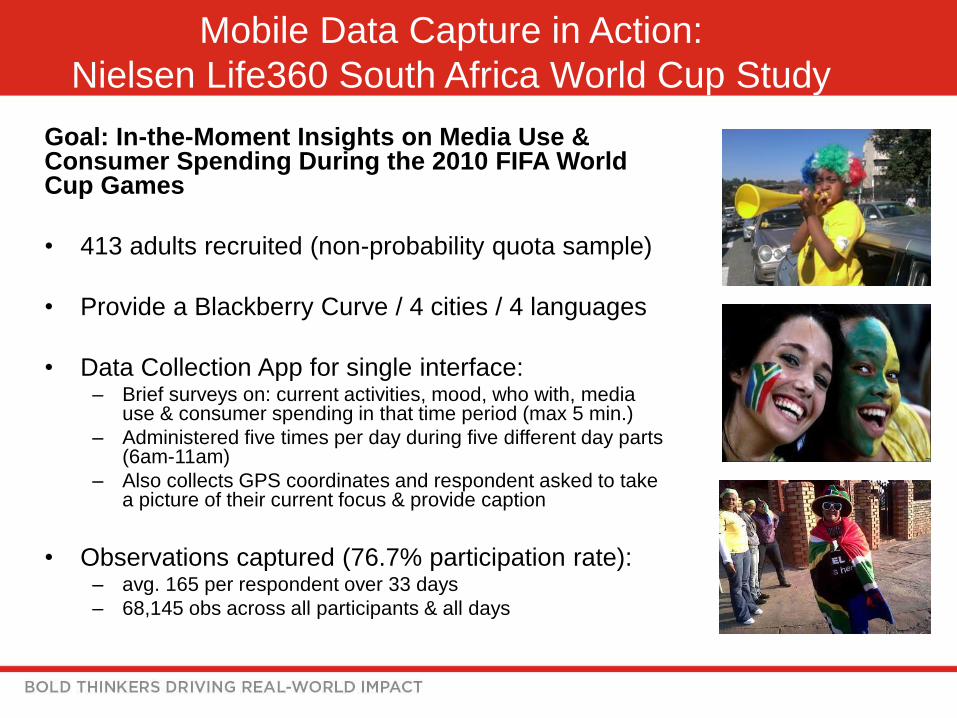
Mobile Data Capture in Action:
Nielsen Life360 South Africa World Cup Study
Goal: In-the-Moment Insights on Media Use & Consumer Spending During the 2010 FIFA World Cup Games
• 413 adults recruited (non-probability quota sample)
• Provide a Blackberry Curve / 4 cities / 4 languages
• Data Collection App for single interface: – Brief surveys on: current activities, mood, who with, media
use & consumer spending in that time period (max 5 min.)
– Administered five times per day during five different day parts (6am-11am)
– Also collects GPS coordinates and respondent asked to take a picture of their current focus & provide caption
• Observations captured (76.7% participation rate): – avg. 165 per respondent over 33 days
– 68,145 obs across all participants & all days

Trend 3: Data Science & Big Data
• Moving beyond primary data collection to leverage information captured for other purposes
• Design data –vs- Organic data (“data exhaust”)
• Big Data, Little Data & Administrative Data
• Made possible by: – Data driven technologies
– Dramatic increase in storage capacity
– Evolution of analytic tools to hand “3 Vs”
• Data Science: combination of computer science, statistics, and subject matter expertise

Types of Organic Data
Structured Data -Administrative
Records
Other Structured
Data
Semi-Structured
Data
Unstructured Data
Definition Data with a fixed format easily exportable to a data set for analysis with minimal scrubbing required
Highly organized data easily placed in a data set but require additional scrubbing or transformation before analysis
Data that may have some structure but not complete and cannot be placed in a relational database; requires substantial cleaning
Data which have no standard analytic structure and must have data extracted and transformed before use
Examples • Govt programs • Commercial
transactions • Credit card /
bank records • Medical records • University /
school records
• E-commerce transactions
• Mobile phone GPS
• Roadside / Weather / pollution sensors
• Computer logs • Text messages • Email • Fitbit / wearable
data • Internet of
Things
• Social media data • Pictures / videos • Traffic webcams • Drone data • Satellite / radar
images
Adopted from: National Academies of Sciences, Engineering, & Medicine. (2017). Innovations in Federal Statistics: Combining Data Sources While Protecting Privacy. Washington, DC: The National Academies Press.

Potential benefits of Big Data
• Less expensive
• Greater accuracy
• “Big data” facilitate smaller area or smaller group analyses
• Data updated in real-time
• Facilitate new insights (ex. a generation communicating in visuals)
• Growing set of data science techniques to help maximize the use of these data

Potential Issues with Big Data
• Big data “hubris”
• Fake data – bots / fake
accounts
• Perpetual dynamic
algorithm
• Limited scope of variable
available
• Access / availability
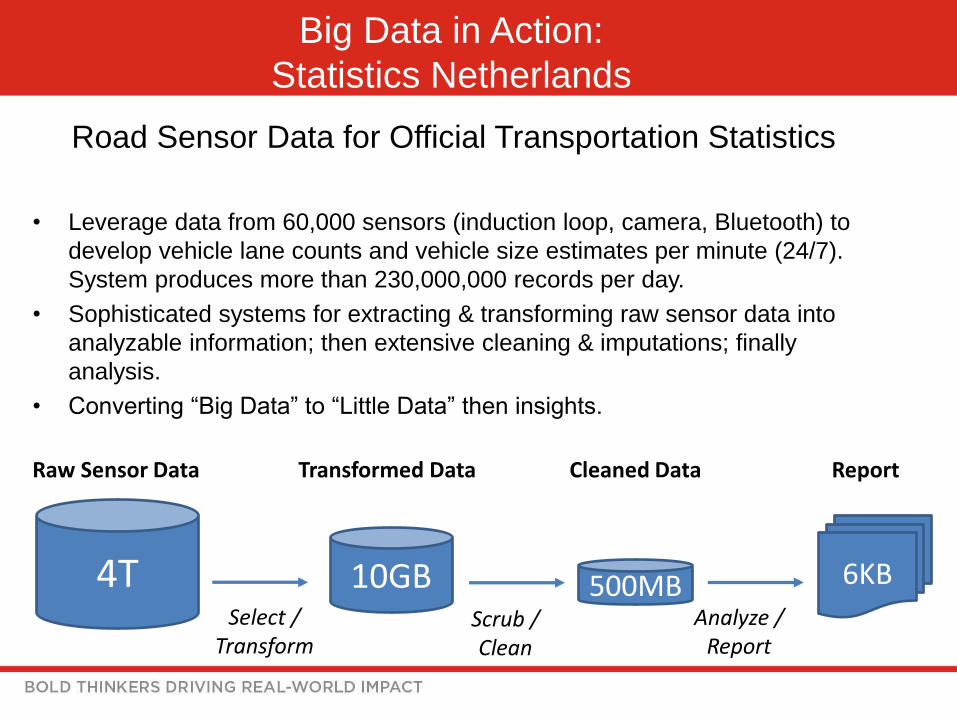
Big Data in Action:
Statistics Netherlands
Road Sensor Data for Official Transportation Statistics
• Leverage data from 60,000 sensors (induction loop, camera, Bluetooth) to
develop vehicle lane counts and vehicle size estimates per minute (24/7).
System produces more than 230,000,000 records per day.
• Sophisticated systems for extracting & transforming raw sensor data into
analyzable information; then extensive cleaning & imputations; finally
analysis.
• Converting “Big Data” to “Little Data” then insights.
4T
Raw Sensor Data
10GB 500MB 6KB
Transformed Data Cleaned Data Report
Select / Transform
Scrub / Clean
Analyze / Report

The Road Ahead
• Research world is changing rapidly … and that is good
– Surveys continue to be the primary method for collecting
detailed, valid data on attitudes & behaviors
– New techniques and approaches may facilitate less expensive,
faster collection and reporting of information
• Will there need to be quality tradeoffs?
• Non-probability sampling, mobile data capture, Big Data
– Each have significant benefits, but substantial limitations or
issues that need to be resolved before maximizing
– Need to educate yourself in each area before use
– Conduct experiments, share findings, help grow the discipline
The new renaissance has begun …
