cambridge, ma 02138 november 1990 assistance and...
TRANSCRIPT

NBER WORKING PAPERS SERIES
THE BUBBLE OF 1929:EVIDENCE FROM CLOSED-END FUNDS
J. Bradford De Long
Andrei Shleifer
Working Paper No. 3523
NATIONAL BUREAU OF ECONOMIC RESEARCH1050 Massachusetts Avenue
Cambridge, MA 02138November 1990
We would like to thank Stefari Erieger for excellent researchassistance and thoughtful discussions. We would also like tothank David Cutler, Lawrence Summers, Robert Vishny, and RobertWaldmann for helpful comments, and the National Science andRussell Sage Foundations for financial support. This paper ispart of NBER's research program in Financial Markets and MonetaryEconomics. Any opinions expressed are those of the authors andnot those of the National Bureau of Economic Research.

NBER Working Paper #3523November 1990
THE BUBBLE OF 1929: EVIDENCE FROM CLOSED—END FUNDS
ABS TRACT
Closed—end mutual funds provide one of the few cases in
which economists can observe "fundamental" values directly, and
compare them to market values: the fundamental value of a
closed—end fund is simply the net asset value of its portfolio.
We use the difference between prices and asset values of closed—
end funds at the end of the 1920s as a measure of investment
sentiment. In the late l920s closed-end funds sold at large
premia: at the peak, they appear willing to pay 60 percent more
for closed—end funds than the post-WWII norm. Such substantial
overpricing of closed—end funds—-where fundamentals are known and
observed——suggests that other assets were selling at prices above
fundamentals as well. The association between movements in the
medium closed—end fund discount and movements in broad stock
price indices leads us to conclude that the stocks making up the
S & P composite were priced at least 30 percent above
fundamentals in the summer of 1929.
J. Bradford De Long Andrei ShleiferDepartment of Economics Graduate School ofLittauer Center 6-20 BusinessHarvard University Columbia UniversityCambridge, MA 02138 Unis Hall, Room 604
New York, NY 10027

Closed-End Funds 1 Dc Long and Shleifer
I. Introduction
The sharp rise and subsequent crash of stock prices in 1929 is perhaps the most striking episode iii the
history of American financial markets. The nominal S & P composite index rose sixty-four percent from
January 1928 to September 1929, fell thirty-three percent from September 1929 to December 1929, recovered
about halfway tO its 1929 peak, and then fell again to a low point in the summer of 1932 sixty-six percent
below its December 1929 level and seventy-seven percent below its September 1929 average (sec figure 1).
3000
S&P 500Nominal 2000
Index(1941—43=
1000)
1000
Some observers have interpreted this price pattern as reflecting changing fundamentals in the economy.
Irving Fisher (1930), for example, argued throughout 1929 and 1930 that the high level of prices in 1929
reflected an expectation that future corporate cash flows would be very high. Fisher saw this expectation as
warranted after a decade of steadily increasing earnings and dividends, rapidly improving technologies, and
monetary stability. According to this interpretation of 1929, the runup of stock prices before the crash
reflected shifts in expectations of the future that were cx post faulty but cx ante rational. The crash and the
subsequent slide of stock prices then reflected a rational, and in this case an cx post correct, revision of beliefs
as investors recognized the approach of the Great l)epression and the end of the Roaring Twenties.
Other students of the Great Crash, notably Galbraith (1954), have argued that even though
Figure 1S&P Composite Nominal Stock Price Index
1928—32
1928 1929 1930 1931 1932

Closed-End Funds Do Long and Shleifer
fundamentals appeared high in 1929, the stock market rise was clearly excessive. Gaibraith citesmargin
buying, the formation of closed-end investment trusts, the transformation of financiers into celebrities, and
other qualitative signs of euphoria to support his view. Over the past three decades, Galbraith's position has
lost ground with economists, and especially financial economists, as the efficient markethypothesis has
gained.
Much of recent work sides with Fisher's interpretation of 1929. Sirkin (1975), for example, examines
the revisions of long-run growth forecasts required for shifts in stock yields in 1929 to reflect shifts in
perceived fundamental values. lIe finds that compared to actual post-World War II yields and stock returns
the implied growth rates of dividends are quite conservative, and in fact lower than post-World War II growth
rates. Santoni and Dwyer (1990) fail to find evidence of a bubble in stock prices in 1929. White (1990a and
1990b) saw "qualitative evidence.. .[that] favors the view that a bubble was present," but cautioned that
"[t]hc failure of dividends to keep pace with stock prices does not.. .necessarily imply the existence ofa
bubble," and thought it unlikely at the time of his writing that convincing quantitative estimates of
overvaluation can be made.1
Along similar lines, Barsky and De Long (1989, 1990) argued that if the long run growth rate of
dividends is unstable then large swings in stock prices, such as those of the 1920's and 1930's, will bethe rule
rather than the exception. In Barsky and Dc Long's model, investorsupdate their beliefs about the long-run
growth rate of dividends in response to changes in current dividends; hence warranted valuations can change
dramatically in response to small changes in dividends. They find that stock pricesappear, if anything, less
sensitive to changes in current real dividends in the late 1920's and theearly 1930's than in the remainder of
the twentieth century.
In this paper we present evidence that a substantial component of the rise in stock prices up to and fall
of stock prices away from September of 1929 was in fact excessive, and not based on rational revisions of
warranted valuations. Our evidence is based on an analysis of the prices, discounts from net asset values, and
new issue volumes of closed-end mutual funds during and after 1929. We estimate thatat the peak the stock
index was more than one-third above its fundamental value. Using a different souce of information—the
interest rates charged on brokers' loans—Rappoport and White (1990) have produced a similar estimate: they
'White saw this lack of quantitative estimates of the 1929 bubble as a serious deficiency, and he and Rappoport haveexplored the possibility of using information from the brokers' loan market to estimate the bubble (Rappopori and White,1990).

Closed-End Funds De Long and Shleifer
estimate under the assumption that lenders were risk neutral that at the market's peak those banks making
brokers' loans thought the market overvalued by one-half.
In earlier work, De Long, Shleifer, Summers, and Waldmann (1990) and Lee, Shleifer and Thaler
(1989) have focused on closed-end funds as a measure of the sentiment of individual investors. Closed-end
funds do not give investors direct claims on the assets of the fund. Investors desiring to liquidate cannot
return their shares to the fund and trigger a partial liquidation of its portfolio, but must instead sell their shares
to other investors. Because a closed-end fund is a company that has shares of other companies, one can
measure its fundamental exactly: it is the market value of the securities it holds—the net asset value.
It is well-known that closed-end funds sell for prices that often differ from net asset values. In fact, in
the post-World War II period funds have tended to sell at discounts from their net asset values. De Long et
a!. present a theory of the pricing of closed-end funds in which the discount on these funds is a measure of an
irrational investor sentiment factor. Lee et a!. present sonic evidence consistent with this theory.
In this paper, we begin with the conclusion of this earlier work that discounts on closed end funds are a
measure of the sentiment of individual investors toward stocks, and we investigate whether stock prices in
1929 were excessive. We estimate that about a fifth of the runup in stock prices from 1927 to 1929 and about
half of the fall in stock prices from 1929 to 1931 were due to shifis in irrational investor sentiment and not to
rational revisions of estimates of fundamental values.
Our conclusion is based on three pieces of evidence. First, the median closed-end fund premium in the
third quarter of 1929 was about 50 percent. Such high premia on average have not since been achieved in the
United States. Second, new closed-end fund issues in the third quarter of 1929 reached their highest level
ever, and according to the Commercial and Financial Chronicle amounted to a billion dollars in the two
months of August and September of 1929. In the theory of Dc Long ci a!. (1990) both high premia and large
volumes of new closed-end fund issues are evidence of excessive investor optimism. l'his amount is
equivalent in purchasing power to perhaps nine billion of today's dollars, and bore the same proportion to the
U.S. economy then that 55 billion dollars would hear today.
Our third piece of evidence uses the observation of Lee et a!. that cosed-end fund premia reflect the
sentiment of individual investors. In the 1920's institutional investors barely existed, and individual investors
dominated the holding and trading of all stocks. Individual investor sentiment should then have affected both
closed-end fund prmia and stock prices. In fact, during this period, changes in the median discount on closed-

Closed-End Funds 4 Dc Long and Shicifer
end funds are strongly correlated with changes in stock prices.
We take this evidence further by constructing an alternative measure of investor sentiment equal to the
difference between the S&P stock index and an estimate of fundanientals due to Barsky and Dc Long (1990).
Barsky and Dc Long's assumptions about fundamentals arc designed to make fundamentals volatile, and so
provide a fundamentals-based accounting for the large bull and bear swings in stock prices in the twentieth
century. Their framework provides for a larger increase in warranted fundamental values in 1929 than any
other available rational model of the stock market. Yet their measure is not a perfect fit, and substantial
deviations of actual prices from the Barsky and Dc Long warranted values remained. These deviations are
closely correlated with the average premium or discount on closed-end funds. The measure of sentiment from
closed-end funds is not only correlated with stock prices but closely parallels the independently constructed
measure of sentiment from Barsky and Delorig (1990). This evidence corroborates the interpretation of 1929
stock prices as reflecting in part excessive investor optimism.
The next section briefly reviews earlier work that uses closed-end fund discounts as a measure of
investor sentiment. The third section presents our evidence on closed-end fund discounts, The fourth section
analyzes the correlation between the median closed-end fund discount and stock prices relative to
"fundamentals." The fifth section briefly addresses the question of whether the bubble of 1929 had effects on
the real economy. Section six concludes.
II. Discounts on Closed End Funds as a Measure of Investor Sentiment.
The closed-end fund anomaly refers to the empirical finding that closed-end mutual funds often trade at
prices substantially different from their net asset values—the value of the securities they hold (Malkiel, 1987).
When they are issued, closed-end funds typically sell at premia to net asset value. Without suchpremia,
funds could not be organized without a loss to the organizers. But after issue fund shareprices typically move
to a discount to ncL asset value. The discounts to net asset values fluctuate over time, and changes in
discounts are strongly correlated across funds. Occasionally discounts turn intopremia. By and large, funds
in the post-World War It period have sold at less than the market value of theirholdings, with the median
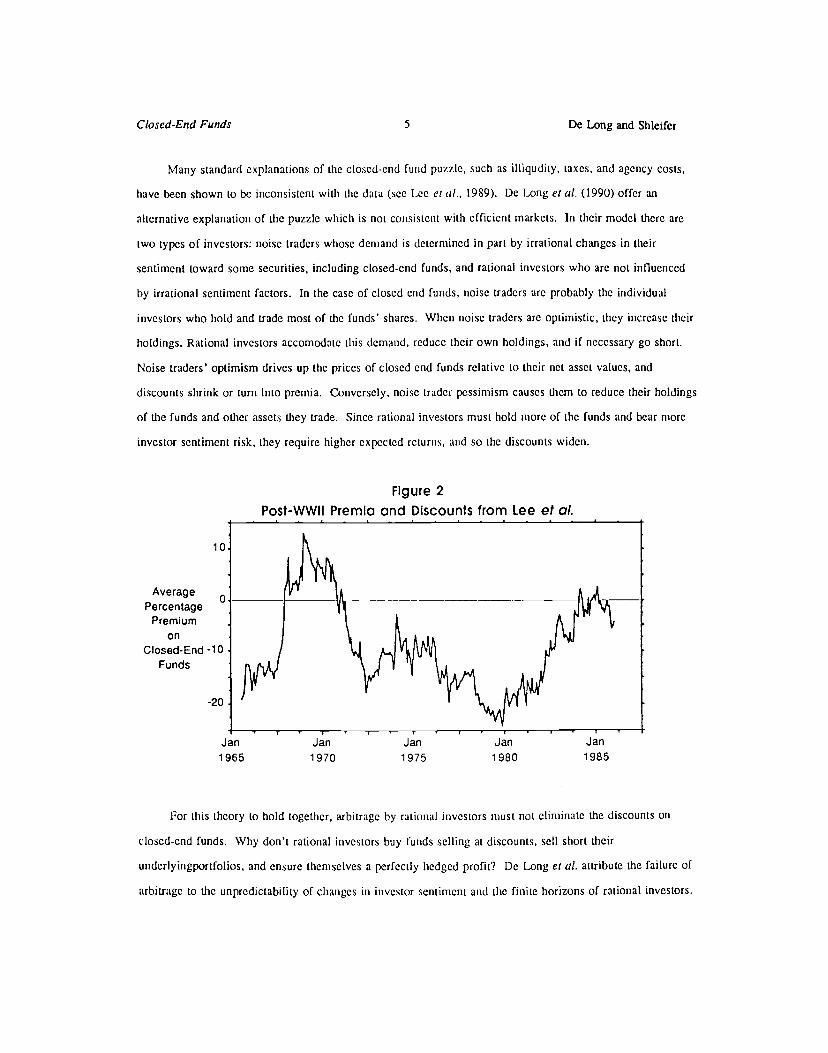
fund fluctuating between a premium of five and a discount of twenty-five percent (see Lee et al., 1989).
Figure 2, using data from Lee ci a!., plots post-WWII premia and discounts for closed-end funds.
Closed-End Funds 5 De Long and Shleifer
Many standard explanations of the closed-end fund puzzle, such as illiqudity, taxes, and agency costs,
have been shown to be inconsistent with the data (see Lee et a!., 1989). De Long et a!. (1990) offer an
alternative explanation of the puzzle which is not consistent with efficient markets. In their model there are
two types of investors: noise traders whose demand is determined in part by irrational changes in their
sentiment toward some securities, including closed-end funds, and rational investors who are not influenced
by irrational sentiment factors. In the case of closed cnd funds, noise traders arc probably thc individual
investors who hold and trade most of the funds' shares. When noise traders are optimistic, they increase their
holdings. Rational investors accomodatc this demand, reduce their own holdings, and if necessary go short.
Noise traders' optimism drives up the prices of closed end funds relative to their net asset values, and
discounts shrink or turn into premia. Conversely, noise trader pessimism causes them to reduce their holdings
of the funds and other assets they trade. Since rational investors must hold more of the funds and bear more
investor sentiment risk, they require higher expected returns, and so the discounts widen.
AveragePercentage
PremiumOn
Closed-End -10Funds
-20
Jan1965
For this theory to hold together, arbitrage by rational investors must not eliminate the discounts on
closed-end funds. Why don't rational investors buy funds selling at discounts, sell short their
undcrlyingportfolios, and ensure themselves a perfectly hedged profit? Dc Long cia!. attribute the failure of
arbitrage to the unpredictability of changes in investor sentiment and the finite horizons of rational investors.
Figure 2
Jan Jan Jan Jan1970 1975 1980 1985

Closed-End Funds 6 Dc Long and Shleifer
An investor who buys a fund and shorts its portfolio runs the risk that at the time he liquidates his position
sentiment about funds will have turned more negative, and so his attempted arbitrage trade will result in a
loss. This risk from changes in investor sentiment keeps rational investors from trading to eliminate the
discounts. However, it deters arbitrage only if it affects the prices of a large number of securities, and so
cannot be hedged. Investor sentiment risk must therefore be systematic for the theory to hold. And if it is, it
will be priced in equilibrium.
'l1c implications of this theory of closed-end fund discounts have been examined by Lee ci a!. First,
investor sentiment imposes an additional source of risk on holdings of closed-end funds that investors must be
compensated for bearing. In other words, closed-end funds must on average sell at a discount to their net
asset values, which is indeed the case. Second, for the investor sentiment factor to be priced it must affect all
closed-end funds, and so discounts on funds must fluctuate together. Lee ci a!. have documented this for U.S.
funds since 1960. Third, the theory predicts that new closed-end funds will be started when noise tradersare
excessively bullish about some set of assets including the funds, and so are willing to buy bundles of assets at
a premium over net asset value. Rational investors start closed-end funds when they can selloverpriced
bundles of assets to people who overvalue them. Lee ci a!. find thatnew funds do start (at a premium of
course) when seasoned funds sell at premia or at discounts that are small by historical standards.
The final, and perhaps the least obvious, prediction of the theory is that there must be securities other
than closed-end funds which are affected by the same systematic investor sentiment factor. If this were not
the case, investor sentiment would be an idiosyncratic factoraffecting demand for closed-end funds only, and
would not be priced in equilibrium. Lee ci a!. show that changes in discounts are correlated with returns on
smaller stocks, which happen to be a class of securities held largely by individuals. This suggests that since
World War II fluctuations in closed-end fund discounts, and the existence of theaverage discount, may be
driven by the individual investor-sentiment factor that affects thepost-World War II pricing of smaller stocks.
The consistency of the data with the theory suggests that the average discount on closed-end funds can
be a useful measure of investor sentiment. We thereforeuse this measure to assess the role of investor
sentiment as opposed to fundamental news in the booni of 1929.
Ill. Evidence
This section presents evidence on the behavior of closed-end funds around 1929. We first examine the

Closed-End Funds 7 De Long and Shleifcr
evolution of the discounts and premia on closed-end funds during the late 1920s and the early 1930s. Next,
we outline the pattern of new issues of closed-end funds over this period.
Sources of Data on Closed-End Fund Discounts
In the post-World War II period, data on the net asset values—and thus on the premia or discounts—of
closed-end fund shares are printed weekly in the financial press. However, until the middle of 1930 there is
no systematic reporting of the net asset values of closed-end funds. During the 1920's, closed-end fund
promoters argued that a closed-end fund has tangible assets—its porlfolio—and intangible assets—the skills
of its professional management. If a fund revealed its portfolio, they argued, its managers would be unable to
earn a fair return on their expertise: investors would simply trade to copy the fund's portfolio and so avoid
paying the management fee. Because closed-end fund promoters in the 1920's looked on a fund's portfolio as
a trade secret, portfolios were rarely published and net asset values rarely calculated (see Becker, 1930).
After October 1929 closed-end funds hastened to publish their portfolios as soon as fund share prices
fell below net asset values to convince investors that the fund was still solvent after the crash. Data on
closed-end fund discounts from the fourth quarter of 1929 on are, therefore, often available. We rely on
Barron's, the Conjinercial and Financial Chronicle, Commerce and Finance, and Keane's Investment Trust
Monthly Magazine for calculated discounts and premia on closed-end funds after the end of 1929.
In the third quarter of 1929, three types of events seem to trigger a closed-end fund's publication of its
portfolio or the current net asset value of its shares. The first is listing on the New York Stock Exchange.
From the summer of 1929 on, the Exchange is willing to add closed-end funds to its listings, or to continue to
list funds, only if they make their portfolios public (NYSE, 1929). We have taken our sample of funds
revealing their net asset values because of NYSE listings from the Commercialand Financial Chronicle, and
contemporaneous security price observations from the New York Times.
The second is the starting-up of a new closed-end fund. Its net asset value is simply the initial capital
stock subscribed because the firm has had no chance to make trading or investment profits; the discount or
premium can then be inferred from the share price. Lee etal. have demonstrated that premia on newly issued
funds are substantially correlated with premia on seasoned funds after 1960. Our sample of new funds and
their prices is from the Commercialand Financial Chronicle.
The third type of event is when a closed-end fund's shares go to a discount from net asset value. This

Closed-End Funds 8 De Long and Shleifer
often triggers publication of the fund's portfolio to convince investors that thc fund is underpriced and to try
to boost the stock price. When other closed-end funds' managements had positive values on the stock market,
it seemed unreasonable to fund managers that their funds should sell at a discount. We think, therefore, that
funds that publish their portfolios before October of 1929 do not reflect the average premium or discount,
such funds are drawn from the lower tail of the distribution. We have one such fund in our sample. The
American-European Securities Fund published its portfolio in Deceniber of 1928 and December of 1929. We
have traced the net asset value of the December 1928 portfolio forward, and the value of the December 1929
portfolio back. The two portfolios have similar net asset values, and we use a weighted average to construct
monthly premia and discounts for American European Securities during 1929,
We have also found retrospective data from various sources on closed-end fund discount and premia
before 1929. Post-1929 publication of net asset value data was sometimes combined with publication of pre-
1929 net asset value data as well. These observations are also included in our data base.
The Evolution of Discounts: Quantitative Evidence
Figures 3a through 3c present our observations on discounts and premia on closed-end funds. Funds
selling for premia of more than 175 percent above net asset value are omitted. There are thirteen such in our
sample—six of them during 1929, and seven during 1932 and 1933. These premia occur because highly-
leveraged funds with large debt liabilities find the value of their portfolios shrinking to the face value of their
obligations. In such a case, high premia exist because the common stock—of zero immediate liquidation
value—retains an option value. Similarly, we omit twenty-six observations of funds with common stock that
have negative net asset values during 1932 and 1933. The appendix presents the funds, asset values, premia
or discount, and sources for our observations before the beginning of 1930, after which the number of data
points becomes much larger.
Figure 3a presents the premia on seasoned funds for which we could obtain data, excluding American
European Securities, which is treated separately below. We use the median premium to measure the central
tendency of the premia because it is insensitive to the very large outlier premia in the upper tail of the
distribution. In the first quarter of 1929, the median seasoned fund sells at a premium of 37 percent. In the
third quarter of 1929, this premium rises to 47 percent. However, by December 1929 a substantial majority of

Closed-End Funds 9
Figure 3a
Dc Long and Shcifer
Figure 3bPremia and Discounts on American European Securities
:°
Jan JUly Jn1929 1929 1930
Figure 3cPremia on New Issues
x80
40 K
0 •
x
Premia and Discounts on Seasoned Funds
1928 1929 1930 1931 1932 1933
Premiumor
Discount
Discountor
Premiumon
AmericanEuropeanSecurities
Premiumon
New Issues
Jan 1929 July 1929 Jan 1930

Closed-End Funds 1 0 Dc Long and Shlcifer
seasoned funds sell at discounts, with the median discount at 8 percent.
Throughout the early 1930's the median seasoned closed-end fund sells at a substantial discount. After
1930, shifts in the average closed-end fund discount are roughly in phase with shifts in the stock market.
Periods during the 1930—1933 slide which see stock prices decline most steeply tend to also see a widening of
closed-end fund discounts; by contrast, periods that see stock prices falling onlyslowly or steady tend to see a
narrowing of discounts. Although there is considerable cross-sectional variation in discounts, figure 3a makes
it clear that discounts on different funds move together, as the theory of investor sentimentpredicts and as the
post-1960 data show.
Sluggish Reporting
The evidence on median premia suggests very large preinia in the third quarter of 1929, indicating
excessive investor optimism. There may be several problems with these data. First, seasoned funds might be
entering our sample because their premia are unusually large, and for this reason are reported in the sources
we use. Second, a similar pattern to our findings could be accounted for by sluggish adjustment of reported
net asset values. During a sharp market risc the measured premium will rise if thereported net asset value
does not increase while the price does.
Some additional evidence can be brought to bear on these objections. American European Securities is
a fund that is likely to have smaller premia than the median, because it published its portfolio in 1928 and
1929 at least in part to call attention to its management's view that it was undervalued in the market. Figure
3b presents the premia on this fund. At the beginning of 1929, the American European Securities Fund sells
at a discount of more than 20 percent, even when there is no evidence that other funds sell at discounts. By
the third quarter of 1929, American European Securities sellsat a premium of 20 percent; while this is not as
high as the median premitim, it is large both by the standards ofAmerican European Securities' previous
price relative to net asset value and by the standard of post-WWH experience. This premium has turned back
into a discount by the end of 1929. The fact that a fund with premia small relative to those of other funds
nevertheless sells at a premium of 20 percent in the third quarter of 1929 is strong evidence that large premia
were the rule, not the exception.
Our interpretation of procyclical closed-end fundpremia is that investors overreact to good news, and
therefore periods of high fundamentals are also periods of excessive optimism. This optimism is reflected, in

Closed-End Fwzds II Dc Long and Shleifer
particular, in high premia on closed-end funds. In principle, our empirical finding could also result from
sluggish adjustment of printed net asset values to the true current market prices. If net asset values fail to
move when the market moves, premia will widen precisely when the market rises, producing our finding.
With respect to this sluggish reporting objection, four points should be noted. First, Lee eta!. fail to
find evidence of sluggish adjustment of net asset values in post-1960 data. Second, the calculated premia and
discounts on American European Securities are made from their reported holdings on specific dates, and thus
are not sluggish. Third, for the premia we observe to be spurious, net asset values must fail to adjust at all in
spite of large market movements—they must be very stale, and not just sluggish.
Fourth and most important, figure 3c shows evidence of large premia on newly-issued closed-end funds
at the Lime their trading prices are first quotcd. The first quote usually occurs within a day or Lwo of issue. In
the summer of 1929 the median newly-issued fund sells at a premium of 25 percent. In the winter of 1929—
1930 no new fund issues are to be found. Evidence on newly issued funds should be viewed in conjunction
with the other evidence, since by itself it might be misleading. Newly issued funds might be dressed up for
new investors, and so their premia might overstate the typical premium. Alternatively, new funds might be
quoted at prices available to "insiders" only and so their premia might understate the typical premium.
Taken together, the evidence on seasoned funds, American European Securities, and newly-issued
funds all point to large premia in the third quarter of 1929. We interpret these premia as evidence of investor
overoptimism. The change from a 47 percent premium in the summer of 1929 to a 25 percent discount in the
summer of 1930 imposed a negative 72 percent return to holders of seasoned closed-end funds for the year,
over and above the 12 percent or so real negative return from July 1929 to July 1930 experienced by the fund
fundamental values as a result of the stock market crash. The relative fall in the value of closed-end funds in
1929—30 was thus much larger than the relative fall in the value of stocks of operating companies.
The Evolution of Discounts: Qualitative Evidence
The quantitative evidence on discounts before the crash of 1929 is backed up by less formal, qualitative
evidence as well. The most significant further evidence that premia must have been large in the third quarter
of 1929 is the massive issue of new funds during this period which we document below. But there is other
evidence as well. The Magazine of Wall Street, for example, recommends the following guidelines for
selecting closed end funds on September 21, 1929:

Closed-End Funds 12 Dc Long and Shleifer
Shares of an investment company capitalized with common stock only and earning10 percent net on invested capital might be fairly priced at 40 percent to 50 percent inexcess of share liquidating value. If the past record of management indicates that itcan average 20 percent or more on its funds, a price of 150 percent to 200 percentabove liquidating value might be reasonable.... To evaluate an investment trustcommon stock, preceded by bonds or preferred stock, a simple rule is to add 30percent to 100 percent, or more, depending upon one's estimate of the management'sworth, to the liquidating value of the investment company's total assets.
ibis recommendation, made only a month before the Great Crash, assumes as a matter of course that funds
should be selling at large premia; managers' ability to pick stocks is thought to multiply the value of the fund
by a factor ranging from 3/2 to 3. Moreover, investors are advised to chase the trend, to load up on funds
whose assets in the past have shown good performance on the theory that their managers are the best.
Such blithe assumption that the intangible skill of a fund's management should lead investors to value it
as worth far more than its net assets could only be sustained if closed-end funds were typically selling at high
premia over net asset values. The paragraph quoted above would seem eccentric in the post-World War H
period when funds have typically sold at discounts. Academics and analysts who recommend closed-end
funds in the post-World War II period stress how the existing discount gives purchasers greater fundamental
returns for an equal initial investment; they do not stress the trading skill of the fund's managers or argue that
it "ought" to sell for half again its net asset value (Malkiel, 1987).
Investment analysts trying to direct investors away from closed-end mutual funds also wrote as if such
funds sold at far above net asset value in the third quarter of 1929 and earlier. McNeel's Financial Service in
Boston, for example, ran a series of large advertisements in 1929 issues of Commerce andFinance, asking (in
bold type), "Are Your Paying $800 for General Electric When You Buy Investment Trusts?" These
advertisements noted that investment trust stocks are "iii many instances selling for two or three times.. .asset
value. They are issued to the public and almost immediately quoted double or treble the issue price." They
asked whether it really made sense for investors to be "paying double or treble the current prices for high
grade securities."
In early 1930 Charles Keane, who had for several years been compiling information sent to him by
individual closed-end funds into his Keane's Manual of Investment Trusts, shifted to publishing Keane's
Investment Trust Monthly. This magazine was written by and formanagers in and promoters of mutual funds,

Closed-End Funds 13 De Long and Shleifer
predominantly the closed-end funds that then had the largest market share. Pre-crash editions of Keane's
Manual of investment Trusts, and pre-crash "Investment Trust" columns in Wall Street newspapers give much
space to funds selling at premia from net asset values. Periodicals might bias their reporting toward the more
spectacular funds selling at unusually high premia, but there is internal evidence in Keane's investment Trust
Monthly that the emergence of discounts on the majority of funds after October 1929 was a new development.
The writings in Keane's Investment Trust Monthly from early 1930 on show repeated surprise and
puzzlement at the fact that closed-end funds are selling at discounts from net asset values. A range of
commentators in Keane's, just like the ones in the Magazine of Wall Street, argue that a closed-end fund has
tangible assets—the stocks and bonds in its portfolio—and intangible assets—the skills of its managers at
picking stocks. Its tangible assets are worth their current market values: its intangible assets have a value as
well. They conclude that closed-end funds should always sell at a premium to their net asset values and leave
no doubt that they view discounts on these funds as a new as well as puzzling phenomenon.
Keane himself writes (May 20, 1930) that there are three reasons for a closed-end fund to sell at a
discount from its net asset value: management incompetence, management corruption, or a fear that the fund
has undertaken unfavorable speculations. At the beginning of 1930 managers and analysts writing from the
Investment Trust Magazine advance the hypothesis that discounts on closed-end funds have emerged because
investors fear that funds were highly committed and leveraged during the crash, and begin to advocate
publication of portfolios—even though this will, they say, allow for free-riding on managerial expertise—to
reassure investors. Indeed, funds begin to publicize their holdings in mid-1930 with the express intent of
reassuring investors that they still had tangible assets after the crash, and so strengthen demand for their stock.
In sum, the evidence leaves no doubt that closed end funds sold at very large premia to net asset value
in the third quarter of 1929. In the model of Dc Long et al., this is evidence of fundamentally unjustified
noise trader optimism of a large magnitude. The implication is that other securities were also selling for more
than their fundamental values. Even though the rational estimation of fundamentals was extremely high in
the fall of 1929, the pattern of closed-end fund premia suggests that stock market values were even higher
than those estimates.
New Issues of Closed-End Funds
Closed-end funds can only be issued at a premium to net asset value. The assets of the fund must be

Closed-End Funds 14 De Long and Shleifer
bought with the proceeds of the sale. And there must be enough left over to induce promoters to set up the
fund. According to De Long et al's theory, closed-end funds will be issued when investors are excessively
bullish as entrepreneurs attempt to profit from this excess bullishness by repackaging stocks into funds.
Goldman Sachs partner Sydney Weinberg was asked why his company had formed so many closed-end funds
so rapidly in 1929. His reply was: "Well, the people want them" (see Investment Trusts andInvestment
Companies). Lee et a!. report that in the post-1960 period new closed-end fund issues are concentrated in
times when seasoned funds are selling at premia. This suggests that the same factor that causes seasoned
funds to sell at a premium also creates the demand for the new funds. We have establisheds in figure 3a—c
above that both new and seasoned closed-end funds sold at large premia in the summer of 1929. We now
consider new fund issues in 1929.
Almost $1 billion of new fund equity (including preferred shares) was issued in the third quarter of
1929, almost $1.9 billion for all of 1929, and $3.4 billion since the funds started being issued in 1923-24.
Relative to the size of the United States economy then, new closed-end fund issues in the thirdquarter of
1929 were as large a proportion of GNP as a sum of $55 billion would be today; since 1929 the price level has
risen by a factor of nine, real GNP has risen by a factor of six, and the proportion of stock markeL value to
GNP has remained about constant.
Figure 4Number and Volume of New Closed-End Fund Issues, 1928-929
(Including New Issues by Seasoned Funds)600
500
400
300
NewClosed-End FundIssues
(Millions of
Dollars) 200
100
NumberofIssues
0-
1928 1928 1929 1929 1930

Closed-End Funds 15 Dc Long and Shlcifer
Figure 4 presents the time pattern of the number and dollar volume of new issues by closed-end funds
(including expansions ofpreferred stock by seasoned funds) during 1928 and 1929, which saw the issue of 70
percent of all funds issued in the 1920's. Both series begin increasing toward the end of 1928, and reach their
maximum in August and September of 1929. After that they fall off: no closed-end funds are started in the
1930's, although a few funds make small issues of preferred stock during the spring 1930 rally. The evidence
confirms that new issues reached astronomical proportions at the same time that the premia on closed-end
funds reached their peak. This fits the investor sentiment theory, in which closed-end funds are created by
rational investors to take advantage of noise trader overoptimism.
New issues were typically issued to insiders or to favored customers at prices slightly above the net
asset value, but many of them quickly rose to a large premium. For example, Lehman Brothers Corporation
was significantly oversubscribed at $104 per share that bought $100 in assets (but note that its management
contract gave 12 1/2 percent of profits to Lehman Brothers as a management fec; perhaps its true net asset
value was $88). It immediately rose to $126 per share in open trading. The organizers collected not only $4
per share and large future management fees, but they were also significant initial investors at more favorable
terms than those available to the public and they reserved the right—not valuable if the fund is selling at a
discount, but valuable if it selling at a premium—to take their fee in the form of new shares purchased at
current net asset value.
If closed-end fund premia reflect excessive noise trader optimism, funds will pyramid on top of one
another. If each fund can be sold for 50 percent more than its net asset value, then promoters can more than
double their profits by establishing a fund that owns funds that hold stocks, rather than just establishing funds
that hold stocks. Although detailed evidence on this is not available, this prediction is confirmed by one of the
largest funds: the Goldman Sachs Trading Company. The Goldman Sachs Trading Company was a closed
end fund organize! in December 1928 with a net asset value of around $100 million. In 1929 one its largest
holdings was the Shenandoah Corporation—another closed-end fund organized by Goldman Sachs. Nor is
this all. In the same year, Shenandoah organized a new closed-end fund called the Blue Ridge Corporation
and became a large investor in its stock. All these funds traded at premia; at the top of the pyramid, the
Goldman Sachs Trading Company traded at a premium to a premium to a premium to net asset value. It is
hard to justify these structures other than as attempts to part fools from their money.

Closed-End Funds 16 De Long and Shleifer
IV. The Closed-End Fund Discount and the Aggregate Market
Ti'e Correlation of size Fund Discount and size Aggregate Market
The rise in the median closed-end fund discount from 1928 to 1929, and the fall in the discount after
1929, are correlated with the level of the aggregate stock market. Figure 5 plots movements in the log of the
S&P composite index against the median closed-end fund discount. Using quarterly data for the period
1928:IV to 1932:IV, a regression of the S&P index on the median fund discount produces a slope of 1.4 (with
a t-statistic of 4.3, but a Durbin-Watson of 0.9), an R2 of .58, and a standard deviation of the residual of 34.1
percent. A one percentage point rise in the median premium is associated with a 1.4 percent rise in the S&P
index. A similar pattern emerges from examining the correlation between the median discount and the
price/dividend ratio of the S&P composite.
Figure 5
Assocatlon of the Closed-End Fund Discount and theS&P Composite Index
MedianPremium
orDiscount
in
Quarter
Regressing the log price/dividend ratio on the median discount over 1929—32 yields an R2 of .69, a
slope coefficient of .77 (with a t-statistic of 5.4), and a standard error of the residual of 15 percent. The
evidence that stock prices move together with closed-end fund premia is not consistent with standard
explanations of the closed-end fund puzzle. The evidence supports the view that individual investor
Log of S&P Composite Index in Quarter

Closed-End Funds 17 De Long and Shleifer
sentiment may affect stock prices and not just closed-end fund premia.2 The question then is how much of
the stock price rise in 1929 could be attributed to overpricing?
If we could assume that fundamentals over this time period were relatively constant or slowly-
changing, or that fundamental values were proportional to dividends, then we could use the correlation
between the median closed-end fund discount and stock prices or price/dividend ratios to judge the extent of
overvaluation in the summer of 1929. But this assumption does not appear plausible during the onset of the
Great Depression, for there is every reason to believe that fundamentals were volatile around the end of the
1920's. We therefore turn to the Barsky and Dc Long (1990) assessment of how rational estimates of
fundamental values shifted and show that the median closed-cud fund discount has a very high correlation
with those movements in stock prices that are unaccounted for by movements in that estimate of
fundamentals.
Barsky Dc Long-Based Measure of Investor Sentiment
Barsky and Dc Long (1989, 1990) note that large swings in U.S. real stock prices over the twentieth
century followed a relatively simple pattern. The coefficient of a regression of low frequency changes in log
prices on low frequency changes in log real dividendsis around 1.5. In the twentieth century decades of rising
dividends have seen stock prices rise more than proportionately.
Barsky and Dc Long argued that such a pattern in large swings can be accounted for if the expected
future growth rate of dividends were positively correlated with past dividend growth. Such an expectation of
future dividend growth would be rational if the dividend growth rate were subject to both t.ransitory and
persistent shocks. They present a model in which rational expectations of future dividend growth for the S&P
composite index arc a geonleiric weighted average of past dividend growth rates:
(1) = (1 - 0)0d.)
with the parameter 0 near one. The warranted value of the S&P composite index is then:
D(2) P= r -
21n the post-1960 period, when individual investors become less important in trading larger stocks but still important intrading small stocks, closed-end fund premia move togeiher will small stocks. Sec Lee eta!. (1990).

Closed-End Funds 18 De Long and Shleifer
This process for dividends fits the decade-to-decade swings in the stock market relatively well.
In this model, investors extrapolate growth rates of dividends. Small changes in present dividends can
thus have extremely large consequences for valuation. This measure of fundamentals is extremely volatile.
For this reason, it fits aggregate stock market movements at low frequencies much better than do measures
that assume stationary dividends or dividend growth rates (Shiller, 1990). This measure of "fundamentals"
accounts for 70 percent of the twentieth century variation in the year-to-year January S & P composite index.
An alternative interpretation of the Barsky-Dc Long model is that dividend growth rates are not subject
to persistent shocks, hut rather investors overreact to news and therefore dividend innovations lead to share
price changes higher than those warranted by the news, If so, the warranted value attributes a larger share of
stock price movements to fundamentals than may be appropriate. however, the measure of fundamentals
captures only the long swings in stock prices: it does a poorer job at fitting within year and especially month-
to-month variation. Here we assume that shifts in the difference between the S & P index and the BDL
measure of fundamentals reflect shifts in investor sentiment and examine their correlation of this estimate of
investor sentiment with the average premium or discount on closed-end funds.
FIgure 6
The S&P Index and the Barsky-De Long Fundamental—S&P 500 Nominal Price — Barsky-De Long Fundamental
S&P 500
NominalPrice
(194 1—43=
1000)
Figure 6 plots monthly average values of the S&P composite nominal price and of the BDL
1927 1928 1929 1930 1931 1932

Closed-End Funds 19 Dc Long and Shleifer
fundamental from January 1925 to January 1933. We have calculated monthly values of the BDL
fundamental setting the current dividend equal to a three-month centered moving average of dividends on the
S&P composite as reported in Cowlcs (1938). Note that the extrapolative warranted fundamental is almost as
volatile on a month-to-month and quarter-to-quarter basis as is the S&P composite. The end of the 1920's
and the beginning of the 1930's saw much larger short-run changes in dividends than has been the rule since
World War II.
Estimated fundamentals rise throughout the bull market of the 1920's as real dividends grow and their
rate of growth increases. The nominal value of the warranted fundamental reaches its peak in 1930.
Thereafter deflation lowers the fitted nominal for a constant real fundamental. The fall in real dividends as
the economy slides into the Depression reduces the real fundamental value as well.
The difference between the S&P stock index and the constructed fundamental can be read off of figure
6. We call this difference the "I3DL sentiment index." Importantly, this measure of investor sentiment has
been constructed independently of and with no reference to the premium on the typical closed-end fund. In
1928 and early 1929 the BDL index is near zero, it then rises during the third quarter of 1929 and crashes with
the market afterwards. The BDL index remains negative during the early 1930's.
Figure 7Assocatlon of the Closed-End Fund Discount and the BDL
Sentiment Index
MedianPremium
orDiscount
inQuarter - .2
-.4 3 -.2 -.1 0
Average Barsky-De Long Sentiment Index in Quarter

Closed-End Funds 20 De Long and Shleifer
Figure 7 plots the median premium on closed end funds against the sentinient index.3 There is a high
positive correlation between the two. Regressing quarterly median premia on quarterly averages of the
sentiment index from 1931:1 through 1932:IV produces an R2 of .77, a standard deviation of the residual of
7.6 percent, and a slope coefficient of .47 (with a t-statistic of 6.52). Each one percent shift in the median
closed-end fund premium is associated with a .47 percent shift in the S & P composite index relative to the
BDL fundamental. The fit between the sentiment index and the median closed-end fund discount is much
tighter than the fit between the raw S&P and the discount—suggesting that at least some of the large residual
variance when stock prices were regressed on the discount springs from shifts in fundamentals that were not
correlated with shifts in sentiment as captured by the median premium.
Using Lee et al.'s estimate of the average closed-end fund discount of 15% as the level at which
investors are neither excessively optimistic nor excessively pessimistic, we can calibrate the absolute level of
the stock market. Our estimates suggest that stock market mispricing in this period is about half of the
deviation of the closed -end fund premium from -15%. In July 1929 the typical closed-end fund premium is
about 45%, and thus 60% above its average post-1960 level. The S&P index then was approximately 30%
above the level it would have reached had the closed-end fund discount been at its "normal" level. We
therefore attribute approximately 30% of the S&P composite's value in the summer of 1929 to overvaluation
from excessive investor optimism.
If we assume that this estimate ascribes too high a share of stock price movements to shifts in
fundamentals, then our estimate of the S&P composite's overvaluation in the summer of 1929 is even higher.
On the assumption that fundamental values are proportional to dividends, the .77 slope coefficient from the
regression of the price/dividend ratio on the median fund discount and suggests an overvaluation of 45% in
the summer of 1929. On the assumption that fundamental values are approximately stationary from year to
year, the 1.4 slope coefficient from the regression of the nominal price on the median discount suggests an
ovcrvaluation of 80%. Economists like Shillcr (1990) might argue that the true measure of fundamentals
would produce results between these last two cases.
3The median premium is calculated quarterly. During 1929 especially we have too few observations to obtain goodestimates of monthly typical premia and discounts.

Closed-End Funds 21 Dc Long and Shlcifer
V. Some Real Effects of Mispricing
The last years of 1920's saw an enormous expansion in the quantity of securities issued on the U.S.
capital market. In 1928, three billion dollars each of stocks and bonds were issued, and in 1929 six billion
dollars of stocks and two billion dollars of bonds were issued. Between 1925 and 1929, gross fixed
investment ran at a constant rate of eleven billion 1929 dollars. Stock financing is thus an unusually
important source of funds during this period—as one would expect if managers believed that their equity was
overpriced. Not all equity issues, however, financed productive investment. Some of these issues were
refinancing issues (calling of bonds); perhaps two billion dollars of new issues in each of 1928 and 1929 was
devoted to that purpose.
More important, in 1929 a large fraction of equity issues were closed end investment companies.
Figure 8 plots the time series of the volume of new issues of all stocks and non-closed-end-fund stocks. The
figure shows a peak 800 million dollar issue of new stocks in May of 1929, which largely reflected
refinancing of bonds by utilities. The figure also shows that closed-end funds were a significant portion of
new financing at the end of 1928 and the beginning of 1929.
MonthlyEquityIssues
Perhaps most interestingly, the figure shows that closed-end funds dominated new stock issues in the
Figure 8Possible Crowding Out of Operating Company Equity
S Non-Closed End Fund Issues 0 Total Stock Issues
Jon1928
July1928
Jan1929 1929

Closed-End Funds 22 De Long and Shleifer
summer and early fall of 1929, displacing other stocks completely in June and July.4 At the stock market
peak, most of equity financing was closed-end fund financing. One interpretation of this result is that closed-
end fund issues crowded out new stock issues in this period. This finding raises the possibility that the
overpricing of closed-end funds in the summer of 1929 reduced corporate access to capital. The normative
significance is ambiguous. Reducing corporate access to capital and therefore possibly investment might
cause good projects not to be undertaken and so reduce welfare. But if stock market bubbles lead to
inefficiently cheap capital and therefore cause fundamentally unproductive projects to be pursued, displacing
these projects raises welfare.
The Approach of the Great Depression
A strong tradition, which includes Friedman and Schwartz (1963), argues that it was not the speculative
overvaluation but the government's reaction to it that brought on the Great Depression. Hamilton (1986) and
Miron (1990) have recently argued that the Federal Reserve over 1927—29 pursued much more contractionary
policies than were reasonable given the state of the real economy. The Federal Reserve believed that it
should be in the business of restricting the rise in stock prices by imposing high interest rates and restricting
credit. The Federal Reserve feared that if it did not do so, the bubble might be followed by a bust and a
recession.
These policies of high interest rates and little credit expansion had an effect: economic activity reached
a peak in the summer of 1929, and then started downward. The Federal Reserve Board, fearing that too easy
money might restart a speculative bubble and set the stage for an even worse crash in the future, restricted the
Federal Reserve Bank of New York's instinct to reduce interest rates and provide more liquidity in the fall of
1929. Miron (1990) argues that the Federal Reserve's fear of a depression brought on by a speculative crash
led it to try to moderate stock price rises, but that attempts to curb the stock market with tightmoney played a
key role in bringing on the depression that it had hoped to avoid.
VI. Conclusion
There are few cases in which cconomis can observe fundamental values of securities directly. Closed-
4mere is a seasonal pattern to new stock issues. On average during the 1920's new issues during July—September occurat half the rate of the other three quarters of the year. T1e third quarter of 1929, however, saw a very large volume ofnew issues, many of which were for closed-end funds.

Closed-End Funds 23 Dc Long and Shleifer
end mutual funds provide one of those cases: their fundamental values are Simply the net asset values of their
portfolios. In this paper we have used the difference between prices and values of closed-end funds as a
measure of investor Sentiment.
We are confident that the same investor sentiment factor that leads to swings in closed-end fund prices
in excess of the swings in their underlying values drives irrational swings in stockprices as well. We can
conceive of situations in which stock prices accurately reflect fundamental values even thought closed-end
funds exhibit substantial premia: rational arbitrageurs might be unable to drive the prices of closed-end funds
to their true values because of an inability to sell short even though they drive the prices of stocks—which
they can sell short—down to fundamentals. But we cannot conceive of a situation in which stockprices
accurately reflect fundamental values and in which closed-end funds alternately sell at premia and discounts
from their net asset values. Deviations of closed-end fund prices from values createopportunities for liquid
investors with long time horizons to earn nearly-riskless excess returns. It is hard tosee how the prices of
closed-end funds could provide such arbitrage profit opportunities without also believing that such arbitrage
profit opportunities exist in the prices of stocks in general as well.
In the late 1920's, in contrast to previous and subsequent patterns, closed-end funds soldat large
premia. We interpret these premia as a sign that investors in closed-end funds were overoptimistic: at the
peak in the summer of 1929, they appear willing to pay perhaps 60 percent more than post-World War II
experience would suggest is the "normal" relative price of a closed-end fund. Such a substantial overpricing
of an asset with observable fundamentals suggests that other assets might be selling atprices above
fundamentals as well. The evidence from closed-cud funds suggests that the stock market wassubstantially
overvalued in the summer of 1929; our crude estimate is that the S&P composite was at least 30 percent
above fundamentals.

Closed-End Funds 24 Dc Long and Shleifcr
Appendix: Pre-1930 Observations of Closed-End Fund Premia and Discounts
Premiumor
Fund New Issue? Date Discount (%) SourceInvestors' Equity Company 1927.91 71 Keane/NYTGeneral Public Service Corp. 1928 -12.5 CFCChain Store Investment Corp. 1928 47.1 Baker Higgins CollectionContinental Securities Corp 1 928.25 19 Keans/NYTInvestors Equity Company 1928.91 166 Keane/NYTAmerican British, and Continental Corp. 1929 138 Keane/NYTChain Store Investment Corp. 1929 52.8 Keane/NYTGeneral American Investors 1929 233 Keane/NYTGeneral Public Service Corp. 1929 -4 CFCShawmut Association 1929 0 Keane/NYTCapital Administration Company 1929 1235 Keane/NYTAES 1929 -25.246 Authors' calculationsTn-Continental New Issue 1929.08 13 CFCINYTAES 192908 -28.152 Authors' calculationsNational Securities Investment Company New Issue 1929.1 0 CFC/NVTChicago Corp New Issue 1929.12 36 CFC/NYTStandard Investing Corporation 1929.16 84.7 Keane/NYTChain and General Equities Corp 1929.17 25 CFC/NYTAES 1929.17 -13.016 Authors calculationsAES 1929.25 -14.154 Authors' calculationsAES 1929.33 -19.754 Authors' calculationsMayflower Associates New Issue 1929.39 13 CFCInvestors Equity Company 1929.41 54 CFCAmerican-European Securities 1929.41 -22.4 CFC/NYT/KeaneUnion-American Investing Company 1929.41 32.1 CFCAES 1929.42 -21.527 Authors' calculationsMayflower Associates 1929.47 20 CFCShawmut Association 1929.49 -10.7 CFCGeneral Public Service Corp 1929.49 34.1 CFCUnited Founders Corporation 1929.49 110 CFCU.S. and International Securities Corp. 1929.49 212.26 CFCPower and Light Securities Trust 1929.49 6.1 CFCAES 1929.5 6.475 Authors' calculationsAmerican-European Securities 1929.53 11.9 CFCTn-Continental Corp. 1929.58 29.18 CFCShenandoah Corp New Issue 1929.58 103 CFC/NYTInterstate Equities New Issue 1929.58 25 CFC/NYTAES 1929.58 25.196 Authors' calculationsBlue Ridge Corp New Issue 1929.64 46 Keane/NYTInvestors' Equity Company 1929.64 276.6 CFCAmerican Equities New Issue 1929.64 8 Keane/NYTPrudential Investors 1929 66 18 CFCStandard Investing Corporation 1929.66 48.4 CFCSecond National Investors 1929 66 151 99 CFCShawmut Bank Investment Trust 1929.66 8 CFCAmerican Equities Corp New Issue 1929.67 8 CFC/NYTAES
1929.67 21 .729 Authors' calculations

Closed-End Funds 25 De Long and Shicifer
Prince and Whitely New Issue 1929.68 18 CFC/NYTLehman Corporation New Issue 1929.71 16.5 CFCINYTCapital Administration Company 1929.75 263 CFCCentury Shares Trust 1929.75 -5.3 CFCGeneral Public Service Corp. 1929.75 15.87 CFC/KeaneAES 1929.75 8.062 Authors calculationsAES 1929.83 -4.925 Authors calculationsGraymur Corp. 1929.87 -28 CFCAES 1929.92 -8.737 Authors calculationsGeneral Public Service Corp. 1930 28 CFC/KeaneShawmut Association 1930 -33 CFCLehman Corporation 1930 -18 Keane/NYTBlue Ridge Corp 1930 -24.5 Keane/NYTPrudential Investors 1930 -30 CFCGoidman-Sache Trading Corp 1930 -6.3 Kearie/NYTAES 1930 -18 Authors calculationsPower and Light Securities Trust 1930.08 -10 CFCLehman Corporation 1930.16 -14 Keane/NYTAES 1930.25 -13.8 Keane/NYT
1929.00 = January 1, 1929; 1929.50 July 1. 1929AES— The American European Securities CorporationCFC— The Commercial and Financial ChronicleCF—Commerce and FinanceNYT—The New York TimesKeane—Keanes Manual of Investment Trusts

Closed-End Funds 26 De Long and Shleifer
References
Barsky, Robert and J. Bradford Dc Long (1989). "Why have Stock Prices Fluctuated?" (Cambridge, MA:
I-harvard University mirneo).
Barsky, Robert and J. Bradford Dc Long (1990), "Bull and Bear Markets in the Twentieth Century," Journal
of Economic History 50:2 (June 1990), pp. 1—17.
Becker, AG., and Co. (1930), "The Investment Company," Keane's invesment Trust Monthly 1 (January), pp.
125—6.
Cowles, Alfred et a!. (1938), Common Stock Indices (Chicago: Cowles Associates).
Dc Long, J. Bradford, Andrci Shleifer, Lawrence Sunimers, and Robert Waldmann (1990), "Noise TraderRisk in Financial Markets," Journal of Political Economy (August).
Dice, Charles (1929), New Levels in the Stock Marker (New York: McGraw liii!).
Fisher, Irving (1930), The Stock Market Crasl—and After (New York: Macmillan).
Friedman, Milton, and Anna Jacobson Schwartz (1963), A Monetary Histoiy of the United States (Princeton,N.J.: Princeton University Press).
Gaibraith, John Kenneth (1954), The Great Crash (Boston, Mass.: Houghton Miffhin Co.).
hamilton, James (1987), "Monetary Factors in the Great Depression," Journal of Monetary Economics 19,
pp. 145—69.
Keanc, Charles, ed. (1930—33), Keane's investment Trust Monthly
Keane, Charles, ed. (1928—1930), Keanes Manual of Investment Trusts (Boston: Financial Publishing
Company).
Kindlebcrger, Charles (1978), Manias, Panics, and Crashes: A History of Financial Crises (New York:Basic Books).
Krcckcr, Preston (1929—1931), "Investment l'rusts," a weekly column in Commerce and Finance
Lee, Charles, Andrei Shicifer, and Richard Thaler (1990), "Investor Sentiment and the Closed-End Fund
Puzzle" (Chicago, IL: University of Chicago mirneo).
Malkiel, Burton (1987), A Random Walk Down Wa/i Street (New York: W.W. Norton)

Closed-End Funds 27 De Long and Shicifer
Miron, Jeffrey (1990), "Monetary Policy, Curbing Speculation, and the Origins of the Great Depression"(Cambridge, MA: NBER mimeo).
New York Stock Exchange, Committee on Stock List (1929), "Tentative Special Requirements for ListingInvestment Trust Securities," reprinted in Keane's Investment Trust Monthly! (November), pp 5—6.
Rappoport, Peter, and Eugene White (1990), "Was 'lucre a Bubble in the 1929 Stock Market?" (New
Brunswick, N.J.: Rutgers University xerox).
Santoni, Gary, and Gerald Dwycr (1990), "Bubbles vs. Fundamentals: New Evidence from the Great BullMarkets," in Eugene White, ed., Crises and Panics: The Lessons of History (1-lomewood, N.J.: DowJones-Irwin).
Shiller, Robert (1990), Market Volatility (Cambridge, MA: M.I.T. Press).
Sirken, Joel (1975), "The Stock Market of 1929 Revisited: A Note," Business History Review 49, pp. 233—41,
Standard and Poor's Corporation (1984), Securities Price Index Record (New York: S&P).
U.S. Congress, House of Representatives, Committee on Banking and Currency (1938), Investment Trusts
and Investment Companies (Washington, DC: GPO).
White, Eugene (1990a), "When the Ticker Ran Late: The Stock Market Boom and Crash of 1929," inEugence White, ed., Crises and Panics: Lessons of History (1-lomewood, N.J.: Dow Jones-Irwin).
White, Eugene (1990b), "The Stock Market Boom and Crash of 1929 Revisited," Journal of Economic
Perspectives 4:2, pp. 67—83.
Wigmore, Barric (1985), The Crash and Its Aftermath (Westport, Conn.: Greenwood Press).