california’s film and television tax credit … · somjita mitra, ph.d. march 2014 . ... program,...
TRANSCRIPT

MARCH 2014
ECONOMIC AND POLICY ANALYSIS GROUP Los Angeles County Economic Development Corporation
CALIFORNIA’S FILM AND TELEVISION TAX CREDIT PROGRAM:
Assessing Its Impact

818 W. 7th Street, 12th Floor Los Angeles, CA 90017 (213) 236-1800 www.scag.ca.gov
Los Angeles County Economic Development Corporation 444 S. Flower Street, 37th Floor Los Angeles, CA 90071
(888) 4-LAEDC-1 www.LAEDC.org
Christine Cooper, Ph.D. Shannon M. Sedgwick Somjita Mitra, Ph.D.
March 2014
This research was commissioned by the Southern California Association of Governments.
The LAEDC Economic and Policy Analysis Group provides objective economic and policy research for public agencies and private firms. The group focuses on economic impact studies, regional industry analyses, economic forecasts and issue studies,
particularly in workforce development, transportation, infrastructure and environmental policy.
Every reasonable effort has been made to ensure that the data contained herein reflect the most accurate and timely information possible and they are believed to be reliable.
This report is provided solely for informational purposes and is not to be construed as providing advice, recommendations,
endorsements, representations or warranties of any kind whatsoever.

Assessing California’s Film and Television Tax Credit Program
Economic and Policy Analysis Group 1
Executive Summary
alifornia’s Film and Television Tax Credit Program, enacted in February 2009 and launched in July 2009, has been allocating $100 million
each fiscal year in tax incentives to encourage in-state production activity and staunch runaway production. In this report, the Economic and Policy Analysis Group of the Los Angeles County Economic Development Corporation (LAEDC) reviews the projects that have been allocated credits to date, assesses the impact of the first three years of allocated funding of California’s Film and Television Tax Credit Program and evaluates several alternatives to the current program.
Economic and Fiscal Impact of First Three Years of Allocated Funding In the first three fiscal years of program funding, 113 projects received tax credit allocations. As of December 31, 2013, 109 of these projects had been completed, audited and received final tax credit certificates for use against California sales and use taxes or income taxes. Their estimated total economic and fiscal impacts are presented in Exhibit E-1.
Exhibit E-1 Economic and Fiscal Impact of Completed Productions (First Three Years of Allocated Funding) Direct California Expenditures ($ billions) $ 1.9 Qualifying Expenditures ($ billions) 1.2 Total Economic Impact:
Output ($ billions) $ 4.3 Employment (jobs) 22,300 Labor income ($ billions) $ 1.6 Total Fiscal Impact ($ millions): State and local tax revenues $ 247.7 Source: Estimates by LAEDC
Overall, the 109 projects reported total spending in California of $1.9 billion, of which $1.2 billion qualified for tax credits. This activity generated $4.3 billion in economic output in California, and supported 22,300 jobs with labor income of $1.6 billion. It is estimated that this activity generated state and local taxes of almost $248 million.
Not included in the estimated economic impacts is the impact of film-related tourism, which is known to generate significant revenues at all levels of government as millions of visitors from around the world drawn to California by the entertainment industry purchase hotel rooms, food, services, clothing, jewelry, sightseeing trips, air travel and entertainment experiences.
Impact Ratios A helpful interpretation of the value of the tax credit is to measure the economic and fiscal impacts in terms of the current dollar value of the tax credit certificates issued. These are presented in Exhibit E-2.
Exhibit E-2 Impact Ratios of Completed Projects of First Three Years Economic output per dollar tax credit $ 19.12 Labor income per dollar tax credit 7.15 GDP per dollar tax credit 9.48 State and local tax revenue per dollar credit (ROI) 1.11 Source: Estimates by LAEDC
These ratios are interpreted as follows: For each dollar of tax credit certificate issued:
Total economic activity in the state increased by $19.12
Labor income (including to the self-employed) increased by $7.15
Total state GDP increased by $9.48 For each dollar of tax credit certificate issued, $1.11 was returned to local and state governments, which is the real rate of return on the investment of public funds. The overriding factor determining the return on investment is the proportion of all expenditures made in California that qualify for credits. The smaller this proportion, the higher is the return on investment. Expenditures which do not qualify are essentially free-riding and costless to the state, boosting the economic impact of the project and increasing the return on investment.
C
17

Assessing California’s Film and Television Tax Credit Program
2 Economic and Policy Analysis Group
Economic and Fiscal Impact of Lost Big Budget Productions During the 2012-13 fiscal year, seventy-five percent of the 41 live action feature films with production budgets in excess of $75 million (and thus precluded from participating in California’s program) filmed entirely outside of California, with aggregate production spending over $4 billion. If these productions had occurred in the state, California would have reaped the economic benefits. Instead, the loss of this spending in California cost the state 47,600 jobs (direct, indirect and induced) during the last fiscal year and $410 million tax revenues to state and local governments.
Exhibit E-3 Total Economic and Fiscal Impact of Lost Productions Total Production Spending ($ billions): $ 4.0 Total Economic Impact: Output ($ billions) $ 9.6 Employment (jobs) 47,600 Labor income ($ billions) $ 3.5 Total Fiscal Impact ($ millions): State and local tax revenues $ 410 Source: Estimates by LAEDC
While it may be optimistic to think that all those productions could have filmed in California, even the loss of only half of that spending cost the state a significant amount of economic activity. It is not hyperbole to assert that the state is losing jobs to other states and nations, and is continuing to bleed out at increasing rates.
Alternatives to Current Program As the program reaches the end of its allocated funding, debate is underway as to whether or not the program should be extended and expanded, and, if so, potential changes that can be made to improve the program. Several alternatives are examined, and it is found that:
When a positive return is realized, the state earns money on its investment in this industry, which would support efforts to increase the level of funding.
Ensuring a positive return on investment is possible by constructing a blend of productions with lower average rates of return and productions with higher average rates of return. Supporting a range of project types can reap increasing returns to scale in the film and television industry ecosystem.
Altering the tax credit level of certain projects has a measurable impact on their rate of return and therefore the overall rate of return of the program.
Allowing big budget productions to qualify
under the program (by lifting the $75 million budget cap) can add a significant amount of economic activity to the state, but the likelihood that these productions involve large visual effects is a consideration when estimating the return on investment, since the program does not currently provide for visual effects providers and therefore these may well be carved out and outsourced.

Assessing California’s Film and Television Tax Credit Program
Economic and Policy Analysis Group 3
1 Introduction
alifornia’s Film and Television Tax Credit Program, enacted in February 2009 and launched in July 2009, has been allocating $100 million
each fiscal year in tax incentives to encourage in-state production activity and staunch runaway production. As a mobile and lucrative industry, competition for industry activity has been fierce, with governments around the world willing to spend large sums of public funds to attract and build local industries at California’s expense. With many competing budget needs, California’s incentive program is not as generous as many offered elsewhere. The thinking has always been that the industry does not need as large a tax incentive in California as elsewhere because the industry has deep roots in California and even a modest incentive could work to tip the scales in favor of keeping production activity in the state, given that many industry players live and work in California and are reluctant to move for what can be lengthy production schedules, or commute and endure extended separations from homes and families. However, generous credits offered elsewhere have accelerated production flight. Even in the absence of any homegrown talent, facilities or supply chains, many states hope to germinate a domestic industry using intermittent incentivized production to induce local development, often opting for even the temporary spending at hotels, restaurant and small suppliers as an immediate boon to local businesses. Success has certainly been realized, as many regions have developed sophisticated facilities, attracted investment in sound stages and production facilities, trained local workers who have gained valuable experience and established local supplier networks. Still, the hodgepodge and mosaic of incentives offered across the nation and around the world have
incentivized a fractionation of the industry, where pre-production may occur in one state, parts of filming occur in many locations and post-production is sent off-shore. The economic ramification of the loss of production activity in California is significant, as supporting industries from lighting to prop shops to visual effects houses to costumers are finding fewer opportunities and closing up shop or relocating to other states. In this report, the Economic and Policy Analysis Group of the Los Angeles County Economic Development Corporation (LAEDC) assesses the impact of the first three years of allocated funding of California’s Film and Television Tax Credit program. The report proceeds in four parts: Section 2 provides an overview of all projects that have been allocated tax credits as of December 31, 2013. Many of the projects are still underway (or have not yet commenced), and a complete assessment of these projects cannot be done. In Section 3, the first three years of allocated funding is assessed since most of the projects allocated credits during this period have been completed, have been audited, and have received final tax credit certificates. Section 4 assesses the lost opportunity of large budget feature films which do not qualify for tax credits under the current program and which have for the most part fled the state. Section 5 discusses several alternatives to the current program and how they might impact the return on investment for the state. An explanation of the methodology, key assumptions and a comparison of the findings in this report with those in an earlier LAEDC study can be found in the Appendix.
C

Assessing California’s Film and Television Tax Credit Program
4 Economic and Policy Analysis Group
2 Credit Allocations to Date
s of December 31, 2013, 265 projects have been granted tax credit allocations worth $587 million, almost 98 percent of the funding allocated through
the end of the 2014-15 fiscal year. The program is administered by the California Film Commission (CFC). Applications for tax credits are received beginning on June 1 for the next fiscal year’s funding allocation. A lottery is then held on July 1st and tax credits are allocated until the program funding of $100 million for that fiscal year is exhausted. A waiting list is formed with any remaining applicants. During the year, in the event that projects are unable to proceed for one reason or another and drop out of the program, the credit that was allocated to that project is then re-allocated to projects on the waiting list. If at the end of the fiscal year not all funding has been allocated, the remaining funds roll into the following fiscal year. The initiation of the program was so popular and the number of applicants so large that in its first year the program was permitted to allocate funding designated for the following fiscal year. This acceleration of funding has continued over the life of the program (which has been extended twice) such that although the program expires on June 30, 2017, all funding will likely be exhausted during the 2016 fiscal year (and perhaps even by July 1, 2015). Thus, as California’s Film and Television Tax Credit program comes to the end of its sixth year of allocated funding, the legislature is considering proposals for extensions and modifications of the current program, balancing the desire to support an indigenous industry with the reality of fiscal restraint.
Allocated Projects: The Lottery Winners The projects granted credit allocations to date represent a broad selection of types, including feature films, movies-of-the-week, television series and mini-series, many of which were the projects of independent producers. Tax credit allocations by project type are presented in Exhibit 2-1.
Exhibit 2-1 Projects Receiving Tax Credit Allocations by Type As of December 31, 2013
Number of Projects
Incentive Level
CA Spending ($ millions)
Credit Allocations
($ millions) Feature film 61 20% $ 2,154.3 $ 254.7 Indie feature film 89 25% 553.5 75.3 Movie of the week 5 20% 46.5 6.0 Indie movie of the week 56 25% 153.7 23.9 Television 45 20% 1,585.2 186.4 Relocating TV series 7 25% 231.1 39.6 Indie mini-series 1 25% 6.5 1.1 TOTAL 265 $ 4,730.8 $ 587.1 Source: California Film Commission
Approximately one fourth of the projects are non-independent feature films and movies-of-the-week, accounting for 46 of the overall spending in California and 44 percent of the credit allocations. Independent projects, including feature films, movies-of-the-week and mini-series, accounted for more than half of all projects and 17 percent of the credit certificates. Television series claimed the remaining 38 percent of credit certificates. The tax credit incentive is set at 20 percent of qualifying expenditures, which generally excludes above-the-line payments and expenditures made outside of California. For productions made by independent producers, and for television series that are relocating to California after filming elsewhere, an additional 5 percentage points is granted. Because projects are allocated by lottery, the mix from year to year of the types of projects receiving allocations is not known in advance or determined by segmentation or other allocation scheme, other than a ten percent set-aside of available funding ($10 million per year) for projects from independent producers. Feature films have accounted for between 50 and 60 percent of the projects in each year of the program, although the split between non-independent and independent productions has changed. Movies-of-the-week have been approximately 20 to 25 percent of all projects, while television has increased its share over the program, from less than ten percent of the projects allocated credits to 20 percent in the final year. The
A

Assessing California’s Film and Television Tax Credit Program
Economic and Policy Analysis Group 5
distribution of project type by funding allocation year is shown in Exhibit 2-2.
Source: California Film Commission The California Film Commission reports that several large budget projects dropped out of the lottery after having received allocations during the FY12 and FY13 allocation. These were television series that did not get picked up after their first season, but for which allocations had been reserved in the event that they continued production (as directed by the program). These were replaced by many smaller budget independent productions. Consequently, the first two years of allocated funding provided tax credits to a proportionally higher number of non-independent feature films (which are allocated a lower tax credit) than in later years. As the program continued, independent projects accounted for an ever-increasing number of credit allocation increased. However, independent productions have smaller budgets, so that one non-independent feature film with a budget of $75 million can be replaced by several independent feature films or movies-of-the-week with smaller budgets. Because different production types receive different incentives, even if the spending patterns are materially the same and their total economic and fiscal impacts similar, a higher credit level will raise the cost of the credit to the public for the same level of returns. As such, it may be useful to consider if the project mix has changed over the years of the program. If the program becomes more heavily weighted with projects that earn a 25 percent tax credit rather than those that earn a 20 percent tax credit, the return to the state will consequently be lower than if the program were more
heavily weighted with productions earning a lower tax credit. This may be what is occurring, as seen in Exhibit 2-3, which presents the aggregate California expenditures of productions by type by allocation year.
Source: California Film Commission While non-independent productions (including television) accounted for more than 90 percent of overall spending in California during the first two years of allocated funding, that percentage fell to 77 percent in the third year, 65 percent in the fourth year—but has been rising again in subsequent years of the program. Exhibit 2-4 shows the percentage of overall California expenditures recorded by productions in each group.
Source: California Film Commission During the first two years of funding allocations, more than 90 percent of expenditures were made by projects
0
10
20
30
40
50
60
FY10 FY11 FY12 FY13 FY14 FY15
Funding Allocation Year
Exhibit 2-2 Number of Projects by Type by Funding Allocation Year As of December 31, 2013
TV
Relocating TV
MOW
Indie MS
Indie MOW
Indie FF
FF
0
200
400
600
800
1,000
1,200
FY10 FY11 FY12 FY13 FY14 FY15
Funding Allocation Year
Exhibit 2-3 CA Expenditures by Type by Funding Allocation Year As of December 31, 2013
TV
Relocating TV
MOW
Indie MS
Indie MOW
Indie FF
FF
0%
20%
40%
60%
80%
100%
FY10 FY11 FY12 FY13 FY14 FY15
Funding Allocation Year
Exhibit 2-4 Percent of California Expenditures by Credit Level
20%25%

Assessing California’s Film and Television Tax Credit Program
6 Economic and Policy Analysis Group
whose tax credit level was 20 percent of qualifying expenditures. This percentage fell during the following two years of funding allocations as the participation of independents increased. These projects earned 25 percent credit. Note, however, that California expenditures of the first three years’ worth of allocations have largely been audited and are thus known, while the remaining
projects have submitted only expectations of their anticipated California expenditures. The final accounts may show that actual California expenditures will exceed or fall below initial estimates. Additionally, it is possible that projects in the pipeline having been allocated tax credits will drop out of the program as occurred during FY 12 and FY13 and be replaced by projects on the waiting list, altering the final composition of projects.

Assessing California’s Film and Television Tax Credit Program
Economic and Policy Analysis Group 7
3 The First 3 Years of the Program
hile funding has been exhausted for six years of the program as tax credits have been allocated to projects that have submitted applications, the
projects themselves are in varying stages of the process. Some have completed filming but have not been audited; others are still in production, while yet others are waiting to assemble financing and begin pre-production. Because actual spending (both qualifying and non-qualifying) and the final tax credit certificates issued can differ from those proposed or projected before the project has been completed, assessing the impact of California’s Film and Television Tax Credit Program on all projects in the pipeline is difficult and will only provide preliminary estimates. The most conclusive picture would be provided by projects that have completed production, have had their financial statements audited, and have been issued tax credit certificates for a selection of fiscal years. Because productions take some time to complete, the fullest fiscal years are the first three. In the first three fiscal years of funding, 113 projects received tax credit allocations. As of December 31, 2013, 109 of these projects had been completed, audited and received final tax credit certificates for use against California sales and use taxes or incomes taxes. The remaining four productions have not yet submitted final paperwork. These include Moneyball, a feature film that was a box office success in 2011; Jane by Design, an ABC Family comedy-drama television series in 2011; Switched at Birth (season 1), another 2011 ABC Family drama television series; and For the Love of Money, a 2012 independent feature film. The total value of final tax credit certificates issued to the completed 109 projects was $235.4 million, accounting for approximately 39 percent of the funding allocated to date. The distribution of projects by type and the credit certificates issued is shown in Exhibit 3-1. Of the 109 projects, 65 projects were feature films, including Bridesmaids, Christmas in Beverly Hills, In Time, The
Lincoln Lawyer, The Social Network and We Bought a Zoo. There were 25 movies-of-the-week, including The Christmas Pageant, The Craigslist Killer and Will and Kate: A Royal Romance. The remaining 19 projects were television shows or mini-series, including Justified, Pretty Little Liars, Rizolli & Isles and Torchwood.
Exhibit 3-1 Projects and Credit Certificates Issued by Type (Completed Projects of First Three Years of Allocated Funding)
Number of Projects
Incentive Level
Credit Certificates
($ millions) Feature film 34 20% $ 146.2 Indie feature film 31 25% 18.1 Movie of the week 3 20% 4.3 Indie movie of the week 22 25% 7.2 Television 15 20% 44.6 Relocating TV series 3 25% 13.9 Indie mini-series 1 25% 1.1 TOTAL 109 $ 235.4 Source: California Film Commission
Approximately one third of the projects were non-independent feature films and movies-of-the-week, accounting for 64 percent of the credit certificates. Independent projects, including feature films, movies-of-the-week and mini-series, accounted for half of all projects and 11 percent of the credit certificates. Television series claimed the remaining 25 percent of credit certificates. While credits are allocated based only on qualifying expenditures, the real benefit to the state’s economy is based on the overall expenditures made in California, including those made to above-the-line talent, producers and directors, and non-qualifying below-the-line expenditures, such as songwriters and music supervisors, community relations and publicity. While these expenses may not qualify for tax credit purposes, they nevertheless generate significant economic activity in the state through indirect and induced effects. Both California expenditures and qualifying expenditures by project type are shown in Exhibit 3-2.
W

Assessing California’s Film and Television Tax Credit Program
8 Economic and Policy Analysis Group
Exhibit 3-2 CA Expenditures and Qualifying Expenditures by Project Type (Completed Projects of First Three Years of Allocated Funding)
CA
Expenditures ($ millions)
Qualifying Expenditures
($ millions)
Qualifying Expenditures
as % of CA Expenditures
Feature film $ 1,233.9 $ 754.4 61.1 Indie feature film 153.9 74.2 48.2 Movie of the week 32.0 21.8 68.2 Indie movie of the week 45.4 29.7 65.5 Television 391.0 237.0 60.6 Relocating TV series 82.6 56.4 68.2 Indie mini-series 6.0 4.2 70.0 TOTAL $ 1,944.9 $ 1,177.9 60.6 Source: California Film Commission
Of all spending in California by projects that received tax credit certificates from the first three years of the program, non-independent feature films accounted for 62 percent, independent productions accounted for 11 percent and television series 24 percent. On average, qualifying expenditures were 61 percent of all California spending, with some differences among the various types of projects. This metric will be explored in more detail below.
Economic and Fiscal Impact The proliferation of tax incentives across the nation has motivated a number of economic analyses of the effectiveness of these programs in terms of not only the economic activity generated by the productions funded in part by tax incentives, but more closely examining if the tax revenues that are generated by the additional activity are sufficient to offset the tax expenditures. The findings of these analyses have been quite mixed, with few states reporting a favorable return on investment in what was for them a new and potentially lucrative industry they were attempting to attract and develop. However, both economic and fiscal impacts of the industry are expected to be larger in California than elsewhere for a number of reasons. First and foremost, the motion picture and video industry in California is already well-established, and has deep and broad supplier networks, with vast linkages. Estimates show more than 90 percent of the goods and services that the industry uses are sourced from within the state. This drives a richer re-circulation of purchasing dollars in California, generating larger impacts than if the purchases were made elsewhere.
Second, the economy of California is large and diversified and able to supply most of the goods and services that households and businesses in other industries purchase, meaning there is less leakage of indirect and induced buying dollars out of the state. Third, income taxes in California are relatively progressive, and sales tax rates relatively high, generating more tax revenue per dollar of personal and corporate income and per dollar of taxable sales than a state with lower tax rates. Finally, the incentives offered in California’s program are less generous than those offered in other states, making the tax expenditure per dollar of qualifying production activity lower relative to other states. In addition to differences in the economic and tax structures and the prevailing tax incentive program, the overall economic impacts of the different types of productions may differ because of the nature of the production spending. For example, larger feature films spend more on visual effects and may have A-list actors, directors, writers and such. Television series may have a proportionally larger local spend and on-the-ground expenditures such as set construction, caterers, props and so on. The total estimated economic and fiscal impacts for the set of 109 completed and audited projects issued final tax credit certificates are presented in Exhibit 3-3.
Exhibit 3-3 Economic and Fiscal Impact of Completed Productions (First Three Years of Allocated Funding) Direct California Expenditures ($ billions) $ 1.9 Qualifying Expenditures ($ billions) 1.2 Total Economic Impact:
Output ($ billions) $ 4.3 Employment (jobs) 22,300 Labor income ($ billions) $ 1.6 Total Fiscal Impact ($ millions): State and local tax revenues $ 247.7 Source: Estimates by LAEDC
Overall, the 109 projects reported total spending in California of $1.9 billion, of which $1.2 billion qualified for tax credits. This activity generated $4.3 billion in economic output in California, and supported 22,300 jobs with labor income of $1.6 billion. It is estimated that this activity generated state and local taxes of almost $248 million.

Assessing California’s Film and Television Tax Credit Program
Economic and Policy Analysis Group 9
Not included in the estimated economic impacts is the impact of film-related tourism. California is known to be the center of the entertainment industry, and millions of visitors from around the world come to California to experience Hollywood, Universal Studios, the Walk of Fame, and many other film-related attractions. These visitors purchase hotel rooms, food, services, clothing, jewelry, sightseeing trips, air travel and entertainment experiences, generating significant revenues at all levels of government which have not been included in the estimates above. Also excluded is ancillary activity (such as commercials, trailers or short documentaries) that occurs because a particular project facilitates additional filming activity with available talent, co-workers and equipment. While such ancillary activity is known to take place, it is difficult to quantify with accuracy for the range of projects completed and is not included here.
Impact Ratios A helpful interpretation of the value of the tax credit is to measure the economic and fiscal impacts in terms of the current dollar value of the discounted tax credit certificates issued. These are presented in Exhibit 3-4.
Exhibit 3-4 Impact Ratios of Completed Projects of First Three Years Economic output per dollar tax credit $ 19.12 Labor income per dollar tax credit 7.15 GDP per dollar tax credit 9.48 State and local tax revenue per dollar credit (ROI) 1.11 Source: Estimates by LAEDC
These ratios are interpreted as follows: For each dollar of tax credit certificate issued:
Total economic activity in the state increased by $19.12
Labor income (including to the self-employed) increased by $7.15
Total state GDP increased by $9.48 For each dollar of tax credit certificate issued, $1.11 was returned to local and state governments, which is the real rate of return on the investment of public funds. This rate of return is calculated by comparing the current value of tax expenditures against the current value of tax revenues. Because the production spending
and its multiplier rounds occur in advance of the final tax credit certificates being realized, the tax expenditures of $235.4 million were discounted by 5 percent, which is the average 24-month inflation rate since 2009, yielding the discounted value of the tax credit certificates of $223.6 million.
Differences between Types of Projects The rate of return for different types of projects varies, dependent on not only the tax benefits of the projects but also the tax expenditure rate. Average rates of return by project type are shown in Exhibit 3-5, along with the range of values of the returns for the individual projects evaluated.
Exhibit 3-5 ROI by Type of Production (Completed Projects of First Three Years of Allocated Funding) Average
ROI ROI Range Feature film 1.12 0.61 – 1.57 Indie feature film 1.15 0.48 – 10.87 Movie of the week 0.97 0.69 – 19.09 Indie movie of the week 0.83 0.60 – 4.33 Television 1.19 0.75 – 3.01 Relocating TV series 0.82 0.65 – 0.84 Indie mini-series 0.79 0.79 TOTAL 1.11 0.52 – 19.03 Source: Estimates by LAEDC
The highest average ROI is for television series, with an average ROI across the 15 projects of 1.19. The second highest average ROI is for independent feature films, with an average ROI over the 31 projects of 1.15, closely followed by the average ROI of the 34 non-independent feature films of 1.12. The ranges of the ROI for individual projects, though, are quite large. For independent feature films it ranges from 0.48 to 10.87, and for movies-of-the-week from 0.69 to 19.09. The overriding factor determining the return on investment is the proportion of expenditures made in California that qualify for credits. The smaller this proportion, the higher is the return on investment. If a project spends $75 million in the state of California, on both qualifying and non-qualifying expenditures, and only $35 million of this spending qualifies, then the 20 percent tax expenditure is based on $35 million while the state benefits from the full $75 million of spending.

Assessing California’s Film and Television Tax Credit Program
10 Economic and Policy Analysis Group
This relationship for the 109 projects from the first three years of the allocated funding is demonstrated in Exhibit 3-6.
Source: Estimates by LAEDC The highest rates of return are for projects that claim tax credits against only a small proportion of their California expenditures. These are the data points at the left side of the chart. This can be the result of large above-the-line expenditures that do not qualify. For example, the data point representing an ROI of 19.1 in this case was The Craigslist Killer, a movie-of-the-week with final qualifying expenditures equal to that proposed in its application, amounting to a scant 3.5 percent of total expenditures in California. This means that 96.5 percent of the project’s spending in California came without a cost to the state. Moreover, because this was a non-independent project, it was eligible for a tax credit of only 20 percent.
The data point with the second-highest return was The Lincoln Lawyer, an independent feature film starring Matthew McConaughey, with qualifying expenses representing 5 percent of its overall California spending, meaning that 95 percent of its spending in California was costless to the state. While most productions fall on the prediction line, one data point, representing an ROI of 8.1 and qualifying expenditures reaching 16.6 percent of California expenditures, is an anomaly. This production illustrates another factor influencing the ROI of projects: the excess of actual qualifying expenditures over that proposed. Credit allocations are based on proposed qualifying expenditures, and are capped at that level (i.e., regardless of the actual experience of the project, the final credit certificate issued after audit can never exceed the original allocation). The project represented by this data point (an independent feature film) reported final qualifying expenditures far in excess of its proposed qualifying expenditures (26.5 percent of its California spending). If the final credit certificate had been based on the final qualifying expenditures, the ROI would have been 2.1 instead of 8.1. Instead, this project spent additional funds in California that although could have qualified in the end did not qualify for tax credits because they were not reported at the time of the application (and original credit allocation), generating economic activity that the state paid nothing for. Overall, however, most projects, yield lower rates of return, as the percentage of their California expenditures that qualify are higher and consequently the amount of spending in the state that comes at no cost is lower. Most of the data points fall around an ROI of between 0.6 and 1.5, with qualifying expenditures accounting for between 50 and 90 percent of the project’s total expenditures in California.
y = 0.616x-1.02 R² = 0.893
0.0
5.0
10.0
15.0
20.0
0.0% 20.0% 40.0% 60.0% 80.0% 100.0%
S/L ROI
QE as % of CA Spend
Exhibit 3-6 ROI and QE % of CA Spend

Assessing California’s Film and Television Tax Credit Program
Economic and Policy Analysis Group 11
4 Lost Opportunities: The Value of Big Budget Productions
he current tax credit program is limited to productions with budgets of $75 million or less. The exclusion of larger productions has evidently
chased large budget films to other states and nations whose tax incentive programs are more inclusionary. In its March 2014 report entitled 2013 Feature Film Production Report, FilmLA lists filming locations of productions that did not qualify for California’s film tax incentive during the past fiscal year, estimating that there were 41 live action feature films with production budgets in excess of $75 million. Of these, only two were filmed primarily in California (Hangover Part 3 and Star Trek: Into the Darkness). Another nine productions used California as a secondary location (including After Earth, The Amazing Spiderman, Django Unchained, Thor: The Dark World and The Secret Life of Walter Mitty). The remaining 30 feature films were filmed entirely outside of California, and are listed in Exhibit 4-1. The production spending associated with these projects occurred wholly outside of California. Over half of the production spending of the projects listed in Exhibit 4-1 took place outside of the United States. The competition among states in the nation may be a reshuffling of the deck chairs, when the threat to this industry in California is from overseas. This list does not include those productions that qualified for California’s program but chose to film elsewhere perhaps because they failed to receive credit allocations or because incentives offered elsewhere were sufficient to entice them. These productions would have had an economic impact as well, and they should also be considered to be lost opportunities. However, these differ from large budget productions because large budget productions do not qualify for inclusion and thus have no incentive to film in California. The aggregate spending of the production budgets of these large projects is estimated to have been $4 billion. This represents production spending that occurred outside California in this single year of big budget feature films (whether or not they were produced by independent producers). Had this spending occurred in California, it would clearly have had a sizeable impact.
Economic and Fiscal Impact To estimate the potential economic and fiscal impact of these lost opportunities, detailed production budgets of five tent-pole feature films were reviewed and analyzed. The five production budgets ranged from $150 million to $250 million and thus did not qualify for credits under California’s Film and Tax Credit program. The production budgets and qualifying expenditures of these projects are shown in Exhibit 4-2.
T Exhibit 4-1 Large Budget Live Action Films Filmed Entirely Outside of California FY2013
Principal Location
Estimated Budget
($ millions)
A Good Day to Die Hard Hungary $ 90 The Avengers New Mexico 200 Dark Shadows UK 100 Elysium Mexico 110 Ender’s Game Louisiana 110 G.I. Joe Retaliation Louisiana 125 Gravity UK 130 The Great Gatsby Australia 190 Grown Ups 2 Massachusetts 70 The Hobbit New Zealand 220 The Hobbit Part 2 New Zealand 100 Hunger Games North Carolina 75 Iron Man 3 North Carolina 200 Jack the Giant Slayer UK 190 Journey 2: Mysterious Island North Carolina 75 Man of Steel Illinois 220 Men in Black 3 New York 100 Oblivion Louisiana 140 Oz: The Great & Powerful Michigan 200 Pacific Rim Canada 190 Rock of Ages Florida 75 Snow White & the Huntsman UK 150 Skyfall UK 100 Total Recall Canada 100 Twilight: Breaking Dawn Louisiana 100 White House Down Canada 150 Wolf of Wall Street New York 100 The Wolverine Japan 100 World War Z UK 190 Wrath of Titans UK 100 TOTAL ESTIMATED PRODUCTION BUDGETS $ 4,000 Source: FilmLA

Assessing California’s Film and Television Tax Credit Program
12 Economic and Policy Analysis Group
Exhibit 4-2 Sample of Five Large Budget Films
Production Budget ($ millions)
Qualifying Expenditures1
($ millions) QE as % of CA
Spend Project A $ 245.2 $ 213.8 0.87 Project B 220.0 178.5 0.81 Project C 184.2 130.1 0.71 Project D 170.5 131.2 0.77 Project E 150.4 131.0 0.87 TOTAL $ 970.3 $ 784.6 Average 194.1 156.9 0.81 1 All qualifying expenditures identified using the worksheets provided by the CFC Source: Estimates by LAEDC
In aggregate, the five projects had total production budgets of $970 million, an average of $194 million per film. Qualifying expenditures were identified using the worksheet provided by the California Film Commission on its website (http://www.film.ca.gov/Incentives_Qual-ified_Expenditures.htm). These reached $785 million, accounting for 81 percent of total production expenditures. The total economic and fiscal impact in California of these five projects, had they been filmed in the state, was estimated and is presented in Exhibit 4-3.
Exhibit 4-3 Economic and Fiscal Impact of Five Large Budget Films Total Production Budget ($ millions): $ 970.3 Estimated Qualifying Expenditures 784.6 Total Economic Impact: Output ($ millions) $ 2,338 Employment (jobs) 11,550 Labor income ($ millions) $ 857 Total Fiscal Impact ($ millions): State and local tax revenues $ 100 Source: Estimates by LAEDC
These five projects would have generated $2.3 billion in economic activity in the state and supported 11,550 jobs with labor income of $857 million. State and local tax revenues generated by this activity would have reached $100 million stemming from these five projects alone.
These budgets are used in the following section to assess the potential of allowing such projects to apply for tax credits. Extrapolating from these results, and assuming that the budgets of other large projects are similar, the estimated economic and fiscal impact of the large budget projects that filmed entirely outside of California during the most recent fiscal year was estimated and is shown in Exhibit 4-4.
Exhibit 4-4 Total Economic and Fiscal Impact of Lost Productions Total Production Spending ($ billions): $ 4.0 Total Economic Impact: Output ($ billions) $ 9.6 Employment (jobs) 47,600 Labor income ($ billions) $ 3.5 Total Fiscal Impact ($ millions): State and local tax revenues $ 410 Source: Estimates by LAEDC
The loss of this spending in California cost the state 47,600 jobs (direct, indirect and induced) during the last fiscal year. While it may be optimistic to think that all those productions could have filmed in California, even the loss of only half of that spending cost the state a significant amount of economic activity. It is evident that the state is losing ground to other states and nations. To put the employment numbers in context, the Milken Institute reported in its February 2014 report entitled A Hollywood Exit: What California Must Do to Remain Competitive in Entertainment—and Keep Jobs that 4,500 direct jobs were added in New York, Louisiana, New Mexico, Florida and North Carolina (five states that together hosted just eleven big budget films last year) combined between 2010 and 2012, while 4,500 jobs were lost in California. Furthermore, production finance managers state that production costs, as estimated in Exhibit 4-4, are likely to have been lower than they would have been had the projects been filmed in California, thus the overall impacts may be underestimated.

Assessing California’s Film and Television Tax Credit Program
Economic and Policy Analysis Group 13
5 Alternatives to Current Program
s California’s Film and Television Tax Credit program reaches the end of its allocated funding, debate is underway whether or not to extend or
expand the program, and, if so, what changes can be made to improve the program.
Ensuring a Positive Return If California’s Film and Television Tax Credit Program generates a positive return, then the state is not “spending” tax expenditures. Rather, it is investing and earning income on its investment. In Section 3, the analysis of the completed projects in the first three years of allocated funding suggested that different types of projects and varying levels of credits produce a variety of rates of return to state and local governments. These insights may be used to structure the program to further maximize its positive return. As seen in Section 3, the largest determining factor of ROI is the percentage of production spending in California that qualifies for inclusion into tax credit calculations. The lower this percentage is, the higher is the ROI. Expenditures which do not qualify include payments for story and song rights, writers, producers, directors, cast and talent, stunt performers, and so on. The extent to which these expenditures occur in California will determine the economic impact. Highly-compensated talent and other recipients of above-the-line payments who reside in California purchase homes, personal goods such as cars, clothing, household goods, and spend on services, including entertainment, food and beverages—all of which positively impacts the regional economy. Exhibit 5-1 shows the actual relationship between the ROI of the 109 completed projects of Section 3 assuming a singular credit level (here, it is 20 percent). This relationship is even more precise than that shown in Section 3, as the level of the credit incentive has been equalized across all projects. This graph and its estimated function demonstrates that the relationship between the qualifying expenditures as a percentage of total California expenditures and the return on investment of the tax credits is quite tight and hence predictable.
Source: Estimates by LAEDC The policy implications of this are clear, although the implementation may be difficult. Using this relationship, an estimate can be derived of the minimum threshold of qualifying expenditures as a percentage of California expenditures that would be required to produce an ROI of 1 or more. To ensure a return of $1 in state and local taxes for each $1 tax credit issued: With a credit of 20 percent, qualifying expenditures
must be no more than 71 percent of all California expenditures.
With a credit of 25 percent, qualifying expenditures must be no more than 57 percent of all California expenditures.
These limits apply to California and qualifying expenditures without considering a cap on either. Because the distributional aspects of this economic activity are important, the quality or nature of California spending is of importance. It may be preferable to ensure that production spending in California is mostly allocated to below-the-line crew and workers, rather than writers and directors. The condition requiring 75 percent of production days to occur in California is an attempt to address this issue.
y = 0.6907x-1.024 R² = 0.9288
0.0
5.0
10.0
15.0
20.0
0.0% 20.0% 40.0% 60.0% 80.0% 100.0%
S/L ROI
QE as % of CA Spend
Exhibit 5-1 ROI and QE % of CA Spend A

Assessing California’s Film and Television Tax Credit Program
14 Economic and Policy Analysis Group
Altering the Tax Credit Level of Certain Projects In Section 3, the return on investment of the 109 completed and audited projects that received final tax credit certificates in the first three years of allocated funding was estimated. These credits were a combination of 20 percent (for non-independent productions and television series) and 25 percent (for independent productions and relocating television series). A variety of alternatives has been proposed, including adding percentage points to the credit based on filming location, and raising or lowering the credit on specific types of projects. To test the impacts of these alternatives, Exhibit 5-2 presents the return on investment to state and local governments for each project type based on alternative credit levels.
Exhibit 5-2 ROI If Credit Levels Were Altered
Average ROI Under Alternative Credit Rates Current
Ave ROI 20% 21% 22% 23% 24% 25% Feature film 1.12 1.12 1.07 1.02 0.98 0.94 0.90 Indie feature film 1.15 1.44 1.37 1.31 1.25 1.20 1.15 Movie of the week 0.97 0.97 0.92 0.88 0.84 0.81 0.78 Indie movie of the
week 0.83 1.04 0.99 0.94 0.90 0.87 0.83 Television 1.19 1.19 1.13 1.08 1.03 0.99 0.95 Relocating TV series 0.82 1.03 0.98 0.93 0.89 0.85 0.82 Indie mini-series 0.79 0.99 0.94 0.90 0.86 0.82 0.79 TOTAL 1.11 1.15 1.09 1.04 1.00 0.96 0.92 Source: Estimates by LAEDC
The first column in the exhibit presents the findings from Section 3 showing the estimated average ROI based on the current program incentive level (a blend of 20 percent and 25 percent). Each subsequent column shows the estimated ROI for each type of project under a different level of tax credit. For each project type, as the credit rate rises, the average ROI falls.
Segmentation The ROI on different types of productions are higher than others (see Exhibit 5-2). As the industry is an ecosystem, it is in the interests of policymakers to encourage and retain each component part, creating a blend of those that are likely to have a lower ROI with those that achieve a higher ROI. Such a program can be designed through segmentation with a balance of project types, credit levels and caps that will ensure the maximum likelihood of a return equal to or greater than its investment. For example, allocating half of the tax credits to projects with an ROI of, say 0.95 and the other half to projects with an ROI of 1.05 will also deliver an overall program ROI of 1.00.
Potential ROI of Large Budget Films Currently, productions with production budgets in excess of $75 million are not eligible to participate in the program. It has been suggested that rather than limit the overall production budget, the program could instead allow qualifying expenditures up to a given cap (such as $75 million). This may be sufficient cost advantage to enable more productions to film in California while still providing the program a level of certainty. To assess the potential ROI on the large budget productions evaluated above, credit levels of 20 percent and 25 percent are tested on qualifying expenditures capped at $75 million and $100 million. The results are shown in Exhibit 5-3. Exhibit 5-3 Potential S/L ROI of Big Budget Films
$100 million cap $75 million cap
Production
Budget ($ millions)
QE as % of CA Spend
20% Credit
25% Credit
QE as % of CA Spend
20% Credit
25% Credit
Project A $ 245.2 0.41 1.37 1.10 0.31 1.83 1.46 Project B 220.0 0.45 1.23 0.98 0.34 1.64 1.31 Project C 184.2 0.54 1.01 0.81 0.41 1.34 1.07 Project D 170.5 0.59 0.96 0.76 0.44 1.27 1.02 Project E 150.4 0.67 0.84 0.68 0.50 1.13 0.90 TOTAL $ 970.3 Average 194.1 0.52 1.08 0.87 0.39 1.44 1.15 Source: Estimates by LAEDC
These results assume that qualifying expenditures include visual effects (i.e., that these would occur in
Assessing California’s Film and Television Tax Credit Program
Economic and Policy Analysis Group 15
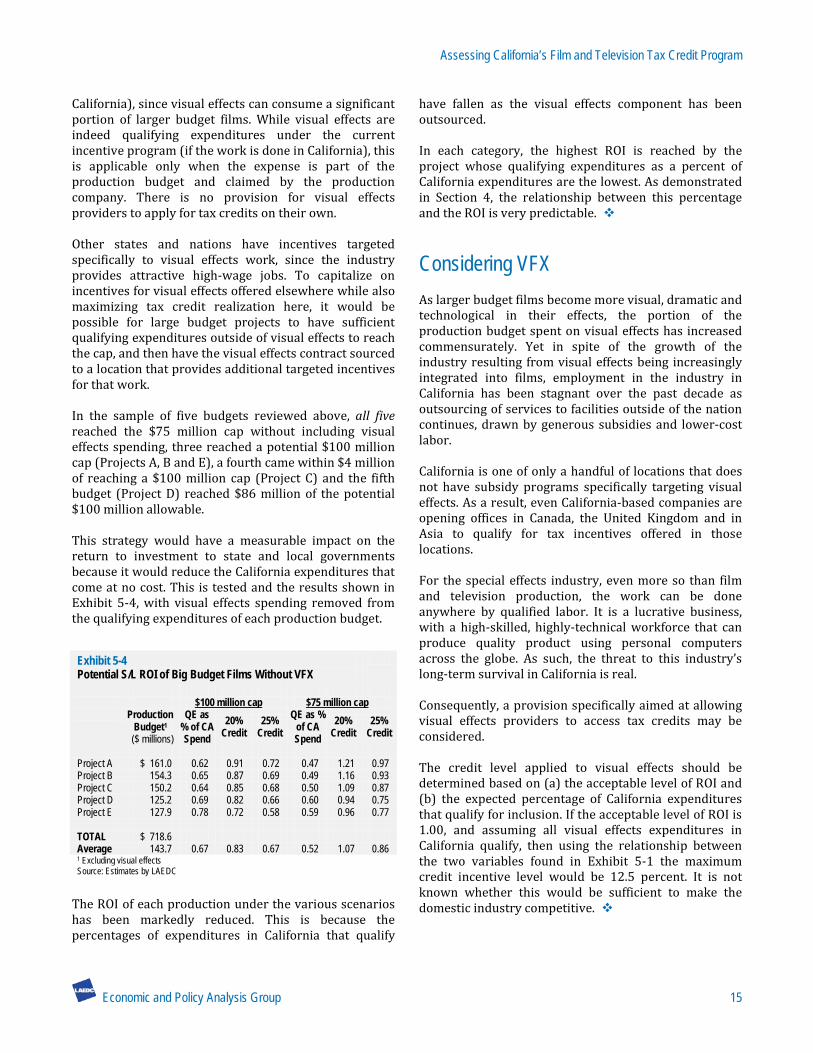
California), since visual effects can consume a significant portion of larger budget films. While visual effects are indeed qualifying expenditures under the current incentive program (if the work is done in California), this is applicable only when the expense is part of the production budget and claimed by the production company. There is no provision for visual effects providers to apply for tax credits on their own. Other states and nations have incentives targeted specifically to visual effects work, since the industry provides attractive high-wage jobs. To capitalize on incentives for visual effects offered elsewhere while also maximizing tax credit realization here, it would be possible for large budget projects to have sufficient qualifying expenditures outside of visual effects to reach the cap, and then have the visual effects contract sourced to a location that provides additional targeted incentives for that work. In the sample of five budgets reviewed above, all five reached the $75 million cap without including visual effects spending, three reached a potential $100 million cap (Projects A, B and E), a fourth came within $4 million of reaching a $100 million cap (Project C) and the fifth budget (Project D) reached $86 million of the potential $100 million allowable. This strategy would have a measurable impact on the return to investment to state and local governments because it would reduce the California expenditures that come at no cost. This is tested and the results shown in Exhibit 5-4, with visual effects spending removed from the qualifying expenditures of each production budget. Exhibit 5-4 Potential S/L ROI of Big Budget Films Without VFX
$100 million cap $75 million cap
Production
Budget1 ($ millions)
QE as % of CA Spend
20% Credit
25% Credit
QE as % of CA Spend
20% Credit
25% Credit
Project A $ 161.0 0.62 0.91 0.72 0.47 1.21 0.97 Project B 154.3 0.65 0.87 0.69 0.49 1.16 0.93 Project C 150.2 0.64 0.85 0.68 0.50 1.09 0.87 Project D 125.2 0.69 0.82 0.66 0.60 0.94 0.75 Project E 127.9 0.78 0.72 0.58 0.59 0.96 0.77 TOTAL $ 718.6 Average 143.7 0.67 0.83 0.67 0.52 1.07 0.86 1 Excluding visual effects Source: Estimates by LAEDC
The ROI of each production under the various scenarios has been markedly reduced. This is because the percentages of expenditures in California that qualify
have fallen as the visual effects component has been outsourced. In each category, the highest ROI is reached by the project whose qualifying expenditures as a percent of California expenditures are the lowest. As demonstrated in Section 4, the relationship between this percentage and the ROI is very predictable.
Considering VFX As larger budget films become more visual, dramatic and technological in their effects, the portion of the production budget spent on visual effects has increased commensurately. Yet in spite of the growth of the industry resulting from visual effects being increasingly integrated into films, employment in the industry in California has been stagnant over the past decade as outsourcing of services to facilities outside of the nation continues, drawn by generous subsidies and lower-cost labor. California is one of only a handful of locations that does not have subsidy programs specifically targeting visual effects. As a result, even California-based companies are opening offices in Canada, the United Kingdom and in Asia to qualify for tax incentives offered in those locations. For the special effects industry, even more so than film and television production, the work can be done anywhere by qualified labor. It is a lucrative business, with a high-skilled, highly-technical workforce that can produce quality product using personal computers across the globe. As such, the threat to this industry’s long-term survival in California is real. Consequently, a provision specifically aimed at allowing visual effects providers to access tax credits may be considered. The credit level applied to visual effects should be determined based on (a) the acceptable level of ROI and (b) the expected percentage of California expenditures that qualify for inclusion. If the acceptable level of ROI is 1.00, and assuming all visual effects expenditures in California qualify, then using the relationship between the two variables found in Exhibit 5-1 the maximum credit incentive level would be 12.5 percent. It is not known whether this would be sufficient to make the domestic industry competitive.

Assessing California’s Film and Television Tax Credit Program
16 Economic and Policy Analysis Group
Appendix A.1. Methodology The motion picture industry spends billions of dollars for goods and services used in production activity and for the wages and benefits of talent, producers, writers, sound engineers, direct employees and subcontractors. Most of these recipients, as well as workers up and down the supply chain, spend at least a portion of their incomes on rent, groceries, vehicle expenses, healthcare, entertainment, and so on, in the state, generating additional economic activity. Economic impact analysis is used to estimate the overall economic activity, including spill-over and multiplier impacts, which occurs as a result of a particular business or event. The total estimated economic impact includes direct, indirect and induced effects. Direct activity includes the materials purchased and the employees paid by the production company. Indirect effects are those which stem from the employment and business revenues of its direct suppliers, such as craft services, wardrobe, lighting and transportation companies. Induced effects are those generated by the spending of employees whose wages are sustained by both direct and indirect spending, and include spending on groceries, rent, vehicle expenses, healthcare, entertainment, and so on. Indirect and induced impacts are estimated using models developed with software and data from the IMPLAN Group, LLC. These models are built upon actual data of expenditure patterns that are reported to the U.S. Bureau of Labor Statistics, the U.S. Census Bureau and the Bureau of Economic Analysis of the U.S. Department of Commerce. Data is regionalized so that it reflects and incorporates local conditions such as prevailing wages rates, expenditure patterns, and resource availability and costs. The magnitude of the multiplying effect differs from one region to another depending on the extent to which the local region can fill the demand for all rounds of supplying needs. For example, the automobile manufacturing industry has high multipliers in Detroit and Indiana since these regions have deep and wide supplier networks, while the same industry multiplier in Phoenix is quite small. In another example, the jobs multiplier for the construction industry is higher in, say,
Arkansas, than in California because the same amount of spending will purchase fewer workers in Los Angeles than in Little Rock. Multipliers can also differ from year to year as relative material and labor costs change and as the production “recipe” of industries change. For example, the IT revolution significantly reduced the job multiplier of many industries (such as manufacturing, accounting, architecture and publishing) as computers replaced administrative and production workers. The metrics used to determine the value of the economic impact include employment, labor income and the value of output. Employment includes full-time, part-time, permanent and seasonal employees and the self-employed, and is measured on a job-count basis regardless of the number of hours worked. Labor income includes all income received by both payroll employees and the self-employed, including wages and benefits such as health insurance and pension plan contributions. Output is the value of the goods and services produced. For most industries, this is simply the revenues generated through sales; for others, in particular retail industries, output is the value of the services supplied.
27

Assessing California’s Film and Television Tax Credit Program
Economic and Policy Analysis Group 17
A.2. Assumptions In this analysis, as in other studies, the return on investment is calculated based on the assumption that the projects that qualified for tax incentives and received allocations would not have taken place in California in the absence of those incentives. The loss of production activity to other states and nations in response to competing incentives lends support to this assertion. Excluded from the analysis are income taxes paid by producers or talent who earn residuals or profit shares once the films are released. Also excluded is potential income tax revenues generated from the sale of tax credits to other persons or corporations. There is a temporal mismatch between the spending generated by the productions and the tax credit realization. To account for this differential, the value of the tax credits is discounted by 5.0 percent, the expected inflation for a twenty-four month period between spending and credit realization, based on the average two-year inflation rate for each allocation year since 2009.
A.3. Comparison to Earlier Study In the LAEDC’s 2011 report entitled California Film and Television Tax Credit Program: An Economic Impact Study, the estimated return on investment of productions allocated tax credits under the first two years of the program’s funding was 1.06. The findings in this report show an estimate that is 4.5 percent higher than the estimate found in the earlier study. The following factors underlie the difference in the findings of the two studies: Actual Expenditures versus Proposed Expenditures The 2011 analysis was based on proposed budgets, and projected credit allocations. The current analysis reviews finalized and audited projects, with actual spending that may have differed from the original estimates. Indeed, the 109 completed projects reported aggregated qualifying expenditures of $41.3 million over estimated (pre-audit) qualifying expenditures, an excess of 3.6 percent. Although these excess qualifying expenditures occurred, the final credit certificates were capped at the proposed level. Had qualifying expenditures fallen below those estimated pre-audit, the final tax credit certificate issued would be based on
actual qualifying expenditures and would therefore be smaller than the credit initially allocated. Credit Realization and the Time Value of Money The 2011 analysis had assumed a mismatch of spending and credit realization of 18 months, while actual realization occurs closer to 24 months after the production spending has occurred, and may be much longer. For example, the movie Moneyball, although completed and released in 2011, had still not completed its audit and been issued a tax credit certificate as of December 31, 2013, hence the realization of the tax credit at its earliest will not be until the April 2014 tax return is filed, at least three full years after most of the production spending had occurred. As of December 31, 2013, $105.2 million had been claimed against state income or franchise taxes, and $27.5 million had been claimed against sales and use taxes, for a total of $132.8 million in tax credits exercised. This accounts for less than half of the $297.8 million in tax certificates issued (of which $235.4 million in the first three years of allocated funding), and less than 23 percent of $587.1 million in credit allocations. It is clear that the realization of tax credits occurs several years after the funding has been allocated and the production spending has occurred. This means that the current ROI would likely be higher than the original analysis. On the other hand, inflation has been somewhat more moderate than forecasted in 2011. The inflation factor used in the current analysis is 5 percent over a 24-month period, which is the average of the two-year rate since 2009, and only marginally higher than the 4.5 percent rate used in the 2011 analysis. Methodological Issues In this analysis, each year of spending was analyzed using an input-output model of the same vintage. It is not clear how this would affect the ROI. The industry’s output and employment multipliers have been declining over the years. This can be the consequence of many factors, including increased labor productivity, reduced strength in backward linkages (or the supply chain), more imported goods and services by households, change in the mix of purchases in the supply chain and in the household spending patterns, and a decline in labor income over time. The models do not show a decline in the in-state purchases of the industry in its own supply chain, but there is evidence that wages have been declining and the recession has negatively impacted

Assessing California’s Film and Television Tax Credit Program
18 Economic and Policy Analysis Group
household purchasing, consequently the induced effects will be smaller in more recent years. Mix of Projects The current analysis examines completed and closed projects, whose expenditures have been audited; the original 2011 analysis was based on the proposed qualifying expenditures of 9 sample budgets extrapolated to 77 projects. The mix of projects in the first three years of funding is somewhat different than the sample of nine. In that sample, 89 percent of the aggregate qualifying expenditures were spent by feature films, 8 percent were television projects, 2 percent were independent feature films, and 1 percent was independent movies-of-the-week. While the size of the budgets were representative of the full set of projects, the sample was more heavily weighted towards non-independent feature films, which have a higher return on investment because the credit allocation is lower on this spending. It could not be known a priori the mix of projects that would unfold as the program continued, and as it turns out, even projects that are allocated tax credits may not materialize and may be replaced with other project types during the fiscal year. However, the experience of the first three years shows that qualifying expenditures of independent productions accounted for a higher percentage than in the original sample.
A.4. Study Authors Christine Cooper, Ph.D. Vice President, Economic and Policy Analysis Dr. Cooper leads the Economic and Policy Analysis Group whose work involves research in regional issues such as economic impact studies, regional industry analysis and forecasts, workforce development analysis, and issue studies related to the L.A. County Strategic Plan for Economic Development. Her fields of expertise include development economics, environmental economics, regional analysis and urban sustainability. Prior to joining the LAEDC, Dr. Cooper was a co-founder of a start-up company in Hong Kong concentrating on equity transactions software and computer accessories manufacturing, which expanded production into the special economic zone of Shenzhen, China and distributed products throughout the United States and Asia. With her business partner, she also established the first authorized Apple Computer retailer in China. She has been a lecturer at California State University, Long
Beach and at the Pepperdine Graziadio School of Business and Management. Dr. Cooper is a citizen of the United States and Canada. She earned a Bachelor of Arts in Economics from Carleton University in Ottawa, Canada, and a Ph.D. in Economics from the University of Southern California. With funding from the National Science Foundation, she earned a Graduate Certificate in Environmental Sciences, Policy and Engineering. Her current research includes industry cluster determination and performance in the regional economy, commuting and job allocation patterns, and workforce development issues. Shannon M. Sedgwick Associate Economist In her current capacity as an Associate Economist at the LAEDC, Ms. Sedgwick develops subject-specific information and data interpretation for economic impact, demographic, transportation, industry and issue studies. She performs research, data collection and organization, analysis and report preparation. Her work focuses on demographics, industry clusters and workforce development in the form of occupational analysis. Ms. Sedgwick is also proficient at conducting geospatial analysis and has experience working with IMPLAN economic modeling software. Ms. Sedgwick joined the LAEDC team in June of 2008 as an Economic Research Assistant for the Kyser Center for Economic Research. In that role she assisted both Economic Research and the Consulting Practice of the LAEDC with data collection and research, managing multiple data sets covering the State of California, Southern California, its counties and their sub-regions. In addition to writing sections of LAEDC’s Economic Forecasts, she was responsible for the “Business Scan” containing a collection of Los Angeles County economic indicators; the annual “L.A. Stats” report, containing the most frequently requested statistics for Los Angeles and its surrounding counties; and was a regular contributor to the weekly economic newsletter, “e-Edge.” Before joining the LAEDC, Ms. Sedgwick managed an industrial and steel supply company located in the Inland Empire. There she identified and targeted a diverse customer base, and analyzed product and customer patterns in the local industrial market to successfully increase revenues. A Southern California native, Ms. Sedgwick received her Bachelor of Arts in Economics from the University of Southern California (USC) with a minor in Architecture.

Assessing California’s Film and Television Tax Credit Program
Economic and Policy Analysis Group 19
She has been a member of the national and the Los Angeles Chapter of the National Association for Business Economics (NABE) since 2008. Somjita Mitra, Ph.D. Economist Somjita Mitra joined the Economic and Policy Analysis Group as an Economist in June 2013. She is involved in planning, designing and conducting research and analysis for consulting clients and local businesses and governments, as well as for LAEDC’s internal departments. Her focus is in regional analysis, economic impact studies and the industrial and occupational structure of local economies. Before joining the LAEDC, Dr. Mitra was an Economist for a local economic research and litigation consulting
company evaluating economic damages, estimating lost profits, identifying key economic issues and developing necessary analytical and empirical frameworks. Prior to this, Dr. Mitra was a Project Director for a consumer research firm in Los Angeles where she managed projects that identified and analyzed key market issues for small, local firms as well as multinational corporations. Dr. Mitra received her Bachelor of Arts in Economics and Political Science from the University of California, Los Angeles and her Master of Arts in Politics, Economics and Business as well as her Ph.D. in Economics from Claremont Graduate University. Dr. Mitra enjoys volunteering in the local community and is actively involved in both women’s welfare and animal rescue organizations.

Los Angeles County Economic Development Corporation 444 S. Flower Street, 37th Floor Los Angeles, CA 90071 (888) 4-LAEDC-1 www.LAEDC.org
Los Angeles County Economic Development Corporation 444 S. Flower Street, 37th Floor Los Angeles, CA 90071 (888) 4-LAEDC-1 www.LAEDC.org