california prison industry authority s economic impact on
TRANSCRIPT

Cal i fornia Pr ison Industr y Author i ty’ s Economic Impact on Cal i forniaFiscal Year 2012-2013
1Economic Impact Report FY 2012-13
Cal i fornia Pr ison Industr y Author i ty’ s Economic Impact on Cal i forniaFiscal Year 2012-2013
3Economic Impact Report FY 2012-13
California Prison Industry Authority’sEconomic Impact on California
Fiscal Year 2012-2013
Prepared by
Thomas R. Harris
and
George GoldmanOctober 2014
Thomas R. Harris is a Professor in the Department of Economics and Director of the University Center for Economic Development at the University of Nevada, Reno
George Goldman is an Emeritus Agricultural Economist for the University of California, Berkeley
Study Funded and Graphic Design by California Prison Industry Authority

Cal i fornia Pr ison Industr y Author i ty’ s Economic Impact on Cal i forniaFiscal Year 2012-2013
5Economic Impact Report FY 2012-13
Table of Contents
Executive Summary ...................................................................................................................................7Introduction ................................................................................................................................................9CALPIA Production .................................................................................................................................10Economic Context ....................................................................................................................................11Economic Income and Employment Concepts ........................................................................................11Economic Impacts ....................................................................................................................................14Conclusions ..............................................................................................................................................17Appendix A: Model and Data Used to Estimate Output, Employment, And Income .............................22A Review of Input-Output Analysis .........................................................................................................22Micro IMPLAN .......................................................................................................................................22Minnesota IMPLAN Group, Inc. (MIG) and IMPLAN Group, LLC ......................................................23Methods of Analysis and Source of Data .................................................................................................24References ................................................................................................................................................26
List of Tables
Table 1. CALPIA Goods and Services Produced ....................................................................................19Table 2. CALPIA Impacts on California .................................................................................................20Table 3. California State Impacts if CALPIA Vanishes ...........................................................................21
List of Figures
Figure 1. Overview of the California State Economic System ...............................................................12

Cal i fornia Pr ison Industr y Author i ty’ s Economic Impact on Cal i forniaFiscal Year 2012-2013
7Economic Impact Report FY 2012-13
This study is an update of three previous studies by Goldman et al. (1998), Goldman and Pradhan (2002), and Price et al. (2008). This analysis derives the total output, employment and labor income impacts of the California Prison Industry Authority (CALPIA) on the economy of the state of California. As a producer of goods and services, CALPIA is linked to the state economy in several ways. Most importantly, CALPIA purchases intermediate inputs (or raw materials) for further processing in its factories. This study utilizes a state of California economic model to translate these intermediate input purchases into sales by place of production so that the multiplier effect of CALPIA on the state economy can be estimated.
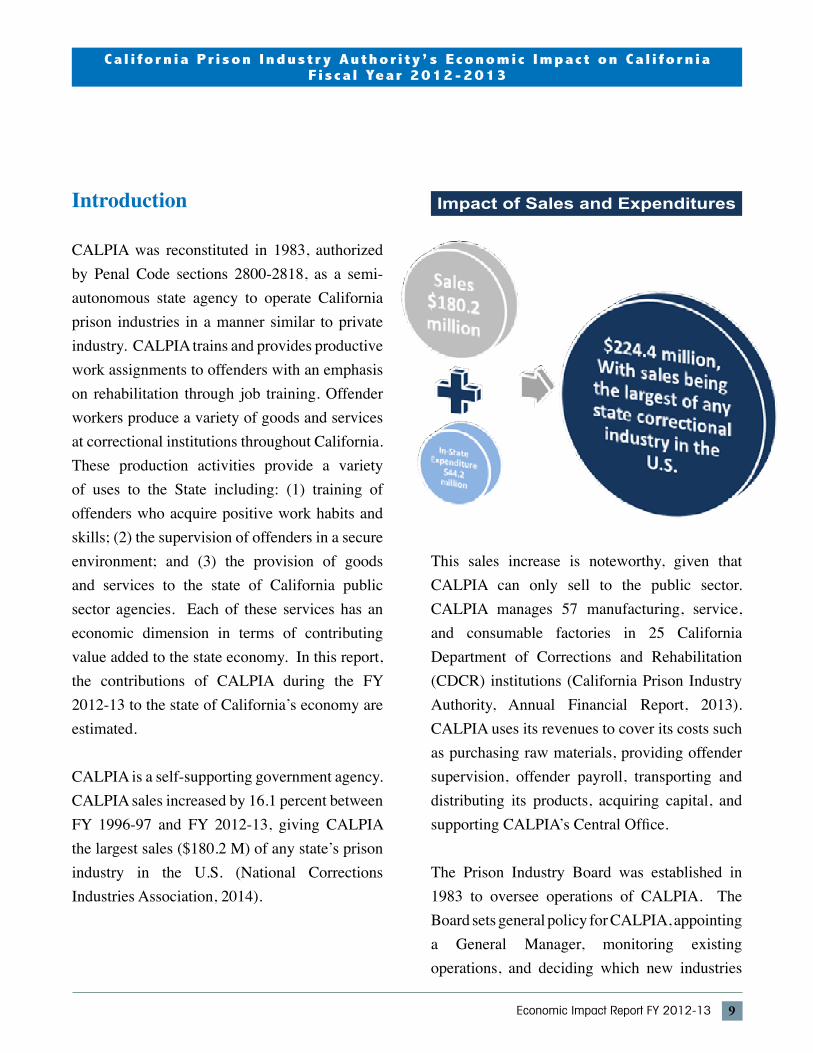
According to the National Corrections Industries Association, CALPIA for fiscal year (FY) 2012-13 had the largest sales at $180.2 million (M) of any state correctional industry in the United States.
CALPIA sales and in-state expenditures for FY 2012-13 totaled $224.4 M.
From these sales and purchases, total impacts of CALPIA activities on the economy of the state of California was $375.4 M with total labor income impact of $92.6 M, and total employment impact of 1,913.
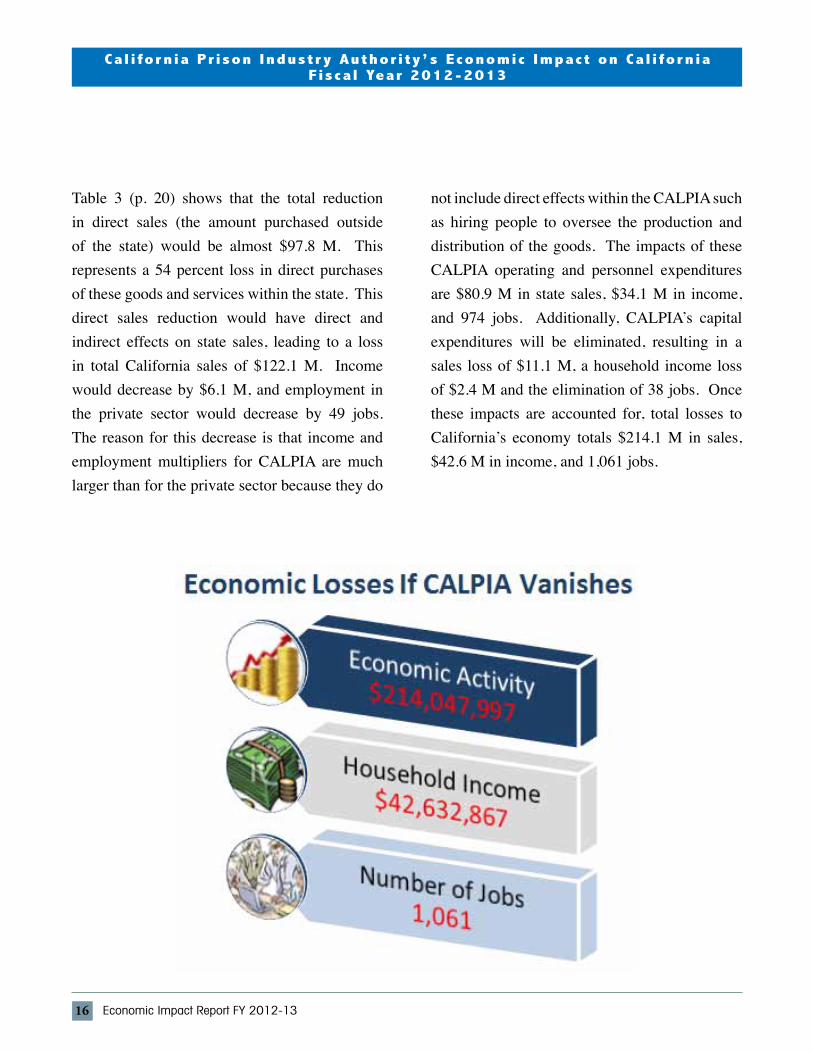
If CALPIA activities did not exist in the state of California, total economic activity would decline by $214.0 M, state household income would decline by $42.6 M with a total of 1,061 job losses statewide.
Executive Summary
l
l
l
l
Cal i fornia Pr ison Industr y Author i ty’ s Economic Impact on Cal i forniaFiscal Year 2012-2013
9Economic Impact Report FY 2012-13
Introduction
CALPIA was reconstituted in 1983, authorized by Penal Code sections 2800-2818, as a semi-autonomous state agency to operate California prison industries in a manner similar to private industry. CALPIA trains and provides productive work assignments to offenders with an emphasis on rehabilitation through job training. Offender workers produce a variety of goods and services at correctional institutions throughout California. These production activities provide a variety of uses to the State including: (1) training of offenders who acquire positive work habits and skills; (2) the supervision of offenders in a secure environment; and (3) the provision of goods and services to the state of California public sector agencies. Each of these services has an economic dimension in terms of contributing value added to the state economy. In this report, the contributions of CALPIA during the FY 2012-13 to the state of California’s economy are estimated.
CALPIA is a self-supporting government agency. CALPIA sales increased by 16.1 percent between FY 1996-97 and FY 2012-13, giving CALPIA the largest sales ($180.2 M) of any state’s prison industry in the U.S. (National Corrections Industries Association, 2014).
This sales increase is noteworthy, given that CALPIA can only sell to the public sector. CALPIA manages 57 manufacturing, service, and consumable factories in 25 California Department of Corrections and Rehabilitation (CDCR) institutions (California Prison Industry Authority, Annual Financial Report, 2013). CALPIA uses its revenues to cover its costs such as purchasing raw materials, providing offender supervision, offender payroll, transporting and distributing its products, acquiring capital, and supporting CALPIA’s Central Office.
The Prison Industry Board was established in 1983 to oversee operations of CALPIA. The Board sets general policy for CALPIA, appointing a General Manager, monitoring existing operations, and deciding which new industries
Impact of Sales and Expenditures
10 Economic Impact Report FY 2012-13
Cal i fornia Pr ison Industr y Author i ty’ s Economic Impact on Cal i forniaFiscal Year 2012-2013
to enter. The Board serves as a public hearing body charged with ensuring that the operations of CALPIA are self-sufficient. The Board actively solicits public input in its decisions with regard to expanding existing or developing new prison industries (California Prison Industry Authority, 2008).
CALPIA customers are limited to government entities, except as specified by law. CDCR is CALPIA’s largest customer, purchasing approximately 57.4 percent of all CALPIA’s total annual production of goods and services in FY 2012-13 (California Prison Industry Authority, 2013).
This study derives the total and sectoral output, employment and labor income impacts of CALPIA on the economy of the state of California. As a producer of goods and services, CALPIA is linked to the state economy in several ways. Most importantly, CALPIA purchases intermediate inputs (materials) for further processing in its factories. This study utilizes economic models of the state of California that translates these intermediate input purchases into sales by place of production so that the multiplier effect of CALPIA on the state economy can be estimated.
CALPIA Production
In FY 2012-13, CALPIA had sales of $180.2 M, a 23.0 percent decrease in nominal sales from FY 2008-09. The reasons for this decrease are twofold. One is the impact of the “Great Recession” that decreased statewide private and public sector activity. Also, the passage and signing of Senate Bill 105 and Assembly Bill 109 by Governor Brown reduced the number of CDCR offenders that utilize CALPIA products by over 35,000 offenders. CALPIA sales of laundry services, modular construction, and general fabrication were greatly impacted.
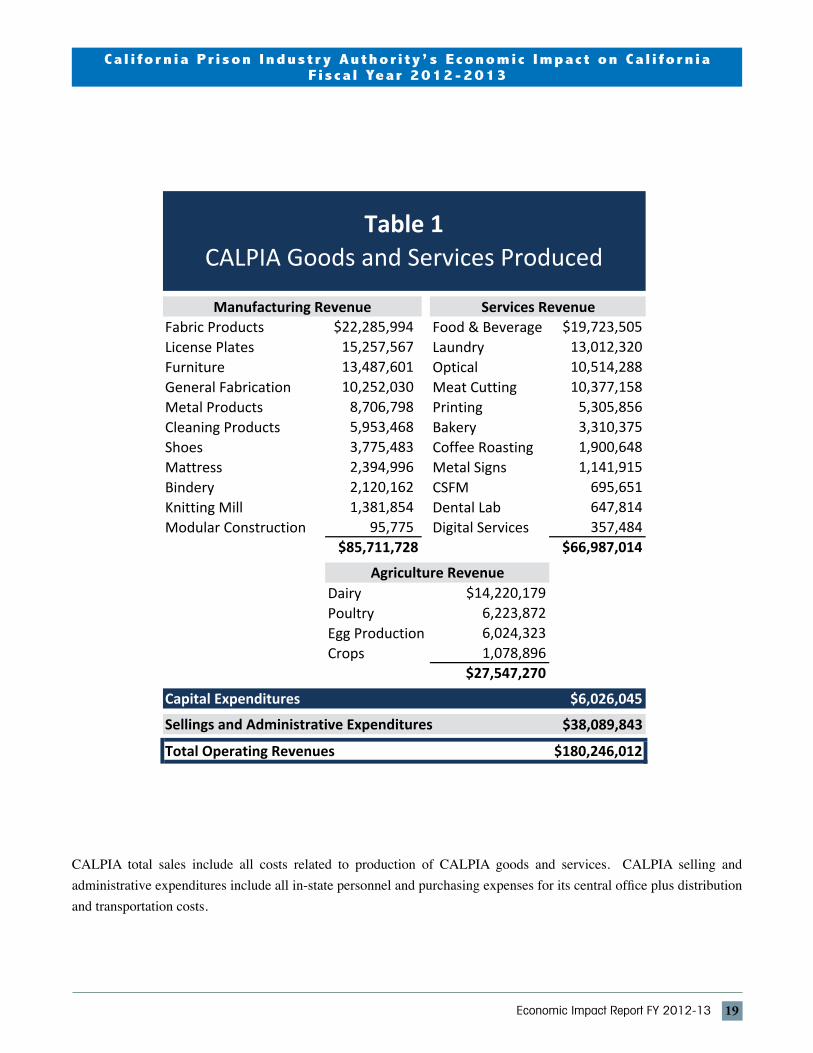
In Table 1 (p. 19), the goods and services that were produced by CALPIA and their contributions toward sales are shown. Manufacturing revenue represents the largest portion of total CALPIA revenue with $85.7 M in sales. Within Manufacturing revenue, fabric products ($22.3 M) and license plates ($15.3 M) are the largest portion of total manufacturing sales. Fabric product sales represent purchases by CAL FIRE of CALPIA’s First Defense Wildlife Firefighting garments. Also given the state’s economic recovery, automobile purchases have increased which increased license plate sales.
Services were second in sales categories with overall sales of $67.0 M. Service sales in food and beverage packaging, meat cutting, and bakery increased in FY 2012-13 due to the introduction
Cal i fornia Pr ison Industr y Author i ty’ s Economic Impact on Cal i forniaFiscal Year 2012-2013
11Economic Impact Report FY 2012-13
of pre-packaged lunches, increased juice sales and 4-pack bread sales. Because of offender population reductions, laundry services even though second highest among overall Service sales realized a decrease in sales in FY 2012-13 of 18.9%.
Lastly, Agricultural Products were third with overall sales of $27.5 M in FY 2012-13. This decrease in agricultural sales can be attributed to reductions in prison population numbers.
CALPIA selling and administrative expenses for the state totaling $38.1 M are shown in Table 1. These expenses do not include any costs related to the production of CALPIA goods and services, but include distributional and transportation costs and central office costs which include all support staff in the Central Office. During FY 2012-13, CALPIA had on average 664 civilian filled positions as well as on average 5,408 filled offender assignments. Offenders, on average, receive $0.58 per hour.
Economic Context
The economic analysis in this study takes into account the fact that prison industries hire individuals who otherwise would make no contribution to the economy of the state of California during incarceration. CALPIA offenders have zero “opportunity cost” to the
economy while making products that are sold to state agencies. An important part of the economic contribution of CALPIA production is that it captures within California all the value-added (i.e. income) in the final manufacturing stage of its products. In the absence of prison industries in California, many of the products now sold by CALPIA would be manufactured outside the state, representing a loss of material sales to California’s economy. While California vendors would receive wholesale margins for handling the goods, the margin would be less than the value-added at the final manufacturing stage since CALPIA currently captures both the value-added and the equivalent of the wholesale margin from the sales.
Part of the value-added at CALPIA goes into wage payments to employees who spend most of their income in the California economy. CALPIA’s value-added also goes into the operation of CALPIA’s program which provides offenders with job skills and develops good work habits, helping to reduce recidivism.
Economic, Income, and Employment Concepts
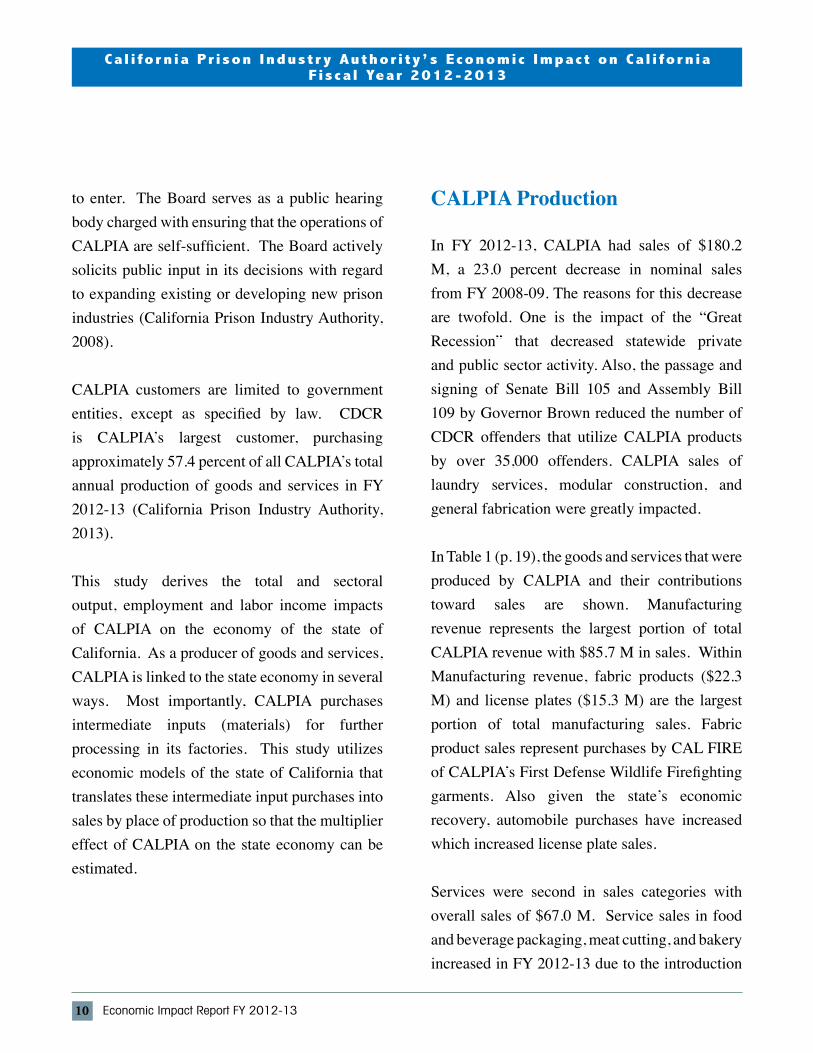
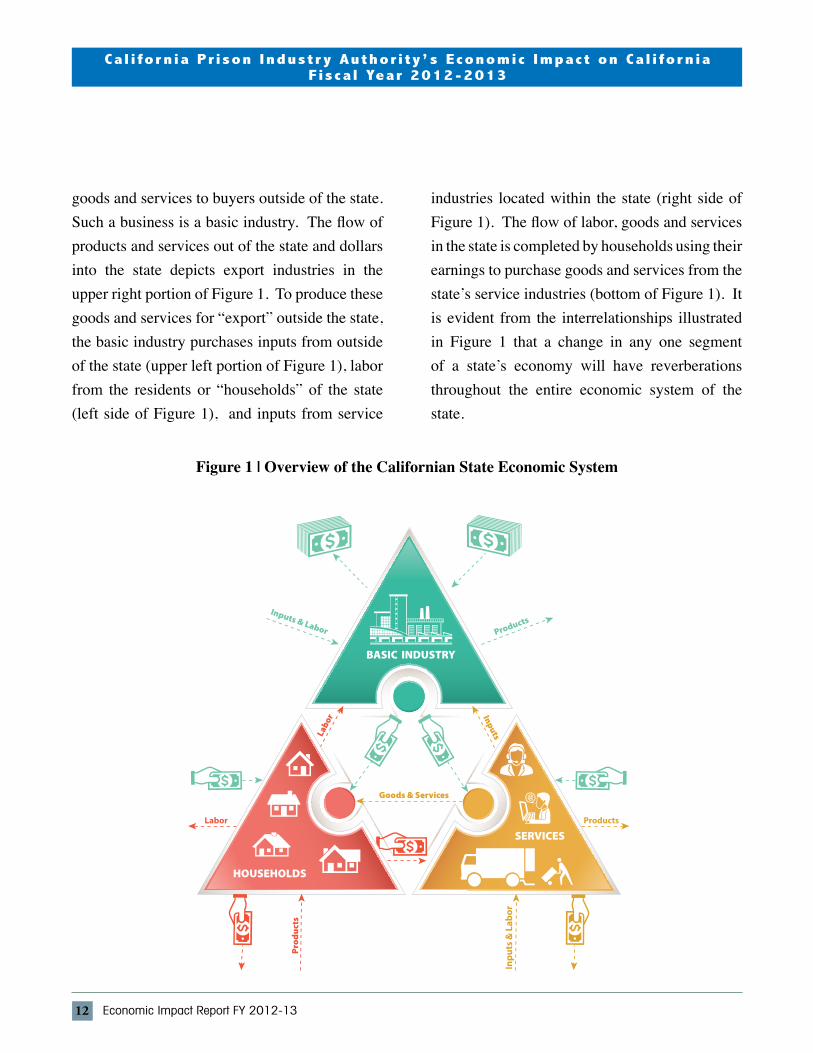
Figure 1 (p. 12) illustrates the major dollar flows of goods and services in any economy. The foundation of a state’s economy is comprised of those businesses which sell some or all of their
12 Economic Impact Report FY 2012-13
Cal i fornia Pr ison Industr y Author i ty’ s Economic Impact on Cal i forniaFiscal Year 2012-2013
goods and services to buyers outside of the state. Such a business is a basic industry. The flow of products and services out of the state and dollars into the state depicts export industries in the upper right portion of Figure 1. To produce these goods and services for “export” outside the state, the basic industry purchases inputs from outside of the state (upper left portion of Figure 1), labor from the residents or “households” of the state (left side of Figure 1), and inputs from service
BASIC INDUSTRY
HOUSEHOLDS
SERVICES
Goods & Services
Labo
r Inputs
Inpu
ts &
Lab
or
ProductsLabor
industries located within the state (right side of Figure 1). The flow of labor, goods and services in the state is completed by households using their earnings to purchase goods and services from the state’s service industries (bottom of Figure 1). It is evident from the interrelationships illustrated in Figure 1 that a change in any one segment of a state’s economy will have reverberations throughout the entire economic system of the state.
Figure 1 | Overview of the Californian State Economic System
Cal i fornia Pr ison Industr y Author i ty’ s Economic Impact on Cal i forniaFiscal Year 2012-2013
13Economic Impact Report FY 2012-13
Consider, for instance, CALPIA and its impacts on the state economy. CALPIA’s activities can be considered a service industry as it makes sales primarily to state agencies. These dollars may hire people from the local household sector such as laborers in CALPIA. However, most of the local economic linkages are from CALPIA’s purchasing goods from the service sectors. These include service and retail businesses. As earnings increase in these businesses, they will hire additional people and buy more inputs from other businesses. Thus the change in the economic activity of CALPIA works its way throughout the entire local economy.
The total impact of a change in the economy consists of direct, indirect and induced impacts. Direct impacts are the changes in the activities of the impacting industry, such as the operations by CALPIA. The impacting business, such as CALPIA, changes its purchases of inputs as a result of the direct impact. This produces an indirect impact in the state’s business sectors. Both the direct and indirect impacts change the flow of dollars to the state’s households. The state households alter their consumption accordingly. The effect of this change in state household consumption upon businesses in a county is referred to as an induced impact. A measure is needed that yields the effects created by an increase or decrease in economic activity. In economics, this measure is called the multiplier effect.
In this study, the impact of CALPIA is analyzed under two scenarios. In the first scenario, the economic impacts of CALPIA products and services on the economy of California are estimated. This includes its impact on state product, income and employment. In the second scenario, the impact if the CALPIA was removed and the same goods and services were purchased from the private sector is calculated. Both analyses are based on sales figures of CALPIA’s goods and services for FY 2012-13 that were provided by CALPIA.
Economic impacts are measured in terms of (1) total California output/sales impacts (direct, indirect and induced effects), (2) total California income impacts (only indirect and induced effects), and (3) total employment impacts (only indirect and induced effects). The direct effect occurs when the CALPIA produces and sells goods and services. The indirect effect occurs when CALPIA purchases materials and supplies from distributors and manufacturers in the state. The induced effect occurs as workers in in-state industries that supply materials to CALPIA receive incomes that are then spent on consumer goods and services produced in the region. Together, these three effects make up the total effect. An input-output model measures these direct, indirect, and induced effects to assess their total impact on the economy.
This model does not include the induced effects
14 Economic Impact Report FY 2012-13
Cal i fornia Pr ison Industr y Author i ty’ s Economic Impact on Cal i forniaFiscal Year 2012-2013
of CALPIA sales on the economy’s total sales, since prisoners do not spend their income in the local economy as a resident would. In addition, the direct effects of CALPIA sales on income and employment are not included since it is not possible to know how much offender income is spent in the community. However it is acknowledged that offenders do spend their money on buying goods at institutional canteen, send money to family members for personal consumption, and upon release on parole spend their savings.
Economic Impacts
In this section, the output, employment, and household income impacts of CALPIA on the California economy are presented. CALPIA operates in twenty-five (25) CDCR institutions throughout California. The state impacts reflect those output, employment, and household income impacts arising from production of goods and services in those facilities.
The analysis in this study examines two scenarios. The first is the impact of CALPIA sales in the state of California. This is equivalent to asking the question: “What would be the impact if instead of purchasing goods and services from CALPIA, the public sector were to purchase them all from sources outside of the region?” This reflects the most common way of analyzing the economic impact of an industry.
The second scenario is to look at the impact of removing CALPIA and purchasing the same goods and services from the most likely private sources, either within or outside the borders of the state of California. This is equivalent to asking the question: “If CALPIA were to vanish, where would the same goods and services be purchased, and what would this impact be?” In this case, some of the goods and services will be purchased within the state, while some will be purchased from out-of-state businesses. Because the goods and services will continue to be purchased by the private sector within the state, the impact of eliminating CALPIA sales will be smaller than the total impact of the first scenario. The larger the proportion of products produced outside the state, the greater will be the negative impact of removing CALPIA.
In Table 2 (p. 19), the second column of figures shows the state sales for each sector in FY 2012-13. The third through fifth column figures show the multiplier effects of CALPIA sales as discussed in the previous section. The impacts of CALPIA’s capital expenditures and selling and administrative expenditures are included at the bottom of the table to account for the expenditures and employment impacts of CALPIA. Total direct CALPIA sales are $180.2 M. Since CALPIA purchases inputs from private firms, total multiplier effects (direct and indirect) are a total of $283.5 M of cumulative sales in the state. The indirect and induced
Cal i fornia Pr ison Industr y Author i ty’ s Economic Impact on Cal i forniaFiscal Year 2012-2013
15Economic Impact Report FY 2012-13
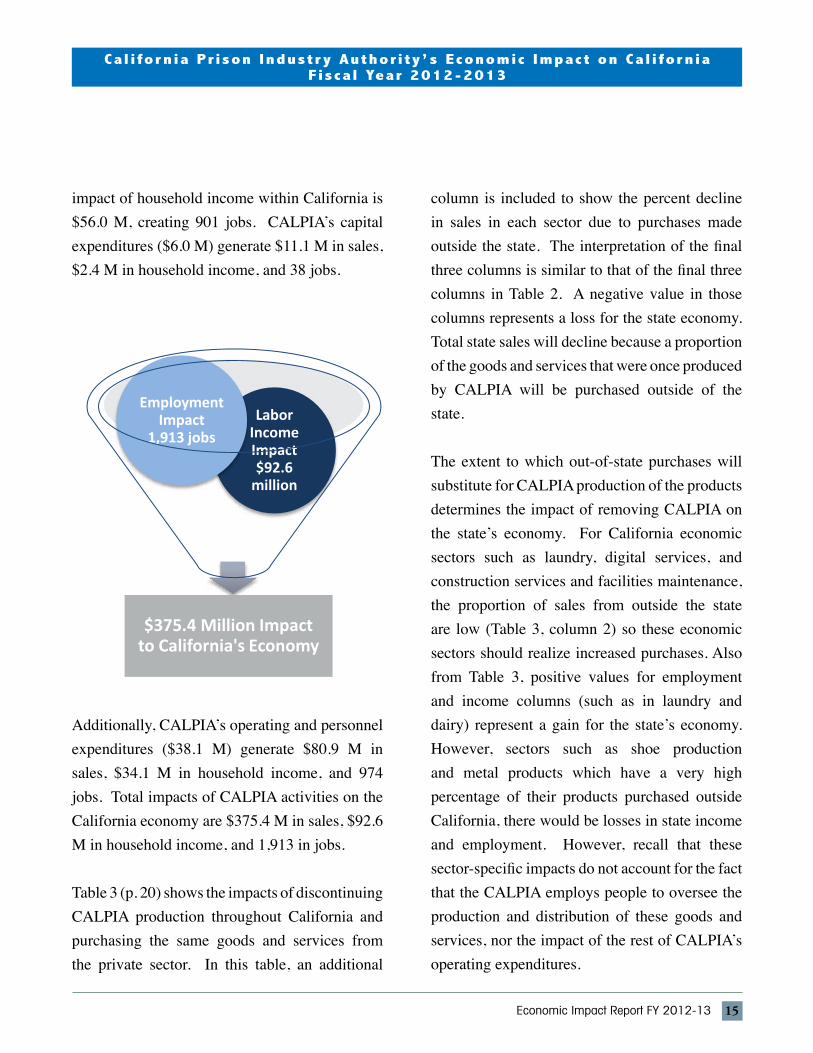
impact of household income within California is $56.0 M, creating 901 jobs. CALPIA’s capital expenditures ($6.0 M) generate $11.1 M in sales, $2.4 M in household income, and 38 jobs.
$375.4 Million Impact to California's Economy
Labor Income Impact $92.6
million
Employment Impact
1,913 jobs
Additionally, CALPIA’s operating and personnel expenditures ($38.1 M) generate $80.9 M in sales, $34.1 M in household income, and 974 jobs. Total impacts of CALPIA activities on the California economy are $375.4 M in sales, $92.6 M in household income, and 1,913 in jobs.
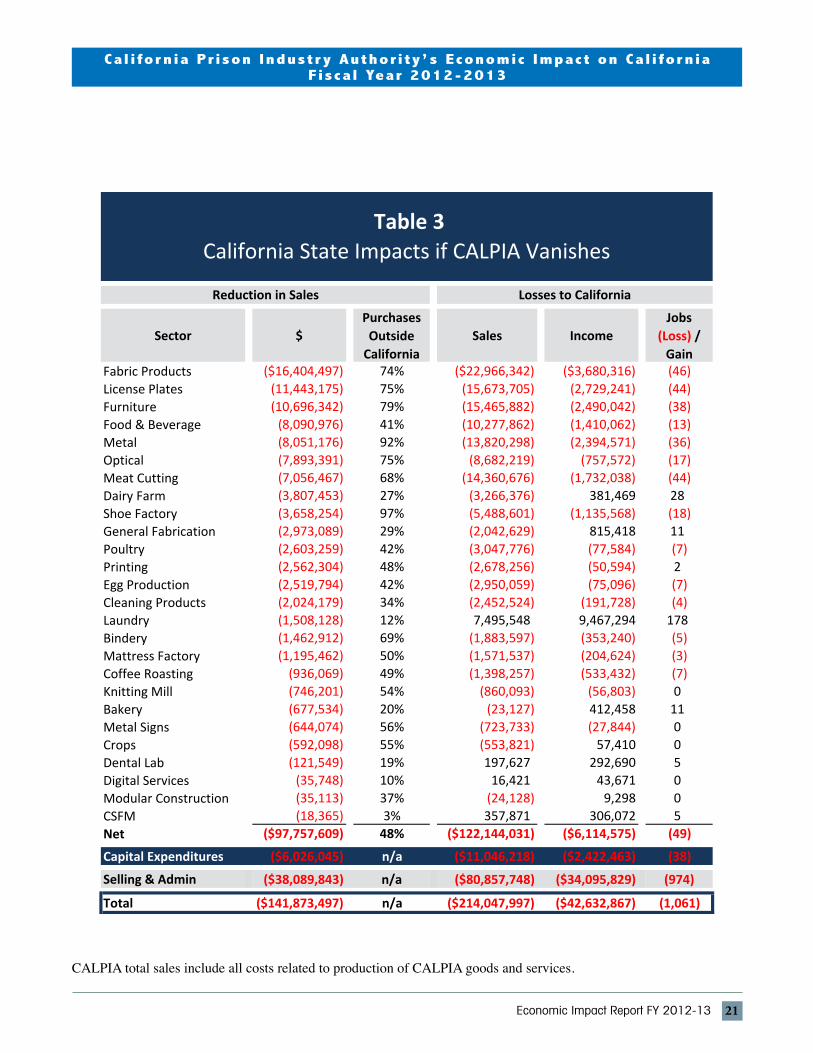
Table 3 (p. 20) shows the impacts of discontinuing CALPIA production throughout California and purchasing the same goods and services from the private sector. In this table, an additional
column is included to show the percent decline in sales in each sector due to purchases made outside the state. The interpretation of the final three columns is similar to that of the final three columns in Table 2. A negative value in those columns represents a loss for the state economy. Total state sales will decline because a proportion of the goods and services that were once produced by CALPIA will be purchased outside of the state.
The extent to which out-of-state purchases will substitute for CALPIA production of the products determines the impact of removing CALPIA on the state’s economy. For California economic sectors such as laundry, digital services, and construction services and facilities maintenance, the proportion of sales from outside the state are low (Table 3, column 2) so these economic sectors should realize increased purchases. Also from Table 3, positive values for employment and income columns (such as in laundry and dairy) represent a gain for the state’s economy. However, sectors such as shoe production and metal products which have a very high percentage of their products purchased outside California, there would be losses in state income and employment. However, recall that these sector-specific impacts do not account for the fact that the CALPIA employs people to oversee the production and distribution of these goods and services, nor the impact of the rest of CALPIA’s operating expenditures.
16 Economic Impact Report FY 2012-13
Cal i fornia Pr ison Industr y Author i ty’ s Economic Impact on Cal i forniaFiscal Year 2012-2013
Table 3 (p. 20) shows that the total reduction in direct sales (the amount purchased outside of the state) would be almost $97.8 M. This represents a 54 percent loss in direct purchases of these goods and services within the state. This direct sales reduction would have direct and indirect effects on state sales, leading to a loss in total California sales of $122.1 M. Income would decrease by $6.1 M, and employment in the private sector would decrease by 49 jobs. The reason for this decrease is that income and employment multipliers for CALPIA are much larger than for the private sector because they do
not include direct effects within the CALPIA such as hiring people to oversee the production and distribution of the goods. The impacts of these CALPIA operating and personnel expenditures are $80.9 M in state sales, $34.1 M in income, and 974 jobs. Additionally, CALPIA’s capital expenditures will be eliminated, resulting in a sales loss of $11.1 M, a household income loss of $2.4 M and the elimination of 38 jobs. Once these impacts are accounted for, total losses to California’s economy totals $214.1 M in sales, $42.6 M in income, and 1,061 jobs.

Cal i fornia Pr ison Industr y Author i ty’ s Economic Impact on Cal i forniaFiscal Year 2012-2013
17Economic Impact Report FY 2012-13
Conclusions
CALPIA is a self-supporting government agency and has the largest sales of any prison industry in the nation. The total economic impacts of CALPIA on California’s economy are $375.4 M with total employment impacts of 1,913 jobs and $92.6 M in household income.
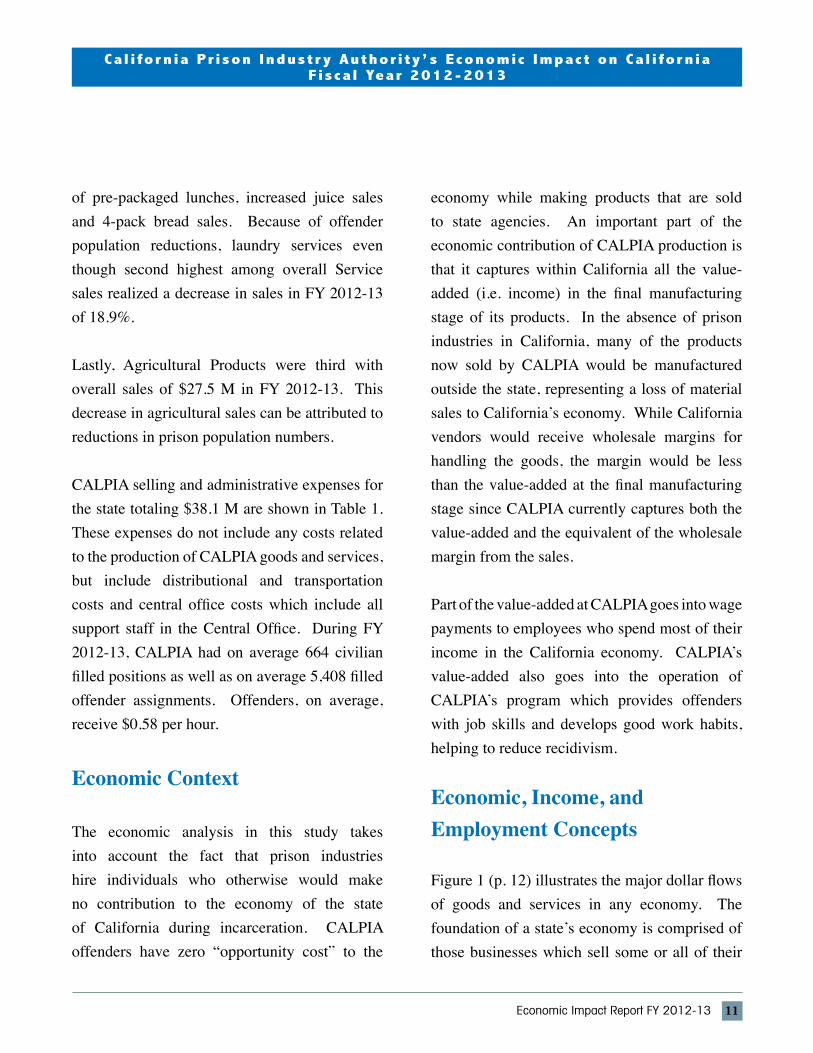
Not only are there economic, labor income, and employment impacts from activities of CALPIA, there are potential cost savings to the state of California from reduced recidivism of CALPIA parolees. Over a three year period beginning in FY 2008-09, CALPIA participants returned to prison on average 26 to 38 percent less often than
offenders released from the general population of CDCR (California Prison Industry Authority, 2013). In addition if a CALPIA offender partici-pated in the Career Technical Education (CTE) Programs, they cumulatively from FY 2007-08 to FY 2010-11 have a recidivism rate of 7.13% (California Prison Industry Authority, 2012). This translates from FY 2007-08 to 2010-11 a net saving of $9.5 M to state and local govern-ments in the state of California (California Prison Industry Authority, 2012). As stated in the Cali-fornia Prison Industry Authority study (2012): “Reducing recidivism is essential for improving the safety of California, reducing justice resource costs and improving the well-being of individual offenders”.
26-38%
$9.5 M
Recidivism
State Savings
18 Economic Impact Report FY 2012-13
Cal i fornia Pr ison Industr y Author i ty’ s Economic Impact on Cal i forniaFiscal Year 2012-2013
Tables and Appendices
Cal i fornia Pr ison Industr y Author i ty’ s Economic Impact on Cal i forniaFiscal Year 2012-2013
19Economic Impact Report FY 2012-13
Fabric Products $22,285,994 Food & Beverage $19,723,505License Plates 15,257,567 Laundry 13,012,320Furniture 13,487,601 Optical 10,514,288General Fabrication 10,252,030 Meat Cutting 10,377,158Metal Products 8,706,798 Printing 5,305,856Cleaning Products 5,953,468 Bakery 3,310,375Shoes 3,775,483 Coffee Roasting 1,900,648Mattress 2,394,996 Metal Signs 1,141,915Bindery 2,120,162 CSFM 695,651Knitting Mill 1,381,854 Dental Lab 647,814Modular Construction 95,775 Digital Services 357,484
$85,711,728 $66,987,014
Dairy $14,220,179Poultry 6,223,872Egg Production 6,024,323Crops 1,078,896
$27,547,270
Capital Expenditures $6,026,045
Sellings and Administrative Expenditures $38,089,843
Total Operating Revenues $180,246,012
Agriculture Revenue
Manufacturing Revenue
Table 1CALPIA Goods and Services Produced
Services Revenue
CALPIA total sales include all costs related to production of CALPIA goods and services. CALPIA selling and administrative expenditures include all in-state personnel and purchasing expenses for its central office plus distribution and transportation costs.

20 Economic Impact Report FY 2012-13
Cal i fornia Pr ison Industr y Author i ty’ s Economic Impact on Cal i forniaFiscal Year 2012-2013
CALPIA total sales include all costs related to production of CALPIA goods and services. CALPIA selling and administrative expenditures include all in-state personnel expenses for its central office plus distribution and transportation costs.
Sales IncomeNumber of Jobs
Fabric Products $22,285,994 $33,592,266 $6,295,538 97Food & Beverage 19,723,505 35,745,361 7,931,381 120License Plates 15,257,567 23,744,291 5,898,057 95Dairy Farm 14,220,179 20,145,723 2,934,562 44Furniture 13,487,601 20,509,956 3,676,198 57Laundry 13,012,320 14,758,762 4,388,449 77Optical 10,514,288 12,777,095 2,106,982 34Meat Cutting 10,377,158 22,694,472 3,326,536 79General Fabrication 10,252,030 16,265,397 3,145,777 49Metal 8,706,798 15,159,768 2,687,186 40Poultry 6,223,872 9,909,486 1,787,036 26Egg Production 6,024,323 9,591,770 1,729,740 25Cleaning Products 5,953,468 9,744,625 1,459,491 20Printing 5,305,856 8,943,593 1,841,754 30Shoe Factory 3,775,483 5,713,299 1,205,839 19Bakery 3,310,375 5,700,420 1,286,613 20Mattress Factory 2,394,996 3,911,692 770,706 12Bindery 2,120,162 3,288,096 925,379 15Coffee Roasting 1,900,648 3,587,776 929,721 13Knitting Mill 1,381,854 1,936,970 332,806 6Metal Signs 1,141,915 1,777,090 441,426 7Crops 1,078,896 1,488,563 353,829 6CSFM 695,651 1,062,434 269,008 4Dental Lab 647,814 874,070 244,214 4Digital Services 357,484 404,357 40,659 1Modular Construction 95,775 153,900 38,967 1
$180,246,012 $283,481,232 $56,047,854 901
Capital Expenditures $6,026,045 $11,046,218 $2,422,463 38
Operating & Personnel $38,089,843 $80,857,748 $34,095,829 974
Total $224,361,900 $375,385,198 $92,566,146 1,913
Table 2CALPIA Impacts on California
Impacts on CaliforniaSector
Sales and Expenditures
Cal i fornia Pr ison Industr y Author i ty’ s Economic Impact on Cal i forniaFiscal Year 2012-2013
21Economic Impact Report FY 2012-13
CALPIA total sales include all costs related to production of CALPIA goods and services.
Sector $Purchases Outside California
Sales IncomeJobs
(Loss) / Gain
Fabric Products ($16,404,497) 74% ($22,966,342) ($3,680,316) (46)License Plates (11,443,175) 75% (15,673,705) (2,729,241) (44)Furniture (10,696,342) 79% (15,465,882) (2,490,042) (38)Food & Beverage (8,090,976) 41% (10,277,862) (1,410,062) (13)Metal (8,051,176) 92% (13,820,298) (2,394,571) (36)Optical (7,893,391) 75% (8,682,219) (757,572) (17)Meat Cutting (7,056,467) 68% (14,360,676) (1,732,038) (44)Dairy Farm (3,807,453) 27% (3,266,376) 381,469 28Shoe Factory (3,658,254) 97% (5,488,601) (1,135,568) (18)General Fabrication (2,973,089) 29% (2,042,629) 815,418 11Poultry (2,603,259) 42% (3,047,776) (77,584) (7)Printing (2,562,304) 48% (2,678,256) (50,594) 2Egg Production (2,519,794) 42% (2,950,059) (75,096) (7)Cleaning Products (2,024,179) 34% (2,452,524) (191,728) (4)Laundry (1,508,128) 12% 7,495,548 9,467,294 178Bindery (1,462,912) 69% (1,883,597) (353,240) (5)Mattress Factory (1,195,462) 50% (1,571,537) (204,624) (3)Coffee Roasting (936,069) 49% (1,398,257) (533,432) (7)Knitting Mill (746,201) 54% (860,093) (56,803) 0Bakery (677,534) 20% (23,127) 412,458 11Metal Signs (644,074) 56% (723,733) (27,844) 0Crops (592,098) 55% (553,821) 57,410 0Dental Lab (121,549) 19% 197,627 292,690 5Digital Services (35,748) 10% 16,421 43,671 0Modular Construction (35,113) 37% (24,128) 9,298 0CSFM (18,365) 3% 357,871 306,072 5Net ($97,757,609) 48% ($122,144,031) ($6,114,575) (49)
Capital Expenditures ($6,026,045) n/a ($11,046,218) ($2,422,463) (38)
Selling & Admin ($38,089,843) n/a ($80,857,748) ($34,095,829) (974)
Total ($141,873,497) n/a ($214,047,997) ($42,632,867) (1,061)
Losses to CaliforniaReduction in Sales
Table 3California State Impacts if CALPIA Vanishes
22 Economic Impact Report FY 2012-13
Cal i fornia Pr ison Industr y Author i ty’ s Economic Impact on Cal i forniaFiscal Year 2012-2013
Appendix:
Model and Data Used to Estimate Output, Employment and Income MultipliersA computer spreadsheet that uses state IMPLAN (Impact Analysis for Planning) multipliers was developed to enable estimation of the primary and secondary impacts of CALPIA on the California economy. A complete overview and review of input-output modeling and its applications are presented in Miller and Blair (2009). A brief review of input- output analysis and IMPLAN are presented below.
A Review of Input-Output AnalysisInput-output (I/O) was designed to analyze the transactions among the industries in an economy (Miernyk, 1965). These models are largely based on the work of Wassily Leontief (1936). Detailed I/O analysis captures the indirect and induced interrelated circular behavior of the economy. For example, an increase in the demand for CALPIA goods and services requires more equipment, more labor, and more supplies, which, in turn, requires more labor to produce the supplies, etc. By simultaneously accounting for structural interaction between sectors and industries, I/O analysis portrays a general
economic equilibrium system. The analysis utilizes assumptions based on linear and fixed coefficients and limited substitutions among inputs and outputs. The analysis also assumes that average and marginal I/O coefficients are equal. Nonetheless, the framework has been widely accepted and used (Miller and Blair, 2009). I/O analysis is useful when carefully executed and interpreted in defining the structure of a state economy, the interdependencies among industries, and forecasting economic outcomes.
The I/O model coefficients describe the structural interdependence of an economy. From the coefficients, various predictive factors can be computed, which can be useful in analyzing economic changes in the state of California. Multipliers indicate the relationship between some observed change in the economy and the total change in economic activity created throughout the economy.
MicroIMPLANMicroIMPLAN is a computer program developed by the United States Forest Service (Alward, et al., 1989) to construct I/O accounts and models. Typically, the complexity of I/O modeling has hindered

Cal i fornia Pr ison Industr y Author i ty’ s Economic Impact on Cal i forniaFiscal Year 2012-2013
23Economic Impact Report FY 2012-13
practitioners from constructing models specific to a community requesting an analysis. Too often, inappropriate national multipliers have been used to estimate local economic impacts. In contrast, IMPLAN can construct a model for any county, region, state, or zip code area in the United States by using available state, county, and zip code level data. Impact analysis can be performed once a regional I/O model is constructed. For this analysis, data to develop an I/O model of the state of California was used.
Five different sets of multipliers are estimated by IMPLAN, corresponding to five measures of regional economic activity. These are: total industry output, personal income, total income, value added, and employment. The total impact of a change in the economy consists of direct, indirect, and induced impacts. Direct impacts are the changes in the activities of the impacting industry such as the additional production or sales of CALPIA products and/or services. The increased purchases of inputs by the CALPIA as a result of the direct impact are the indirect impact on the business sectors.
Two types of multipliers are generated. Type I multipliers measure the impact in terms of
direct and indirect effects. However, the total impact of a change in the economy consists of direct, indirect, and induced changes. Both the direct and indirect impacts change the flow of dollars of California’s households. Subsequently, the households alter their consumption accordingly. The effect of the changes in household consumption on businesses in a community is referred to as an induced effect. To measure the total impact, a Type II multiplier is used. The Type II multiplier compares direct, indirect, and induced effects with the direct effects generated by a change in final demand sales (the sum of direct, indirect, and induced divided by direct).
IMPLAN also estimates a modified Type II multiplier, called a Type SAM multiplier that also includes the direct, indirect, and induced effects. The Type SAM multiplier further modifies the induced effect to include spending patterns of households based on a breakdown of households by nine difference household income groups.
Minnesota IMPLAN Group, Inc. (MIG) and IMPLAN Group, LLCDr. Wilbur Maki at the University of Minnesota utilized the input/output model
Cal i fornia Pr ison Industr y Author i ty’ s Economic Impact on Cal i forniaFiscal Year 2012-2013
24 Economic Impact Report FY 2012-13
Cal i fornia Pr ison Industr y Author i ty’ s Economic Impact on Cal i forniaFiscal Year 2012-2013
and database work from the U. S. Forest Service’s Land Management Planning Unit in Fort Collins to further develop the methodology and to expand the data sources. Scott Lindall and Doug Olson joined the University of Minnesota in 1984 and worked with Dr. Maki and the model.
As an outgrowth of their work with the University of Minnesota, Lindall and Olson entered into a technology transfer agreement with the University of Minnesota that allowed them to form MIG. At first, MIG focused on database development and provided data that could be used in the Forest Service version of the software. In 1995, MIG took on the task of writing a Version 2 of the IMPLAN software. This new version extended the previous Forest Service version by creating an entirely new modeling system that included creating Social Accounting Matrices (SAMs) – an extension of input-output accounts, and resulting SAM multipliers (Minnesota IMPLAN Group, Inc., 2000). In 2009, Version 3 of the IMPLAN software was released (Minnesota IMPLAN Group, Inc., 2010). This version of IMPLAN added the capability of multi-regional analysis to the IMPLAN microcomputer model. Finally, Minnesota IMPLAN Group, Inc.
was purchased by IMPLAN Group, LLC and relocated to Hunterville, North Carolina. For more information concerning the IMPLAN data and microcomputer model contact the IMPLAN Group, LLC at their website which is www.implan.com.
Methodology and Data Sources
The IMPLAN microcomputer input-output (I-O) model of the California economy was used to estimate the statewide economic impacts of CALPIA. An I-O model measures the multiplier effects of economic activities through a complex set of accounts that track the circular flow of expenditure and income in the economy. The data in the I-O model consist of three major categories of economic transactions: (1) interindustry sales and purchases of intermediate inputs, (2) final payments by industries to in-state labor, in-state owners of capital, various levels of government, and out-of-state producers and owners of capital, and (3) commodity purchases by households and governments plus inventory changes, investment and exports. These three categories contain all the data necessary to estimate multiplier effects in the economy.
Cal i fornia Pr ison Industr y Author i ty’ s Economic Impact on Cal i forniaFiscal Year 2012-2013
25Economic Impact Report FY 2012-13
The California I-O data and accounts used in this study were prepared by IMPLAN (IMPLAN Group, LLC, 2014). These accounts are based on numerous federal government data series including County Business Patterns, the Employment Security (ES202) series, the quinquennial national I-O accounts, and the Regional Economic Information System (REIS). The REIS data are derived from economic censuses (Manufactures, Retail, Agriculture, Governments, etc.) conducted by the U.S. Bureau of the Census, the Gross State Product series, and various other statistical series.
The I-O accounts record California’s transactions with the state, the rest of the nation, and the rest of the world. This information is essential for accurately estimating economic multipliers since the size of the multiplier is determined by the pattern of trade. The impact of replacing purchases from CALPIA with purchases
from the private sector is determined by the potential of the private sector within the state to substitute CALPIA in producing the products. This potential is represented by the regional purchase coefficient (RPC), which estimates the proportion of the state’s demand for specific products and services that will be met within the state. Sectoral RPC’s are derived from the IMPLAN software (Olson and Lindall, 2004). Using (1-RPC), the proportion of demand in the private sector in the state that will be met by businesses located outside the state of California. If the state has greater capacity to supply the demand for goods or services in a particular sector, the RPC will be close to one, and the sectoral impact of removing CALPIA will be small. On the other hand, if alternative suppliers of the goods or services are not readily available in the state, the regional RPC will be close to zero, and removing CALPIA will have a much larger negative economic impact on the state’s economy.
26 Economic Impact Report FY 2012-13
Cal i fornia Pr ison Industr y Author i ty’ s Economic Impact on Cal i forniaFiscal Year 2012-2013
ReferencesAlward, G., E. Sivertz, D. Olson, J. Wagner, D. Serf, and S. Lindall. Micro IMPLAN Software Manual. University
of Minnesota Press: Stillwater, MN, 1989.
California Prison Industry Authority. “California Prison Industry Authority Report to the Legislative FY 2012-2013.” California Prison Industry Authority: Folsom, CA, 2013.
California Prison Industry Authority. California Prison Industry Authority. Web. 2008.
California Prison Industry Authority. “Career Technical Education (CTE) Programs FY 2007-2008 to FY 2010-2011.” California Prison Industry Authority: Folsom, CA, 2012.
Goldman, G., B. McWilliams, and V. Pradhan. “The Economic Impact of Production in California’s Prison Industry.” Department of Agricultural and Resource Economics: University of California, Berkeley, 1998.
Goldman, G. and V. Pradhan. “The Economic Impact of California’s Prison Industries.” Department of Agricultural and Resource Economics: University of California, Berkeley, 2002.
IMPLAN Group, LLC. “IMPLAN System (Data and Software),” Huntsville, North Carolina, 2014.
Leontief, W. “Quantitative Input-Output Relations in the Economic System of the United States.” Review of Economics and Statistics. 18(1936): 105-125.
Miernyk, W.H. The Element of Input-Output Analysis. Random House: New York, NY, 1965.
Miller, R. and P. Blair. Input-Output Analysis: Foundations and Extension, 2nd Edition. Cambridge University Press: New York, 2009.
Minnesota IMPLAN Group, Inc., User’s Guide, Analysis Guide, Data Guide: IMPLAN Professional Version 2.0 Social Accounting and Impact Analysis Software, 2nd Edition, June 2000.
Minnesota IMPLAN Group, Inc. Version 3.0 User’s Guide. Minnesota IMPLAN Group, Inc: Stillwater, MN, 2010.
National Corrections Industries Association. “2014 National Corrections Industry Association Directory.” Baltimore, MD, 2014.
Olson, D. and S. Lindall. IMPLAN Professional Version 2.0: User Group, Analysis Guide, and Data Guide, 3rd Edition. Hudson, WI, 2004.
Price, S., T. Harris, and G. Goldman. “The Economic Impact of Production by the Californian Prison Industry Authority on the California Economy.” Department of Resource Economics: University of Nevada, Reno, August 2008.

B
1 Dairy2 Crops3 Poultry4 Egg Production5 Meat Cutting6 Bakery7 Coffee Roasting8 Food & Beverage Packing9 Metal Products10 Furniture11 License Plates12 Laundry13 Digital Services14 Optical15 Dental lab16 Cleaning Products17 Printing18 Metal Signs19 Mattress20 Fabric Products21 Knitting Mill22 Shoes23 Bindery
24 Construction Services Facilities Maintenance
25 General Fabrication/Century26 Support Services27 On Time Delivery Center28 Modular Building
CALPIA Enterprise Key*
ABRV INSTITUTION NAME ENTERPRISES*1 PBSP Pelican Bay State Prison 12, 242 CCC California Correctional Center 243 HDSP High Desert State Prison 24
4 FSP Folsom State Prison 9, 11, 13, 17, 18, 24, 26, 28
5 SAC California State Prison, Sacramento 12, 246 CMF California Medical Facility 24
7 SOL California State Prison, Solano 9, 12, 14, 23, 24, 26
8 MCSP Mule Creek State Prison 5, 7, 12, 20, 24, 26
9 SQ California State Prison, San Quentin 10, 19, 24, 2610 CHCF California Health Care Facility 2411 SCC Sierra Conservation Center 20, 2412 DVI Deuel Vocational Institution 1, 24, 2613 CCWF Central California Women’s Facility 2, 15, 20, 24, 2614 VSP Valley State Prison 12, 14, 24, 2615 CTF Correctional Training Facility 10, 20, 24, 2616 SVSP Salinas Valley State Prison 2417 PVSP Pleasant Valley State Prison 2418 COR California State Prison, Corcoran 1, 8, 12, 24, 2619 SATF Substance Abuse Treatment Facility 8, 24
20 ASP Avenal State Prison 3, 4, 10, 12, 24, 25, 26
21 NKSP North Kern State Prison 2422 WSP Wasco State Prison 12, 2423 KVSP Kern Valley State Prison 24
24 CMC California Men’s Colony 12,17, 20, 21, 22, 24, 26
25 CCI California Correctional Institution 20, 24, 26
26 LAC California State Prison, Los Angeles County 12, 16, 24, 26
27 CIM California Institution for Men 8, 12, 24, 2628 CIW California Institution for Women 20, 2429 CRC California Rehabilitation Center 2430 CVSP Chuckawalla Valley State Prison 12, 2431 ISP Ironwood State Prison 2432 CAL Calipatria State Prison 2433 CEN Centinela State Prison 20, 2434 RJD RJ Donovan Correctional Facility 6, 12, 22, 24, 26
Adult Institutions (see key)
ABRV INSTITUTION NAME CITY
1 NAC N.A. Chaderjian Youth Correctional Facility Stockton
2 OHC O.H. Close Youth Correctional Facility Stockton3 VYCF Ventura Youth Correctional Facility Camarillo
Juvenile Institutions
Career Technical Education (CTE) Program Key*
CALPIA Central Office
560 East Natoma StreetFolsom, CA 95630-2200
CDCR HeadquartersDepartment of Corrections and Rehabilitation1515 “S” StreetSacramento, CA 95814
Career Technical Education Locations (CTE)
Enterprises & Career Technical Education Locations (CTE)
Institution Map.indd July 3, 2014 14:01
DEL NORTE
SISKIYOU MODOC
HUMBOLDT
TRINITY SHASTA LASSEN
MENDOCINO
TEHAMA
GLENN
LAKECOLUSA
BUTTE
PLUMAS
SIERRA
YUBA
NEVADA
PLACER
EL DORADO
SUTTER
SONOMA
MARIN
YOLO
SOLANO
CONTRACOSTA
NAPA
ALAMEDA
SANJOAQUIN
SAN M
ATEO SANTA CLARA
STANISLAUS
ALPINEAMADOR
CALAVERAS
SACRAMENTO
TUOLUMNE
MONO
MARIPOSA
MERCED MADERASANTA CRUZ
SAN BENITO FRESNO
TULAREKINGS
MONTEREY
SAN LUIS OBISPO
SANTA BARBARA
VENTURA
KERN
INYO
SAN BERNARDINO
LOS ANGELES
RIVERSIDE
IMPERIALSAN DIEGO
ORANGE
El CentroSan Diego
BlytheNorco
Riverside
Chino
Lancaster
Ventura
San Luis ObispoTehachapi
Delano
Wasco
Soledad
Avenal
CoalingaCorcoran
Chowchilla
Jamestown
Stockton
Tracy
JacksonVacaville
SacramentoFolsom
Crescent City
Susanville
Calipatria32
30 31
33
28 29
27
34
26
3
22
21 23
25
24
20
1719 18
13 14
16
15
11
12
1 29
8
76
54
10
2 3
1
1 2
3
4
1 Pre-Apprentice Carpentry2 Pre-Apprentice Construction Labor3 Pre-Apprentice Iron Worker4 Marine Technology5 Facilities Maintenance6 Computer-Aided Design7 Computer Coding
ABRV INSTITUTION NAME CTE PROGRAM*1 FSP Folsom State Prison 1, 2, 32 FWF Folsom Women’s Facility 1, 2, 5, 6, 73 CIM California Institution for Men 4 4 CIW California Institution for Women 2
LOCATION
San Rafael

November 26, 2014 1:57 PM 03 PIB
California Prison Industry Authority • 560 East Natoma Street, Folsom CA 95630-2200 • calpia.ca.gov
www.facebook.com/CALPIA