california environmental protection agency state water resources
TRANSCRIPT

STATE OF CALIFORNIAGray Davis, Governor
CALIFORNIA ENVIRONMENTAL PROTECTION AGENCYWinston H. Hickox, Secretary
STATE WATER RESOURCES
CONTROL BOARDP.O. Box 100Sacramento, CA 95812-0100
(916) 341-5250
Edward Anton, Acting Executive Director
Tom Howard, Deputy Director
Homepage: http://www.swrcb.ca.gov
11/00
Peter S. Silva, Member
Arthur G. Baggett, Jr., Acting Vice Chair
John Brown, Member
Mary Jane Forster, Member

STATE MUSSEL WATCH PROGRAM
1995-97
DATA REPORT
Prepared ByDel Rasmussen
Division of Water Quality
State Water Resources Control BoardCalifornia Environmental Protection Agency

ii
ACKNOWLEDGEMENTS
The State Water Resources Control Board wishes to acknowledge the
contributions of the following individuals to the 1995-97 State Mussel
Watch Program:
Department of Fish and GameMoss Landing and Water Pollution Control Laboratories
Project Director: Mark Stephenson
Field Support: Gary Ichikawa
Jon Goetzl
Laboratory Support: Dave Crane
Autumn Bonnema
James McCall
Abdou Mekebri
Gary Munoz
Kim Paulson
Mark Pranger
Kathleen Regalado
Laurie Smith
State Water Resources Control Board
Graphic Support: Dale Oliver

iii
TABLE OF CONTENTS
Page
Acknowledgements............................................................iiList of Appendices..........................................................ivList of Tables..............................................................viList of Abbreviations......................................................vii
1. STATE MUSSEL WATCH PROGRAM 1995 - 1997Introduction...........................................................1Summary................................................................1
2. FIELD AND LABORATORY OPERATIONS...................................4Substances Measured....................................................4Sample Size and Collection.............................................4Dry, Wet, and Lipid Weight Measurements................................5
3. ADMINISTRATIVE AND COMPARATIVE CRITERIA .........................7FDA Action Levels and NAS Guidelines...................................7Maximum Tissue Residue Levels (MTRLs)..................................8Median International Standards (MIS)
for Trace Elements ..................................................8Elevated Data Levels (EDLs)............................................9
4. LITERATURE CITED....................................................22

iv
LIST OF APPENDICES
Page
Appendix A - Maps Showing 1995-97 Station Locations ......................A-1
Appendix B - 1995-97 Sampling Stations - Latitude and Longitude ..........B-1
Appendix C - 1995-97 Sample Information ..................................C-1
Appendix D - Station Sampling History ....................................D-1
Appendix E - Summary of 1995-97 Data: Organic ChemicalsExceeding Selected Criteria (ppb, wet weight) ...............E-1
Appendix F - Summary of 1995-97 Data: Organic Chemicals ExceedingMaximum Tissue Residue Levels (MTRLs) in Ocean Waters(ppb, wet weight) ...........................................F-1
Appendix G - Summary of 1995-97 Data: Organic Chemicals ExceedingMaximum Tissue Residue Levels (MTRLs) in EnclosedBays and Estuaries (ppb, wet weight) ........................G-1
Appendix H - Summary of 1995-97 Data: Trace Elements Exceeding theMedian International Standards (MIS)(ppm, wet weight) ...........................................H-1
Appendix I - Summary of 1995-97 Data: Trace ElementsExceeding Elevated Data Levels (EDLs)(ppm, wet weight) ...........................................I-1
Appendix J - Summary of 1995-97 Data: Trace Elements in Mussel,Clam, Oyster, Shore Crab, and Sand Worm(ppm, wet weight) ...........................................J-1
Appendix K - Summary of 1995-97 Data: Trace Elements in Mussel,Clam, Oyster, Shore Crab, and Sand Worm(ppm, dry weight) ...........................................K-1
Appendix L - Summary of 1995-97 Data: Trace Elements in Sediment(ppm, dry weight) ...........................................L-1
Appendix M - Summary of 1995-97 Data: Organic Chemicals in Mussel,Clam, Oyster, Shore Crab, and Sand Worm(ppb, wet weight) ...........................................M-1
Appendix N - Summary of 1995-97 Data: Organic Chemicals in Mussel,Clam, Oyster, Shore Crab, and Sand Worm(ppb, dry weight) ...........................................N-1
Appendix O - Summary of 1995-97 Data: Organic Chemicals in Mussel,Clam, Oyster, Shore Crab, and Sand Worm(ppb, lipid weight) .........................................O-1

v
LIST OF APPENDICES (continued)
Page
Appendix P - Summary of 1995-97 Data: Organic Chemicals in Sediment(ppm, dry weight) ...........................................P-1
Appendix Q - Summary of 1995-97 Data: PAHs in Mussel,Oyster, Abalone Jingle, Shore Crab, and Sand Worm(ppb, wet weight) ...........................................Q-1
Appendix R - Summary of 1995-97 Data: PAHs in Mussel,Oyster, Abalone Jingle, Shore Crab, and Sand Worm(ppb, dry weight) ...........................................R-1
Appendix S - Summary of 1995-97 Data: PAHs in Mussel,Oyster, Abalone Jingle, Shore Crab, and Sand Worm(ppb, lipid weight) .........................................S-1
Appendix T - Summary of 1995-97 Data: PAHs in Sediment(ppb, dry weight) ...........................................T-1
Appendix U - Field and Laboratory Operations .............................U-1
Appendix V - Median International Standards ..............................V-1
Appendix W - Elevated Data Levels ........................................W-1

vi
LIST OF TABLES
Table 1 - NAS Guidelines and FDA Action Levels forToxic Chemicals in Shellfish (wet weight) ..................... 10
Table 2 - Maximum Tissue Residue Levels (MTRLs) ForCarcinogens in Ocean Waters ................................... 11
Table 3 - Maximum Tissue Residue Levels (MTRLs) inEnclosed Bays and Estuaries ................................... 12
Table 4 - Median International Standards for TraceElements (edible portion, ppm, wet weight) .................... 13
Table 5 - State Mussel Watch Program EDL 85 and EDL 95 forTrace Elements in California Mussels (Mytilus californianus)Calculated Using 1977-1997 Data (ppm, wet weight) ............. 14
Table 6 - State Mussel Watch Program EDL 85 and EDL 95 forTrace Elements in Bay Mussels (Mytilus edulis)Calculated Using 1977-1997 Data (ppm, wet weight) ............. 15
Table 7 - State Mussel Watch Program EDL 85 and EDL 95 forTrace Elements in Freshwater Clams (Corbicula fluminea)Calculated Using 1977-1997 Data (ppm, wet weight) ............ 16
Table 8 - State Mussel Watch Program EDL 85 and EDL 95 for Organic Chemicals in Resident California Mussels(Mytilus californianus) Calculated Using 1977-1997 Data(ppb, wet weight) ............................................. 17
Table 9 - State Mussel Watch Program EDL 85 and EDL 95 forOrganic Chemicals in Transplanted California Mussels(Mytilus californianus) Calculated Using 1977-1997 Data(ppb, wet weight) ............................................. 18
Table 10 - State Mussel Watch Program EDL 85 and EDL 95 for Organic Chemicals in Resident Bay Mussels (Mytilus edulis)Calculated Using 1977-1997 Data (ppb, wet weight) ............. 19
Table 11 - State Mussel Watch Program EDL 85 and EDL 95 forOrganic Chemicals in Resident Freshwater Clams(Corbicula fluminea) Calculated Using 1977-1997 Data(ppb, wet weight) ............................................ 20
Table 12 - State Mussel Watch Program EDL 85 and EDL 95 for Organic Chemicals in Transplanted Freshwater Clams(Corbicula fluminea) Calculated Using 1977-1997 Data(ppb, wet weight) ............................................ 21

vii
LIST OF ABBREVIATIONS
DDD DichlorodiphenyldichloroethaneDDE DichlorodiphenyldichloroethyleneDDT DichlorodiphenyltrichloroethaneDDMS DichlorodiphenylmonochlorosaturatedethaneDDMU DichlorodiphenylmonochlorounsaturatedethaneDFG Department of Fish and Game, California
EDL(s) Elevated Data Level(s)
USFDA or FDA United States Food and Drug Administration
HCH Hexachlorocyclohexane
MIS(s) Median International Standard(s)MTRL(s) Maximum Tissue Residue Level(s)
NAS National Academy of Sciences
PAH(s) Polynuclear Aromatic Hydrocarbon(s)PCB(s) Polychlorinated Biphenyl(s)PCP PentachlorophenolPCT Polychlorinated Terphenylppb Parts Per Billion (ng/g)ppm Parts Per Million (µg/g)
RWQCB(s) Regional Water Quality Control Board(s)
SMWP State Mussel Watch Program
SWRCB State Water Resources Control Board
TCP TetrachlorophenolTBT Tributyltin
USEPA United States Environmental Protection Agency

1
1. STATE MUSSEL WATCH PROGRAM1995 - 1997
Introduction
The California State Mussel Watch Program (SMWP), initiated in 1977 by the
State Water Resources Control Board (SWRCB), was organized to provide a
uniform statewide approach to the detection and evaluation of toxic
substances in the waters of California's bays, harbors, and estuaries. This
is accomplished through the analysis of resident and transplanted mussels and
clams. The SMWP primarily targets areas with known or suspected impaired
water quality and is not intended to give an overall water quality
assessment. The SWRCB provides funding to the California Department of Fish
and Game (DFG) under an ongoing interagency agreement for the collection and
analysis of SMWP samples. Sampling stations are selected primarily by the
six coastal Regional Water Quality Control Boards (RWQCBs), which are
identified on the inside back cover.
The DFG reports sampling results to the SWRCB, which distributes the
information to the coastal RWQCBs and to other federal, State, and local
agencies through annual preliminary data reports. These preliminary data
reports are also routinely transmitted to the Office of Environmental Health
Hazard Assessment of the California Environmental Protection Agency, which
has responsibility for issuing sport fish and shellfish consumption
advisories if needed. This is the formal report presenting the results of
the 1995-96 and 1996-97 sampling and analysis programs. Some 1994-95 data
not previously reported are also included in this report.
Information collected in the SMWP is used by the SWRCB, RWQCBs, and other
agencies to identify waters impacted by toxic pollutants. Through the
SWRCB's statewide Water Quality Assessment, SMWP results are used to help
classify water bodies from good to impaired water quality relative to each
other. SMWP results are also used in the normal regulatory activities of the
RWQCBs and other State agencies such as the Department of Pesticide
Regulation.
Summary
Appendix A shows map locations for sampling stations included in this report.
Appendix B contains station location information such as latitude and

2
longitude, county, and the region. A total of 51 samples (44 stations) were
collected and analyzed in 1995-96, and 57 samples (54 stations) were
collected and analyzed in 1996-97 (Appendix C). Six archive samples
(5 stations) collected from San Francisco Bay in 1981 and 1982 were analyzed
in 1996-97 (Appendix C). Also included in this report are PAH data from
16 samples (7 stations) collected in 1994-95 and not previously reported
(Appendix C). These 16 samples from 1994-95 and 18 PAH samples from 1995-96
were analyzed under the SWRCB’s Bay Protection and Toxic Cleanup Program
(BPTCP). Samples analyzed under the BPTCP, from Regions 1 and 2, are
identified in Appendix C. Sample analysis includes trace elements (metals),
organic chemicals (pesticides and PCBs), and polynuclear aromatic
hydrocarbons (PAHs).
Of the 130 samples included in this report 87 are California mussel (Mytilus
californianus) samples, 67 transplanted and 20 resident mussel samples. Ten
samples were resident bay mussels (Mytilus edulis) from Regions 1, 2, 4, and
9. Freshwater clams (Corbicula fluminea) were analyzed from four waterbodies
(seven samples) from Region 2. One oyster sample (Crassostrea gigas) was
analyzed from the Mad River Slough in Region 1. Three new sample types
were analyzed under the BPTCP in Region 1. Five shore crab samples
(Pachygrapsus crassipes) were collected from Arcata Bay and Humboldt Bay.
Three Sand Worm samples (Glycera spp.) and one Abalone Jingle (Pododesmus
cepio) were also collected from Humboldt Bay. In addition to tissue
analysis, sixteen sediment samples were analyzed from Region 1 and 2. A
complete station sampling history of the SMWP from 1978 to 1997 is provided
in Appendix D.
Wet weight tissue results were compared to the following criteria: U.S. Food
and Drug Administration (FDA) criteria, Maximum Tissue Residue Levels
(MTRLs), Median International Standards (MISs), and Elevated Data Levels
(EDLs). Data were not compared to the National Academy of Sciences (NAS)
recommended guidelines for predator protection since freshwater clams were
only analyzed for trace metals not included in the NAS guidelines for
shellfish. A discussion of each criterion can be found in Section 3,
Administrative and Comparative Criteria, on Page 6. The MTRL criterion was
developed from water quality objectives from the 1997 California Ocean Plan
(SWRCB 1997) and the from the California Toxic Rule (40 CFR Part 131, May 18,
2000) as established in the Policy for Implementation of Toxics Standards for
Inland Surface Waters, Enclosed Bays, and Estuaries of California
(SWRCB 2000).
3
Only one sample exceeded FDA criteria (Appendix E). Transplanted California
mussels collected in 1997 from San Diego Bay/Harbor Island/East Basin/Storm
Drain contained 6,741 ppb PCBs, which exceeded the FDA tolerance level of
2,000 ppb for PCBs. This station has periodically exceeded the FDA level for
PCBs since 1982. The 1997 PCB concentration is by far the highest level
found at this station at more than 1.5 times higher than the previous high of
3,792 ppb found in 1982. MTRL criteria for ocean waters were exceeded in
17 samples from 11 stations (Appendix F). MTRLs for enclosed bays and
estuaries were exceeded in 59 samples from 45 stations (Appendix G) including
all six archive samples from five stations in Region 2. The MIS for trace
elements were exceeded in 59 samples from 51 stations (Appendix H). Samples
exceeding EDLs for trace elements and organic chemicals can be found in
Appendices I and E.
Tabular summaries of all chemistry data are provided in Appendices J through
T. Summaries of all trace element data in tissue are provided in Appendix J
(wet weight) and Appendix K (dry weight). Trace element data in sediment are
contained in Appendix L (dry weight). Summaries of all organic chemical data
in tissue are provided in Appendix M (wet weight), Appendix N (dry weight),
and Appendix O (lipid weight). Organic chemical data in sediment are
contained in Appendix P (dry weight). PAH data summaries in tissue can be
found in Appendix Q (wet weight), Appendix R (dry weight), and Appendix S
(lipid weight). PAH data in sediment are contained in Appendix T
(dry weight).

4
2. FIELD AND LABORATORY OPERATIONS
The presence of many toxic substances in the State's waters is determined by
analyzing tissues from aquatic organisms. Concentrations of these substances
in water are often too low or transitory to be reliably detected through the
more traditional methods of analysis of water samples. Also, many toxic
substances are not water soluble, but can be found associated with sediment
or organic matter. Aquatic organisms are sampled because they bioaccumulate
and bioconcentrate toxic substances to levels which may be many hundreds of
times the levels actually in the water. This concentration factor
facilitates detection of toxic pollutants. Mussels are excellent subjects
for this purpose because they (1) are sessile, (2) are long-lived, (3) can be
successfully transplanted to and maintained in areas where they do not
naturally occur, and (4) readily concentrate toxic pollutants from the water.
The following is a general overall discussion of field and laboratory
procedures. A detailed discussion is provided in Appendix U.
Substances Measured
Samples are regularly analyzed for up to 13 trace elements (Table U-1) and
approximately 45 synthetic organic chemicals including pesticides and PCBs
(Table U-4). Not every sample is analyzed for all trace elements or organic
chemicals. Each sample at each station is handled individually. The RWQCBs
will specify the type of analysis for each sample. The following are
analyzed on a request basis only: arsenic, nickel, selenium, polynuclear
aromatic hydrocarbons (PAHs), pentachlorophenol (PCP), and tetrachlorophenol
(TCP), and tributyltin (TBT).
Sample Size and Collection
Forty-five mussels or clams are composited and analyzed for organic
chemicals. Three analytical replicates of 15 individuals each of mussels or
clams are analyzed for trace elements (trace element results reported herein
are mean values). Concentrations in bivalves of certain trace elements and
organic chemicals can be directly correlated with several variables such as
size of the animal, location of habitation within the tidal zone, and season
of collection (Stephenson et al. 1987). In the SMWP, mussels of 55 to 65 mm
in length are collected whenever possible in order to reduce size-related
effects. In an attempt to minimize variability introduced by location of

5
collection within the intertidal zone, mussels are collected from the highest
point in the zone where adequate numbers occur.
Mussels are transplanted where a suitable resident population does not exist
and where sampling can be accomplished using scuba equipment. One of the
following three mussel transplant systems is used in the SMWP; 1) A bottom
anchored submerged buoy system in an area of deep water and no structures;
2) A polypropylene line which may be tied between two pilings or a line hung
beneath a dock in areas with structures (i.e. pilings, floating docks, etc.);
3) Samples may be placed on PVC or wooden stakes that are pounded into the
substrate in areas of shallow water. A two month transplant period is
adequate in most cases where pollutant uptake rates are expected to be high,
but for trace elements in less contaminated environments a six month interval
may be necessary for an adequate sample (Stephenson et al. 1980). A four to
six month transplant interval is used for organic chemicals to be consistent
with transplant periods for trace elements. Transplanted mussels
(M. californianus) were collected from Trinidad Head and Bodega Head.
Dry, Wet, and Lipid Weight Measurements
Metal data are presented in parts per million (ppm) while organic chemical
data are presented in parts per billion (ppb). Tissue concentrations of
trace elements and organic chemicals are measured on a dry weight basis to
reduce data variability due to moisture content. Wet and lipid weight basis
data are back calculated from dry weight and lipid measurements. Wet weight
basis data are used to compare to wet weight or fresh weight criteria listed
in this report (see Section 3, Administrative and Comparative Criteria). In
addition, organic chemicals are expressed on a lipid weight basis. Lipid
weight measurements offer several advantages. Because chlorinated
hydrocarbons are much more soluble in lipids (fat tissues) than in water,
they partition into lipid-rich tissues of aquatic organisms (Stout and
Beezhold 1981). Animals with higher proportions of lipid in their tissue
usually have higher concentrations of chlorinated hydrocarbon pollutants
(Phillips 1980). Factors such as season, water temperature, health of the
organism, stress on the organism, and type of species can affect the lipid
levels of samples collected for analysis and can, therefore, cause
variability in results. Use of lipid weight basis measurements may reduce
this source of variability, although disadvantages have also been noted
(Phillips 1980). As a result, lipid weight based values may represent a more
realistic measure of environmental availability of chlorinated hydrocarbons

6
than wet weight based values. Wet weight based measures, however, remain
the preferred data for most readers because all criteria for human health and
for predator protection are based on wet weight based measures. Also, wet
weight based measures better reflect the exposure of predators or humans to
the actual concentration in fresh mussels or clams.

7
3. ADMINISTRATIVE AND COMPARATIVE CRITERIA
In this report the term "criteria" is used to refer to the criteria against
which a particular trace element or organic chemical is being compared. More
than one criterion may apply to any one metal or organic compound. Human
health-related criteria, FDA action levels, Maximum Tissue Residue Levels
(MTRLs), and Median International Standards (MISs) are considered more
important or critical. Following human health criteria are NAS guidelines
for predator protection and Elevated Data Levels (EDLs). All five criteria
are discussed below.
In interpreting the SMWP data by any of the criteria provided, it is
important to note that there is no simple relationship between concentrations
of toxic substances observed in tissue samples and actual concentrations in
water. Different aquatic organisms tend to bioaccumulate a given toxic
substance in water to different levels; however, these differences usually
do not prevent a general interpretation of the data. It should also be noted
that the limited number of samples obtained and analyzed at each station in a
single year is generally too small to provide a statistically sound basis for
making absolute statements on toxic substance concentrations. The values
reported herein should be accepted as indicators of relative levels of toxic
pollution in water, and not as absolute values. In this sense, trends over
time and ranking values of a toxic substance provide only an indication of
areas where mussels are evidently accumulating toxicants at concentrations
which are above normal.
FDA Action Levels and NAS Guidelines
The FDA has established maximum concentration levels for some toxic
substances in human foods (USFDA 1985). The levels are based on specific
assumptions of the quantities of food consumed by humans and the frequency of
their consumption. The FDA limits are intended to protect humans from the
chronic effects of toxic substances consumed in foodstuffs. The National
Academy of Sciences (NAS) has established recommended maximum concentrations
of toxic substances in animals (NAS 1973). They were established not only to
protect the organisms containing the toxic compounds, but also to protect the
species that consume these contaminated organisms. The NAS has set
guidelines for marine fish but not for marine shellfish. Only two guidelines
apply to freshwater clams. The FDA limits and NAS guidelines are shown in
Table 1.

8
Maximum Tissue Residue Levels (MTRLs)
The MTRLs were developed by SWRCB staff from human health water quality
objectives in the 1997 California Ocean Plan (SWRCB 1997) and from the
California Toxic Rule (40 CFR Part 131, May 18, 2000) as established in the
Policy for Implementation of Toxics Standards for Inland Surface Waters,
Enclosed Bays, and Estuaries of California (SWRCB 2000). The objectives
represent levels that protect human health from consumption of fish,
shellfish, and water (freshwater only) that contain substances at levels
which could result in significant human health problems. The MTRLs are used
as alert levels or guidelines indicating water bodies with potential human
health concerns and are an assessment tool and not compliance or enforcement
criteria. Tables 2 and 3 list MTRLs for those substances monitored in ocean
waters and enclosed bays and estuaries. The MTRLs for a number of substances
listed as carcinogens in the MTRL tables are below the current tissue
detection limit for those substances. Detection limits can be found in
Tables U-1, U-4, and U-13 in Appendix U.
The MTRLs were calculated by multiplying the human health water quality
objectives by the bioconcentration factor (BCF) for each substance as
recommended in the USEPA Draft Assessment and Control of Bioconcentratable
Contaminants in Surface Waters (USEPA 1991). BCFs were taken from the USEPA
1980 Ambient Water Quality Criteria Documents for the priority pollutants.
MTRLs were not calculated for objectives that are based on drinking water
Maximum Contaminant levels (MCLs) or taste and odor criteria.
Median International Standards (MISs) for Trace Elements
The MIS is an in-house criterion developed from a United Nations Food and
Agriculture Organization publication of a survey of health protection
criteria used by member nations (Nauen 1983). A description of how the MISs
were compiled by SWRCB staff is provided in Appendix V. These criteria vary
somewhat in the tissues to be analyzed or the level of protection desired but
may be compared qualitatively. Table 4 summarizes these standards as an
indication of what other countries have determined to be unsafe levels of
trace elements. Though the standards do not apply within the United States,
they provide an indication of what other nations consider to be an elevated
concentration of trace elements in shellfish.

9
Elevated Data Levels
The "elevated data level" (EDL) was introduced by SWRCB staff in 1983 as an
internal comparative measure which ranks a given concentration of a
particular substance with previous SMWP data. The EDL is calculated by
ranking all of the results for a species and exposure condition (resident or
transplant) and a given chemical from the highest concentration measured down
to and including those records where the chemical was not detected. From
this, a cumulative distribution is constructed and percentile rankings are
calculated. For example, the 50th percentile corresponds to the median or
"middle" value rather than to the mean. With a large number of records, the
median can be approximately compared to the mean.
The 85th percentile (EDL 85) was chosen as an indication that a chemical is
markedly elevated from the median. The 85th percentile corresponds to
measures used by the U.S. Fish and Wildlife Service in its National
Contaminant Biomonitoring Program and would represent approximately one and
one-half standard deviations from the mean, if the data were normally
distributed. The 95th percentile (EDL 95) was chosen to indicate values that
are highly elevated above the median. The 95th percentile would represent
two standard deviations from the mean, if the data were normally distributed.
When used along with other information, these measures provide a useful
guideline to determine if a chemical has been found in unusually high
concentrations. A more detailed description of EDL rankings is provided in
Appendix W. It should be noted that EDLs are not directly related to
potentially adverse human or animal health effects; they are only a way to
compare findings in a particular area with the larger data base of findings
from all over the state. The 1977-97 EDLs and the number of data points used
to calculate each EDL are provided in Tables 5 through 12.

10
TABLE 1
NAS Guidelines and FDA Action Levels for Toxic Chemicals in Shellfish(wet weight)
NASa FDAb
Recommended Guideline Action Level forfor Freshwater Shellfish Freshwater and Marine Shellfish
Chemical µg/g (ppm) ng/g (ppb) µg/g (ppm) ng/g (ppb)
Mercury - - 1.0c 1,000DDT (total) 1.0 1,000 - - PCB (total) 0.5 500 2.0d 2,000Aldrin - - 0.3 300Dieldrin - - 0.3 300Endrin - - 0.3 300Heptachlor - - 0.3 300Heptachlor epoxide - - 0.3 300
a National Academy of Sciences-National Academy of Engineering. 1973. Water Quality
Criteria, 1972 (Blue Book). U.S. Environmental Protection Agency, Ecological Research
Series.
b U. S. Food and Drug Administration. 1984. Shellfish Sanitation Interpretation:
Action Levels for Chemical and Poisonous Substances, June 21, 1984. U.S.F.D.A.,
Shellfish Sanitation Branch, Washington, D.C.
c As methyl mercury.
d A tolerance, rather than an action level, has been established for PCBs (21CFR 109,
published May 29, 1984). An action level is revoked when a regulation establishes a
tolerance for the same substance and use.

11
TABLE 2
Maximum Tissue Residue Levels (MTRLs) in Ocean Waters
Carcinogens a
Water Quality Objective b BCF c MTRL d
Chemical (µg/l) (l/kg) (µg/kg)(ppb, wet weight)
Aldrin 0.000022 e 0.1Chlordane (total) 0.000023 14100 0.32DDT (total) 0.00017 53600 9.1Dieldrin 0.00004 4670 0.2Heptachlor 0.00072 11200 8.1Hexachlorobenzene (HCB) 0.00021 8690 2.0PAHs (total) 0.0088 30 0.26PCBs (total) 0.000019 31200 0.6Toxaphene 0.00021 13100 2.75
a. The SMWP does not analyze for any of the non-carcinogens listed in the human health section of
Table B of the 1997 Ocean Plan.
b. From Table B, Objectives for Human Health, "California Ocean Plan" (SWRCB 1997).
c. Bioconcentration Factors taken from the USEPA 1980 Ambient Water Quality Criteria Documents
for each substance.
d. MTRLs were calculated by multiplying the Water Quality Objective by the BCF, except for
aldrin.
e. Aldrin MTRL is derived from a combination of aldrin and dieldrin risk factors and BCFs as
recommended in the USEPA 1980 "Ambient Water Quality Criteria for Aldrin/Dieldrin" (USEPA
1980).

12
TABLE 3
Maximum Tissue Residue Levels (MTRLs) in Enclosed Bays and Estuaries
Carcinogens
Water Quality Objective a BCF b MTRL c
Chemical (µg/l) (l/kg) (µg/kg)(ppb, wet weight)
Aldrin 0.00014 d 0.33Chlordane (total) 0.00059 14100 8.3p,p’ DDT 0.00059 53600 32.0p,p’ DDE 0.00059 53600 32.0p,p’ DDD 0.00084 53600 45.0Dieldrin 0.00014 4670 0.7Heptachlor 0.00021 11200 2.3Heptachlor epoxide 0.00011 11200 1.2Hexachlorobenzene (HCB) 0.00077 8690 6.7Hexachlorocyclohexane (HCH), alpha 0.0013 130 1.7Hexachlorocyclohexane (HCH), beta 0.046 130 6.0Hexachlorocyclohexane (HCH), gamma 0.063 130 8.2PCBs (total) 0.00017 31200 5.3Pentachlorophenol (PCP) 8.2 11 90.0Toxaphene 0.00075 13100 9.8
Non-carcinogens
Water Quality Objective a BCF b MTRL c
Chemical (mg/l) (l/kg) (mg/kg)(ppm, wet weight)
endosulfan I 0.240 270 64.8 (64,800 ppb)endosulfan II 0.240 270 64.8 (64,800 ppb)endosulfan sulfate 0.240 270 64.8 (64,800 ppb)Endrin 0.00081 3970 3.2 ( 3,200 ppb)Mercury 0.000051 7342 e 0.37Nickel 4.6 47 220.0
a. From the California Toxic Rule (40 CFR Part 131, May 18, 2000) as established in the Policy
for Implementation of Toxics Standards for Inland Surface Waters, Enclosed Bays, and Estuaries
of California (SWRCB 2000).
b. Bioconcentration Factors taken from the USEPA 1980 Ambient Water Quality Criteria Documents
for each substance.
c. MTRLs were calculated by multiplying the Water Quality Objective by the BCF, except for
aldrin.
d. Aldrin MTRL is derived from a combination of aldrin and dieldrin risk factors and BCFs as
recommended in the USEPA 1980 "Ambient Water Quality Criteria for Aldrin/Dieldrin" (USEPA
1980).
e. Weighted Average Practical BCF as calculated in the California Toxic Rule.

13
TABLE 4
Median International Standards for Trace Elementsa
(edible portion, ppm, wet weight)
Freshwater Number of CountriesElement Fish Shellfish Range with Standards
Arsenic 1.5 1.4 0.1 to 5.0 11
Cadmium 0.3 1.0 0.05 to 2.0 10
Chromium 1.0 1.0 1.0 1
Copper 20.0 20.0 10 to 100 8
Lead 2.0 2.0 0.5 to 10.0 19
Mercury 0.5 0.5 0.1 to 1.0 28
Selenium 2.0 0.3 0.3 to 2.0 3
Zinc 45.0 70.0 40 to 100 6
a. Based on: Nauen, C. E., Compilation of Legal Limits for Hazardous Substances in Fish and
Fishery Products, Food and Agriculture Organization of the United Nations, 1983.

14
TABLE 5State Mussel Watch Program
EDL 85 and EDL 95 for Trace Elements inCalifornia Mussels (Mytilus californianus)
Calculated Using 1977 - 1997 Data(ppm, wet weight)
Resident
Number of Element EDL 85 EDL 95 Samples
Aluminum 80.23 130.00 605 Arsenic 3.74 4.94 137 Cadmium 1.50 2.03 605 Chromium 0.55 1.04 604 Copper 1.59 2.12 605 Lead 0.92 2.42 604 Manganese 2.11 2.90 605 Mercury 0.06 0.11 602 Nickel 0.63 0.82 281 Selenium 0.53 0.82 55 Silver 0.44 1.45 605 Titanium 5.71 9.95 167 Zinc 33.64 38.87 605
Transplanted
Number of Element EDL 85 EDL 95 Samples
Aluminum 138.43 240.00 952 Arsenic 2.20 3.26 239 Cadmium 1.59 1.91 952 Chromium 0.73 1.70 951 Copper 5.30 11.93 952 Lead 1.57 2.79 964 Manganese 4.60 6.24 952 Mercury 0.06 0.08 942 Nickel 0.83 1.10 238 Selenium 0.59 0.85 159 Silver 0.09 0.19 952 Titanium 7.55 14.65 139 Zinc 55.78 77.84 952

15
TABLE 6State Mussel Watch Program
EDL 85 and EDL 95 for Trace Elements in Bay Mussels (Mytilus edulis )Calculated Using 1977 - 1997 Data
(ppm, wet weight)
Resident
Number of Element EDL 85 EDL 95 Samples
Aluminum 170.00 220.00 95 Arsenic IS IS 8 Cadmium 0.99 1.24 95 Chromium 0.73 1.60 95 Copper 2.28 4.28 95 Lead 1.61 4.26 95 Manganese 5.11 6.98 95 Mercury 0.05 0.09 94 Nickel 0.78 1.06 24 Selenium IS IS 9 Silver 0.05 0.16 95 Titanium IS IS 1 Zinc 42.92 52.60 95
IS = Insufficient number of samples to calculate an EDL.

16
TABLE 7State Mussel Watch Program
EDL 85 and EDL 95 for Trace Elements inFreshwater Clams (Corbicula fluminea)Calculated Using 1977 - 1997 Data
(ppm, wet weight)
Resident
Number of Element EDL 85 EDL 95 Samples
Aluminum 56.29 78.17 18 Arsenic IS IS 4 Cadmium 1.26 1.74 18 Chromium 0.99 1.51 18 Copper 8.61 10.68 18 Lead 0.12 0.21 18 Manganese 6.68 9.35 18 Mercury 0.04 0.04 18 Nickel IS IS 2 Selenium IS IS 7 Silver 0.03 0.04 18 Titanium IS IS 1 Zinc 17.05 18.17 18
Transplanted
Number of Element EDL 85 EDL 95 Samples
Aluminum 206.33 446.00 84 Arsenic 0.90 0.93 28 Cadmium 0.92 1.26 84 Chromium 2.00 3.07 84 Copper 8.78 15.00 84 Lead 0.21 0.39 84 Manganese 9.55 16.90 84 Mercury 0.04 0.10 88 Nickel 1.00 1.40 20 Selenium 0.43 0.46 28 Silver 0.03 0.04 84 Titanium IS IS 5 Zinc 19.39 25.12 84
IS = Insufficient number of samples to calculate an EDL.

17
TABLE 8State Mussel Watch Program
EDL 85 and EDL 95 for Organic Chemicals inResident California Mussels (Mytilus californianus)
Calculated Using 1977 - 1997 Data(ppb, wet weight)
Number of Chemical EDL 85 EDL 95 Samples
Aldrin ND ND 184 Chlordene, alpha ND ND 155 Chlordene, gamma ND ND 154 cis-Chlordane 1.5 3.0 184 cis-Nonachlor 0.3 0.7 160 Oxychlordane 0.2 0.3 184 trans-Chlordane 1.3 2.2 184 trans-Nonachlor 1.3 2.3 184 Total Chlordane 4.4 7.2 194 Chlorbenside ND 0.5 130 Chlordene ND ND 64 Chlorpyrifos ND ND 183 Dacthal ND 0.4 183 DDD, o,p' 1.2 2.2 306 DDD, p,p' 3.3 7.5 306 DDE, o,p' 5.8 12.4 187 DDE, p,p' 31.4 105.5 306 DDT, o,p' 0.4 1.1 306 DDT, p,p' 1.8 3.3 306 DDMS, p,p' ND 2.4 153 DDMU, p,p' 4.6 9.0 187 Total DDT 48.8 129.0 316 Diazinon ND ND 157 Dichlorobenzophenone, p,p' ND ND 99 Dicofol ND ND 61 Dieldrin 1.6 2.5 183 Endosulfan I 0.3 1.2 184 Endosulfan II ND ND 88 Endosulfan Sulfate ND ND 82 Total Endosulfan 0.3 1.3 194 Endrin ND ND 184 Ethion ND ND 99 HCH, alpha 1.2 1.7 184 HCH, beta ND 1.1 183 HCH, delta ND ND 183 HCH, gamma 0.2 0.3 183 Heptachlor ND ND 184 Heptachlor Epoxide ND ND 183 Hexachlorobenzene ND 0.03 184 Methoxychlor ND ND 183 Oxadiazon ND ND 74 Parathion, ethyl ND ND 156 Parathion, methyl ND ND 156 Phenol 0.3 0.4 14 Pentachlorophenol 1.2 2.7 14 PCB 1248 ND ND 410 PCB 1254 14.7 33.3 410 PCB 1260 ND ND 410 Total PCB 15.1 35.2 410 PCT 5460 ND ND 69 Ronel ND ND 69 Tetrachlorophenol 1.1 3.0 14 Tetradifon ND ND 156 Toxaphene ND ND 184 Tributyltin ND ND 23
ND = EDL lies below the detection limit.

18
TABLE 9State Mussel Watch Program
EDL 85 and EDL 95 for Organic Chemicals inTransplanted California Mussels (Mytilus californianus)
Calculated Using 1977 - 1997 Data(ppb, wet weight)
Number of Chemical EDL 85 EDL 95 Samples
Aldrin ND ND 584 Chlordene, alpha 0.4 1.0 530 Chlordene, gamma 0.2 0.4 530 cis-Chlordane 6.9 13.0 587 cis-Nonachlor 2.1 3.7 537 Oxychlordane 0.4 0.8 587 trans-Chlordane 5.6 9.5 587 trans-Nonachlor 4.9 9.4 587 Total Chlordane 20.0 34.5 596 Chlorbenside ND 1.7 437 Chlordene ND ND 240 Chlorpyrifos 0.6 1.5 582 Dacthal 0.6 6.2 563 DDD, o,p' 5.7 12.4 608 DDD, p,p' 22.7 65.3 608 DDE, o,p' 5.9 10.2 608 DDE, p,p' 94.7 170.1 608 DDT, o,p' 2.1 8.6 608 DDT, p,p' 7.6 33.8 608 DDMS, p,p' 3.4 6.2 533 DDMU, p,p' 6.4 10.2 608 Total DDT 145.1 308.5 617 Diazinon ND ND 482 Dichlorobenzophenone, p,p' ND ND 323 Dicofol ND ND 215 Dieldrin 5.7 18.2 564 Endosulfan I 1.0 20.0 568 Endosulfan II ND 13.4 314 Endosulfan Sulfate 1.3 26.6 297 Total Endosulfan 1.3 40.9 577 Endrin ND 1.4 561 Ethion ND ND 323 HCH, alpha 0.6 1.0 579 HCH, beta ND ND 563 HCH, delta ND ND 562 HCH, gamma 0.4 0.6 562 Heptachlor ND ND 579 Heptachlor Epoxide 0.1 0.4 579 Hexachlorobenzene ND 0.1 579 Methoxychlor ND ND 564 Oxadiazon 1.2 2.7 225 Parathion, ethyl ND ND 461 Parathion, methyl ND ND 461 Phenol 0.5 0.9 37 Pentachlorophenol 22.6 34.0 90 PCB 1248 ND 28.2 748 PCB 1254 161.9 368.4 748 PCB 1260 ND 2.1 748 Total PCB 171.3 420.0 748 PCT 5460 ND ND 189 Ronel ND 0.3 134 Tetradifon ND ND 467 Toxaphene ND 83.2 587 Tributyltin 1474.5 2639.3 150 Tetrachlorophenol 2.0 5.4 90
ND = EDL lies below the detection limit.

19
TABLE 10State Mussel Watch Program
EDL 85 and EDL 95 for Organic Chemicals inResident Bay Mussels (Mytilus edulis)Calculated Using 1977 - 1997 Data
(ppb, wet weight)
Number of Chemical EDL 85 EDL 95 Samples
Aldrin ND 0.3 69 Chlordene, alpha 0.4 1.1 48 Chlordene, gamma 0.4 1.2 48 cis-Chlordane 11.8 17.6 70 cis-Nonachlor 2.5 4.1 59 Oxychlordane 0.5 0.8 70 trans-Chlordane 12.3 17.0 70 trans-Nonachlor 10.6 15.9 70 Total Chlordane 37.7 55.9 70 Chlorbenside ND 5.8 55 Chlordene ND ND 27 Chlorpyrifos ND 0.9 70 Dacthal 7.4 20.2 68 DDD, o,p' 11.7 21.8 89 DDD, p,p' 44.2 79.5 89 DDE, o,p' 7.4 14.8 82 DDE, p,p' 167.0 295.7 89 DDT, o,p' 7.0 22.6 89 DDT, p,p' 31.8 96.0 89 DDMS, p,p' 3.1 5.3 74 DDMU, p,p' 7.0 11.2 82 Total DDT 263.6 487.6 89 Diazinon ND ND 59 Dichlorobenzophenone, p,p' ND ND 22 Dicofol ND ND 11 Dieldrin 10.5 21.8 67 Endosulfan I 89.8 124.5 70 Endosulfan II 48.2 73.3 33 Endosulfan Sulfate 46.8 68.2 30 Total Endosulfan 102.5 230.6 70 Endrin 2.2 4.0 67 Ethion ND ND 22 HCH, alpha 0.4 0.5 69 HCH, beta ND 0.3 68 HCH, delta ND ND 68 HCH, gamma 0.3 0.4 68 Heptachlor 0.1 0.6 69 Heptachlor Epoxide 0.2 0.5 69 Hexachlorobenzene 0.1 0.2 69 Methoxychlor ND ND 68 Oxadiazon 0.5 1.5 17 Parathion, ethyl ND ND 59 Parathion, methyl ND ND 59 Phenol IS IS 0 Pentachlorophenol IS IS 1 PCB 1248 ND 13.6 94 PCB 1254 127.0 188.8 94 PCB 1260 ND ND 94 Total PCB 128.7 188.8 94 PCT 5460 ND ND 13 Ronel ND 0.6 34 Tetrachlorophenol IS IS 1 Tetradifon ND ND 58 Toxaphene 82.1 226.7 72 Tributyltin IS IS 5
ND = EDL lies below the detection limit. IS = Insufficient number of samples to calculate an EDL.

20
TABLE 11State Mussel Watch Program
EDL 85 and EDL 95 for Organic Chemicals inResident Freshwater Clams (Corbicula fluminea)
Calculated Using 1977 - 1997 Data(ppb, wet weight)
Number of Chemical EDL 85 EDL 95 Samples
Aldrin ND ND 17 Chlordene, alpha ND ND 17 Chlordene, gamma ND ND 17 cis-Chlordane 1.6 3.2 17 cis-Nonachlor ND 0.4 17 Oxychlordane ND ND 17 trans-Chlordane 1.3 2.8 17 trans-Nonachlor 0.8 3.6 17 Total Chlordane 4.3 9.4 17 Chlorbenside ND ND 16 Chlordene ND ND 11 Chlorpyrifos ND ND 17 Dacthal 1.9 3.3 17 DDD, o,p' 1.7 13.4 17 DDD, p,p' 7.5 51.7 17 DDE, o,p' 0.7 6.4 17 DDE, p,p' 14.2 110.5 17 DDT, o,p' ND 4.8 17 DDT, p,p' 4.2 39.8 17 DDMS, p,p' ND ND 17 DDMU, p,p' 1.1 6.0 17 Total DDT 26.6 250.4 17 Diazinon ND ND 16 Dichlorobenzophenone, p,p' IS IS 9 Dicofol IS IS 8 Dieldrin 1.2 1.5 17 Endosulfan I ND 6.0 17 Endosulfan II ND ND 15 Endosulfan Sulfate ND ND 15 Total Endosulfan 0.5 14.1 17 Endrin ND ND 17 Ethion IS IS 9 HCH, alpha 0.3 0.5 17 HCH, beta ND ND 17 HCH, delta ND ND 17 HCH, gamma ND 0.4 17 Heptachlor ND ND 17 Heptachlor Epoxide ND ND 17 Hexachlorobenzene 0.2 0.3 17 Methoxychlor ND ND 17 Oxadiazon IS IS 1 Parathion, ethyl ND ND 16 Parathion, methyl ND ND 16 Phenol IS IS 0 Pentachlorophenol IS IS 0 PCB 1248 ND ND 19 PCB 1254 13.7 63.3 19 PCB 1260 ND ND 19 Total PCB 13.7 63.3 19 PCT 5460 IS IS 3 Ronel IS IS 4 Tetrachlorophenol IS IS 0 Tetradifon ND ND 16 Toxaphene ND ND 17 Tributyltin IS IS 0
ND = EDL lies below the detection limit. IS = Insufficient number of samples to calculate an EDL.

21
TABLE 12State Mussel Watch Program
EDL 85 and EDL 95 for Organic Chemicals inTransplanted Freshwater Clams (Corbicula fluminea)
Calculated Using 1977 - 1997 Data(ppb, wet weight)
Number of Chemical EDL 85 EDL 95 Samples
Aldrin 0.7 1.5 111 Chlordene, alpha 1.5 2.8 111 Chlordene, gamma 1.1 3.1 111 cis-Chlordane 13.0 26.7 111 cis-Nonachlor 2.8 12.2 111 Oxychlordane 0.7 1.7 111 trans-Chlordane 9.5 18.4 111 trans-Nonachlor 9.2 18.5 111 Total Chlordane 35.1 79.0 111 Chlorbenside ND ND 80 Chlordene ND ND 49 Chlorpyrifos 4IS 72.0 111 Dacthal 137.5 378.0 111 DDD, o,p' 46.0 120.6 111 DDD, p,p' 165.0 396.4 111 DDE, o,p' 9.2 20.8 111 DDE, p,p' 376.9 1019.8 111 DDT, o,p' 41.9 126.2 111 DDT, p,p' 217.4 665.1 111 DDMS, p,p' ND 7.8 111 DDMU, p,p' 15.1 34.4 111 Total DDT 911.0 2493.7 111 Diazinon ND 23.2 80 Dichlorobenzophenone, p,p' ND 4.6 67 Dicofol 40.1 107.4 37 Dieldrin 110.4 196.9 111 Endosulfan I 22.7 190.5 111 Endosulfan II 24.9 111.4 94 Endosulfan Sulfate 37.8 88.3 94 Total Endosulfan 74.6 294.4 111 Endrin 17.0 29.3 111 Ethion ND ND 66 HCH, alpha 0.1 0.4 111 HCH, beta ND ND 107 HCH, delta ND ND 107 HCH, gamma 0.6 0.9 107 Heptachlor ND 0.3 111 Heptachlor Epoxide 0.6 2.6 111 Hexachlorobenzene 1.3 2.9 111 Methoxychlor ND ND 107 Oxadiazon 26.2 61.6 44 Parathion, ethyl ND ND 76 Parathion, methyl ND ND 76 Phenol IS IS 3 Pentachlorophenol IS IS 0 PCB 1248 4.1 13.4 111 PCB 1254 59.8 151.6 111 PCB 1260 ND 9.4 111 Total PCB 78.0 151.6 111 PCT 5460 ND ND 41 Ronel ND ND 11 Tetrachlorophenol IS IS 0 Tetradifon ND ND 77 Toxaphene 603.2 2374.4 111 Tributyltin IS IS 0
ND = EDL lies below the detection limit. IS = Insufficient number of samples to calculate an EDL.

22
4. LITERATURE CITED
(DFG) Department of Fish and Game. 1990. Laboratory Quality Assurance ProgramPlan (October 12, 1992 update). Environmental Services Division, CaliforniaDepartment of Fish and Game. Sacramento, California.
Goldberg, E.D. 1980. The International Mussel Watch. National Academy ofSciences Publ., Washington, D.C.
(NAS) National Academy of Sciences-National Academy of Engineering. 1973.Water Quality Criteria 1972 (Blue Book). EPA Ecological Research Series.EPA-R3-73-033. U.S. Environmental Protection Agency, Washington, D.C.
Nauen, C.E. 1983. Compilation of Legal Limits for Hazardous Substances inFish and Fishery Products, Circular No. 764. FIRI/C764, Food andAgricultural Organization of the United Nations.
Phillips, D.J.H. 1980. Quantitative Aquatic Biological Indicators. AppliedScience Publishers Ltd, Ripple Road, Barking, Essex, England. Pages 38-90.
Risebrough, R.W., B.W. deLappe, E.F. Letterman, J.L. Lane, M. Firestone-Gilles,A.M. Springer, and W. Walker II. 1980. California State Mussel Watch 1977-1978. Volume III. Organic Pollutants in Mussels, Mytilus californianus andMytilus edulis, along the California Coast. Water Quality Monitoring ReportNo. 79-22. State Water Resources Control Board, California EnvironmentalProtection Agency, Sacramento, California.
(SWRCB) State Water Resources Control Board. 2000. Policy for Implementationof Toxics Standards for Inland Surface Waters, Enclosed Bays, and Estuariesof California (Phase 1 of the Inland Surface Waters Plan and Enclosed Baysand Estuaries Plan). March 2, 2000. State Water Resources Control Board,California Environmental Protection Agency, Sacramento, California.
(SWRCB) State Water Resources Control Board. 1997. California Ocean Plan -Water Quality Control Plan, Ocean Waters of California. July 23, 1997.State Water Resources Control Board, California Environmental ProtectionAgency, Sacramento, California.
Stephenson, M.D., D. Smith, G. Ichikawa, J. Goetzl, W. Laurendine, and M.Martin. 1987. State Mussel Watch Program Preliminary Data Report 1986-1987. California Department of Fish and Game, Monterey, California.
Stephenson, M.D., S.L. Coale, M. Martin, and J. H. Martin. 1980. CaliforniaState Mussel Watch 1979-1980. Trace metal concentrations in the Californiamussel, Mytilus californianus, and the Bay Mussel, Mytilus edulis, along theCalifornia coast and selected harbors and bays. Water Quality MonitoringReport No. 79-22. State Water Resources Control Board, CaliforniaEnvironmental Protection Agency, Sacramento, California
Stout, V.F. and F.L. Beezhold. 1981. Chlorinated hydrocarbon levels in fishesand shellfishes of the northeastern Pacific Ocean including the HawaiianIslands. Mar. Fish. Rev. 43:1:1-12.
(USEPA) U.S. Environmental Protection Agency. 1991. "Draft" Assessment andControl of Bioconcentratable Contaminants in Surface Waters. March 1991.Office of Water, U.S. EPA, Washington, D.C.

23
LITERATURE CITED (continued)
(USEPA) U.S. Environmental Protection Agency. 1985. Ambient Water QualityCriteria for Mercury. EPA 440/5-84-026. U.S. EPA, Office of WaterRegulations and Standards, Washington, D.C.
(USEPA) U.S. Environmental Protection Agency. 1980. Ambient Water QualityCriteria for Aldrin/Dieldrin. EPA 440/5-80-019. U.S. EPA, Office of WaterRegulations and Standards, Washington, D.C.
(USFDA) U.S. Food and Drug Administration, Bureau of Foods. 1985. ActionLevels for Poisonous or Deleterious Substances in Human Food and AnimalFeed. USFDA, Washington, D.C.
(USFDA) U. S. Food and Drug Administration. 1984. Shellfish SanitationInterpretation: Action Levels for Chemical and Poisonous Substances, June21, 1984. U.S.F.D.A., Shellfish Sanitation Branch, Washington, D.C.

Tab le o fConten ts
Regional Water QualityControl Board
Boundaries
COSTACONTRA
SA
N M
ATE
O
MONTEREY
LOSANGELES
ORANGE
SAN DIEGO
SANFRANCISCO
HUMBOLDT
SONOMA
MARIN
SANTA CRUZ
DELNORTE
SANTA CLARA
A-1
APPENDIX A
STATE WATER RESOURCES CONTROL BOARD
1995-97 STATE MUSSEL WATCH LOCATIONS
Index . . . . . . . . . . . . . . . A-2
Del Norte Co.Crescent City . . . . . . . . . . . . A-4
Humboldt Co.Eureka . . . . . . . . . . . . . . . . . A-5
Sonoma Co.Jenner . . . . . . . . . . . . . . . . . A-6
Marin Co.Tomales North . . . . . . . . . . . A-7Tomales South . . . . . . . . . . . A-8Tiburon . . . . . . . . . . . . . . . . A-9
Contra Costa Co.Martinez . . . . . . . . . . . . . . . A-10
San Francisco Co.San Francisco . . . . . . . . . . . A-11
San Mateo Co.Redwood City . . . . . . . . . . A-12
Santa Clara Co.San Jose . . . . . . . . . . . . A-13
Santa Cruz Co.Santa Cruz . . . . . . . . . . . A-14
Monterey Co.Moss Landing . . . . . . . . . . A-15Monterey . . . . . . . . . . . . . . A-16
Los Angeles Co.Long Beach . . . . . . . . . A-17Malibu . . . . . . . . . . . . . . A-18Santa Monica . . . . . . . . A-19Redondo . . . . . . . . . . . A-20
Orange Co.Anaheim Bay . . . . . . . . . A-21Newport Bay . . . . . . . . . A-22Dana Point . . . . . . . . . . . A-23
San Diego Co.Oceanside . . . . . . . . . . A-24San Diego Bay . . . . . . . A-25
48
9
7
3
2
6
5
1

A-2
1.0 Crescent City Harbor................................1 ................................................................................................................ A-4
2.0 Crescent City/STP Outfall........................1 ................................................................................................................ A-4
2.2 Crescent City Harbor/Inner Jetty .............1 ................................................................................................................ A-4
3.0 Crescent City/Control...............................1 ................................................................................................................ A-4
100.0 Mad River Slough ....................................1 ................................................................................................................ A-5
101.4 Arcata Bay/Jolly Giant Slough.................1 ................................................................................................................ A-5
101.5 Humboldt Bay/Eureka SM.22..................1 ................................................................................................................ A-5
101.8 Humboldt Bay/Halberson Shoreline ........1 ................................................................................................................ A-5
102.6 Humboldt Bay/J Street .............................1 ................................................................................................................ A-5
102.7 Humboldt Bay/H Street............................1 ................................................................................................................ A-5
102.8 Humboldt Bay/Davenport Mar. C St........1 ................................................................................................................ A-5
103.3 Humboldt Bay/E Street ...........................1 ................................................................................................................ A-5
103.5 Humboldt Bay/Clark Slough ...................1 ................................................................................................................ A-5
104.1 Humboldt Bay/Union Oil Plant................1 ................................................................................................................ A-5
104.2 Humboldt Bay/Coal Oil Gas Plant ..........1 ................................................................................................................ A-5
104.3 Humboldt Bay/Old Pac. Lumber..............1 ................................................................................................................ A-5
202.0 Bodega Head ............................................1 ................................................................................................................ A-6
203.0 Tomales Bay.............................................2 ................................................................................................................ A-8
203.1 Tomales Bay/Vincent Landing .................2 ................................................................................................................ A-7
203.3 Tomales Bay/Walker Creek Mouth 1 .......2 ................................................................................................................ A-7
203.5 Tomales Bay/Walker Creek Mouth 2 .......2 ................................................................................................................ A-7
203.7 Tomales Bay/Walker Creek Mouth 3 ......2 ................................................................................................................ A-7
203.9 Tomales Bay/Nicks Cove .........................2 ................................................................................................................ A-7
205.0 Bodega Harbor/Spud Point Marina .........1 ................................................................................................................ A-6
205.1 Bodega Bay/Porto Bodega ......................1 ................................................................................................................ A-6
205.3 Bodega Bay/Mason's Marina ...................1 ................................................................................................................ A-6
205.5 Bodega Bay/Back Marsh .........................1 ................................................................................................................ A-6
210.1 Walker Creek/Mine Creek........................2 ................................................................................................................ A-8
210.3 Walker Creek/mid stream.........................2 ................................................................................................................ A-8
211.1 Lagunitas Creek/Bridge 1.........................2 ................................................................................................................ A-8
211.3 Lagunitas Creek/Bridge 2.........................2 ................................................................................................................ A-8
280.0 Russian River/S Goat Rock .....................1 ................................................................................................................ A-6
299.1 Selby Slag 4 .............................................2 .............................................................................................................. A-10
302.6 Paradise Cove ..........................................2 ................................................................................................................ A-9
306.1 Gashouse Cove/Laguna Street .................2 .............................................................................................................. A-11
306.2 Sansome Street/Pier 31 ............................2 .............................................................................................................. A-11
306.3 Howard Street/Pier 14 .............................2 .............................................................................................................. A-11
306.4 Central Basin/Outer .................................2 .............................................................................................................. A-11
307.0 San Francisco Bay/Treasure Is .................2 .............................................................................................................. A-11
308.0 San Francisco Bay/Hunter's Point............2 .............................................................................................................. A-11
309.0 San Mateo Bridge/8B...............................2 .............................................................................................................. A-12
311.4 North South Bay ......................................2 .............................................................................................................. A-12
313.0 San Francisco Bay/near Redwood Cr .....2 .............................................................................................................. A-12
321.0 Dumbarton Bridge/Channel Marker 14 ...2 .............................................................................................................. A-12
329.0 Guadalupe Creek/Almaden Expressway .2 .............................................................................................................. A-13
329.2 Guadalupe Creek/Hicks Road .................2 .............................................................................................................. A-13
State Mussel Watch Program1995-97 Sampling Station Map Index
PageStationNumber Station Name Region

A-3
329.4 Alamitos Creek/Almaden Road ...............2 .............................................................................................................. A-13
400.6 Santa Cruz/Natural Bridges......................3 .............................................................................................................. A-14
400.7 Santa Cruz Harbor/Inner ..........................3 .............................................................................................................. A-14
401.0 Santa Cruz Harbor................................... 3 .............................................................................................................. A-14
403.0 Elkhorn Slough/Highway 1 Bridge..........3 .............................................................................................................. A-15
404.0 Sandholdt Bridge......................................3 .............................................................................................................. A-15
414.0 Pacific Grove............................................3 .............................................................................................................. A-16
420.3 Monterey Harbor/C G Jetty/Inner ............3 .............................................................................................................. A-16
420.4 Monterey Harbor/C G Jetty/Inner 2 .........3 .............................................................................................................. A-16
420.5 Monterey Harbor/C G Jetty/Inner 3 .........3 .............................................................................................................. A-16
421.0 Monterey Harbor/Slag Pile ......................3 .............................................................................................................. A-16
601.0 LA Harbor/National Steel ......................4 .............................................................................................................. A-17
605.0 LA Harbor/Cabrillo Pier ..........................4 .............................................................................................................. A-17
616.0 LA Harbor/Consolidated Slip ..................4 .............................................................................................................. A-17
618.0 LA Harbor/Angels Gate ..........................4 .............................................................................................................. A-17
648.0 Malibu ......................................................4 .............................................................................................................. A-18
650.0 Santa Monica............................................4 .............................................................................................................. A-19
662.0 Royal Palms .............................................4 .............................................................................................................. A-20
664.0 Cabrillo Beach .........................................4 .............................................................................................................. A-17
708.0 Anaheim Bay/Navy Marsh.......................8 .............................................................................................................. A-21
713.0 Huntington Harbour/Edinger Street .........8 .............................................................................................................. A-21
715.0 Huntington Harbour/Warner Ave Brdg ....8 .............................................................................................................. A-21
723.4 Newport Bay/Turning Basin ...................8 .............................................................................................................. A-22
724.0 Newport Bay/Highway 1 Bridge..............8 .............................................................................................................. A-22
725.0 Newport Bay/Crows Nest .......................8 .............................................................................................................. A-22
726.4 Newport Bay/Rhine Channel/End............8 .............................................................................................................. A-22
726.6 Newport Bay/Mariners Drive ..................8 .............................................................................................................. A-22
740.0 Dana Point Harbor/Boat Yard ..................9 .............................................................................................................. A-23
742.0 San Juan Creek.........................................9 .............................................................................................................. A-23
750.0 Oceanside .................................................9 .............................................................................................................. A-24
882.2 24Th St Maritime Terminal/North ...........9 .............................................................................................................. A-25
882.7 San Diego Bay/Sampson Street Pier ........9 .............................................................................................................. A-25
883.1 San Diego Bay/Chollas Creek .................9 .............................................................................................................. A-25
883.2 San Diego Bay/Chollas Creek/Mouth......9 .............................................................................................................. A-25
883.3 San Diego Bay/Chollas Creek/End ..........9 .............................................................................................................. A-25
883.5 San Diego Bay/Tuna Docks ....................9 .............................................................................................................. A-25
883.6 San Diego Bay/7th Street Channel ..........9 .............................................................................................................. A-25
883.8 San Diego Bay/Switzer Creek .................9 .............................................................................................................. A-25
885.1 San Diego Bay/Paleta Creek/End.............9 .............................................................................................................. A-25
885.3 San Diego Bay/7th Street Ch/Mid............9 .............................................................................................................. A-25
886.0 San Diego Bay/NASSCO.........................9 .............................................................................................................. A-25
888.0 San Diego Bay/Coronado Bridge.............9 .............................................................................................................. A-25
893.0 San Diego Bay/Laurel Street....................9 .............................................................................................................. A-25
893.5 San Diego Bay/B Street Pier ....................9 .............................................................................................................. A-25
894.0 SD Bay/Harbor Is/E Basin/Storm Dr ......9 .............................................................................................................. A-25
State Mussel Watch Program1995-97 Sampling Station Map Index
PageRegionStationNumber Station Name

N
STATE MUSSEL WATCH 1995-97 SAMPLING STATIONSDel Norte Co. - Crescent City Area
1.0 - Crescent City Harbor
2.0 - Crescent City / STP Outfall
2.2 - Crescent City Harbor/Inner Jetty
3.0 - Crescent City / Control
2.0
1.0
3.0
CrescentCity
SISKIYOU MODOC
DELNORTE
HUMBOLDT
TRINITY SHASTALASSEN
PLUMAS
TEHAMA
SIERRA
NEVADA
PLACER
EL DORADO
AMADOR
CALAVERAS
ALPINE
BUTTEGLENN
MENDOCINO
LAKECOLUSA
YU
BAS
UT
TE
R
SACRAM
ENTO
YOLOSONOMA NAPA
MA
RIN
SOLANO
CONTRACOSTA
SAN
JOAQUINTUOLUMNE
MONO
MARIPOSA
STANISLAUSSA
N M
ATE
O
SANFRANCISCO
SANTACLARA
SANTA CRUZ
MERCED
FRESNO
INYO
TULARE
KINGS
SANBENITO
MONTEREY
SAN LUIS
OBISPO
SANTA BARBARA
KERN
VENTURA LOSANGELES
SAN BERNARDINO
ORANGERIVERSIDE
IMPERIALSAN DIEGO
ALAMEDA
MADERA
DEL
NORTEMap Area
101
2.2
A-4

SANTA CRUZ
N
Map Area
Eureka
101
SISKIYOU MODOC
DELNORTE
HUMBOLDT
TRINITY SHASTALASSEN
PLUMAS
TEHAMA
SIERRA
NEVADA
PLACER
EL DORADO
AMADOR
CALAVERAS
ALPINE
BUTTEGLENN
MENDOCINO
LAKECOLUSA
YU
BAS
UT
TE
R
SACRAM
ENTO
YOLOSONOMA NAPA
MA
RIN
SOLANO
CONTRACOSTA
SAN
JOAQUINTUOLUMNE
MONO
MARIPOSA
STANISLAUSSA
N M
ATE
O
SANFRANCISCO
SANTACLARA MERCED
FRESNO
INYO
TULARE
KINGS
SANBENITO
MONTEREY
SAN LUIS
OBISPO
SANTA BARBARA
KERN
VENTURA LOSANGELES
SAN BERNARDINO
ORANGERIVERSIDE
IMPERIALSAN DIEGO
ALAMEDA
MADERA
HUMBOLDT
100.0
STATE MUSSEL WATCH 1995-97 SAMPLING STATIONSHumboldt Co. - Eureka Area
100.0 - Mad River Slough
101.4 - Arcada Bay/Jolly Giant Slough
101.5 - Humboldt Bay/Eureka SM.22
101.8 - Humboldt Bay/Halberson Shoreline
102.6 - Humboldt Bay/J Street
102.7 - Humboldt Bay/H Street
102.8 - Humboldt Bay/Davenport Mar. C Street
103.3 - Humboldt Bay/E Street
103.5 - Humboldt Bay/Clark Slough
104.1 - Humboldt Bay/Union Oil Plant
104.2 - Humboldt Bay/Coal Oil Gas Plant
104.3 - Humboldt Bay/Old Pac. Lumber
A-5
101.4
101.5 101.8
102.6
102.7
102.8
103.3
103.5
104.1
104.2
104.3

N
Bodega Bay
Map Area
1
Jenner
116
280.0
SISKIYOU MODOC
DELNORTE
HUMBOLDT
TRINITY SHASTALASSEN
PLUMAS
TEHAMA
SIERRA
NEVADA
PLACER
EL DORADO
AMADOR
CALAVERAS
ALPINE
BUTTEGLENN
MENDOCINO
LAKECOLUSA
YU
BAS
UT
TE
R
SACRAM
ENTO
YOLOSONOMA NAPA
MA
RIN
SOLANO
CONTRACOSTA
SAN
JOAQUINTUOLUMNE
MONO
MARIPOSA
STANISLAUSSA
N M
ATE
O
SANFRANCISCO
SANTACLARA
SANTA CRUZ
MERCED
FRESNO
INYO
TULARE
KINGS
SANBENITO
MONTEREY
SAN LUIS
OBISPO
SANTA BARBARA
KERN
VENTURA LOSANGELES
SAN BERNARDINO
ORANGERIVERSIDE
IMPERIALSAN DIEGO
ALAMEDA
MADERA
SONOMA
A-6
STATE MUSSEL WATCH 1995-97 SAMPLING STATIONSSonoma Co. - Jenner Area
202.0 - Bodega Head
202.0
202.0 - Bodega Head
205.0 - Bodega Harbor/Spud Point Marina
205.1 - Bodega Bay/Porto Bodega
205.3 - Bodega Bay/Mason’s Marina
205.5 - Bodega Bay/Back Marsh
280.0 - Russian River/S Goat Rock
202.0
205.0
205.1
205.3
205.5

STATE MUSSEL WATCH 1995-97 SAMPLING STATIONSMarin Co. - Tomales North Area
203.1 - Tomales Bay/Vincent Landing
203.3 - Tomales Bay/Walker CreekMouth 1
203.5 - Tomales Bay/Walker CreekMouth 2
203.7 - Tomales Bay/Walker CreekMouth 3
203.9 - Tomales Bay/Nicks Cove
DillonBeach
Map Area
1
SONOMA CO
Tomales
1
N
203.1
203.3
203.5
203.7
203.9
SISKIYOU MODOC
DELNORTE
HUMBOLDT
TRINITY SHASTALASSEN
PLUMAS
TEHAMA
SIERRA
NEVADA
PLACER
EL DORADO
AMADOR
CALAVERAS
ALPINE
BUTTEGLENN
MENDOCINO
LAKECOLUSA
YU
BAS
UT
TE
R
SACRAM
ENTO
YOLOSONOMA NAPA
MA
RIN
SOLANO
CONTRACOSTA
SAN
JOAQUINTUOLUMNE
MONO
MARIPOSA
STANISLAUSSA
N M
ATE
O
SANFRANCISCO
SANTACLARA
SANTA CRUZ
MERCED
FRESNO
INYO
TULARE
KINGS
SANBENITO
MONTEREY
SAN LUIS
OBISPO
SANTA BARBARA
KERN
VENTURA LOSANGELES
SAN BERNARDINO
ORANGERIVERSIDE
IMPERIALSAN DIEGO
ALAMEDA
MADERAMA
RIN
A-7
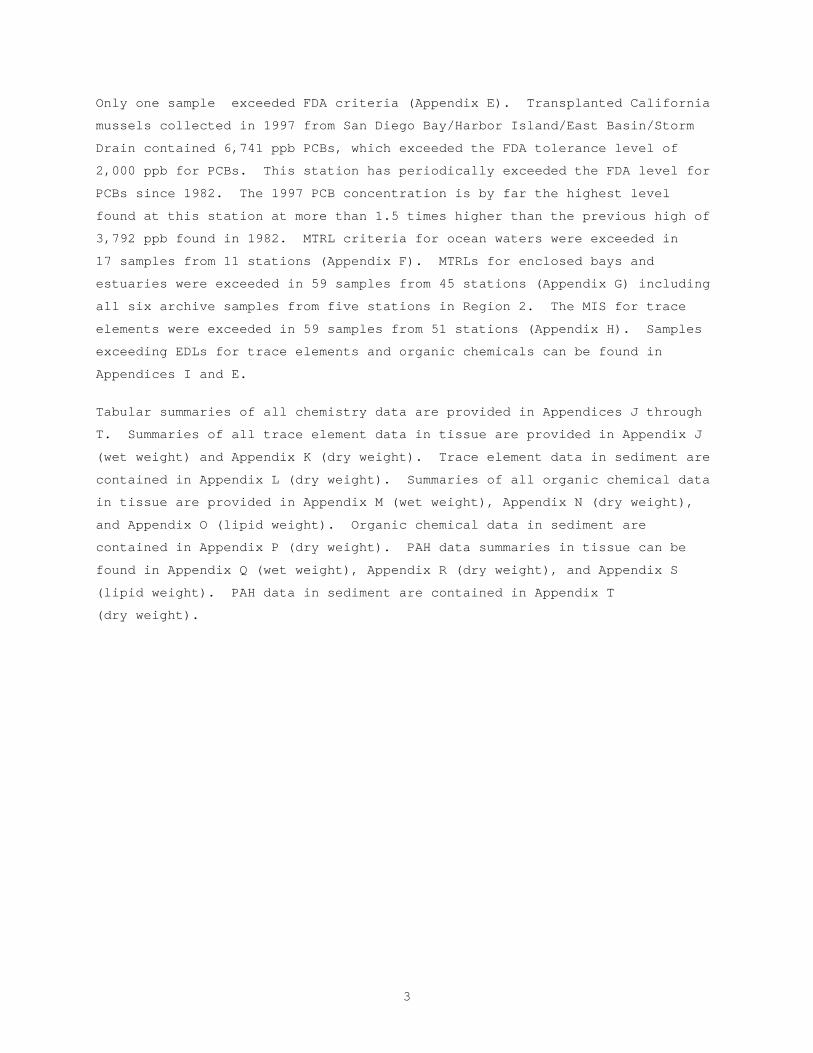
STATE MUSSEL WATCH 1995-97 SAMPLING STATIONSMarin Co. - Tomales South Area
203.0 - Tomales Bay
210.1 - Walker Creek/Mine Creek
210.3 - Walker Creek/mid stream
211.1 - Lagunitas Creek/Bridge 1
211.3 - Lagunitas Creek/Bridge 2
Map Area
203.0
N
210.1
210.3
211.1
211.3
1
Point ReyesStation
Marconi
SISKIYOU MODOC
DELNORTE
HUMBOLDT
TRINITY SHASTALASSEN
PLUMAS
TEHAMA
SIERRA
NEVADA
PLACER
EL DORADO
AMADOR
CALAVERAS
ALPINE
BUTTEGLENN
MENDOCINO
LAKECOLUSA
YU
BAS
UT
TE
R
SACRAM
ENTO
YOLOSONOMA NAPA
MA
RIN
SOLANO
CONTRACOSTA
SAN
JOAQUINTUOLUMNE
MONO
MARIPOSA
STANISLAUSSA
N M
ATE
O
SANFRANCISCO
SANTACLARA
SANTA CRUZ
MERCED
FRESNO
INYO
TULARE
KINGS
SANBENITO
MONTEREY
SAN LUIS
OBISPO
SANTA BARBARA
KERN
VENTURA LOSANGELES
SAN BERNARDINO
ORANGERIVERSIDE
IMPERIALSAN DIEGO
ALAMEDA
MADERA
MA
RIN
A-8
Walker
Creek
A-9
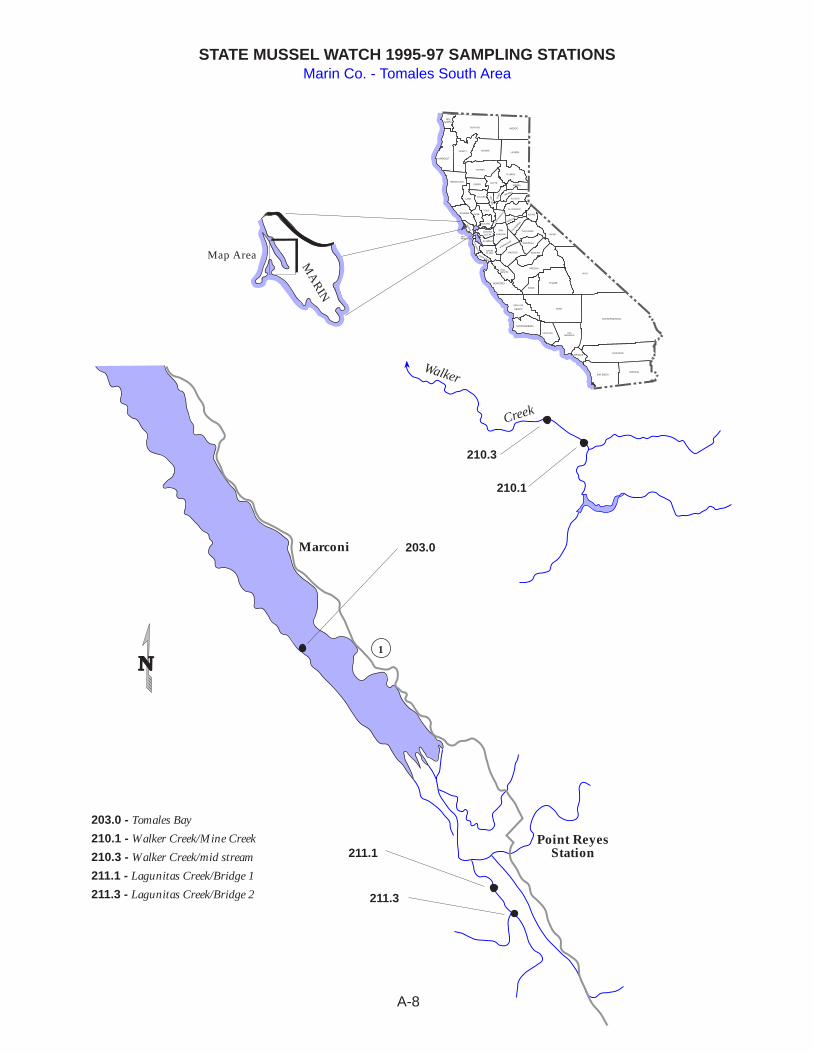
STATE MUSSEL WATCH 1995-97 SAMPLING STATIONSMarin Co. - Tiburon Area
302.6 - Paradise Cove
Map Area
302.6
N
101
17
CorteMadera
Sausalito
SAN FRANCISCO CO
COSTA CO
CO
NTR
A
SISKIYOU MODOC
DELNORTE
HUMBOLDT
TRINITY SHASTALASSEN
PLUMAS
TEHAMA
SIERRA
NEVADA
PLACER
EL DORADO
AMADOR
CALAVERAS
ALPINE
BUTTEGLENN
MENDOCINO
LAKECOLUSA
YU
BAS
UT
TE
R
SACRAM
ENTO
YOLOSONOMA NAPA
MA
RIN
SOLANO
CONTRACOSTA
SAN
JOAQUINTUOLUMNE
MONO
MARIPOSA
STANISLAUSSA
N M
ATE
O
SANFRANCISCO
SANTACLARA
SANTA CRUZ
MERCED
FRESNO
INYO
TULARE
KINGS
SANBENITO
MONTEREY
SAN LUIS
OBISPO
SANTA BARBARA
KERN
VENTURA LOSANGELES
SAN BERNARDINO
ORANGERIVERSIDE
IMPERIALSAN DIEGO
ALAMEDA
MADERAMA
RIN

STATE MUSSEL WATCH 1987-93 SAMPLING STATIONSContra Costa Co. - Martinez Area
299.1 - Selby Slag 4
Crockett
299.1
SOLANO CO
Map Area
80
680
MartinezN
SISKIYOU MODOC
DELNORTE
HUMBOLDT
TRINITY SHASTALASSEN
PLUMAS
TEHAMA
SIERRA
NEVADA
PLACER
EL DORADO
AMADOR
CALAVERAS
ALPINE
BUTTEGLENN
MENDOCINO
LAKECOLUSA
YU
BAS
UT
TE
R
SACRAM
ENTO
YOLOSONOMA NAPA
MA
RIN
SOLANO
CONTRACOSTA
SAN
JOAQUINTUOLUMNE
MONO
MARIPOSA
STANISLAUSSA
N M
ATE
O
SANFRANCISCO
SANTACLARA
SANTA CRUZ
MERCED
FRESNO
INYO
TULARE
KINGS
SANBENITO
MONTEREY
SAN LUIS
OBISPO
SANTA BARBARA
KERN
VENTURA LOSANGELES
SAN BERNARDINO
ORANGERIVERSIDE
IMPERIALSAN DIEGO
ALAMEDA
MADERA
CONTRA
COSTA
A-10

N
San Francisco
Map Area
80
101
SAN MATEO CO
307.0
306.1
306.2
306.3
306.4
SISKIYOU MODOC
DELNORTE
HUMBOLDT
TRINITY SHASTALASSEN
PLUMAS
TEHAMA
SIERRA
NEVADA
PLACER
EL DORADO
AMADOR
CALAVERAS
ALPINE
BUTTEGLENN
MENDOCINO
LAKECOLUSA
YU
BAS
UT
TE
R
SACRAM
ENTO
YOLOSONOMA NAPA
MA
RIN
SOLANO
CONTRACOSTA
SAN
JOAQUINTUOLUMNE
MONO
MARIPOSA
STANISLAUSSA
N M
ATE
O
SANFRANCISCO
SANTACLARA
SANTA CRUZ
MERCED
FRESNO
INYO
TULARE
KINGS
SANBENITO
MONTEREY
SAN LUIS
OBISPO
SANTA BARBARA
KERN
VENTURA LOSANGELES
SAN BERNARDINO
ORANGERIVERSIDE
IMPERIALSAN DIEGO
ALAMEDA
MADERA
SAN FRANCISCO
306.1 - Gashouse Cove/Laguna Street
306.2 - Sansome Street/Pier 31
306.3 - Howard Street/Pier 14
306.4 - Central Basin/Outer
307.0 - San Francisco Bay/Treasure Is
308.0 - San Francisco Bay/Hunter's Point
308.0
STATE MUSSEL WATCH 1995-97 SAMPLING STATIONSSan Francisco Co. - San Francisco Area
A-11
329.4 Alamitos Creek/Almaden Road ...............2 .............................................................................................................. A-13
400.6 Santa Cruz/Natural Bridges......................3 .............................................................................................................. A-14
400.7 Santa Cruz Harbor/Inner ..........................3 .............................................................................................................. A-14
401.0 Santa Cruz Harbor................................... 3 .............................................................................................................. A-14
403.0 Elkhorn Slough/Highway 1 Bridge..........3 .............................................................................................................. A-15
404.0 Sandholdt Bridge......................................3 .............................................................................................................. A-15
414.0 Pacific Grove............................................3 .............................................................................................................. A-16
420.3 Monterey Harbor/C G Jetty/Inner ............3 .............................................................................................................. A-16
420.4 Monterey Harbor/C G Jetty/Inner 2 .........3 .............................................................................................................. A-16
420.5 Monterey Harbor/C G Jetty/Inner 3 .........3 .............................................................................................................. A-16
421.0 Monterey Harbor/Slag Pile ......................3 .............................................................................................................. A-16
601.0 LA Harbor/National Steel ......................4 .............................................................................................................. A-17
605.0 LA Harbor/Cabrillo Pier ..........................4 .............................................................................................................. A-17
616.0 LA Harbor/Consolidated Slip ..................4 .............................................................................................................. A-17
618.0 LA Harbor/Angels Gate ..........................4 .............................................................................................................. A-17
648.0 Malibu ......................................................4 .............................................................................................................. A-18
650.0 Santa Monica............................................4 .............................................................................................................. A-19
662.0 Royal Palms .............................................4 .............................................................................................................. A-20
664.0 Cabrillo Beach .........................................4 .............................................................................................................. A-17
708.0 Anaheim Bay/Navy Marsh.......................8 .............................................................................................................. A-21
713.0 Huntington Harbour/Edinger Street .........8 .............................................................................................................. A-21
715.0 Huntington Harbour/Warner Ave Brdg ....8 .............................................................................................................. A-21
723.4 Newport Bay/Turning Basin ...................8 .............................................................................................................. A-22
724.0 Newport Bay/Highway 1 Bridge..............8 .............................................................................................................. A-22
725.0 Newport Bay/Crows Nest .......................8 .............................................................................................................. A-22
726.4 Newport Bay/Rhine Channel/End............8 .............................................................................................................. A-22
726.6 Newport Bay/Mariners Drive ..................8 .............................................................................................................. A-22
740.0 Dana Point Harbor/Boat Yard ..................9 .............................................................................................................. A-23
742.0 San Juan Creek.........................................9 .............................................................................................................. A-23
750.0 Oceanside .................................................9 .............................................................................................................. A-24
882.2 24Th St Maritime Terminal/North ...........9 .............................................................................................................. A-25
882.7 San Diego Bay/Sampson Street Pier ........9 .............................................................................................................. A-25
883.1 San Diego Bay/Chollas Creek .................9 .............................................................................................................. A-25
883.2 San Diego Bay/Chollas Creek/Mouth......9 .............................................................................................................. A-25
883.3 San Diego Bay/Chollas Creek/End ..........9 .............................................................................................................. A-25
883.5 San Diego Bay/Tuna Docks ....................9 .............................................................................................................. A-25
883.6 San Diego Bay/7th Street Channel ..........9 .............................................................................................................. A-25
883.8 San Diego Bay/Switzer Creek .................9 .............................................................................................................. A-25
885.1 San Diego Bay/Paleta Creek/End.............9 .............................................................................................................. A-25
885.3 San Diego Bay/7th Street Ch/Mid............9 .............................................................................................................. A-25
886.0 San Diego Bay/NASSCO.........................9 .............................................................................................................. A-25
888.0 San Diego Bay/Coronado Bridge.............9 .............................................................................................................. A-25
893.0 San Diego Bay/Laurel Street....................9 .............................................................................................................. A-25
893.5 San Diego Bay/B Street Pier ....................9 .............................................................................................................. A-25
894.0 SD Bay/Harbor Is/E Basin/Storm Dr ......9 .............................................................................................................. A-25

SISKIYOU MODOC
DELNORTE
HUMBOLDT
TRINITY SHASTALASSEN
PLUMAS
TEHAMA
SIERRA
NEVADA
PLACER
EL DORADO
AMADOR
CALAVERAS
ALPINE
BUTTEGLENN
MENDOCINO
LAKECOLUSA
YU
BAS
UT
TE
R
SACRAM
ENTO
YOLOSONOMA NAPA
MA
RIN
SOLANO
CONTRACOSTA
SAN
JOAQUINTUOLUMNE
MONO
MARIPOSA
STANISLAUSSA
N M
ATE
O
SANFRANCISCO
SANTACLARA
SANTA CRUZ
MERCED
FRESNO
INYO
TULARE
KINGS
SANBENITO
MONTEREY
SAN LUIS
OBISPO
SANTA BARBARA
KERN
VENTURA LOSANGELES
SAN BERNARDINO
ORANGERIVERSIDE
IMPERIALSAN DIEGO
ALAMEDA
MADERA
N
Map Area
Redwood City
92
SANTA
CLA
RA CO
San Mateo
ALA
MED
A CO
101
84
A-12
SAN
MA
TE
O
309.0 - San Mateo Bridge/8B
311.4 - North South Bay
313.0 - San Francisco Bay/near Redwood Creek
321.0 - Dumbarton Bridge/Channel Marker 14
STATE MUSSEL WATCH 1995-97 SAMPLING STATIONSSan Mateo Co. - Redwood City Area
309.0
313.0
321.0
311.4

A-13
STATE MUSSEL WATCH 1987-93 SAMPLING STATIONSSanta Clara Co. - Palo Alto Area
329.0 - Guadalupe Creek/ Almaden Expressway
329.2 - Guadalupe Creek/Hicks Road
329.4 - Alamitos Creek/Almaden Road
Map Area
329.0
329.2
329.4
San Jose
BLOSSOM
HILLRD.
ALM
AD
EN
EXPRESSWAY
Gua
dalu
pe
Creek
Alamitos
Creek
HILLSDALEAVE.
N
SISKIYOU MODOC
DELNORTE
HUMBOLDT
TRINITY SHASTALASSEN
PLUMAS
TEHAMA
SIERRA
NEVADA
PLACER
EL DORADO
AMADOR
CALAVERAS
ALPINE
BUTTEGLENN
MENDOCINO
LAKECOLUSA
YU
BAS
UT
TE
R
SACRAM
ENTO
YOLOSONOMA NAPA
MA
RIN
SOLANO
CONTRACOSTA
SAN
JOAQUINTUOLUMNE
MONO
MARIPOSA
STANISLAUSSA
N M
ATE
O
SANFRANCISCO
SANTACLARA
SANTA CRUZ
MERCED
FRESNO
INYO
TULARE
KINGS
SANBENITO
MONTEREY
SAN LUIS
OBISPO
SANTA BARBARA
KERN
VENTURA LOSANGELES
SAN BERNARDINO
ORANGERIVERSIDE
IMPERIALSAN DIEGO
ALAMEDA
MADERA
SANTACLARA

STATE MUSSEL WATCH 1987-93 SAMPLING STATIONSSanta Cruz Co. - Santa Cruz Area
Map Area
SISKIYOU MODOC
DELNORTE
HUMBOLDT
TRINITY SHASTALASSEN
PLUMAS
TEHAMA
SIERRA
NEVADA
PLACER
EL DORADO
AMADOR
CALAVERAS
ALPINE
BUTTEGLENN
MENDOCINO
LAKECOLUSA
YU
BAS
UT
TE
R
SACRAM
ENTO
YOLOSONOMA NAPA
MA
RIN
SOLANO
CONTRACOSTA
SAN
JOAQUINTUOLUMNE
MONO
MARIPOSA
STANISLAUSSA
N M
ATE
O
SANFRANCISCO
SANTACLARA
SANTA CRUZ
MERCED
FRESNO
INYO
TULARE
KINGS
SANBENITO
MONTEREY
SAN LUIS
OBISPO
SANTA BARBARA
KERN
VENTURA LOSANGELES
SAN BERNARDINO
ORANGERIVERSIDE
IMPERIALSAN DIEGO
ALAMEDA
MADERA
SANTA CRUZ
400.6 - Santa Cruz/Natural Bridges
400.7 - Santa Cruz Harbor Inner
401.0 - Santa Cruz Harbor
Santa Cruz
1
Felton
401.0400.6
400.7
N
A-14

N
Castroville
Map Area
1
SANTA C
RUZ CO
MossLanding
SISKIYOU MODOC
DELNORTE
HUMBOLDT
TRINITY SHASTALASSEN
PLUMAS
TEHAMA
SIERRA
NEVADA
PLACER
EL DORADO
AMADOR
CALAVERAS
ALPINE
BUTTEGLENN
MENDOCINO
LAKECOLUSA
YU
BAS
UT
TE
R
SACRAM
ENTO
YOLOSONOMA NAPA
MA
RIN
SOLANO
CONTRACOSTA
SAN
JOAQUINTUOLUMNE
MONO
MARIPOSA
STANISLAUSSA
N M
ATE
O
SANFRANCISCO
SANTACLARA
SANTA CRUZ
MERCED
FRESNO
INYO
TULARE
KINGS
SANBENITO
MONTEREY
SAN LUIS
OBISPO
SANTA BARBARA
KERN
VENTURA LOSANGELES
SAN BERNARDINO
ORANGERIVERSIDE
IMPERIALSAN DIEGO
ALAMEDA
MADERA
MONTEREY
STATE MUSSEL WATCH 1995-97 SAMPLING STATIONSMonterey Co. - Moss Landing Area
403.0 - Elkhorn Slough/Highway 1 Bridge
404.0 - Sandholdt Bridge
404.0
A-15
403.0

N
Monterey
Map Area
1Carmel
SISKIYOU MODOC
DELNORTE
HUMBOLDT
TRINITY SHASTALASSEN
PLUMAS
TEHAMA
SIERRA
NEVADA
PLACER
EL DORADO
AMADOR
CALAVERAS
ALPINE
BUTTEGLENN
MENDOCINO
LAKECOLUSA
YU
BAS
UT
TE
R
SACRAM
ENTO
YOLOSONOMA NAPA
MA
RIN
SOLANO
CONTRACOSTA
SAN
JOAQUINTUOLUMNE
MONO
MARIPOSA
STANISLAUSSA
N M
ATE
O
SANFRANCISCO
SANTACLARA
SANTA CRUZ
MERCED
FRESNO
INYO
TULARE
KINGS
SANBENITO
MONTEREY
SAN LUIS
OBISPO
SANTA BARBARA
KERN
VENTURA LOSANGELES
SAN BERNARDINO
ORANGERIVERSIDE
IMPERIALSAN DIEGO
ALAMEDA
MADERA
MONTEREY
STATE MUSSEL WATCH 1995-97 SAMPLING STATIONSMonterey Co. - Monterey Area
414.0
414.0 - Pacific Grove
420.3 - Monterey Harbor/C G Jetty/Inner
420.4 - Monterey Harbor/C G Jetty/Inner 2
420.5 - Monterey Harbor/C G Jetty/Inner 3
421.0 - Monterey Harbor/Slag Pile
See Insert A
Insert A
420.5
421.0
420.3
A-16
420.4

SanPedro
Long Beach
Map Area
SISKIYOU MODOC
DELNORTE
HUMBOLDT
TRINITY SHASTALASSEN
PLUMAS
TEHAMA
SIERRA
NEVADA
PLACER
EL DORADO
AMADOR
CALAVERAS
ALPINE
BUTTEGLENN
MENDOCINO
LAKECOLUSA
YU
BAS
UT
TE
R
SACRAM
ENTO
YOLOSONOMA NAPA
MAR
IN
SOLANO
CONTRACOSTA
SAN
JOAQUINTUOLUMNE
MONO
MARIPOSA
STANISLAUSSA
N M
ATEO
SANFRANCISCO
SANTACLARA
SANTA CRUZ
MERCED
FRESNO
INYO
TULARE
KINGS
SANBENITO
MONTEREY
SAN LUIS
OBISPO
SANTA BARBARA
KERN
VENTURA LOSANGELES
SAN BERNARDINO
ORANGERIVERSIDE
IMPERIALSAN DIEGO
ALAMEDA
MADERALOSANGELES
ORANGE CO
664.0
A-17
N
1
STATE MUSSEL WATCH 1995-97 SAMPLING STATIONSLos Angeles Co. - Long Beach Area
601.0 - L A Harbor / National Steel605.0 - L A Harbor / Cabrillo Pier616.0 - L A Harbor / Consolidated Slip618.0 - L A Harbor / Angeles Gate664.0 - Cabrillo Beach
616.0
601.0
605.0
618.0

Malibu
Map Area
MalibuRiviera
VENTURA CO
LOS ANGELES CO
SISKIYOU MODOC
DELNORTE
HUMBOLDT
TRINITY SHASTALASSEN
PLUMAS
TEHAMA
SIERRA
NEVADA
PLACER
EL DORADO
AMADOR
CALAVERAS
ALPINE
BUTTEGLENN
MENDOCINO
LAKECOLUSA
YU
BAS
UT
TE
R
SACRAM
ENTO
YOLOSONOMA NAPA
MAR
IN
SOLANO
CONTRACOSTA
SAN
JOAQUINTUOLUMNE
MONO
MARIPOSA
STANISLAUSSA
N M
ATEO
SANFRANCISCO
SANTACLARA
SANTA CRUZ
MERCED
FRESNO
INYO
TULARE
KINGS
SANBENITO
MONTEREY
SAN LUIS
OBISPO
SANTA BARBARA
KERN
VENTURA LOSANGELES
SAN BERNARDINO
ORANGERIVERSIDE
IMPERIALSAN DIEGO
ALAMEDA
MADERALOSANGELES
N
1
23
27
STATE MUSSEL WATCH 1995-97 SAMPLING STATIONSLos Angeles Co. - Malibu Area
648.0 - Malibu
648.0
A-18

SantaMonica
Map Area
SISKIYOU MODOC
DELNORTE
HUMBOLDT
TRINITY SHASTALASSEN
PLUMAS
TEHAMA
SIERRA
NEVADA
PLACER
EL DORADO
AMADOR
CALAVERAS
ALPINE
BUTTEGLENN
MENDOCINO
LAKECOLUSA
YU
BAS
UT
TE
R
SACRAM
ENTO
YOLOSONOMA NAPA
MAR
IN
SOLANO
CONTRACOSTA
SAN
JOAQUINTUOLUMNE
MONO
MARIPOSA
STANISLAUSSA
N M
ATEO
SANFRANCISCO
SANTACLARA
SANTA CRUZ
MERCED
FRESNO
INYO
TULARE
KINGS
SANBENITO
MONTEREY
SAN LUIS
OBISPO
SANTA BARBARA
KERN
VENTURA LOSANGELES
SAN BERNARDINO
ORANGERIVERSIDE
IMPERIALSAN DIEGO
ALAMEDA
MADERALOSANGELES
A-19
N
1
STATE MUSSEL WATCH 1995-97 SAMPLING STATIONSLos Angeles Co. - Santa Monica Area
650.0 - Santa Monica
650.0

San Pedro
Map Area
ManhattanBeach
RedondoBeach
SISKIYOU MODOC
DELNORTE
HUMBOLDT
TRINITY SHASTALASSEN
PLUMAS
TEHAMA
SIERRA
NEVADA
PLACER
EL DORADO
AMADOR
CALAVERAS
ALPINE
BUTTEGLENN
MENDOCINO
LAKECOLUSA
YU
BAS
UT
TE
R
SACRAM
ENTO
YOLOSONOMA NAPA
MAR
IN
SOLANO
CONTRACOSTA
SAN
JOAQUINTUOLUMNE
MONO
MARIPOSA
STANISLAUSSA
N M
ATEO
SANFRANCISCO
SANTACLARA
SANTA CRUZ
MERCED
FRESNO
INYO
TULARE
KINGS
SANBENITO
MONTEREY
SAN LUIS
OBISPO
SANTA BARBARA
KERN
VENTURA LOSANGELES
SAN BERNARDINO
ORANGERIVERSIDE
IMPERIALSAN DIEGO
ALAMEDA
MADERA
LOSANGELES
N
1
STATE MUSSEL WATCH 1995-97 SAMPLING STATIONSLos Angeles Co. - Redondo Beach Area
662.0 - Royal Palms
662.0
A-20

HuntingtonBeach
1
Map Area
N
SealBeach
ORANG
E CO
ANGELE
S
LOS
CO
708.0
SISKIYOU MODOC
DELNORTE
HUMBOLDT
TRINITY SHASTALASSEN
PLUMAS
TEHAMA
SIERRA
NEVADA
PLACER
EL DORADO
AMADOR
CALAVERAS
ALPINE
BUTTEGLENN
MENDOCINO
LAKECOLUSA
YU
BAS
UT
TE
R
SACRAM
ENTO
YOLOSONOMA NAPA
MA
RIN
SOLANO
CONTRACOSTA
SAN
JOAQUINTUOLUMNE
MONO
MARIPOSA
STANISLAUSSA
N M
ATE
O
SANFRANCISCO
SANTACLARA
SANTA CRUZ
MERCED
FRESNO
INYO
TULARE
KINGS
SANBENITO
MONTEREY
SAN LUIS
OBISPO
SANTA BARBARA
KERN
VENTURA LOSANGELES
SAN BERNARDINO
ORANGERIVERSIDE
IMPERIALSAN DIEGO
ALAMEDA
MADERA
ORANGE
STATE MUSSEL WATCH 1995-97 SAMPLING STATIONSOrange Co. - Anaheim Bay Area
708.0 - Anaheim Bay/Navy Marsh
713.0 - Huntington Harbour / Edinger Street
715.0 - Huntington Harbour / Warner Ave. Bridge
713.0
715.0
A-21

Irvine
INTERSTATE 5
1
Map Area
55
INTERSTATE 405
Costa Mesa
73
N
A-22
SISKIYOU MODOC
DELNORTE
HUMBOLDT
TRINITY SHASTALASSEN
PLUMAS
TEHAMA
SIERRA
NEVADA
PLACER
EL DORADO
AMADOR
CALAVERAS
ALPINE
BUTTEGLENN
MENDOCINO
LAKECOLUSA
YU
BAS
UT
TE
R
SACRAMENTO
YOLOSONOMA NAPA
MAR
IN
SOLANO
CONTRACOSTA
SAN
JOAQUINTUOLUMNE
MONO
MARIPOSA
STANISLAUSSA
N M
ATEO
SANFRANCISCO
SANTACLARA
SANTA CRUZ
MERCED
FRESNO
INYO
TULARE
KINGS
SANBENITO
MONTEREY
SAN LUIS
OBISPO
SANTA BARBARA
KERN
VENTURA LOSANGELES
SAN BERNARDINO
ORANGERIVERSIDE
IMPERIALSAN DIEGO
ALAMEDA
MADERA
ORANGE
STATE MUSSEL WATCH 1995-97 SAMPLING STATIONSOrange Co. - Newport Bay Area
723.4 - Newport Bay / Turning Basin
724.0 - Newport Bay / Highway 1 Bridge
725.0 - Newport Bay / Crows Nest
726.4 - Newport Bay / Rhine Channel/End
726.6 - Newport Bay / Mariners Drive
723.4
726.4
725.0
724.0
726.6

740.0 - Dana Point Harbor / Boat Yard
742.0 - San Juan Creek
San JuanCapistrano
INTERSTATE 5
740.0
1
STATE MUSSEL WATCH 1987-93 SAMPLING STATIONSOrange Co. - Dana Point Area
Map Area
742.0
N
SISKIYOU MODOC
DELNORTE
HUMBOLDT
TRINITY SHASTALASSEN
PLUMAS
TEHAMA
SIERRA
NEVADA
PLACER
EL DORADO
AMADOR
CALAVERAS
ALPINE
BUTTEGLENN
MENDOCINO
LAKECOLUSA
YU
BAS
UT
TE
R
SACRAM
ENTO
YOLOSONOMA NAPA
MA
RIN
SOLANO
CONTRACOSTA
SAN
JOAQUINTUOLUMNE
MONO
MARIPOSA
STANISLAUSSA
N M
ATE
O
SANFRANCISCO
SANTACLARA
SANTA CRUZ
MERCED
FRESNO
INYO
TULARE
KINGS
SANBENITO
MONTEREY
SAN LUIS
OBISPO
SANTA BARBARA
KERN
VENTURA LOSANGELES
SAN BERNARDINO
ORANGERIVERSIDE
IMPERIALSAN DIEGO
ALAMEDA
MADERA
ORANGE
A-23

Map Area
Oceanside
INTERSTATE 5
N
SISKIYOU MODOC
DELNORTE
HUMBOLDT
TRINITY SHASTALASSEN
PLUMAS
TEHAMA
SIERRA
NEVADA
PLACER
EL DORADO
AMADOR
CALAVERAS
ALPINE
BUTTEGLENN
MENDOCINO
LAKECOLUSA
YU
BAS
UT
TE
R
SACRAM
ENTO
YOLOSONOMA NAPA
MA
RIN
SOLANO
CONTRACOSTA
SAN
JOAQUINTUOLUMNE
MONO
MARIPOSA
STANISLAUSSA
N M
ATE
O
SANFRANCISCO
SANTACLARA
SANTA CRUZ
MERCED
FRESNO
INYO
TULARE
KINGS
SANBENITO
MONTEREY
SAN LUIS
OBISPO
SANTA BARBARA
KERN
VENTURA LOSANGELES
SAN BERNARDINO
ORANGERIVERSIDE
IMPERIALSAN DIEGO
ALAMEDA
MADERA
SAN DIEGO
A-24
STATE MUSSEL WATCH 1995-97 SAMPLING STATIONSSan Diego Co. - Oceanside Area
750.0 - Oceanside
750.0

INTE
RS
TATE 5
Map Area
SISKIYOU MODOC
DELNORTE
HUMBOLDT
TRINITY SHASTALASSEN
PLUMAS
TEHAMA
SIERRA
NEVADA
PLACER
EL DORADO
AMADOR
CALAVERAS
ALPINE
BUTTEGLENN
MENDOCINO
LAKECOLUSA
YU
BAS
UT
TE
R
SACRAM
ENTO
YOLOSONOMA NAPA
MA
RIN
SOLANO
CONTRACOSTA
SAN
JOAQUINTUOLUMNE
MONO
MARIPOSA
STANISLAUSSA
N M
ATE
O
SANFRANCISCO
SANTACLARA
SANTA CRUZ
MERCED
FRESNO
INYO
TULARE
KINGS
SANBENITO
MONTEREY
SAN LUIS
OBISPO
SANTA BARBARA
KERN
VENTURA LOSANGELES
SAN BERNARDINO
ORANGERIVERSIDE
IMPERIALSAN DIEGO
ALAMEDA
MADERA
SAN DIEGO
N
888.0
893.0
883.6
893.5
885.3
885.1
882.2
882.7
886.0
STATE MUSSEL WATCH 1995-97 SAMPLING STATIONSSan Diego Co. - San Diego Bay Area
882.2 - 24th St Maritime Terminal / North882.7 - San Diego Bay / Sampson Street Pier883.1 - San Diego Bay / Chollas Creek883.2 - San Diego Bay / Chollas Creek/Mouth883.3 - San Diego Bay / Chollas Creek/End883.5 - San Diego Bay / Tuna Docks883.6 - San Diego Bay / 7th Street Channel883.8 - San Diego Bay / Switzer Channel885.1- San Diego Bay / Paleta Creek/End885.3- San Diego Bay / 7th Street Ch/Mid886.0- San Diego Bay / NASSCO888.0 - San Diego Bay / Coronado Bridge893.0 - San Diego Bay / Laurel Street893.5 - San Diego Bay / B Street Pier894.0 - San Diego Bay / Harbor Is/E Basin/Storm Drain
883.1
883.5
894.0
883.8
883.3
883.2
A-25

B-1
APPENDIX B
1995-97 Sampling Stations - Latitude and Longitude

B-2
APPENDIX BState Mussel Watch Program
1995-97 Sampling Stations - Latitude and Longitude
Station Station Region County Latitude Longitude
Number Name (o ' ") (o ' ")
1.0 Crescent City Harbor 1 Del Norte 41 44 55 124 10 57
2.0 Crescent City/STP Outfall 1 Del Norte 41 44 38 124 12 10
2.2 Crescent City Harbor/Inner Jetty 1 Del Norte 41 44 40 124 11 52
3.0 Crescent City/Control 1 Del Norte 41 45 03 124 12 51
100.0 Mad River Slough 1 Humboldt 40 51 56 124 08 53
101.4 Arcata Bay/Jolly Giant Slough 1 Humboldt 40 51 22 124 05 26
101.5 Humboldt Bay/Eureka SM.22 1 Humboldt 40 48 10 124 10 45
101.8 Humboldt Bay/Halberson Shoreline 1 Humboldt 40 48 34 124 09 10
102.6 Humboldt Bay/J Street 1 Humboldt 40 48 23 124 09 44
102.7 Humboldt Bay/H Street 1 Humboldt 40 48 23 124 09 52
102.8 Humboldt Bay/Davenport Mar. C St 1 Humboldt 40 48 21 124 10 13
103.3 Humboldt Bay/E Street 1 Humboldt 40 48 23 124 10 05
103.5 Humboldt Bay/Clark Slough 1 Humboldt 40 48 10 124 10 41
104.1 Humboldt Bay/Union Oil Plant 1 Humboldt 40 47 44 124 11 13
104.2 Humboldt Bay/Coal Oil Gas Plant 1 Humboldt 40 47 39 124 11 17
104.3 Humboldt Bay/Old Pac. Lumber 1 Humboldt 40 47 11 124 11 18
202.0 Bodega Head 1 Sonoma 38 18 39 123 04 07
203.0 Tomales Bay 2 Marin 38 08 56 123 54 09
203.1 Tomales Bay/Vincent Landing 2 Marin 38 13 06 122 56 51
203.3 Tomales Bay/Walker Creek Mouth 1 2 Marin 38 12 21 122 55 39
203.5 Tomales Bay/Walker Creek Mouth 2 2 Marin 38 12 30 122 55 51
203.7 Tomales Bay/Walker Creek Mouth 3 2 Marin 38 12 37 122 56 01
203.9 Tomales Bay/Nicks Cove 2 Marin 38 11 57 122 55 16
205.0 Bodega Harbor/Spud Point Marina 1 Sonoma 38 19 53 123 03 34
205.1 Bodega Bay/Porto Bodega 1 Sonoma 38 20 04 123 03 02
205.3 Bodega Bay/Mason's Marina 1 Sonoma 38 19 56 123 03 30
205.5 Bodega Bay/Back Marsh 1 Sonoma 38 19 21 123 02 26
210.1 Walker Creek/Mine Creek 2 Marin 38 10 56 122 47 09
210.3 Walker Creek/mid stream 2 Marin 38 10 45 122 47 35
211.1 Lagunitas Creek/Bridge 1 2 Marin 38 03 23 122 48 49
211.3 Lagunitas Creek/Bridge 2 2 Marin 38 02 45 122 48 20
280.0 Russian River/S Goat Rock 1 Sonoma 38 26 58 123 07 30
299.1 Selby Slag 4 2 Contra Costa 38 03 25 122 14 52
302.6 Paradise Cove 2 Marin 37 53 58 122 27 52
306.1 Gashouse Cove/Laguna Street 2 San Francisco 37 48 23 122 25 57
306.2 Sansome Street/Pier 31 2 San Francisco 37 48 23 122 24 10
306.3 Howard Street/Pier 14 2 San Francisco 37 47 35 122 23 26
306.4 Central Basin/Outer 2 San Francisco 37 45 47 122 23 05
307.0 San Francisco Bay/Treasure Is 2 San Francisco 37 48 53 122 20 20
308.0 San Francisco Bay/Hunter's Point 2 San Francisco 37 41 42 122 20 27
309.0 San Mateo Bridge/8B 2 San Mateo 37 36 21 122 17 20
311.4 North South Bay 2 Alameda 37 34 16 122 08 59
313.0 San Francisco Bay/near Redwood Cr 2 San Mateo 37 33 09 122 11 45
321.0 Dumbarton Bridge/Channel Marker 14 2 San Mateo 37 30 50 122 07 58
329.0 Guadalupe Creek/Almaden Expressway 2 Santa Clara 37 16 31 121 52 33
329.2 Guadalupe Creek/Hicks Road 2 Santa Clara 37 13 22 121 54 16
329.4 Alamitos Creek/Almaden Road 2 Santa Clara 37 10 44 121 48 57
400.6 Santa Cruz/Natural Bridges 3 Santa Cruz 37 55 02 122 03 50
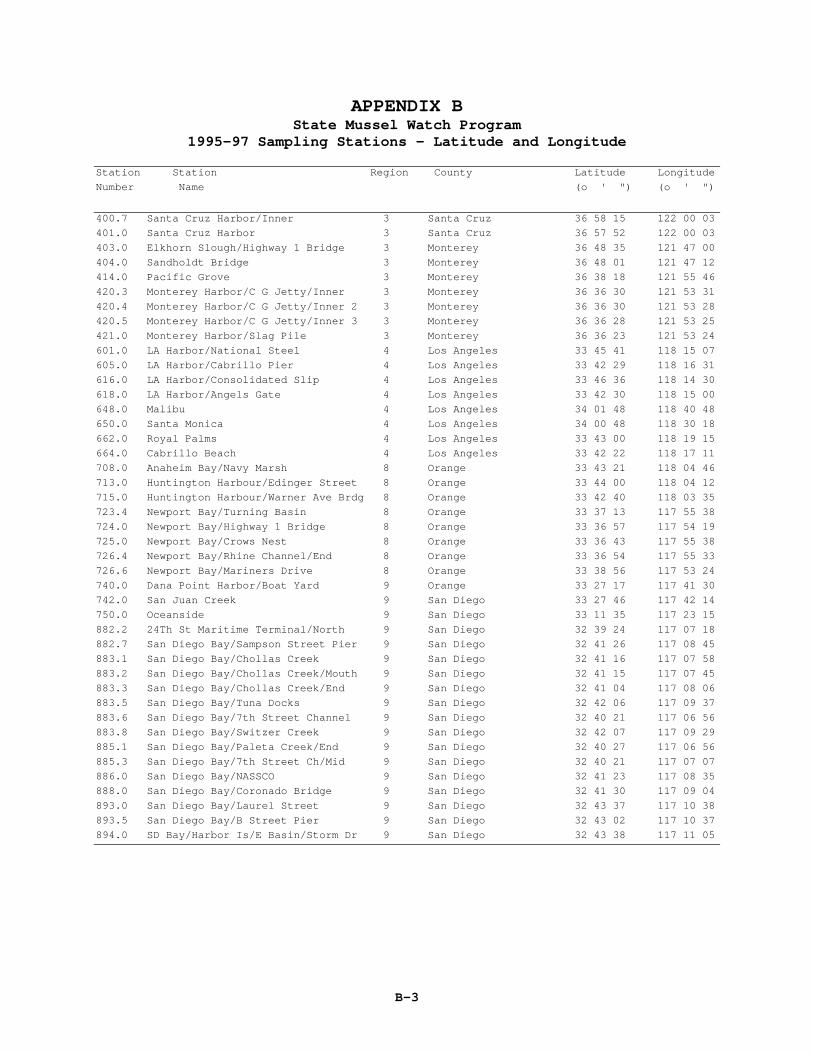
B-3
APPENDIX BState Mussel Watch Program
1995-97 Sampling Stations - Latitude and Longitude
Station Station Region County Latitude Longitude
Number Name (o ' ") (o ' ")
400.7 Santa Cruz Harbor/Inner 3 Santa Cruz 36 58 15 122 00 03
401.0 Santa Cruz Harbor 3 Santa Cruz 36 57 52 122 00 03
403.0 Elkhorn Slough/Highway 1 Bridge 3 Monterey 36 48 35 121 47 00
404.0 Sandholdt Bridge 3 Monterey 36 48 01 121 47 12
414.0 Pacific Grove 3 Monterey 36 38 18 121 55 46
420.3 Monterey Harbor/C G Jetty/Inner 3 Monterey 36 36 30 121 53 31
420.4 Monterey Harbor/C G Jetty/Inner 2 3 Monterey 36 36 30 121 53 28
420.5 Monterey Harbor/C G Jetty/Inner 3 3 Monterey 36 36 28 121 53 25
421.0 Monterey Harbor/Slag Pile 3 Monterey 36 36 23 121 53 24
601.0 LA Harbor/National Steel 4 Los Angeles 33 45 41 118 15 07
605.0 LA Harbor/Cabrillo Pier 4 Los Angeles 33 42 29 118 16 31
616.0 LA Harbor/Consolidated Slip 4 Los Angeles 33 46 36 118 14 30
618.0 LA Harbor/Angels Gate 4 Los Angeles 33 42 30 118 15 00
648.0 Malibu 4 Los Angeles 34 01 48 118 40 48
650.0 Santa Monica 4 Los Angeles 34 00 48 118 30 18
662.0 Royal Palms 4 Los Angeles 33 43 00 118 19 15
664.0 Cabrillo Beach 4 Los Angeles 33 42 22 118 17 11
708.0 Anaheim Bay/Navy Marsh 8 Orange 33 43 21 118 04 46
713.0 Huntington Harbour/Edinger Street 8 Orange 33 44 00 118 04 12
715.0 Huntington Harbour/Warner Ave Brdg 8 Orange 33 42 40 118 03 35
723.4 Newport Bay/Turning Basin 8 Orange 33 37 13 117 55 38
724.0 Newport Bay/Highway 1 Bridge 8 Orange 33 36 57 117 54 19
725.0 Newport Bay/Crows Nest 8 Orange 33 36 43 117 55 38
726.4 Newport Bay/Rhine Channel/End 8 Orange 33 36 54 117 55 33
726.6 Newport Bay/Mariners Drive 8 Orange 33 38 56 117 53 24
740.0 Dana Point Harbor/Boat Yard 9 Orange 33 27 17 117 41 30
742.0 San Juan Creek 9 San Diego 33 27 46 117 42 14
750.0 Oceanside 9 San Diego 33 11 35 117 23 15
882.2 24Th St Maritime Terminal/North 9 San Diego 32 39 24 117 07 18
882.7 San Diego Bay/Sampson Street Pier 9 San Diego 32 41 26 117 08 45
883.1 San Diego Bay/Chollas Creek 9 San Diego 32 41 16 117 07 58
883.2 San Diego Bay/Chollas Creek/Mouth 9 San Diego 32 41 15 117 07 45
883.3 San Diego Bay/Chollas Creek/End 9 San Diego 32 41 04 117 08 06
883.5 San Diego Bay/Tuna Docks 9 San Diego 32 42 06 117 09 37
883.6 San Diego Bay/7th Street Channel 9 San Diego 32 40 21 117 06 56
883.8 San Diego Bay/Switzer Creek 9 San Diego 32 42 07 117 09 29
885.1 San Diego Bay/Paleta Creek/End 9 San Diego 32 40 27 117 06 56
885.3 San Diego Bay/7th Street Ch/Mid 9 San Diego 32 40 21 117 07 07
886.0 San Diego Bay/NASSCO 9 San Diego 32 41 23 117 08 35
888.0 San Diego Bay/Coronado Bridge 9 San Diego 32 41 30 117 09 04
893.0 San Diego Bay/Laurel Street 9 San Diego 32 43 37 117 10 38
893.5 San Diego Bay/B Street Pier 9 San Diego 32 43 02 117 10 37
894.0 SD Bay/Harbor Is/E Basin/Storm Dr 9 San Diego 32 43 38 117 11 05

C-1
APPENDIX C
1995-97 Sample Information

C-2
APPENDIX CState Mussel Watch Program1995-97 Sample Information
Transplant Percent Percent Length Sample BayStation Station Sample Sample Duration Water Lipid (mm) Analysis ProtectionNumber Name Type* Date (months) E/SO E/SO Type** Samples***
1.0 Crescent City Harbor RCM 04/09/97 NA 87.5/86.9 1.19 42.0/49.8 EO 2.0 Crescent City/STP Outfall RCM 04/09/97 NA 86.7/86.2 0.89 41.7/53.9 EO 2.2 Crescent City Harbor/Inner Jetty RCM 04/09/97 NA 83.4/82.8 1.31 49.6/47.3 EO 3.0 Crescent City/Control RCM 04/10/97 NA 84.8/84.6 1.06 52.7/49.1 EO 100.0 Mad River Slough OYS 04/10/97 NA 85.0/84.9 1.32 41.3/41.5 EO 101.4 Arcata Bay/Jolly Giant Slough PAC 04/18/96 NA 67.0/70.0 0.64 NA/NA EO X101.5 Humboldt Bay/Eureka SM.22 SED 02/15/95 NA NA/45.5 NA NA/NA O X101.5 Humboldt Bay/Eureka SM.22 TCM 02/15/95 3.5 NA/83.3 0.86 NA/52.6 O X101.8 Humboldt Bay/Halberson Shoreline GLY 04/17/96 NA 88.5/88.6 1.34 NA/NA EO X101.8 Humboldt Bay/Halberson Shoreline PAC 04/17/96 NA 69.5/71.2 0.53 NA/NA EO X101.8 Humboldt Bay/Halberson Shoreline RBM-s 04/17/96 NA 88.4/84.7 1.03 24.5/24.5 EO X102.6 Humboldt Bay/J Street POD 02/15/95 NA NA/81.3 1.61 NA/NA O X102.6 Humboldt Bay/J Street PAC 02/15/95 NA NA/79.3 4.81 NA/NA O X102.6 Humboldt Bay/J Street RCM 02/15/95 NA NA/91.5 0.30 NA/65.1 O X102.6 Humboldt Bay/J Street SED 02/15/95 NA NA/43.6 NA NA/NA O X102.6 Humboldt Bay/J Street TCM 02/15/95 3.5 NA/84.0 0.87 NA/65.5 O X102.6 Humboldt Bay/J Street GLY 04/17/96 NA 86.7/86.3 0.65 NA/NA EO X102.6 Humboldt Bay/J Street PAC 04/17/96 NA 64.6/67.1 1.22 NA/NA EO X102.6 Humboldt Bay/J Street RBM 04/17/96 NA 90.6/89.4 0.73 78.2/78.2 EO X102.6 Humboldt Bay/J Street RBM-s 04/17/96 NA 87.7/NA NA 28.1/NA E X102.6 Humboldt Bay/J Street TCM 04/10/97 4.1 82.5/80.7 1.57 50.3/49.6 EO 102.7 Humboldt Bay/H Street SED 02/15/95 NA NA/47.7 NA NA/NA O X102.7 Humboldt Bay/H Street TCM 02/15/95 3.5 NA/82.2 1.02 NA/58.2 O X102.7 Humboldt Bay/H Street GLY 04/17/96 NA 81.9/82.7 3.23 NA/NA EO X102.7 Humboldt Bay/H Street PAC 04/17/96 NA 66.4/66.7 0.99 NA/NA EO X102.7 Humboldt Bay/H Street RBM-s 04/17/96 NA 88.1/87.2 0.86 23.1/23.1 EO X102.8 Humboldt Bay/Davenport Mar. C St SED 02/15/95 NA NA/41.2 NA NA/NA O X103.3 Humboldt Bay/E Street TCM 04/10/97 4.1 82.1/81.9 1.66 45.4/49.9 EO 103.5 Humboldt Bay/Clark Slough TCM 04/10/97 4.1 83.7/81.4 1.46 48.5/49.1 EO 104.1 Humboldt Bay/Union Oil Plant SED 02/15/95 NA NA/47.1 NA NA/NA O X104.1 Humboldt Bay/Union Oil Plant TCM 02/15/95 3.5 NA/84.0 0.81 NA/57.5 O X104.2 Humboldt Bay/Coal Oil Gas Plant SED 02/15/95 NA NA/40.0 NA NA/NA O X
* RCM = Resident California Mussel SED = Sediment ** E = Trace Elements NA = Not Analyzed TFC = Transplanted Freshwater Clam POD = Abalone Jingle (Pododesmus cepio) O = Synthetic Organics RBM = Resident Bay Mussel (s = small size) EO = Trace Elements & Synthetic Organics TCM = Transplanted California Mussel (a = archive) PAC = Shore Crab (Pachygrapsus crassipes) OYS = Oyster (Crassostrea gigas) GLY = Sand Worm (Glycera spp.)*** Samples analyzed through the SWRCB’s Bay Protection Program.

C-3
APPENDIX CState Mussel Watch Program1995-97 Sample Information
Transplant Percent Percent Length Sample BayStation Station Sample Sample Duration Water Lipid (mm) Analysis ProtectionNumber Name Type* Date (months) E/SO E/SO Type** Samples***
104.2 Humboldt Bay/Coal Oil Gas Plant TCM 02/15/95 3.5 NA/83.3 0.83 NA/63.3 O X104.3 Humboldt Bay/Old Pac. Lumber SED 02/15/95 NA NA/50.1 NA NA/NA O X104.3 Humboldt Bay/Old Pac. Lumber TCM 02/15/95 3.5 NA/83.7 0.73 NA/56.3 O X202.0 Bodega Head RCM 09/11/95 NA 82.8/82.5 0.29 46.2/43.8 EO 202.0 Bodega Head RCM 08/29/96 NA 82.9/83.5 0.95 54.9/53.4 EO 203.0 Tomales Bay RBM 04/14/97 NA 89.3/NA NA 50.1/NA E203.0 Tomales Bay TCM 04/14/97 3.7 80.2/NA NA 55.5/NA E203.1 Tomales Bay/Vincent Landing SED 04/14/97 NA 79.2/NA NA NA/NA E203.1 Tomales Bay/Vincent Landing TCM 04/14/97 3.7 82.9/NA NA 47.9/NA E203.3 Tomales Bay/Walker Creek Mouth 1 TCM 04/14/97 3.7 82.7/NA NA 46.6/NA E203.5 Tomales Bay/Walker Creek Mouth 2 TCM 04/14/97 3.7 83.5/NA NA 48.7/NA E203.7 Tomales Bay/Walker Creek Mouth 3 SED 04/14/97 NA 53.9/NA NA NA/NA E203.7 Tomales Bay/Walker Creek Mouth 3 TCM 04/14/97 3.7 83.2/NA NA 47.8/NA E203.9 Tomales Bay/Nicks Cove TCM 04/14/97 3.7 81.9/NA NA 47.1/NA E205.0 Bodega Harbor/Spud Point Marina TCM 03/21/97 3.5 85.3/85.6 1.19 54.3/61.5 EO 205.1 Bodega Bay/Porto Bodega RBM 03/21/97 NA 87.1/87.2 0.90 62.9/59.3 EO 205.3 Bodega Bay/Mason's Marina TCM 03/21/97 3.5 84.1/82.6 1.34 56.0/53.2 EO 205.5 Bodega Bay/Back Marsh RBM 03/21/97 NA 84.7/90.1 0.68 44.7/47.8 EO 210.1 Walker Creek/Mine Creek TFC 01/17/97 2.2 86.1/NA NA 29.4/NA E210.3 Walker Creek/mid stream TFC 01/17/97 2.2 85.6/NA NA 29.5/NA E211.1 Lagunitas Creek/Bridge 1 TFC 01/17/97 2.2 82.1/NA NA 29.6/NA E211.3 Lagunitas Creek/Bridge 2 TFC 01/17/97 2.2 82.1/NA NA 28.2/NA E280.0 Russian River/S Goat Rock RCM 03/21/97 NA 85.5/85.2 0.89 43.0/43.1 EO 299.1 Selby Slag 4 SED 10/27/95 NA 39.0/37.9 NA NA/NA EO X302.6 Paradise Cove SED 10/26/95 NA 53.5/53.5 NA NA/NA EO X306.1 Gashouse Cove/Laguna Street SED 12/07/95 NA 62.6/61.7 NA NA/NA EO X306.2 Sansome Street/Pier 31 SED 12/06/95 NA 56.3/57.0 NA NA/NA EO X306.3 Howard Street/Pier 14 SED 12/06/95 NA 42.4/40.3 NA NA/NA EO X306.4 Central Basin/Outer SED 12/06/95 NA 60.0/63.7 NA NA/NA EO X307.0 San Francisco Bay/Treasure Is TCM-a 01/26/81 5.4 NA/85.6 1.19 NA/57.9 O307.0 San Francisco Bay/Treasure Is TCM-a 02/02/82 5.8 NA/86.7 1.03 NA/68.5 O308.0 San Francisco Bay/Hunter's Point TCM-a 01/26/81 5.4 NA/85.9 1.02 NA/54.6 O
* RCM = Resident California Mussel SED = Sediment ** E = Trace Elements NA = Not Analyzed TFC = Transplanted Freshwater Clam O = Synthetic Organics RBM = Resident Bay Mussel (s = small size) EO = Trace Elements & Synthetic Organics TCM = Transplanted California Mussel (a = archive) PAC = Shore Crab (Pachygrapsus crassipes) OYS = Oyster (Crassostrea gigas) GLY = Sand Worm (Glycera spp.)*** Samples analyzed through the SWRCB’s Bay Protection Program.

C-4
APPENDIX CState Mussel Watch Program1995-97 Sample Information
Transplant Percent Percent Length Sample BayStation Station Sample Sample Duration Water Lipid (mm) Analysis ProtectionNumber Name Type* Date (months) E/SO E/SO Type** Samples***
309.0 San Mateo Bridge/8B TCM-a 02/09/81 5.8 NA/86.6 1.09 NA/52.7 O311.4 North South Bay SED 12/06/95 NA 35.1/36.3 NA NA/NA EO X313.0 San Francisco Bay/near Redwood Cr TCM-a 01/26/81 5.4 NA/83.4 1.89 NA/55.1 O321.0 Dumbarton Bridge/Channel Marker 14 TCM-a 02/09/81 5.8 NA/84.2 1.65 NA/62.7 O329.0 Guadalupe Creek/Almaden Expressway TFC 12/16/96 0.9 87.3/NA NA 27.9/NA E329.2 Guadalupe Creek/Hicks Road TFC 12/16/96 0.9 85.6/NA NA 30.2/NA E329.4 Alamitos Creek/Almaden Road TFC 12/16/96 0.9 87.4/NA NA 29.3/NA E400.6 Santa Cruz/Natural Bridges RCM 06/09/97 NA 82.6/81.5 1.35 51.6/52.4 EO 400.7 Santa Cruz Harbor/Inner TCM 03/25/96 4.8 89.9/89.6 0.24 50.7/55.3 EO 401.0 Santa Cruz Harbor TCM 03/25/96 4.8 88.7/89.0 0.35 48.4/52.7 EO 403.0 Elkhorn Slough/Highway 1 Bridge TCM 03/12/97 4.4 83.2/83.9 1.33 52.7/55.3 EO 404.0 Sandholdt Bridge TCM 02/16/96 3.8 85.2/86.1 0.92 54.1/52.3 EO 404.0 Sandholdt Bridge TCM 03/04/97 4.1 86.2/88.4 0.84 48.7/50.4 EO 414.0 Pacific Grove RCM 03/07/96 NA 84.0/83.2 0.44 68.7/61.2 EO 414.0 Pacific Grove RCM 04/25/97 NA 86.7/87.2 0.76 66.2/67.3 EO 420.3 Monterey Harbor/C G Jetty/Inner TCM 02/13/96 3.7 82.1/NA NA 60.3/NA E420.4 Monterey Harbor/C G Jetty/Inner 2 TCM 02/13/96 3.7 81.6/NA NA 59.9/NA E420.5 Monterey Harbor/C G Jetty/Inner 3 TCM 02/13/96 3.7 81.2/NA NA 59.4/NA E421.0 Monterey Harbor/Slag Pile TCM 02/13/96 3.7 85.1/NA NA 52.7/NA E601.0 LA Harbor/National Steel TCM 01/18/96 3.6 87.6/86.6 0.28 55.9/56.2 EO 601.0 LA Harbor/National Steel TCM 01/28/97 4.0 87.6/88.0 0.74 45.3/60.1 EO 605.0 LA Harbor/Cabrillo Pier TCM 01/18/96 3.5 NA/83.0 0.68 NA/57.4 O616.0 LA Harbor/Consolidated Slip TCM 01/18/96 3.6 89.2/88.1 0.24 53.2/56.1 EO 616.0 LA Harbor/Consolidated Slip TCM 01/28/97 4.0 88.2/87.5 0.82 44.5/55.6 EO 618.0 LA Harbor/Angels Gate RCM 01/18/96 NA NA/85.0 0.87 NA/62.3 O648.0 Malibu RBM 01/17/96 NA 83.0/82.2 1.58 59.3/52.9 EO 648.0 Malibu RCM 11/25/96 NA 79.6/80.0 1.70 66.1/65.3 EO 650.0 Santa Monica RBM 01/17/96 NA 79.7/79.8 1.74 44.6/46.1 EO 650.0 Santa Monica RCM 11/25/96 NA 79.9/79.3 1.28 63.9/65.9 EO 662.0 Royal Palms RCM 01/18/96 NA 82.9/82.7 0.24 45.6/47.1 EO 662.0 Royal Palms RCM 11/25/96 NA 85.0/86.6 0.78 62.5/63.7 EO 664.0 Cabrillo Beach RCM 01/18/96 NA 85.7/85.5 0.45 51.1/50.7 EO 708.0 Anaheim Bay/Navy Marsh TCM 01/27/97 4.0 84.6/82.3 1.70 58.1/57.3 EO
* RCM = Resident California Mussel SED = Sediment ** E = Trace Elements NA = Not Analyzed TFC = Transplanted Freshwater Clam O = Synthetic Organics RBM = Resident Bay Mussel (s = small size) EO = Trace Elements & Synthetic Organics TCM = Transplanted California Mussel (a = archive) PAC = Shore Crab (Pachygrapsus crassipes) OYS = Oyster (Crassostrea gigas) GLY = Sand Worm (Glycera spp.)*** Samples analyzed through the SWRCB’s Bay Protection Program.

C-5
APPENDIX CState Mussel Watch Program1995-97 Sample Information
Transplant Percent Percent Length Sample BayStation Station Sample Sample Duration Water Lipid (mm) Analysis ProtectionNumber Name Type* Date (months) E/SO E/SO Type** Samples***
713.0 Huntington Harbour/Edinger Street TCM 01/17/96 3.6 88.7/87.0 0.56 52.6/53.7 EO 713.0 Huntington Harbour/Edinger Street TCM 01/27/97 4.0 86.6/89.0 0.73 51.9/49.1 EO 715.0 Huntington Harbour/Warner Ave Brdg TCM 01/17/96 3.6 87.1/87.9 0.46 54.0/59.0 EO 715.0 Huntington Harbour/Warner Ave Brdg TCM 01/27/97 4.0 85.7/88.7 0.69 54.7/59.1 EO 723.4 Newport Bay/Turning Basin TCM 01/17/96 3.6 88.4/90.3 0.29 54.5/53.7 EO 724.0 Newport Bay/Highway 1 Bridge TCM 01/17/96 3.6 87.0/88.8 0.37 48.5/51.6 EO 725.0 Newport Bay/Crows Nest TCM 01/17/96 3.6 86.9/87.2 0.59 51.5/49.5 EO 725.0 Newport Bay/Crows Nest TCM 01/27/97 4.0 87.3/87.7 0.74 45.7/55.9 EO 726.4 Newport Bay/Rhine Channel/End TCM 01/17/96 3.6 88.2/90.9 0.24 53.1/52.4 EO 726.4 Newport Bay/Rhine Channel/End TCM 01/27/97 4.0 87.6/90.4 0.51 52.0/61.3 EO 726.6 Newport Bay/Mariners Drive TCM 01/27/97 4.0 89.1/90.0 0.66 52.3/61.9 EO 740.0 Dana Point Harbor/Boat Yard TCM 01/27/97 3.9 87.2/86.7 0.91 55.0/50.2 EO 742.0 San Juan Creek RCM 01/18/96 NA NA/88.2 0.53 NA/42.9 O750.0 Oceanside RCM 01/18/96 NA NA/80.3 0.42 NA/50.6 O750.0 Oceanside RCM 09/30/96 NA 82.7/82.9 1.05 56.5/53.9 EO 882.2 24Th St Maritime Erminal/North TCM 01/18/96 3.6 84.3/NA NA 54.7/NA E882.7 San Diego Bay/Sampson Street Pier TCM 01/18/96 3.6 88.1/88.9 0.28 43.8/53.4 EO 883.1 San Diego Bay/Chollas Creek TCM 01/18/96 3.5 NA/89.4 0.29 NA/52.0 O883.1 San Diego Bay/Chollas Creek TCM 01/28/97 4.0 87.1/89.6 0.50 55.2/55.9 EO 883.2 San Diego Bay/Chollas Creek/Mouth TCM 01/28/97 4.0 87.5/87.6 0.85 48.8/56.1 EO 883.3 San Diego Bay/Chollas Creek/End TCM 01/28/97 4.0 86.6/87.3 0.89 46.7/43.8 EO 883.5 San Diego Bay/Tuna Docks TCM 01/28/97 4.0 86.0/86.6 0.99 54.2/50.3 EO 883.6 San Diego Bay/7th Street Channel TCM 01/18/96 3.6 87.2/86.6 1.88 52.2/51.2 EO 883.6 San Diego Bay/7th Street Channel TCM 01/28/97 4.0 86.8/87.3 0.78 53.7/57.8 EO 883.8 San Diego Bay/Switzer Creek TCM 01/18/96 3.5 NA/88.4 0.26 NA/54.3 O883.8 San Diego Bay/Switzer Creek TCM 01/28/97 4.0 89.9/90.6 0.47 47.9/52.5 EO 885.1 San Diego Bay/Paleta Creek/End TCM 01/28/97 4.0 86.6/87.0 0.96 48.9/51.8 EO 885.3 San Diego Bay/7th Street Ch/Mid TCM 01/28/97 4.0 86.1/87.5 0.84 49.7/55.4 EO 886.0 San Diego Bay/NASSCO TCM 01/18/96 3.6 87.5/87.4 0.41 54.7/54.9 EO 888.0 San Diego Bay/Coronado Bridge RBM 01/28/97 NA 89.3/91.7 0.65 57.3/56.7 EO 893.0 San Diego Bay/Laurel Street TCM 01/18/96 3.5 NA/87.9 0.27 NA/51.3 O893.5 San Diego Bay/B Street Pier TCM 01/18/96 3.5 NA/85.8 0.52 NA/57.7 O894.0 SD Bay/Harbor Is/E Basin/Storm Dr TCM 01/28/97 4.0 87.4/87.6 0.61 46.7/62.8 EO
* RCM = Resident California Mussel SED = Sediment ** E = Trace Elements NA = Not Analyzed TFC = Transplanted Freshwater Clam O = Synthetic Organics RBM = Resident Bay Mussel (s = small size) EO = Trace Elements & Synthetic Organics TCM = Transplanted California Mussel (a = archive) PAC = Shore Crab (Pachygrapsus crassipes) OYS = Oyster (Crassostrea gigas) GLY = Sand Worm (Glycera spp.)*** Samples analyzed through the SWRCB’s Bay Protection Program.

D-1
APPENDIX D
Station Sampling History

D-2
APPENDIX DState Mussel Watch ProgramStation Sampling History
_________________________________________________________________________________________________________________________________________________ Station Station Sample Year* Number Name 78 79 80 81 82 83 84 85 86 87 88 89 90 91 92 93 94 95 96 97_________________________________________________________________________________________________________________________________________________ 1.0 Crescent City Harbor -- -- E -- -- -- -- -- -- -- -- -- -- -- O -- -- -- -- EO 2.0 Crescent City/STP Outfall -- -- -- -- -- EO EO EO EO EO EO EO EO EO EO -- -- -- -- EO 2.1 Crescent City Harbor Jetty -- -- -- -- -- -- -- -- -- -- -- -- O -- -- -- -- -- -- -- 2.2 Crescent City Harbor/Inner Jetty -- -- -- -- -- -- -- -- -- -- -- -- -- -- -- -- -- -- -- EO 3.0 Crescent City/Control -- -- -- -- -- EO EO EO EO EO EO EO EO EO EO -- -- -- -- EO 5.0 Redwoods/North EO EO -- -- -- -- -- -- -- -- -- -- -- -- -- -- -- -- -- -- 7.0 Redwoods/South EO -- -- -- -- -- -- -- -- -- -- -- -- -- -- -- -- -- -- -- 10.0 Trinidad Head EO EO O EO EO EO EO EO EO EO EO EO EO EO EO EO EO EO -- -- 95.0 McDaniel Slough -- -- -- -- -- -- -- -- -- -- -- -- O O O -- -- -- -- -- 99.0 Mad River/Oyster Docks -- -- -- -- -- -- -- -- -- -- O -- -- -- -- -- -- -- -- -- 100.0 Mad River Slough -- -- -- -- -- EO EO EO EO EO O O O O EO -- EO -- -- EO 100.5 Arcata Dock -- -- -- -- -- -- EO O O O -- -- -- O O -- -- -- -- -- 100.6 Mad River/Oyster Bed -- -- -- -- -- -- O -- -- -- -- -- O -- -- -- -- -- -- -- 100.8 Bird Island -- -- -- -- -- -- -- -- -- -- -- -- O -- -- -- -- -- -- -- 101.0 Samoa Bridge/West -- -- EO EO EO EO EO EO -- EO O -- -- EO -- -- E -- -- -- 101.2 Arcata Bay/Channel Marker -- -- -- -- -- -- -- O -- -- -- -- -- -- -- -- -- -- -- -- 101.4 Arcata Bay/Jolly Giant Slough -- -- -- -- -- -- -- -- -- -- -- -- -- -- -- -- -- -- EO -- 101.5 Humboldt Bay/Eureka SM.22 -- -- -- -- -- -- -- -- -- -- -- -- -- -- -- -- -- O -- -- 101.8 Humboldt Bay/Halberson Shoreline -- -- -- -- -- -- -- -- -- -- -- -- -- -- -- -- -- -- EO -- 102.0 Samoa Bridge/East -- O EO EO EO -- -- -- -- -- -- EO -- O EO -- -- -- -- -- 102.5 Woodley Island -- -- -- -- -- -- EO EO EO EO O -- -- -- -- -- -- -- -- -- 102.6 Humboldt Bay/J Street -- -- -- -- -- -- -- -- -- -- -- -- -- -- -- -- -- O EO EO 102.7 Humboldt Bay/H Street -- -- -- -- -- -- -- -- -- -- -- -- -- -- -- -- -- O EO -- 102.8 Humboldt Bay/Davenport Mar. C St -- -- -- -- -- -- -- -- -- -- -- -- -- -- -- -- -- O -- -- 103.0 Eureka Channel -- -- EO EO EO EO -- -- -- -- -- EO O O EO EO EO -- -- -- 103.2 Louisiana Pacific Dock -- -- -- -- -- -- -- EO EO EO EO -- -- -- -- -- -- -- -- -- 103.3 Humboldt Bay/E Street -- -- -- -- -- -- -- -- -- -- -- -- -- O EO -- -- -- -- EO 103.4 Humboldt Del Norte Pier -- -- -- -- -- -- -- O -- -- -- -- -- -- -- -- -- -- -- -- 103.5 Humboldt Bay/Clark Slough -- -- -- -- -- -- -- -- -- -- -- -- -- -- -- -- -- -- -- EO 103.6 Simpson Dock -- -- -- -- -- -- -- EO EO EO -- -- -- -- -- -- -- -- -- -- 103.7 Eda Dock -- -- -- -- -- -- -- -- -- -- -- -- -- O E -- -- -- -- -- 104.0 Eureka STP/Outfall -- -- -- -- -- -- EO EO -- EO EO -- EO EO EO -- -- -- -- -- 104.1 Humboldt Bay/Union Oil Plant -- -- -- -- -- -- -- -- -- -- -- -- -- -- -- -- -- O -- -- 104.2 Humboldt Bay/Coal Oil Gas Plant -- -- -- -- -- -- -- -- -- -- -- -- -- -- -- -- -- O -- -- 104.3 Humboldt Bay/Old Pac. Lumber -- -- -- -- -- -- -- -- -- -- -- -- -- -- -- -- -- O -- --_________________________________________________________________________________________________________________________________________________ * Sample Year = State Fiscal Year (July 1 - June 30). For example, Sample Year 78 = 1977-78 Fiscal Year. -- = Not Sampled. O = Synthetic Organics Only. E = Trace Elements Only. EO = Trace Elements and Synthetic Organics.

D-3
APPENDIX DState Mussel Watch ProgramStation Sampling History
_________________________________________________________________________________________________________________________________________________ Station Station Sample Year* Number Name 78 79 80 81 82 83 84 85 86 87 88 89 90 91 92 93 94 95 96 97_________________________________________________________________________________________________________________________________________________ 104.5 Eureka STP/Control -- -- -- -- -- -- EO EO EO EO EO EO EO EO EO EO -- -- -- -- 105.0 Humboldt Bay/Entrance EO EO -- -- -- -- -- -- -- -- -- -- -- -- -- -- -- -- -- -- 106.0 Fields Landing -- -- -- -- EO -- -- EO E E -- -- -- O EO -- -- -- -- -- 130.0 Shelter Cove EO EO -- -- -- -- -- -- -- -- -- -- -- -- -- -- -- -- -- -- 150.0 Glass Beach -- -- -- -- O -- -- -- -- -- -- -- -- -- -- -- -- -- -- -- 150.4 Noyo Harbor -- -- -- -- -- -- -- -- -- -- -- -- O -- -- EO -- -- -- -- 151.0 Shell Beach -- -- -- -- O -- -- -- -- -- -- -- -- -- -- -- -- -- -- -- 152.0 Pudding Creek -- -- -- -- O -- -- -- -- -- -- -- -- -- -- -- -- -- -- -- 153.0 Pygmy Forest EO EO O O O -- -- -- -- -- -- -- -- -- -- -- -- -- -- -- 155.1 Lake Pillsbury 1 -- -- -- -- -- -- -- -- -- -- -- -- -- -- -- EO -- -- -- -- 155.3 Lake Pillsbury 2 -- -- -- -- -- -- -- -- -- -- -- -- -- -- -- EO -- -- -- -- 159.0 Russian River West Fork -- -- -- -- -- -- -- -- -- -- -- -- E E EO EO -- -- -- -- 160.0 Lake Mendocino -- -- -- -- -- -- -- -- -- -- -- -- EO -- -- -- -- -- -- -- 165.0 Russian River Below Ukiah -- -- -- -- -- -- -- -- -- -- -- -- EO -- EO EO -- -- -- -- 170.0 Gerstle Cove EO EO O -- -- -- -- -- -- -- -- -- -- -- -- -- -- -- -- -- 175.0 Big Sulfur Creek -- -- -- -- -- -- -- -- -- -- -- -- E E -- EO -- -- -- -- 176.0 Lake Sonoma -- -- -- -- -- -- -- -- -- -- -- -- -- -- -- EO -- -- -- -- 190.0 Estero Americano -- -- -- -- -- -- -- -- -- -- -- EO EO EO EO -- -- -- -- -- 200.0 Russian River/N Goat Rock -- -- -- -- -- -- EO -- -- -- -- -- -- -- -- -- -- -- -- -- 201.0 Bodega Bay -- -- EO EO -- -- -- -- -- -- -- -- -- -- -- -- -- -- -- -- 202.0 Bodega Head EO EO E EO EO EO E EO EO EO EO EO EO EO EO EO EO EO EO EO 203.0 Tomales Bay -- O EO EO EO -- -- -- -- -- -- -- -- EO EO -- -- -- -- E 203.1 Tomales Bay/Vincent Landing -- -- -- -- -- -- -- -- -- -- -- -- -- -- -- -- -- -- -- E 203.3 Tomales Bay/Walker Creek Mouth 1 -- -- -- -- -- -- -- -- -- -- -- -- -- -- -- -- -- -- -- E 203.5 Tomales Bay/Walker Creek Mouth 2 -- -- -- -- -- -- -- -- -- -- -- -- -- -- -- -- -- -- -- E 203.7 Tomales Bay/Walker Creek Mouth 3 -- -- -- -- -- -- -- -- -- -- -- -- -- -- -- -- -- -- -- E 203.9 Tomales Bay/Nicks Cove -- -- -- -- -- -- -- -- -- -- -- -- -- -- -- -- -- -- -- E 204.0 Estero De San Antonio -- -- -- -- -- -- -- -- -- -- -- -- -- -- -- EO -- -- -- -- 205.0 Bodega Harbor/Spud Point Marina -- -- -- -- -- -- -- -- -- -- -- EO O EO EO EO -- -- -- EO 205.1 Bodega Bay/Porto Bodega -- -- -- -- -- -- -- -- -- -- -- -- -- -- -- -- -- -- -- EO 205.3 Bodega Bay/Mason's Marina -- -- -- -- -- -- -- -- -- -- -- -- -- -- -- -- -- -- -- EO 205.5 Bodega Bay/Back Marsh -- -- -- -- -- -- -- -- -- -- -- -- -- -- -- -- -- -- -- EO 207.0 Point Reyes EO EO -- -- -- -- -- -- -- -- -- -- -- EO -- -- -- -- -- -- 208.0 Bolinas -- -- EO EO -- -- -- -- -- -- -- -- -- -- -- -- -- -- -- -- 210.1 Walker Creek/Mine Creek -- -- -- -- -- -- -- -- -- -- -- -- -- -- -- -- -- -- -- E_________________________________________________________________________________________________________________________________________________ * Sample Year = State Fiscal Year (July 1 - June 30). For example, Sample Year 78 = 1977-78 Fiscal Year. -- = Not Sampled. O = Synthetic Organics Only. E = Trace Elements Only. EO = Trace Elements and Synthetic Organics.

D-4
APPENDIX DState Mussel Watch ProgramStation Sampling History
_________________________________________________________________________________________________________________________________________________ Station Station Sample Year* Number Name 78 79 80 81 82 83 84 85 86 87 88 89 90 91 92 93 94 95 96 97_________________________________________________________________________________________________________________________________________________ 210.3 Walker Creek/mid stream -- -- -- -- -- -- -- -- -- -- -- -- -- -- -- -- -- -- -- E 211.1 Lagunitas Creek/Bridge 1 -- -- -- -- -- -- -- -- -- -- -- -- -- -- -- -- -- -- -- E 211.3 Lagunitas Creek/Bridge 2 -- -- -- -- -- -- -- -- -- -- -- -- -- -- -- -- -- -- -- E 280.0 Russian River/S Goat Rock -- -- -- -- -- -- -- -- -- E E E -- -- -- EO -- -- -- EO 290.0 Russian River/near Moscow -- -- -- -- -- -- -- -- EO E E -- -- -- -- EO -- -- -- -- 292.0 Gualala River/Twin Bridge -- -- -- -- -- -- -- -- -- E -- -- -- -- -- -- -- -- -- -- 294.1 Mark West Creek/Slusser Road -- -- -- -- -- -- -- -- -- -- -- -- -- -- E -- -- -- -- -- 294.2 Windsor Creek/Mark West Station Rd -- -- -- -- -- -- -- -- -- -- -- -- -- -- EO -- -- -- -- -- 294.5 Green Valley Creek 1 -- -- -- -- -- -- -- -- -- -- -- -- -- -- -- EO -- -- -- -- 294.6 Green Valley Creek 2 -- -- -- -- -- -- -- -- -- -- -- -- -- -- -- EO -- -- -- -- 295.1 Santa Rosa Fl Con Ch/Willowside Rd -- -- -- -- -- -- -- -- -- -- -- EO EO EO -- -- -- -- -- -- 295.2 Laguna de Santa Rosa/Stony Point -- -- -- -- -- -- -- -- -- -- -- EO EO EO E -- -- -- -- -- 295.3 Mark West Creek/Wholer Road -- -- -- -- -- -- -- -- -- -- -- EO EO -- EO -- -- -- -- -- 295.4 Russian River/Wholer Bridge -- -- -- -- -- -- -- -- -- -- -- EO EO EO EO -- -- -- -- -- 295.5 Russian River/Hacienda Bridge -- -- -- -- -- -- -- -- -- -- -- EO EO -- EO -- -- -- -- -- 297.0 Putah Creek -- -- -- -- -- -- -- -- -- -- -- -- O -- -- -- -- -- -- -- 298.0 Brannan Island -- -- -- -- -- -- -- -- -- EO EO EO -- -- -- -- -- -- -- -- 298.3 Concord Naval/Pier 4 -- -- -- -- -- -- -- -- -- -- E -- -- -- -- -- -- -- -- -- 298.4 Concord Naval/Seal Island -- -- -- -- -- -- -- -- -- -- EO -- -- -- -- -- -- -- -- -- 299.1 Selby Slag 4 -- -- -- -- -- -- -- -- -- -- E -- -- -- -- -- -- -- EO -- 299.2 Selby Slag 5 -- -- -- -- -- -- -- -- -- -- E -- -- -- -- -- -- -- -- -- 299.3 Selby Slag 6 -- -- -- -- -- -- -- -- -- -- E -- -- -- -- -- -- -- -- -- 299.4 Selby Slag 7 -- -- -- -- -- -- -- -- -- -- E -- -- -- -- -- -- -- -- -- 300.2 Mare Island -- -- -- -- -- -- -- EO EO EO EO EO -- -- -- -- -- -- -- -- 301.0 Davis Point -- -- E -- -- EO -- -- -- -- E -- -- -- -- -- -- -- -- -- 301.4 Union Oil Outfall -- -- -- -- -- -- -- -- -- -- E E -- -- -- -- -- -- -- -- 302.0 Point Pinole -- -- E EO EO EO EO EO EO EO EO EO EO EO EO EO -- O -- -- 302.4 Castro Cove Bridge -- -- -- -- -- -- -- -- -- -- EO EO O -- -- -- -- -- -- -- 302.6 Paradise Cove -- -- -- -- -- -- -- -- -- -- -- -- -- -- -- -- -- -- EO -- 303.0 Richmond/San Rafael Bridge -- -- EO EO EO EO -- -- -- -- -- -- -- -- -- -- -- -- -- -- 303.1 Santa Fe Channel/Mouth -- -- -- -- -- -- -- -- EO -- -- -- -- EO -- -- -- -- -- -- 303.2 Lauritzen Canal/Mouth -- -- -- -- -- -- -- O O O O -- -- -- -- -- -- -- -- -- 303.3 Lauritzen Canal/End -- -- -- -- -- -- -- -- O O O -- -- EO -- -- -- -- -- -- 303.4 Santa Fe Channel/End -- -- -- -- -- -- -- O O O -- -- -- EO -- -- -- -- -- -- 303.6 Richmond Inner Harbor Basin -- -- -- -- -- -- -- E O EO EO EO -- -- -- -- -- -- -- --_________________________________________________________________________________________________________________________________________________ * Sample Year = State Fiscal Year (July 1 - June 30). For example, Sample Year 78 = 1977-78 Fiscal Year. -- = Not Sampled. O = Synthetic Organics Only. E = Trace Elements Only. EO = Trace Elements and Synthetic Organics.

D-5
APPENDIX DState Mussel Watch ProgramStation Sampling History
_________________________________________________________________________________________________________________________________________________ Station Station Sample Year* Number Name 78 79 80 81 82 83 84 85 86 87 88 89 90 91 92 93 94 95 96 97_________________________________________________________________________________________________________________________________________________ 304.0 Staufer's -- -- -- -- E -- -- -- -- -- -- -- -- -- -- -- -- -- -- -- 304.4 Serl Intake -- -- -- -- -- -- -- -- -- -- -- -- -- EO -- -- -- -- -- -- 304.6 Point Isabel -- -- -- -- -- -- -- -- -- -- E -- -- -- -- -- -- -- -- -- 305.0 San Francisco Bay/Angel Island -- -- EO EO E EO -- -- -- -- -- -- -- -- -- -- -- -- -- -- 306.0 San Francisco Bay/Fort Baker -- -- -- EO -- EO -- -- -- -- -- -- -- EO EO EO -- -- -- -- 306.1 Gashouse Cove/Laguna Street -- -- -- -- -- -- -- -- -- -- -- -- -- -- -- -- -- -- EO -- 306.2 Sansome Street/Pier 31 -- -- -- -- -- -- -- -- -- -- -- -- -- -- -- -- -- -- EO -- 306.3 Howard Street/Pier 14 -- -- -- -- -- -- -- -- -- -- -- -- -- -- -- -- -- -- EO -- 306.4 Central Basin/Outer -- -- -- -- -- -- -- -- -- -- -- -- -- -- -- -- -- -- EO -- 306.5 Alcatraz Island -- -- -- -- -- -- -- -- -- -- -- EO -- -- -- -- -- -- -- -- 307.0 San Francisco Bay/Treasure Is -- O EO EO EO EO EO EO E EO EO EO EO EO EO EO -- -- -- O 307.2 Alameda Yacht Harbor -- -- -- -- -- -- -- E EO EO EO EO -- -- -- -- -- -- -- -- 307.3 Oakland Inner Harbor/West -- -- -- -- -- -- -- -- EO EO -- -- -- -- -- -- -- -- -- -- 307.4 Oakland Inner Hbr/Embarcadero Cove -- -- -- -- -- -- -- O EO EO EO EO -- EO EO EO -- -- -- -- 307.5 Lake Merritt -- -- -- -- -- -- -- -- -- -- -- -- -- -- EO EO -- -- -- -- 307.6 Oakland Back Harbor -- -- -- -- -- -- -- O EO EO EO -- -- -- -- -- -- -- -- -- 307.8 San Francisco Outfall -- -- -- -- -- -- -- -- -- -- -- EO -- -- -- -- -- -- -- -- 307.9 San Francisco/Islais Channel -- -- -- -- -- -- -- -- -- EO EO -- -- -- -- -- -- -- -- -- 308.0 San Francisco Bay/Hunter's Point -- -- -- EO EO EO -- -- -- -- -- -- -- EO EO EO -- EO -- O 308.2 Hunter's Point/Shipyard -- -- -- -- -- -- -- -- -- -- EO EO -- -- -- -- -- -- -- -- 309.0 San Mateo Bridge/8B -- -- E EO EO EO EO E E E -- -- E EO EO EO -- EO -- O 310.0 San Mateo Bridge/8A -- -- -- -- EO -- -- -- -- -- -- -- -- -- -- -- -- -- -- -- 311.0 San Mateo Old Bridge -- -- -- -- E -- -- -- -- -- -- -- -- -- -- -- -- -- -- -- 311.4 North South Bay -- -- -- -- -- -- -- -- -- -- -- -- -- -- -- -- -- -- EO -- 312.0 Belmont Slough -- -- -- -- E -- -- -- -- -- -- -- -- -- -- -- -- -- -- -- 313.0 San Francisco Bay/near Redwood Cr -- -- -- EO EO EO EO E -- -- -- -- -- EO EO EO -- EO -- O 314.0 Redwood Creek/Channel Marker 10 -- -- -- -- E -- -- -- -- -- -- -- -- -- -- -- -- -- -- -- 315.0 Redwood Creek/Towers -- -- -- -- E E -- -- -- -- -- -- -- -- -- -- -- -- -- -- 316.0 Redwood Creek/Tradewinds -- -- EO -- E E -- -- -- -- -- -- -- -- -- -- -- -- -- -- 317.0 Redwood City/STP Outfall ns ns ns ns ns E ns ns ns ns ns ns ns ns ns ns ns ns ns ns 318.0 Redwood Creek/Pete's Marina -- -- -- -- -- E -- -- -- -- -- -- -- -- -- -- -- -- -- -- 318.4 Redwood Creek/Bair Island -- -- -- -- -- -- -- -- -- EO -- -- -- -- -- -- -- -- -- -- 319.0 Redwood Creek/Pulgas -- -- -- -- -- E -- -- -- -- -- -- -- -- -- -- -- -- -- -- 320.0 San Francisco Airport -- -- -- -- -- E -- -- -- -- -- -- -- -- -- -- -- -- -- -- 321.0 Dumbarton Bridge/Channel Marker 14 -- -- E EO EO E EO E E E E EO -- EO EO -- -- EO -- O_________________________________________________________________________________________________________________________________________________ * Sample Year = State Fiscal Year (July 1 - June 30). For example, Sample Year 78 = 1977-78 Fiscal Year. -- = Not Sampled. O = Synthetic Organics Only. E = Trace Elements Only. EO = Trace Elements and Synthetic Organics.

D-6
APPENDIX DState Mussel Watch ProgramStation Sampling History
_________________________________________________________________________________________________________________________________________________ Station Station Sample Year* Number Name 78 79 80 81 82 83 84 85 86 87 88 89 90 91 92 93 94 95 96 97_________________________________________________________________________________________________________________________________________________ 323.3 Palo Alto Outfall -- -- -- -- -- -- -- -- -- -- -- EO EO -- -- -- -- -- -- -- 324.0 Newark Slough -- -- -- -- E -- -- -- -- -- -- -- -- -- -- -- -- -- -- -- 325.0 Channel Marker 17 -- -- -- -- E -- -- -- -- -- -- -- -- -- -- -- -- -- -- -- 326.0 Palo Alto/Channel Marker 8 -- -- -- -- E E -- -- -- -- -- -- -- EO EO EO -- -- -- -- 327.0 Palo Alto/Yacht Club -- -- -- -- E -- -- -- -- -- -- -- -- -- -- -- -- -- -- -- 328.0 Alviso Slough -- -- -- -- E -- -- -- -- -- -- -- -- -- -- -- -- -- -- -- 329.0 Guadalupe Creek/Almaden Expressway -- -- -- -- -- -- -- -- -- -- -- -- -- -- -- -- -- -- -- E 329.2 Guadalupe Creek/Hicks Road -- -- -- -- -- -- -- -- -- -- -- -- -- -- -- -- -- -- -- E 329.4 Alamitos Creek/Almaden Road -- -- -- -- -- -- -- -- -- -- -- -- -- -- -- -- -- -- -- E 330.0 Duxbury Reef -- -- EO O -- -- -- -- -- -- -- -- -- -- -- -- -- -- -- -- 331.0 Muir Beach -- -- E -- -- -- -- -- -- -- -- -- -- -- -- -- -- -- -- -- 332.0 Point Bonita -- -- E -- -- -- -- -- -- -- -- -- -- -- -- -- -- -- -- -- 333.0 Farallon Islands EO EO E -- -- -- -- -- -- -- -- -- -- -- -- -- -- -- -- -- 334.0 Cliff House -- -- E -- -- -- -- -- -- -- -- -- -- -- -- -- -- -- -- -- 335.0 Pacifica -- -- E -- -- -- -- -- -- -- -- -- -- -- -- -- -- -- -- -- 336.0 J. Fitzgerald EO EO O O -- -- -- -- -- -- -- -- -- EO -- -- -- -- -- -- 399.2 Pescadero Creek -- -- -- -- -- -- -- -- -- -- O O -- -- -- -- -- -- -- -- 399.3 Waddell Creek -- -- -- -- -- -- -- -- -- -- O O -- -- -- -- -- -- -- -- 399.5 San Lorenzo River -- -- -- -- -- -- -- -- -- -- -- -- -- EO -- -- -- -- -- -- 399.7 San Lorenzo River/Felton -- -- -- -- -- -- -- -- -- -- -- -- -- EO -- -- -- -- -- -- 400.0 Ano Nuevo Island EO EO E -- -- EO -- -- -- -- -- -- -- -- -- -- -- -- -- -- 400.2 Younger Lagoon -- -- -- -- -- -- -- -- -- -- -- -- -- -- -- EO -- -- -- -- 400.5 Santa Cruz/Long Marine Laboratory -- -- -- -- -- E -- -- -- -- -- -- -- -- -- -- -- -- -- -- 400.6 Santa Cruz/Natural Bridges -- -- -- -- -- -- -- -- -- E E E -- -- -- -- -- -- -- EO 400.7 Santa Cruz Harbor/Inner -- -- -- -- -- -- -- -- -- -- -- -- -- -- -- -- -- -- EO -- 400.8 Aptos Creek -- -- -- -- -- -- -- -- -- -- -- -- EO EO EO -- -- -- -- -- 401.0 Santa Cruz Harbor -- -- EO EO -- -- -- -- -- -- -- -- -- -- -- -- -- -- EO -- 401.1 Santa Cruz/T Dock -- -- -- -- -- -- -- -- -- -- -- EO -- -- -- -- -- -- -- -- 401.2 Watsonville Slough/Mouth -- -- -- -- -- O O -- O -- -- -- -- -- -- -- -- -- -- -- 401.3 Moss Landing/Yacht Harbor -- -- -- -- -- -- EO -- -- EO -- O -- -- -- -- -- -- -- -- 401.4 Elkhorn Slough -- -- -- -- -- O O -- -- -- -- -- -- -- -- -- -- -- -- -- 401.5 Watsonville Slough/Bridge -- -- -- -- -- -- -- -- -- -- O -- -- -- -- O -- -- -- -- 401.6 Harkins Slough Bridge -- -- -- -- -- -- -- -- -- O O -- -- -- -- -- -- -- -- -- 401.8 San Andreas Road -- -- -- -- -- -- -- -- O O O -- -- -- -- -- -- -- -- -- 401.9 Pajaro River Estuary -- -- -- -- -- -- -- -- -- -- -- -- -- -- -- O -- -- -- --_________________________________________________________________________________________________________________________________________________ * Sample Year = State Fiscal Year (July 1 - June 30). For example, Sample Year 78 = 1977-78 Fiscal Year. -- = Not Sampled. O = Synthetic Organics Only. E = Trace Elements Only. EO = Trace Elements and Synthetic Organics.
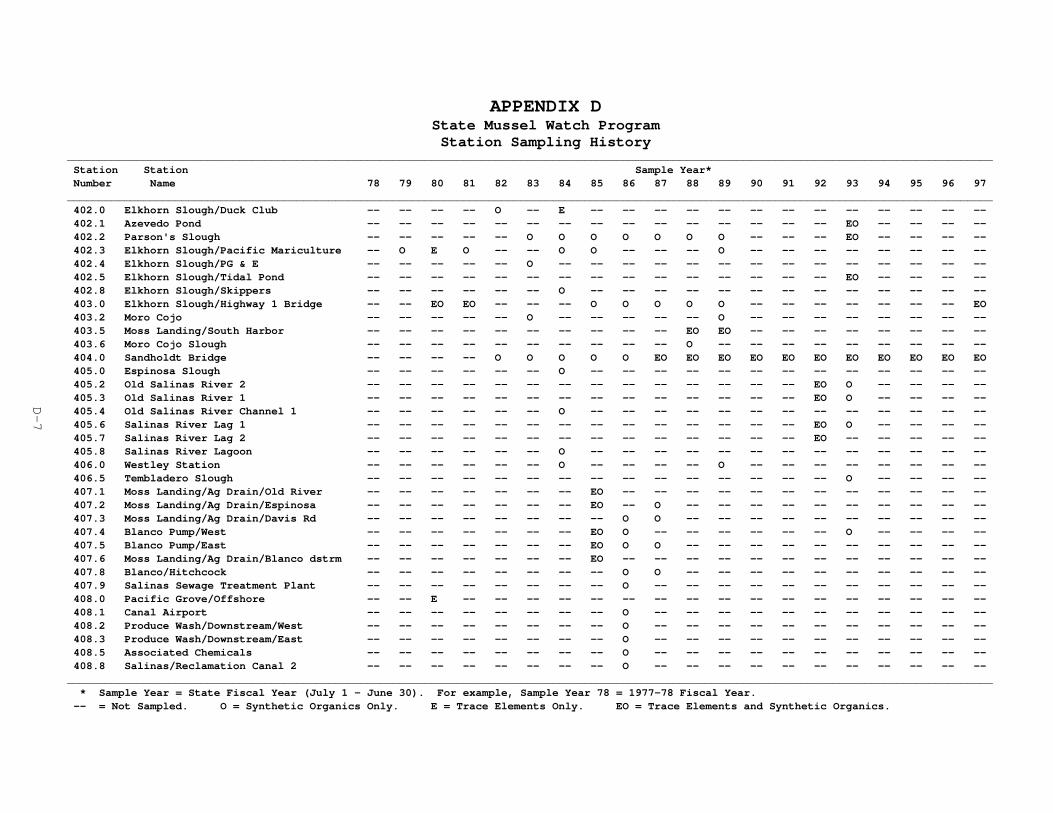
D-7
APPENDIX DState Mussel Watch ProgramStation Sampling History
_________________________________________________________________________________________________________________________________________________ Station Station Sample Year* Number Name 78 79 80 81 82 83 84 85 86 87 88 89 90 91 92 93 94 95 96 97_________________________________________________________________________________________________________________________________________________ 402.0 Elkhorn Slough/Duck Club -- -- -- -- O -- E -- -- -- -- -- -- -- -- -- -- -- -- -- 402.1 Azevedo Pond -- -- -- -- -- -- -- -- -- -- -- -- -- -- -- EO -- -- -- -- 402.2 Parson's Slough -- -- -- -- -- O O O O O O O -- -- -- EO -- -- -- -- 402.3 Elkhorn Slough/Pacific Mariculture -- O E O -- -- O O -- -- -- O -- -- -- -- -- -- -- -- 402.4 Elkhorn Slough/PG & E -- -- -- -- -- O -- -- -- -- -- -- -- -- -- -- -- -- -- -- 402.5 Elkhorn Slough/Tidal Pond -- -- -- -- -- -- -- -- -- -- -- -- -- -- -- EO -- -- -- -- 402.8 Elkhorn Slough/Skippers -- -- -- -- -- -- O -- -- -- -- -- -- -- -- -- -- -- -- -- 403.0 Elkhorn Slough/Highway 1 Bridge -- -- EO EO -- -- -- O O O O O -- -- -- -- -- -- -- EO 403.2 Moro Cojo -- -- -- -- -- O -- -- -- -- -- O -- -- -- -- -- -- -- -- 403.5 Moss Landing/South Harbor -- -- -- -- -- -- -- -- -- -- EO EO -- -- -- -- -- -- -- -- 403.6 Moro Cojo Slough -- -- -- -- -- -- -- -- -- -- O -- -- -- -- -- -- -- -- -- 404.0 Sandholdt Bridge -- -- -- -- O O O O O EO EO EO EO EO EO EO EO EO EO EO 405.0 Espinosa Slough -- -- -- -- -- -- O -- -- -- -- -- -- -- -- -- -- -- -- -- 405.2 Old Salinas River 2 -- -- -- -- -- -- -- -- -- -- -- -- -- -- EO O -- -- -- -- 405.3 Old Salinas River 1 -- -- -- -- -- -- -- -- -- -- -- -- -- -- EO O -- -- -- -- 405.4 Old Salinas River Channel 1 -- -- -- -- -- -- O -- -- -- -- -- -- -- -- -- -- -- -- -- 405.6 Salinas River Lag 1 -- -- -- -- -- -- -- -- -- -- -- -- -- -- EO O -- -- -- -- 405.7 Salinas River Lag 2 -- -- -- -- -- -- -- -- -- -- -- -- -- -- EO -- -- -- -- -- 405.8 Salinas River Lagoon -- -- -- -- -- -- O -- -- -- -- -- -- -- -- -- -- -- -- -- 406.0 Westley Station -- -- -- -- -- -- O -- -- -- -- O -- -- -- -- -- -- -- -- 406.5 Tembladero Slough -- -- -- -- -- -- -- -- -- -- -- -- -- -- -- O -- -- -- -- 407.1 Moss Landing/Ag Drain/Old River -- -- -- -- -- -- -- EO -- -- -- -- -- -- -- -- -- -- -- -- 407.2 Moss Landing/Ag Drain/Espinosa -- -- -- -- -- -- -- EO -- O -- -- -- -- -- -- -- -- -- -- 407.3 Moss Landing/Ag Drain/Davis Rd -- -- -- -- -- -- -- -- O O -- -- -- -- -- -- -- -- -- -- 407.4 Blanco Pump/West -- -- -- -- -- -- -- EO O -- -- -- -- -- -- O -- -- -- -- 407.5 Blanco Pump/East -- -- -- -- -- -- -- EO O O -- -- -- -- -- -- -- -- -- -- 407.6 Moss Landing/Ag Drain/Blanco dstrm -- -- -- -- -- -- -- EO -- -- -- -- -- -- -- -- -- -- -- -- 407.8 Blanco/Hitchcock -- -- -- -- -- -- -- -- O O -- -- -- -- -- -- -- -- -- -- 407.9 Salinas Sewage Treatment Plant -- -- -- -- -- -- -- -- O -- -- -- -- -- -- -- -- -- -- -- 408.0 Pacific Grove/Offshore -- -- E -- -- -- -- -- -- -- -- -- -- -- -- -- -- -- -- -- 408.1 Canal Airport -- -- -- -- -- -- -- -- O -- -- -- -- -- -- -- -- -- -- -- 408.2 Produce Wash/Downstream/West -- -- -- -- -- -- -- -- O -- -- -- -- -- -- -- -- -- -- -- 408.3 Produce Wash/Downstream/East -- -- -- -- -- -- -- -- O -- -- -- -- -- -- -- -- -- -- -- 408.5 Associated Chemicals -- -- -- -- -- -- -- -- O -- -- -- -- -- -- -- -- -- -- -- 408.8 Salinas/Reclamation Canal 2 -- -- -- -- -- -- -- -- O -- -- -- -- -- -- -- -- -- -- --_________________________________________________________________________________________________________________________________________________ * Sample Year = State Fiscal Year (July 1 - June 30). For example, Sample Year 78 = 1977-78 Fiscal Year. -- = Not Sampled. O = Synthetic Organics Only. E = Trace Elements Only. EO = Trace Elements and Synthetic Organics.
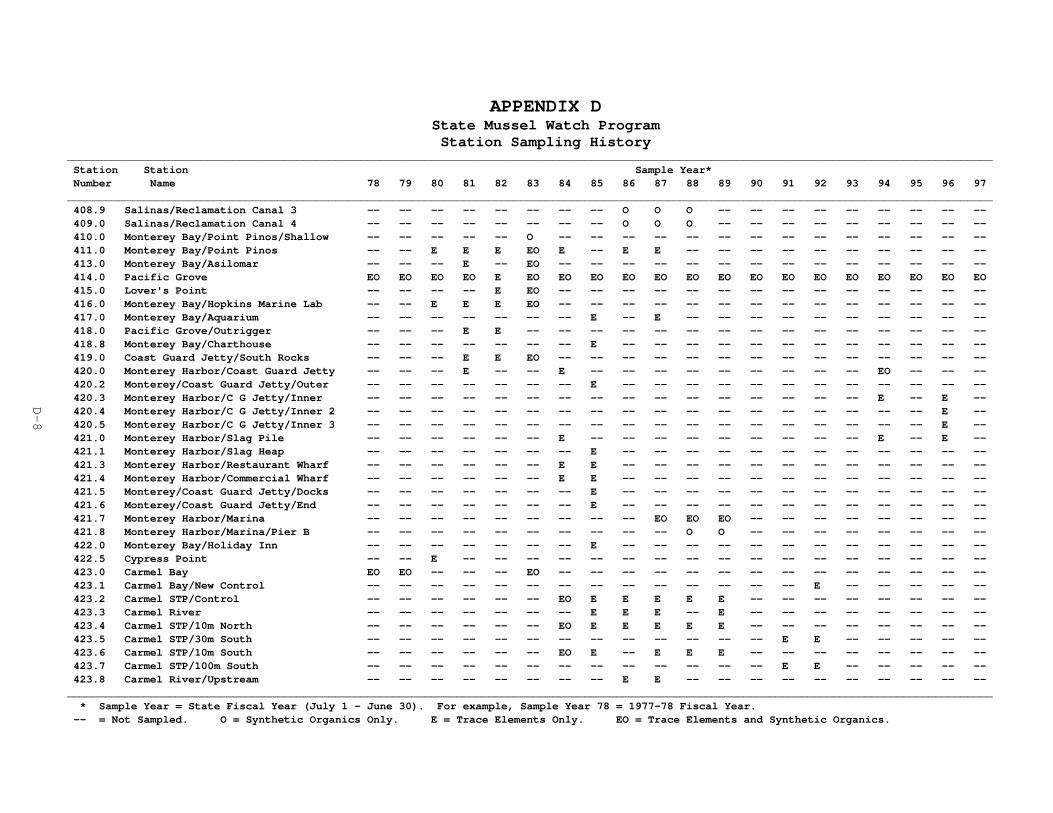
D-8
APPENDIX DState Mussel Watch ProgramStation Sampling History
_________________________________________________________________________________________________________________________________________________ Station Station Sample Year* Number Name 78 79 80 81 82 83 84 85 86 87 88 89 90 91 92 93 94 95 96 97_________________________________________________________________________________________________________________________________________________ 408.9 Salinas/Reclamation Canal 3 -- -- -- -- -- -- -- -- O O O -- -- -- -- -- -- -- -- -- 409.0 Salinas/Reclamation Canal 4 -- -- -- -- -- -- -- -- O O O -- -- -- -- -- -- -- -- -- 410.0 Monterey Bay/Point Pinos/Shallow -- -- -- -- -- O -- -- -- -- -- -- -- -- -- -- -- -- -- -- 411.0 Monterey Bay/Point Pinos -- -- E E E EO E -- E E -- -- -- -- -- -- -- -- -- -- 413.0 Monterey Bay/Asilomar -- -- -- E -- EO -- -- -- -- -- -- -- -- -- -- -- -- -- -- 414.0 Pacific Grove EO EO EO EO E EO EO EO EO EO EO EO EO EO EO EO EO EO EO EO 415.0 Lover's Point -- -- -- -- E EO -- -- -- -- -- -- -- -- -- -- -- -- -- -- 416.0 Monterey Bay/Hopkins Marine Lab -- -- E E E EO -- -- -- -- -- -- -- -- -- -- -- -- -- -- 417.0 Monterey Bay/Aquarium -- -- -- -- -- -- -- E -- E -- -- -- -- -- -- -- -- -- -- 418.0 Pacific Grove/Outrigger -- -- -- E E -- -- -- -- -- -- -- -- -- -- -- -- -- -- -- 418.8 Monterey Bay/Charthouse -- -- -- -- -- -- -- E -- -- -- -- -- -- -- -- -- -- -- -- 419.0 Coast Guard Jetty/South Rocks -- -- -- E E EO -- -- -- -- -- -- -- -- -- -- -- -- -- -- 420.0 Monterey Harbor/Coast Guard Jetty -- -- -- E -- -- E -- -- -- -- -- -- -- -- -- EO -- -- -- 420.2 Monterey/Coast Guard Jetty/Outer -- -- -- -- -- -- -- E -- -- -- -- -- -- -- -- -- -- -- -- 420.3 Monterey Harbor/C G Jetty/Inner -- -- -- -- -- -- -- -- -- -- -- -- -- -- -- -- E -- E -- 420.4 Monterey Harbor/C G Jetty/Inner 2 -- -- -- -- -- -- -- -- -- -- -- -- -- -- -- -- -- -- E -- 420.5 Monterey Harbor/C G Jetty/Inner 3 -- -- -- -- -- -- -- -- -- -- -- -- -- -- -- -- -- -- E -- 421.0 Monterey Harbor/Slag Pile -- -- -- -- -- -- E -- -- -- -- -- -- -- -- -- E -- E -- 421.1 Monterey Harbor/Slag Heap -- -- -- -- -- -- -- E -- -- -- -- -- -- -- -- -- -- -- -- 421.3 Monterey Harbor/Restaurant Wharf -- -- -- -- -- -- E E -- -- -- -- -- -- -- -- -- -- -- -- 421.4 Monterey Harbor/Commercial Wharf -- -- -- -- -- -- E E -- -- -- -- -- -- -- -- -- -- -- -- 421.5 Monterey/Coast Guard Jetty/Docks -- -- -- -- -- -- -- E -- -- -- -- -- -- -- -- -- -- -- -- 421.6 Monterey/Coast Guard Jetty/End -- -- -- -- -- -- -- E -- -- -- -- -- -- -- -- -- -- -- -- 421.7 Monterey Harbor/Marina -- -- -- -- -- -- -- -- -- EO EO EO -- -- -- -- -- -- -- -- 421.8 Monterey Harbor/Marina/Pier B -- -- -- -- -- -- -- -- -- -- O O -- -- -- -- -- -- -- -- 422.0 Monterey Bay/Holiday Inn -- -- -- -- -- -- -- E -- -- -- -- -- -- -- -- -- -- -- -- 422.5 Cypress Point -- -- E -- -- -- -- -- -- -- -- -- -- -- -- -- -- -- -- -- 423.0 Carmel Bay EO EO -- -- -- EO -- -- -- -- -- -- -- -- -- -- -- -- -- -- 423.1 Carmel Bay/New Control -- -- -- -- -- -- -- -- -- -- -- -- -- -- E -- -- -- -- -- 423.2 Carmel STP/Control -- -- -- -- -- -- EO E E E E E -- -- -- -- -- -- -- -- 423.3 Carmel River -- -- -- -- -- -- -- E E E -- E -- -- -- -- -- -- -- -- 423.4 Carmel STP/10m North -- -- -- -- -- -- EO E E E E E -- -- -- -- -- -- -- -- 423.5 Carmel STP/30m South -- -- -- -- -- -- -- -- -- -- -- -- -- E E -- -- -- -- -- 423.6 Carmel STP/10m South -- -- -- -- -- -- EO E -- E E E -- -- -- -- -- -- -- -- 423.7 Carmel STP/100m South -- -- -- -- -- -- -- -- -- -- -- -- -- E E -- -- -- -- -- 423.8 Carmel River/Upstream -- -- -- -- -- -- -- -- E E -- -- -- -- -- -- -- -- -- --_________________________________________________________________________________________________________________________________________________ * Sample Year = State Fiscal Year (July 1 - June 30). For example, Sample Year 78 = 1977-78 Fiscal Year. -- = Not Sampled. O = Synthetic Organics Only. E = Trace Elements Only. EO = Trace Elements and Synthetic Organics.

D-9
APPENDIX DState Mussel Watch ProgramStation Sampling History
_________________________________________________________________________________________________________________________________________________ Station Station Sample Year* Number Name 78 79 80 81 82 83 84 85 86 87 88 89 90 91 92 93 94 95 96 97_________________________________________________________________________________________________________________________________________________ 423.9 Carmel STP/300m South -- -- -- -- -- -- -- -- -- -- -- -- -- E E -- -- -- -- -- 424.0 Soberanes Point EO EO -- -- -- EO -- -- -- -- -- -- -- -- -- -- -- -- -- -- 424.5 Granite Canyon/Control -- -- -- -- -- -- -- -- -- -- -- E -- -- -- -- -- -- -- -- 425.0 J.P. Burns EO EO O O -- EO -- -- -- -- -- -- -- -- -- -- -- -- -- -- 425.4 Lake San Antonio/Buoy -- -- -- -- -- -- -- EO EO EO EO -- -- -- -- -- -- -- -- -- 425.6 Lake San Antonio -- -- -- -- -- -- -- EO EO EO EO EO EO -- EO -- -- -- -- -- 425.7 Nacimiento/East -- -- -- -- -- -- -- E -- -- -- -- -- -- -- -- -- -- -- -- 425.8 Nacimiento/West -- -- -- -- -- -- -- E -- -- -- -- -- -- -- -- -- -- -- -- 426.0 Salmon Creek EO EO -- -- -- -- -- -- -- -- -- -- -- -- -- -- -- -- -- -- 426.5 Cayucos Pier -- -- -- -- -- -- E EO EO EO EO EO EO EO -- -- -- -- -- -- 427.0 Morro Bay/Upper -- -- EO EO -- -- -- -- -- -- -- -- -- -- -- -- -- -- -- -- 428.0 Cayucos -- -- -- -- -- -- E E E E E E E E E -- -- -- -- -- 428.5 Morro Bay/Virg's -- O EO EO -- -- -- -- -- -- -- -- -- -- -- -- -- -- -- -- 429.0 Morro Rock -- -- -- -- E E -- -- -- -- -- -- -- -- -- -- -- -- -- -- 429.2 Morro Bay/Boat Works -- -- -- -- -- -- -- -- -- E EO EO EO -- -- E -- -- -- -- 430.0 Montana De Oro -- -- E -- E EO EO EO EO EO EO EO EO EO EO -- -- -- -- -- 430.1 Montana De Oro/South EO EO -- -- -- -- -- -- -- -- -- -- -- -- -- -- -- -- -- -- 430.2 Montana De Oro 1 -- -- -- -- -- -- -- -- -- -- -- -- -- EO EO -- -- -- -- -- 430.4 Montana De Oro 2 -- -- -- -- -- -- -- -- -- -- -- -- -- EO EO -- -- -- -- -- 431.0 Lion Rock -- -- -- -- E E E E E E E E E -- -- -- -- -- -- -- 432.0 Pup Rock -- -- -- -- E E E E E E E E E -- -- -- -- -- -- -- 433.0 Diablo Cove/North -- -- -- -- E EO E E E E E E E E E -- -- -- -- -- 434.0 Diablo Cove/South -- -- -- -- E EO EO EO EO EO EO EO EO EO EO -- -- -- -- -- 435.0 Intake Cove -- -- -- -- E EO EO EO EO EO EO EO EO EO EO -- -- -- -- -- 436.0 Pecho Rock -- -- -- -- E EO EO EO EO EO EO EO EO -- -- -- -- -- -- -- 437.0 Point San Luis -- -- -- -- E E EO EO EO EO EO EO EO EO EO -- -- -- -- -- 438.0 Avila -- -- -- -- E EO E EO EO EO E E E E E -- -- -- -- -- 440.0 Lion Rock/Transplant -- -- -- -- -- EO E EO EO EO E EO EO E E -- -- -- -- -- 441.0 Lion/Diablo/Transplant -- -- -- -- -- EO EO EO EO EO EO EO EO E E -- -- -- -- -- 442.0 Diablo Cove/North/Transplant -- -- -- -- -- -- E EO EO E EO EO EO E E -- -- -- -- -- 442.1 Diablo Cove/N/Transplant/Shallow -- -- -- -- -- -- -- -- -- -- -- -- -- E E -- -- -- -- -- 443.0 Diablo Cove/South/Transplant -- -- -- -- -- EO EO EO EO EO EO EO EO EO EO -- -- -- -- -- 443.1 Diablo Cove/S/Transplant/Shallow -- -- -- -- -- -- -- -- -- -- -- -- -- EO EO -- -- -- -- -- 444.0 Intake Cove/Transplant -- -- -- -- -- -- EO EO EO EO EO EO EO EO EO -- -- -- -- -- 445.0 San Luis Harbor/Transplant -- -- -- -- -- EO EO EO EO EO EO EO EO EO EO -- -- -- -- --_________________________________________________________________________________________________________________________________________________ * Sample Year = State Fiscal Year (July 1 - June 30). For example, Sample Year 78 = 1977-78 Fiscal Year. -- = Not Sampled. O = Synthetic Organics Only. E = Trace Elements Only. EO = Trace Elements and Synthetic Organics.

D-10
APPENDIX DState Mussel Watch ProgramStation Sampling History
_________________________________________________________________________________________________________________________________________________ Station Station Sample Year* Number Name 78 79 80 81 82 83 84 85 86 87 88 89 90 91 92 93 94 95 96 97_________________________________________________________________________________________________________________________________________________ 446.0 San Luis Obispo Creek 1 -- -- -- -- -- -- -- -- -- -- -- -- -- EO -- -- -- -- -- -- 446.1 San Luis Obispo/Creek 2 -- -- -- -- -- -- -- -- -- -- -- -- -- -- EO -- -- -- -- -- 446.2 San Luis Obispo Creek 3 -- -- -- -- -- -- -- -- -- -- -- -- -- E EO -- -- -- -- -- 446.4 San Luis Obispo/Creek 4 -- -- -- -- -- -- -- -- -- -- -- -- -- -- EO -- -- -- -- -- 449.0 Point Arguello EO EO -- -- -- -- -- -- -- -- -- -- -- -- -- -- -- -- -- -- 450.0 Point Conception EO EO -- -- -- -- -- -- -- -- -- E E EO -- -- -- -- -- -- 455.0 Gaviota -- -- -- -- -- -- -- -- -- -- EO EO E -- -- -- -- -- -- -- 460.0 Goleta Slough 1 -- -- -- -- -- -- -- -- -- -- -- EO EO EO -- -- -- -- -- -- 460.1 Goleta Slough 2 -- -- -- -- -- -- -- -- -- -- -- -- EO EO -- -- -- -- -- -- 460.2 Goleta Slough 3 -- -- -- -- -- -- -- -- -- -- -- -- -- EO -- -- -- -- -- -- 460.3 Goleta Slough 4 -- -- -- -- -- -- -- -- -- -- -- -- -- EO -- -- -- -- -- -- 470.0 Santa Barbara Harbor -- -- -- -- -- -- -- -- -- -- EO EO -- -- -- -- -- -- -- -- 471.0 Mission Creek -- -- -- -- -- -- -- -- -- -- -- -- -- EO -- -- -- -- -- -- 472.0 Waste Slough/Laguna Drainage -- -- -- -- -- -- -- -- -- -- -- -- -- EO -- -- -- -- -- -- 475.0 Carpinteria Marsh -- -- -- -- -- -- -- -- -- -- O O -- -- -- -- -- -- -- -- 480.0 Lake Isabella -- -- -- -- -- -- -- -- -- -- -- -- -- -- -- EO -- -- -- -- 485.0 Ventura Marina -- -- -- -- -- -- -- -- -- -- EO -- -- -- -- -- -- -- -- -- 485.2 Ventura River Estuary -- -- -- -- -- -- -- -- -- -- -- -- -- -- O -- -- -- -- -- 487.1 Santa Clara River Estuary 1 -- -- -- -- -- -- -- -- -- -- -- -- -- -- O -- -- -- -- -- 487.3 Santa Clara River Estuary 2 -- -- -- -- -- -- -- -- -- -- -- -- -- -- O -- -- -- -- -- 500.0 San Miguel Island/West EO EO -- -- -- -- -- -- -- -- -- -- -- -- -- -- -- -- -- -- 501.0 San Miguel Island/East EO EO -- -- -- -- -- -- -- -- -- -- -- -- -- -- -- -- -- -- 502.0 Santa Cruz Island EO EO -- -- -- -- -- -- -- -- -- -- -- -- -- -- -- -- -- -- 503.0 Anacapa Island EO EO EO EO -- -- -- -- -- -- -- -- -- -- -- -- -- -- -- -- 504.0 Santa Barbara Island EO EO -- -- -- -- -- -- -- -- -- -- -- -- -- -- -- -- -- -- 505.0 Channel Island Harbor -- -- E EO O -- -- -- -- -- -- -- -- -- -- -- -- -- -- -- 505.2 Channel Island Harbor/North -- -- -- -- -- -- -- -- -- EO -- -- -- -- -- -- -- -- -- -- 506.0 Port Hueneme -- -- EO EO O -- -- -- -- -- -- -- -- -- -- -- -- -- -- -- 506.1 Port Hueneme/Wharf B -- -- -- -- -- -- -- -- O O EO O -- -- -- -- -- -- -- -- 506.2 Port Hueneme/Wharf 1 -- -- -- -- -- -- -- -- O EO EO O -- -- -- -- -- -- -- -- 506.3 Port Hueneme/Entrance -- -- -- -- -- -- -- -- -- -- EO -- -- -- -- -- -- -- -- -- 507.0 Point Mugu EO EO -- -- -- -- -- -- -- -- -- -- -- -- -- -- -- -- -- -- 507.1 Mugu Lagoon/L Street -- -- -- -- -- -- -- -- -- EO -- -- -- O -- -- -- -- -- -- 507.2 Mugu Lagoon/Laguna Road -- -- -- -- -- -- -- -- O EO -- -- -- O -- -- -- -- -- -- 507.3 Mugu Lagoon/Calleguas Creek -- -- -- -- -- -- -- -- O EO -- EO O O O O EO -- -- --_________________________________________________________________________________________________________________________________________________ * Sample Year = State Fiscal Year (July 1 - June 30). For example, Sample Year 78 = 1977-78 Fiscal Year. -- = Not Sampled. O = Synthetic Organics Only. E = Trace Elements Only. EO = Trace Elements and Synthetic Organics.

D-11
APPENDIX DState Mussel Watch ProgramStation Sampling History
_________________________________________________________________________________________________________________________________________________ Station Station Sample Year* Number Name 78 79 80 81 82 83 84 85 86 87 88 89 90 91 92 93 94 95 96 97_________________________________________________________________________________________________________________________________________________ 507.4 Ag Drain/Etting Road -- -- -- -- -- -- -- -- -- -- -- -- -- O -- -- -- -- -- -- 507.6 Ag Drain/Pleasant Valley Road -- -- -- -- -- -- -- -- -- -- -- -- -- O -- -- -- -- -- -- 507.7 Revolon Slough/Las Posas Rd -- -- -- -- -- -- -- -- -- -- -- -- -- O -- -- -- -- -- -- 507.8 Revolon Slough -- -- -- -- -- -- -- -- -- EO O O O O -- -- -- -- -- -- 508.1 Mugu Drainage 1 -- -- -- -- -- -- -- -- -- -- -- -- O -- -- -- -- E -- -- 508.2 Mugu Drainage 2 -- -- -- -- -- -- -- -- -- -- -- -- O -- -- -- -- -- -- -- 508.3 Mugu Drainage 3 -- -- -- -- -- -- -- -- -- -- -- -- O -- -- -- -- -- -- -- 508.4 Mugu Drainage 4 -- -- -- -- -- -- -- -- -- -- -- -- O -- -- -- -- -- -- -- 508.5 Mugu Drainage 5 -- -- -- -- -- -- -- -- -- -- -- -- O -- -- -- -- -- -- -- 508.6 Mugu Drainage 6 -- -- -- -- -- -- -- -- -- -- -- -- O -- -- -- -- -- -- -- 508.7 Mugu Drainage 7 -- -- -- -- -- -- -- -- -- -- -- -- O -- -- -- -- -- -- -- 509.0 Calleguas -- -- -- -- -- -- -- -- -- -- -- -- O -- -- -- -- -- -- -- 553.0 Marina Del Rey/Entrance -- -- -- -- -- -- -- -- -- -- -- EO -- -- -- -- -- -- -- -- 554.0 Marina Del Rey/Harbor Patrol Docks -- -- -- -- -- -- -- -- EO -- EO EO -- -- -- -- -- -- -- -- 555.0 Marina Del Rey/Basin G -- -- -- -- -- -- -- -- EO EO EO EO -- -- -- -- -- -- -- -- 555.2 Marina Del Rey/Basin D -- -- -- -- -- -- -- -- -- -- EO -- -- -- -- -- -- -- -- -- 556.0 Marina Del Rey/Basin E -- -- -- -- -- -- -- -- EO EO EO EO -- -- -- -- -- -- -- -- 557.0 Marina Del Rey/Ballona Creek -- -- -- -- -- -- -- -- EO EO EO -- -- -- -- -- -- -- -- -- 559.0 King Harbor -- -- -- -- -- -- -- -- -- -- EO -- -- -- -- -- -- -- -- -- 601.0 LA Harbor/National Steel -- -- -- -- EO -- EO EO EO EO EO EO O O EO EO EO EO EO EO 602.0 LA Harbor/West Basin -- -- -- -- EO -- E EO EO EO EO -- -- -- -- -- EO -- -- -- 602.5 LA Harbor/Todd Shipyards -- -- -- -- -- -- -- EO EO -- EO EO O O -- -- -- -- -- -- 602.6 LA Harbor/Berth 50 -- -- -- -- -- -- -- -- -- -- -- -- E -- -- -- -- -- -- -- 602.7 LA Harbor/Pacific Ave/Storm Drain -- -- -- -- -- -- -- -- -- -- EO -- -- -- -- -- -- -- -- -- 602.8 LA Harbor/Berth 49 -- -- -- -- -- -- -- -- -- EO EO E E E -- -- -- -- -- -- 602.9 LA Harbor/Berth 51 -- -- -- -- -- -- -- -- -- -- -- -- E -- -- -- -- -- -- -- 603.0 LA Harbor/Berth 151 -- -- -- -- EO -- EO EO EO -- EO O -- -- -- -- -- -- -- -- 603.6 LA Harbor/Slip 240 -- -- -- -- -- -- -- -- -- EO EO -- -- -- -- -- -- -- -- -- 603.8 LA Harbor/West Channel -- -- -- -- -- -- -- -- -- EO EO -- -- -- -- -- -- -- -- -- 604.0 LA Harbor/GATX Terminal -- -- -- O EO O -- -- EO -- -- -- -- -- -- -- -- -- -- -- 604.5 LA Harbor/Berth 212 -- -- -- -- -- -- -- -- -- -- -- E -- -- -- -- -- -- -- -- 605.0 LA Harbor/Cabrillo Pier -- O O -- EO -- EO -- -- -- -- EO -- -- O O EO EO O -- 606.0 LA Harbor/Fish Harbor/Outer -- -- -- -- EO -- -- -- -- -- -- -- -- -- -- -- -- -- -- -- 606.2 LA Harbor/Fish Harbor -- -- -- -- -- -- -- -- -- EO EO -- -- -- -- -- -- -- -- -- 606.3 LA Harbor/Watchorn Basin -- -- -- -- -- -- -- -- -- -- EO -- -- -- -- -- -- -- -- --_________________________________________________________________________________________________________________________________________________ * Sample Year = State Fiscal Year (July 1 - June 30). For example, Sample Year 78 = 1977-78 Fiscal Year. -- = Not Sampled. O = Synthetic Organics Only. E = Trace Elements Only. EO = Trace Elements and Synthetic Organics.

D-12
APPENDIX DState Mussel Watch ProgramStation Sampling History
_________________________________________________________________________________________________________________________________________________ Station Station Sample Year* Number Name 78 79 80 81 82 83 84 85 86 87 88 89 90 91 92 93 94 95 96 97_________________________________________________________________________________________________________________________________________________ 607.0 LA Harbor/Terminal Island -- -- -- O EO -- E -- EO -- -- -- -- -- -- -- -- -- -- -- 607.4 LB Harbor/Berth 214 -- -- -- -- -- -- -- -- -- EO -- -- -- -- -- -- -- -- -- -- 607.6 LB Harbor/Channel 2 -- -- -- -- -- -- -- -- -- EO -- -- -- -- -- -- -- -- -- -- 607.7 LB Harbor/Navy Mole Jetty -- -- -- -- -- -- -- -- -- O -- -- -- -- -- -- -- -- -- -- 607.8 LB Harbor/Pier J -- -- -- -- -- -- -- -- -- EO -- -- -- -- -- -- -- -- -- -- 608.0 LB Harbor/Navy Mole -- -- -- EO -- O -- -- -- -- -- -- -- -- -- -- -- -- -- -- 609.0 LB Harbor/Tide Gauge -- -- EO EO EO O EO -- EO -- O -- -- -- -- -- -- -- -- -- 609.4 Long Beach/Queensway Bay -- -- -- -- -- -- -- -- -- EO -- -- -- -- -- -- -- -- -- -- 610.0 LA River/Mouth -- -- -- O -- O -- EO -- -- -- -- -- -- -- -- -- -- -- -- 611.0 LB Harbor/Pier F -- -- -- -- EO -- -- -- -- -- -- -- -- -- -- -- -- -- -- -- 611.5 LB Harbor/LAPD Ramp -- -- -- O -- -- -- -- -- -- -- -- -- -- -- -- -- -- -- -- 612.0 LB Harbor/Navy Channel -- -- -- O -- O -- -- -- -- -- -- -- -- -- -- -- -- -- -- 613.0 LB Harbor/Southern Calif Edison -- -- -- -- EO -- EO -- EO -- -- -- -- -- -- -- -- -- -- -- 614.0 LB Harbor/Channel 3 -- -- -- -- EO -- -- -- -- -- -- -- -- -- -- -- -- -- -- -- 615.0 LB Harbor/Henry Ford Bridge -- -- -- -- EO -- -- -- EO EO -- -- -- -- -- -- -- -- -- -- 616.0 LA Harbor/Consolidated Slip -- -- -- -- EO O O EO EO EO EO EO O O EO EO EO EO EO EO 617.0 White's Point -- -- -- -- EO -- -- -- -- -- -- -- -- -- -- -- -- -- -- -- 617.6 Point Fermin -- -- -- -- -- -- -- -- -- -- -- -- -- -- -- O -- -- -- -- 617.9 Cabrillo Beach/Ocean Side -- -- -- -- -- -- -- -- -- -- -- -- -- -- -- O -- -- -- -- 618.0 LA Harbor/Angels Gate -- -- -- -- -- -- -- -- -- -- -- -- -- EO O O EO EO O -- 619.0 LA Harbor/San Pedro Boatworks -- -- -- -- -- -- -- -- -- -- -- -- -- EO -- -- -- -- -- -- 619.2 San Pedro Breakwater -- -- -- -- -- -- -- -- -- -- -- -- -- -- -- O -- -- -- -- 620.0 LB Harbor/JH Baxter 80 -- -- -- -- -- -- -- -- -- -- -- -- -- O -- -- -- -- -- -- 620.5 LA River/Upstream -- -- -- -- -- -- -- -- O -- -- -- -- -- -- -- -- -- -- -- 621.0 LA Harbor/Berth 120 -- -- -- -- -- -- -- -- -- -- -- -- -- O -- -- -- -- -- -- 622.0 LA Harbor/Commer Marine -- -- -- -- -- -- -- -- -- -- -- -- -- EO -- -- -- -- -- -- 625.0 Alamitos Bay/West 2nd Street -- -- -- -- -- -- -- -- EO -- -- -- -- -- -- -- -- -- -- -- 626.0 Alamitos Bay/Cerritos Channel -- -- -- -- -- -- -- -- EO -- -- -- -- -- -- -- -- -- -- -- 627.0 Alamitos Bay/Marine Stadium -- -- -- -- -- -- -- -- EO -- -- -- -- -- -- -- -- -- -- -- 627.4 Alamitos Bay/Marine Stadium/North -- -- -- -- -- -- -- -- -- EO -- -- -- -- -- -- -- -- -- -- 647.0 Point Dume -- -- -- E -- -- -- -- -- -- -- -- -- -- -- -- -- -- -- -- 648.0 Malibu -- -- -- E -- -- -- -- -- -- -- -- -- EO -- EO EO EO EO EO 648.1 Malibu Lagoon/Channel A -- -- -- -- -- -- -- -- -- -- -- -- -- -- EO EO -- -- -- -- 648.3 Malibu Lagoon/Channel C -- -- -- -- -- -- -- -- -- -- -- -- -- -- EO EO -- -- -- -- 648.5 Malibu Lagoon/PCH -- -- -- -- -- -- -- -- -- -- -- -- -- -- EO EO -- -- -- --_________________________________________________________________________________________________________________________________________________ * Sample Year = State Fiscal Year (July 1 - June 30). For example, Sample Year 78 = 1977-78 Fiscal Year. -- = Not Sampled. O = Synthetic Organics Only. E = Trace Elements Only. EO = Trace Elements and Synthetic Organics.

D-13
APPENDIX DState Mussel Watch ProgramStation Sampling History
_________________________________________________________________________________________________________________________________________________ Station Station Sample Year* Number Name 78 79 80 81 82 83 84 85 86 87 88 89 90 91 92 93 94 95 96 97_________________________________________________________________________________________________________________________________________________ 649.0 Big Rock Beach -- -- -- E -- -- -- -- -- -- -- -- -- -- -- -- -- -- -- -- 650.0 Santa Monica -- -- -- E -- -- -- -- -- -- -- E -- EO -- EO EO EO EO EO 651.0 Marina Del Rey/North Docks -- -- E EO -- -- -- -- -- -- -- -- -- -- -- -- -- -- -- -- 652.0 Marina Del Rey/North Docks Jetty -- -- E -- -- -- -- -- -- -- -- -- -- -- -- -- -- -- -- -- 653.0 Marina Del Rey/South Docks Jetty -- -- -- -- EO -- -- -- -- -- -- -- -- -- -- -- -- -- -- -- 654.0 Playa Del Rey -- -- -- E -- -- -- -- -- -- -- -- -- -- -- -- -- -- -- -- 655.0 El Segundo/Grand Avenue -- -- -- E -- -- -- -- -- -- -- -- -- -- -- -- -- -- -- -- 656.0 Manhattan Beach -- -- -- E -- -- -- -- -- -- -- E -- -- -- -- -- -- -- -- 657.0 Hermosa Beach -- -- -- E -- -- -- -- -- -- -- -- -- -- -- -- -- -- -- -- 658.0 Redondo Beach -- -- -- E -- -- -- -- -- -- -- E -- -- -- -- -- -- -- -- 659.0 Palos Verdes Point -- -- -- E -- -- -- -- -- -- -- -- -- -- -- -- -- -- -- -- 660.0 Point Vicente -- -- E EO -- -- -- -- -- -- -- -- -- -- -- -- -- -- -- -- 661.0 Royal Palms/North -- -- E E -- -- -- -- -- -- -- -- -- -- -- -- -- -- -- -- 662.0 Royal Palms EO EO EO O EO EO EO EO EO EO EO EO EO EO EO EO EO EO EO EO 663.0 Royal Palms/South -- -- E -- -- -- -- -- -- -- -- -- -- -- -- -- -- -- -- -- 664.0 Cabrillo Beach -- -- E O -- -- -- -- -- -- -- -- -- -- O -- -- EO EO -- 664.2 Cabrillo Beach Buoy -- -- -- -- -- -- -- -- -- -- -- -- -- -- -- O -- -- -- -- 680.0 Catalina Island/East -- EO E EO -- -- -- -- -- -- -- -- -- -- -- -- -- -- -- -- 681.0 Catalina Island/West EO EO E E -- -- -- -- -- -- -- -- -- -- E -- -- -- -- -- 682.0 Catalina Island/Ribbon Rock -- -- -- E -- -- -- -- -- -- -- -- -- E -- EO EO -- -- -- 683.0 Catalina Island/Ben Weston -- -- -- EO -- -- -- -- -- -- -- -- -- -- -- -- -- -- -- -- 684.0 Catalina Island/Silver Canyon -- -- -- E -- -- -- -- -- -- -- -- -- -- -- -- -- -- -- -- 685.0 Catalina Island/Church Rock -- -- -- E -- -- -- -- -- -- -- -- -- -- -- -- -- -- -- -- 701.0 Colorado Lagoon/West -- -- -- -- EO -- -- EO EO -- -- -- -- -- -- -- -- -- -- -- 701.2 Colorado Lagoon/East -- -- -- -- -- -- -- -- -- EO -- -- -- -- -- -- -- -- -- -- 703.0 Alamitos Bay/Pier 22 -- -- -- -- O -- -- -- -- -- -- -- -- -- -- -- -- -- -- -- 707.0 Anaheim Bay/Navy Harbor -- -- -- -- -- -- EO -- EO EO EO EO EO EO EO -- -- -- -- -- 708.0 Anaheim Bay/Navy Marsh -- -- -- -- -- -- EO -- -- EO EO -- EO EO EO -- -- -- -- EO 708.5 Anaheim Bay/Navy Marsh 2 -- -- -- -- -- -- -- -- -- -- -- -- -- EO EO -- -- -- -- -- 709.0 Anaheim Bay/Entrance -- -- -- E O -- -- -- -- -- -- -- -- -- -- -- -- -- -- -- 710.0 Anaheim Bay/Fuel Docks/North -- -- EO O -- -- -- -- -- -- -- -- -- -- -- -- -- -- -- -- 710.2 Anaheim Bay/Fuel Docks/South -- -- -- -- -- -- -- EO EO EO EO EO EO -- -- -- -- -- -- -- 711.0 Huntington Harbour/Launch Ramp Dks -- -- -- -- O -- -- -- -- -- -- -- -- -- -- -- -- -- -- -- 712.0 Huntington Harbour/Peter's Landing -- -- -- -- EO -- -- -- -- -- -- -- -- -- -- -- -- -- -- -- 713.0 Huntington Harbour/Edinger Street -- -- -- -- -- -- EO -- EO EO EO -- EO EO EO -- EO EO EO EO_________________________________________________________________________________________________________________________________________________ * Sample Year = State Fiscal Year (July 1 - June 30). For example, Sample Year 78 = 1977-78 Fiscal Year. -- = Not Sampled. O = Synthetic Organics Only. E = Trace Elements Only. EO = Trace Elements and Synthetic Organics.

D-14
APPENDIX DState Mussel Watch ProgramStation Sampling History
_________________________________________________________________________________________________________________________________________________ Station Station Sample Year* Number Name 78 79 80 81 82 83 84 85 86 87 88 89 90 91 92 93 94 95 96 97_________________________________________________________________________________________________________________________________________________ 715.0 Huntington Harbour/Warner Ave Brdg -- -- -- -- -- -- EO EO EO EO EO EO EO EO EO EO EO EO EO EO 717.0 Huntington Harbour/Harbor Lane -- -- -- -- -- -- -- -- EO EO EO EO -- -- EO -- -- -- -- -- 719.1 Santa Ana River/Prado Dam -- -- -- -- -- -- -- -- -- -- -- -- -- -- EO EO -- -- -- -- 719.8 Temescal Creek/Nichols Road -- -- -- -- -- -- -- -- -- -- -- -- -- -- E -- -- -- -- -- 720.0 Newport Pier -- -- -- -- -- -- -- -- -- O -- -- -- -- -- -- -- -- -- -- 720.5 Newport Bay/Offshore Ref -- -- -- -- -- -- -- -- -- -- -- -- -- EO -- -- -- -- -- -- 721.0 Newport Bay/Entrance -- -- -- -- E EO EO EO EO EO EO EO EO EO -- -- -- -- -- -- 722.0 Newport Bay/Police Docks -- -- EO EO E EO -- -- O -- -- -- -- -- -- -- -- -- -- -- 722.4 Newport Bay/El Paseo Drive -- -- -- -- -- -- -- -- -- EO -- -- -- -- -- -- -- -- -- -- 723.0 Newport Bay/Bay Island -- -- -- -- EO EO O EO EO EO EO -- EO EO EO -- -- -- -- -- 723.4 Newport Bay/Turning Basin -- -- -- -- -- -- -- -- -- EO EO EO EO EO EO -- -- EO EO -- 724.0 Newport Bay/Highway 1 Bridge -- -- -- -- -- EO EO EO EO EO EO EO EO EO EO EO EO EO EO -- 724.4 Newport Bay/Dunes Dock -- -- -- -- -- -- -- -- -- EO -- -- -- -- -- -- -- -- -- -- 725.0 Newport Bay/Crows Nest -- -- -- -- EO EO EO EO EO EO EO EO EO EO EO EO EO EO EO EO 726.0 Newport Bay/Rhine Channel/Upper -- -- -- -- -- EO EO EO EO EO EO EO -- -- -- -- -- -- -- -- 726.2 Newport Bay/Rhine Channel/26th Ave -- -- -- -- -- -- -- -- -- EO -- EO -- -- -- -- -- -- -- -- 726.4 Newport Bay/Rhine Channel/End -- -- -- -- -- -- -- -- -- EO EO EO EO EO EO EO EO EO EO EO 726.6 Newport Bay/Mariners Drive -- -- -- -- -- -- -- -- -- -- -- -- -- -- -- -- -- -- -- EO 727.0 Garden Grove/Wintersburg Channel -- -- -- -- -- -- -- -- -- -- -- -- -- EO -- EO -- -- -- -- 728.4 Upper Newport Bay/MacArthur -- -- -- -- -- -- -- EO EO EO EO EO EO EO -- EO -- -- -- -- 728.5 Upper Newport Bay/Drain 2 -- -- -- -- -- -- -- -- -- -- -- -- EO -- -- -- -- -- -- -- 728.6 Upper Newport Bay/San Diego Cr 1 -- -- -- -- -- -- -- -- -- -- EO -- -- -- -- -- -- -- -- -- 728.7 Upper Newport Bay/Drain 4 -- -- -- -- -- -- -- -- -- -- -- -- E EO -- EO -- -- -- -- 728.8 Upper Newport Bay/San Diego Cr 2 -- -- -- -- -- -- -- -- -- -- EO -- -- -- -- -- -- -- -- -- 728.9 Upper Newport Bay/Drain 5 -- -- -- -- -- -- -- -- -- -- -- -- EO EO -- -- -- -- -- -- 730.0 Huntington Beach Pier -- -- E -- -- -- -- -- -- -- -- -- -- E -- -- -- -- -- -- 731.0 Newport Beach Pier -- -- -- E -- -- -- -- -- -- -- -- -- -- -- -- -- -- -- -- 732.0 Newport Bay/Entrance/West Jetty -- -- E E -- -- -- -- -- -- -- -- -- -- -- -- -- -- -- -- 733.0 Newport Bay/Entrance/W Jetty/End -- -- -- E -- -- -- -- -- -- -- -- -- -- -- -- -- -- -- -- 734.0 Newport Bay/Entrance/East Jetty -- -- -- E -- -- -- -- -- -- -- -- -- -- -- -- -- -- -- -- 735.0 Corona Del Mar EO EO EO O -- -- -- -- -- -- -- -- -- EO EO -- -- -- -- -- 736.0 Little Corona City Beach -- -- E -- -- -- -- -- -- -- -- -- -- -- -- -- -- -- -- -- 737.0 Crescent Bay Beach -- -- E -- -- -- -- -- -- -- -- -- -- -- -- -- -- -- -- -- 740.0 Dana Point Harbor/Boat Yard -- -- -- -- -- -- -- -- E -- -- -- -- EO EO EO -- -- -- EO 742.0 San Juan Creek -- -- -- -- -- -- -- -- -- -- -- -- -- -- -- -- -- -- O --_________________________________________________________________________________________________________________________________________________ * Sample Year = State Fiscal Year (July 1 - June 30). For example, Sample Year 78 = 1977-78 Fiscal Year. -- = Not Sampled. O = Synthetic Organics Only. E = Trace Elements Only. EO = Trace Elements and Synthetic Organics.

D-15
APPENDIX DState Mussel Watch ProgramStation Sampling History
_________________________________________________________________________________________________________________________________________________ Station Station Sample Year* Number Name 78 79 80 81 82 83 84 85 86 87 88 89 90 91 92 93 94 95 96 97_________________________________________________________________________________________________________________________________________________ 744.0 San Onofre Nuclear Plant Outfall -- -- -- -- -- -- -- -- E -- -- -- -- -- -- -- -- -- -- -- 744.1 San Onofre 1 -- -- -- -- -- -- -- -- -- -- -- EO -- EO EO -- -- -- -- -- 744.2 San Onofre 2 -- -- -- -- -- -- -- -- -- -- -- EO EO EO EO -- -- -- -- -- 744.3 San Onofre 3 -- -- -- -- -- -- -- -- -- -- -- -- EO EO EO -- -- -- -- -- 744.4 San Onofre 4 -- -- -- -- -- -- -- -- -- -- -- EO EO EO EO -- -- -- -- -- 744.5 San Onofre 5 -- -- -- -- -- -- -- -- -- -- -- EO EO EO EO -- -- -- -- -- 744.6 San Onofre 6 -- -- -- -- -- -- -- -- -- -- -- EO EO EO EO -- -- -- -- -- 748.0 Oceanside/Harbor -- -- -- -- -- -- -- E E E E -- -- -- -- EO -- -- -- -- 750.0 Oceanside EO EO EO EO EO EO EO EO EO EO EO EO EO EO EO EO -- EO O EO 751.0 Oceanside/Transplant -- -- -- E -- -- -- -- -- -- -- -- -- EO -- -- -- -- -- -- 753.0 Inner Agua Hedionda -- -- -- -- -- -- -- -- -- EO O -- -- -- -- -- -- -- -- -- 800.0 Ingraham Street/North -- -- E -- -- -- -- -- -- -- -- -- -- -- -- -- -- -- -- -- 830.0 Torrey Pines -- -- E -- -- -- -- -- -- -- -- -- -- -- -- -- -- -- -- -- 831.0 Scripps Oceanographic Inst Pier -- -- E -- -- -- -- -- -- -- -- -- -- -- -- -- -- -- -- -- 832.0 La Jolla EO EO EO -- -- -- -- -- -- -- -- -- -- EO EO EO -- -- -- -- 833.0 Boomers Point -- -- E -- -- -- -- -- -- -- -- -- -- -- -- -- -- -- -- -- 834.0 Bird Rock -- -- E E -- -- -- -- -- -- -- -- -- -- -- -- -- -- -- -- 835.0 Pacific Beach -- -- -- E -- -- -- -- -- -- -- -- -- -- -- -- -- -- -- -- 836.0 Mission Bay/North Jetty -- -- -- E -- -- -- -- -- -- -- -- -- -- -- -- -- -- -- -- 837.0 Mission Bay/South Jetty -- -- -- E E -- -- -- -- -- -- -- -- -- -- -- -- -- -- -- 838.0 Crystal Pier -- -- -- -- E -- -- -- -- -- -- -- -- -- -- -- -- -- -- -- 838.2 Point Loma/Sunset Cliffs -- -- -- -- -- -- -- -- E E E E E EO E E -- -- -- -- 839.0 Point Loma/Pink House -- -- -- E EO -- -- -- -- -- -- -- -- -- -- -- -- -- -- -- 839.2 Point Loma/STP Outfall -- -- -- -- -- -- -- -- E E -- -- -- -- -- -- -- -- -- -- 840.0 Naval Ocean Sys Cntr/Dolphin Tanks -- -- -- E E EO -- EO E -- -- E -- -- -- E -- -- -- -- 840.2 Point Loma/Coast Guard Station -- -- -- -- -- -- -- -- E -- -- -- -- -- -- -- -- -- -- -- 841.0 Coronado Hotel -- -- -- E -- -- -- -- -- -- -- -- -- -- -- -- -- -- -- -- 842.0 Imperial Beach -- -- -- E -- -- -- -- -- -- -- -- -- -- -- -- -- -- -- -- 849.0 Point Loma/A9d -- -- -- -- -- E -- -- -- -- -- -- -- -- -- -- -- -- -- -- 849.5 Point Loma/A9s -- -- -- -- -- E -- -- -- -- -- -- -- -- -- -- -- -- -- -- 850.0 Point Loma/STP/A8s -- -- -- -- E -- -- -- -- -- -- -- -- -- -- -- -- -- -- -- 850.5 Point Loma -- -- -- -- -- E -- -- -- -- -- -- -- -- -- -- -- -- -- -- 852.0 Point Loma/A10s -- -- -- -- -- E -- -- -- -- -- -- -- -- -- -- -- -- -- -- 864.0 Mission Bay/Yacht Club -- -- -- -- -- -- E -- -- -- -- -- -- -- -- -- -- -- -- -- 865.0 Mission Bay/Hilton Docks -- -- -- -- E -- EO -- -- -- -- -- EO -- -- -- -- -- -- --_________________________________________________________________________________________________________________________________________________ * Sample Year = State Fiscal Year (July 1 - June 30). For example, Sample Year 78 = 1977-78 Fiscal Year. -- = Not Sampled. O = Synthetic Organics Only. E = Trace Elements Only. EO = Trace Elements and Synthetic Organics.

D-16
APPENDIX DState Mussel Watch ProgramStation Sampling History
_________________________________________________________________________________________________________________________________________________ Station Station Sample Year* Number Name 78 79 80 81 82 83 84 85 86 87 88 89 90 91 92 93 94 95 96 97_________________________________________________________________________________________________________________________________________________ 866.0 Fisherman Channel -- -- -- -- E -- E -- E -- -- -- -- EO -- -- -- -- -- -- 867.0 Ingraham Street -- -- O -- EO -- -- -- -- -- -- -- -- -- -- -- -- -- -- -- 868.0 West Mission Bay Drive -- -- -- -- E -- -- -- -- -- -- -- -- -- -- -- -- -- -- -- 868.5 Mission Bay/Landfill 1 -- -- -- -- -- -- -- -- -- -- -- -- EO EO EO -- -- EO -- -- 868.6 Mission Bay/Landfill 2 -- -- -- -- -- -- -- -- -- -- -- -- -- EO EO -- -- EO -- -- 869.0 Mission Bay/Seaworld Tower -- -- -- -- -- -- EO -- -- -- -- -- -- -- -- -- -- -- -- -- 870.0 Mission Bay/South Shore/Rock 1 -- -- -- -- -- -- O -- -- -- -- -- -- -- -- -- -- -- -- -- 872.0 Mission Bay/South Shore/Rock 3 -- -- -- -- -- -- O -- -- -- -- -- -- -- -- -- -- -- -- -- 872.2 Rose Creek -- -- -- -- -- -- -- -- EO -- -- -- -- -- -- -- -- -- -- -- 872.4 Mission Bay/Kendall-Frost Reserve -- -- -- -- -- -- -- -- -- -- -- -- -- -- -- E -- -- -- -- 873.0 Mission Bay/Entrance -- -- -- EO -- -- -- -- -- -- -- -- -- -- -- -- -- -- -- -- 873.5 Mission Bay/Harbor Police -- -- -- -- -- -- E -- -- -- -- -- -- -- -- E -- -- -- -- 874.0 San Diego River/Channel -- -- -- -- -- -- EO -- -- -- -- -- -- -- -- -- -- -- -- -- 874.2 Tecolote Creek -- -- -- -- -- -- -- -- O -- -- -- -- -- -- -- -- -- -- -- 874.5 San Diego River -- -- -- -- -- -- -- EO -- -- -- -- -- -- -- -- -- -- -- -- 880.0 National City -- -- -- O -- -- -- -- -- -- -- -- -- -- -- -- -- -- -- -- 881.0 San Diego Bay/Sweetwater Marsh -- -- -- -- -- EO -- -- -- -- -- E -- -- -- -- -- -- -- -- 881.1 San Diego Bay/California Crane -- -- -- -- -- E -- -- -- -- -- -- -- -- -- -- -- -- -- -- 881.3 Sweetwater River/Mouth 1 -- -- -- -- -- -- -- -- -- -- -- -- -- EO EO -- -- -- -- -- 881.4 Sweetwater River/Mouth 2 -- -- -- -- -- -- -- -- -- -- -- -- -- -- EO -- -- -- -- -- 881.5 San Diego Bay/Rohr Channel Mouth -- -- -- -- -- -- -- -- -- -- -- -- -- -- -- E -- -- -- -- 882.0 24th St Maritime Terminal/South -- -- -- -- EO E E E E E E -- -- -- E -- E EO -- -- 882.2 24Th St Maritime Terminal/North -- -- -- -- -- E -- -- -- -- -- E E -- -- E -- -- E -- 882.4 San Diego Bay/Navy Pier 13 -- -- -- -- -- E E E -- -- -- -- -- -- -- -- -- -- -- -- 882.5 San Diego Bay/NASSCO Pier 12 -- -- -- -- -- -- -- -- -- -- EO -- -- -- -- -- -- -- -- -- 882.6 San Diego Bay/Sampson St Extension -- -- -- -- -- -- -- -- EO -- -- -- -- -- -- -- -- -- -- -- 882.7 San Diego Bay/Sampson Street Pier -- -- -- -- -- -- -- -- -- O EO EO -- -- -- EO -- -- EO -- 882.8 San Diego Bay/KELCO Pier -- -- -- -- -- -- -- -- -- O -- EO -- -- EO -- -- -- -- -- 882.9 San Diego Bay/Coronado Brdg/East -- -- -- -- -- -- -- -- -- O -- EO -- -- -- -- -- -- -- -- 883.0 San Diego Bay/Navy Amphibious Base -- -- -- O O E -- -- -- -- -- -- -- -- -- -- -- -- -- -- 883.1 San Diego Bay/Chollas Creek -- -- -- -- -- -- -- -- -- -- -- EO -- -- -- -- EO -- O EO 883.2 San Diego Bay/Chollas Creek/Mouth -- -- -- -- -- -- -- -- -- -- -- -- -- -- -- -- -- -- -- EO 883.3 San Diego Bay/Chollas Creek/End -- -- -- -- -- -- -- -- -- -- -- -- -- -- -- -- -- -- -- EO 883.4 San Diego Bay/Continental Maritime -- -- -- -- -- -- -- -- -- -- -- E -- -- -- EO EO -- -- -- 883.5 San Diego Bay/Tuna Docks -- -- -- -- -- -- -- -- -- O -- E -- -- -- -- EO -- -- EO_________________________________________________________________________________________________________________________________________________ * Sample Year = State Fiscal Year (July 1 - June 30). For example, Sample Year 78 = 1977-78 Fiscal Year. -- = Not Sampled. O = Synthetic Organics Only. E = Trace Elements Only. EO = Trace Elements and Synthetic Organics.
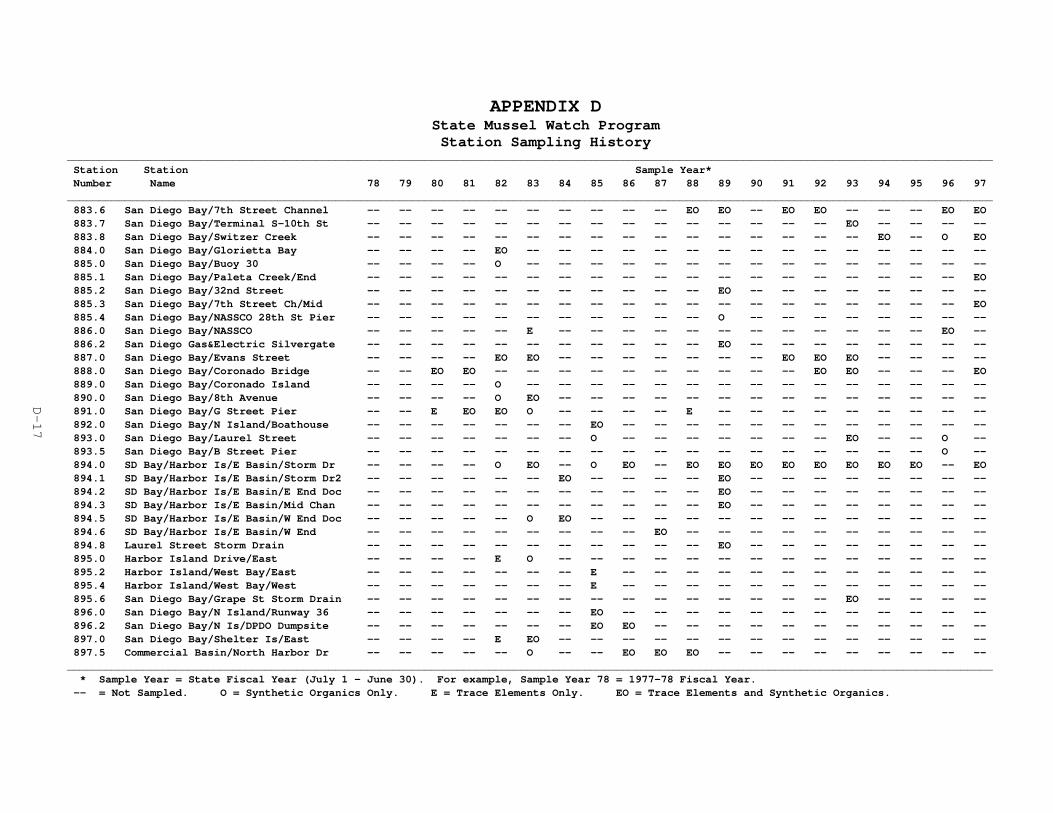
D-17
APPENDIX DState Mussel Watch ProgramStation Sampling History
_________________________________________________________________________________________________________________________________________________ Station Station Sample Year* Number Name 78 79 80 81 82 83 84 85 86 87 88 89 90 91 92 93 94 95 96 97_________________________________________________________________________________________________________________________________________________ 883.6 San Diego Bay/7th Street Channel -- -- -- -- -- -- -- -- -- -- EO EO -- EO EO -- -- -- EO EO 883.7 San Diego Bay/Terminal S-10th St -- -- -- -- -- -- -- -- -- -- -- -- -- -- -- EO -- -- -- -- 883.8 San Diego Bay/Switzer Creek -- -- -- -- -- -- -- -- -- -- -- -- -- -- -- -- EO -- O EO 884.0 San Diego Bay/Glorietta Bay -- -- -- -- EO -- -- -- -- -- -- -- -- -- -- -- -- -- -- -- 885.0 San Diego Bay/Buoy 30 -- -- -- -- O -- -- -- -- -- -- -- -- -- -- -- -- -- -- -- 885.1 San Diego Bay/Paleta Creek/End -- -- -- -- -- -- -- -- -- -- -- -- -- -- -- -- -- -- -- EO 885.2 San Diego Bay/32nd Street -- -- -- -- -- -- -- -- -- -- -- EO -- -- -- -- -- -- -- -- 885.3 San Diego Bay/7th Street Ch/Mid -- -- -- -- -- -- -- -- -- -- -- -- -- -- -- -- -- -- -- EO 885.4 San Diego Bay/NASSCO 28th St Pier -- -- -- -- -- -- -- -- -- -- -- O -- -- -- -- -- -- -- -- 886.0 San Diego Bay/NASSCO -- -- -- -- -- E -- -- -- -- -- -- -- -- -- -- -- -- EO -- 886.2 San Diego Gas&Electric Silvergate -- -- -- -- -- -- -- -- -- -- -- EO -- -- -- -- -- -- -- -- 887.0 San Diego Bay/Evans Street -- -- -- -- EO EO -- -- -- -- -- -- -- EO EO EO -- -- -- -- 888.0 San Diego Bay/Coronado Bridge -- -- EO EO -- -- -- -- -- -- -- -- -- -- EO EO -- -- -- EO 889.0 San Diego Bay/Coronado Island -- -- -- -- O -- -- -- -- -- -- -- -- -- -- -- -- -- -- -- 890.0 San Diego Bay/8th Avenue -- -- -- -- O EO -- -- -- -- -- -- -- -- -- -- -- -- -- -- 891.0 San Diego Bay/G Street Pier -- -- E EO EO O -- -- -- -- E -- -- -- -- -- -- -- -- -- 892.0 San Diego Bay/N Island/Boathouse -- -- -- -- -- -- -- EO -- -- -- -- -- -- -- -- -- -- -- -- 893.0 San Diego Bay/Laurel Street -- -- -- -- -- -- -- O -- -- -- -- -- -- -- EO -- -- O -- 893.5 San Diego Bay/B Street Pier -- -- -- -- -- -- -- -- -- -- -- -- -- -- -- -- -- -- O -- 894.0 SD Bay/Harbor Is/E Basin/Storm Dr -- -- -- -- O EO -- O EO -- EO EO EO EO EO EO EO EO -- EO 894.1 SD Bay/Harbor Is/E Basin/Storm Dr2 -- -- -- -- -- -- EO -- -- -- -- EO -- -- -- -- -- -- -- -- 894.2 SD Bay/Harbor Is/E Basin/E End Doc -- -- -- -- -- -- -- -- -- -- -- EO -- -- -- -- -- -- -- -- 894.3 SD Bay/Harbor Is/E Basin/Mid Chan -- -- -- -- -- -- -- -- -- -- -- EO -- -- -- -- -- -- -- -- 894.5 SD Bay/Harbor Is/E Basin/W End Doc -- -- -- -- -- O EO -- -- -- -- -- -- -- -- -- -- -- -- -- 894.6 SD Bay/Harbor Is/E Basin/W End -- -- -- -- -- -- -- -- -- EO -- -- -- -- -- -- -- -- -- -- 894.8 Laurel Street Storm Drain -- -- -- -- -- -- -- -- -- -- -- EO -- -- -- -- -- -- -- -- 895.0 Harbor Island Drive/East -- -- -- -- E O -- -- -- -- -- -- -- -- -- -- -- -- -- -- 895.2 Harbor Island/West Bay/East -- -- -- -- -- -- -- E -- -- -- -- -- -- -- -- -- -- -- -- 895.4 Harbor Island/West Bay/West -- -- -- -- -- -- -- E -- -- -- -- -- -- -- -- -- -- -- -- 895.6 San Diego Bay/Grape St Storm Drain -- -- -- -- -- -- -- -- -- -- -- -- -- -- -- EO -- -- -- -- 896.0 San Diego Bay/N Island/Runway 36 -- -- -- -- -- -- -- EO -- -- -- -- -- -- -- -- -- -- -- -- 896.2 San Diego Bay/N Is/DPDO Dumpsite -- -- -- -- -- -- -- EO EO -- -- -- -- -- -- -- -- -- -- -- 897.0 San Diego Bay/Shelter Is/East -- -- -- -- E EO -- -- -- -- -- -- -- -- -- -- -- -- -- -- 897.5 Commercial Basin/North Harbor Dr -- -- -- -- -- O -- -- EO EO EO -- -- -- -- -- -- -- -- --_________________________________________________________________________________________________________________________________________________ * Sample Year = State Fiscal Year (July 1 - June 30). For example, Sample Year 78 = 1977-78 Fiscal Year. -- = Not Sampled. O = Synthetic Organics Only. E = Trace Elements Only. EO = Trace Elements and Synthetic Organics.

D-18
APPENDIX DState Mussel Watch ProgramStation Sampling History
_________________________________________________________________________________________________________________________________________________ Station Station Sample Year* Number Name 78 79 80 81 82 83 84 85 86 87 88 89 90 91 92 93 94 95 96 97_________________________________________________________________________________________________________________________________________________ 898.0 Commercial Basin/Carlton Street -- -- -- -- O EO -- -- -- -- -- EO EO -- -- EO -- -- -- -- 898.2 San Diego Bay/N Is/Launch Docks -- -- -- -- -- -- EO -- -- -- -- -- -- -- -- -- -- -- -- -- 898.4 San Diego Bay/North Island Plat -- -- -- -- -- -- E -- -- -- -- -- -- -- -- -- -- -- -- -- 899.0 San Diego Bay/Shelter Is/Fshg Pier -- O EO EO -- -- -- -- -- -- -- E E -- EO EO -- EO -- -- 899.1 San Diego Bay/Shelter Is/Duffy's -- -- -- -- -- -- -- -- -- E -- -- -- -- -- -- -- -- -- -- 899.2 San Diego Bay/Shelter Island -- -- -- -- -- -- -- E -- -- -- -- -- -- -- EO -- -- -- -- 899.4 San Diego Bay/Shelter Is/Fuel Dock -- -- -- -- -- -- -- -- -- EO EO -- -- -- -- -- -- -- -- -- 900.0 San Diego Bay/Range Marker -- -- -- -- -- -- -- E -- -- -- -- -- -- -- -- -- -- -- -- 900.5 San Diego Bay/Bait Tanks -- -- -- -- -- -- -- E -- -- -- -- -- -- -- -- -- -- -- -- 901.0 San Diego Bay/Degausing Station -- -- -- -- EO EO -- -- -- -- -- -- -- EO EO -- -- -- -- -- 901.2 San Diego Bay/N Island/Ammo Pier -- -- -- -- -- -- -- EO -- -- -- -- -- -- -- -- -- -- -- -- 902.0 Zuniga Jetty/Buoy -- -- -- O -- -- -- -- -- -- -- -- -- -- -- -- -- -- -- -- 903.0 Zuniga Jetty -- -- -- -- -- -- EO E EO -- -- -- -- -- -- -- -- -- -- -- 904.0 Imperial Beach/Pier -- -- -- -- -- -- E -- -- -- -- -- -- EO -- -- -- -- -- -- 904.8 Tijuana River/Imperial Beach -- -- -- -- -- -- -- EO EO -- -- -- -- -- -- -- -- -- -- -- 905.0 Tijuana River -- -- -- -- -- -- EO -- -- -- -- -- -- -- -- -- -- -- -- -- 906.0 Mexican Border -- -- -- -- -- -- -- -- EO -- -- -- -- -- -- -- -- -- -- --_________________________________________________________________________________________________________________________________________________ * Sample Year = State Fiscal Year (July 1 - June 30). For example, Sample Year 78 = 1977-78 Fiscal Year. -- = Not Sampled. O = Synthetic Organics Only. E = Trace Elements Only. EO = Trace Elements and Synthetic Organics.

E-1
APPENDIX E
Summary of 1995-97 Data
Organic Chemicals Exceeding Selected Criteria
(ppb, wet weight)

E-2
Appendix EState Mussel Watch Program
Summary of 1995-97 Data: Organic Chemicals Exceeding Selected Criteria (ppb, wet weight)_____________________________________________________________________________________________________________________________________ Aldrin Total Chlor- Dacthal DiazinonStation Station Sample Sample Chlor- pyrifosNumber Name Type* Date dane_____________________________________________________________________________________________________________________________________205.0 Bodega Harbor/Spud Point Marina TCM 03/21/97307.0 San Francisco Bay/Treasure Is TCM-a 01/26/81307.0 San Francisco Bay/Treasure Is TCM-a 02/02/82308.0 San Francisco Bay/Hunter's Point TCM-a 01/26/81309.0 San Mateo Bridge/8B TCM-a 02/09/81313.0 San Francisco Bay/near Redwood Cr TCM-a 01/26/81321.0 Dumbarton Bridge/Channel Marker 14 TCM-a 02/09/81 0.9** 1.3*400.6 Santa Cruz/Natural Bridges RCM 06/09/97403.0 Elkhorn Slough/Highway 1 Bridge TCM 03/12/97 0.7*404.0 Sandholdt Bridge TCM 02/16/96 2.0** 6.6**_____________________________________________________________________________________________________________________________________ Total Dieldrin Total Endrin beta- delta- Gamma- HeptachlorStation DDT Endo- HCH HCH HCHNumber sulfan_____________________________________________________________________________________________________________________________________205.0307.0 0.4*307.0 5.9*308.0 7.3*309.0 8.3*313.0 10.9* 0.5*321.0 10.4* 0.4* 1.1**400.6 2.5*403.0 7.0*404.0 441.8** 32.1** 1.9* 4.0**_____________________________________________________________________________________________________________________________________ Hepta- Hexa- Methoxy- Ethyl- Oxadiazon Total ToxapheneStation chlor- chloro- chlor para- PCBNumber epoxide benzene thion_____________________________________________________________________________________________________________________________________205.0 0.2**307.0 0.1* 0.24** 15.3*307.0 0.3* 25.7*308.0 0.2* 17.8*309.0 0.3* 0.16** 14.9*313.0 0.3* 0.2** 0.33** 17.6*321.0 0.5** 0.2** 0.22** 19.0*400.6403.0 1.6** 42.0*404.0 0.5** 232.1**_____________________________________________________________________________________________________________________________________* RCM = Resident California Mussel * = Equals or exceeds EDL 85. ## = Equals or exceeds FDA Action Level. RBM = Resident Bay Mussel ** = Equals or exceeds EDL 95. TCM = Transplanted California Mussel (a = archive)

E-3
Appendix EState Mussel Watch Program
Summary of 1995-97 Data: Organic Chemicals Exceeding Selected Criteria (ppb, wet weight)_____________________________________________________________________________________________________________________________________ Aldrin Total Chlor- Dacthal DiazinonStation Station Sample Sample Chlor- pyrifosNumber Name Type* Date dane_____________________________________________________________________________________________________________________________________404.0 Sandholdt Bridge TCM 03/04/97 1.1* 2.8*414.0 Pacific Grove RCM 03/07/96414.0 Pacific Grove RCM 04/25/97 0.3*601.0 LA Harbor/National Steel TCM 01/28/97616.0 LA Harbor/Consolidated Slip TCM 01/28/97618.0 LA Harbor/Angels Gate RCM 01/18/96 5.0* 10.4**650.0 Santa Monica RCM 11/25/96 4.6*662.0 Royal Palms RCM 01/18/96662.0 Royal Palms RCM 11/25/96664.0 Cabrillo Beach RCM 01/18/96_____________________________________________________________________________________________________________________________________ Total Dieldrin Total Endrin beta- delta- Gamma- HeptachlorStation DDT Endo- HCH HCH HCHNumber sulfan_____________________________________________________________________________________________________________________________________404.0 415.8** 27.6** 1.6* 2.2**414.0 1.6*414.0601.0616.0618.0 178.4**650.0662.0 121.7*662.0 72.7*664.0 72.1*_____________________________________________________________________________________________________________________________________ Hepta- Hexa- Methoxy- Ethyl- Oxadiazon Total ToxapheneStation chlor- chloro- chlor para- PCBNumber epoxide benzene thion_____________________________________________________________________________________________________________________________________404.0 228.5**414.0414.0601.0 1.2* 12.8*616.0 3.2** 42.8*618.0 96.6**650.0662.0 17.2*662.0 26.7*664.0_____________________________________________________________________________________________________________________________________* RCM = Resident California Mussel * = Equals or exceeds EDL 85. ## = Equals or exceeds FDA Action Level. RBM = Resident Bay Mussel ** = Equals or exceeds EDL 95. TCM = Transplanted California Mussel

E-4
Appendix EState Mussel Watch Program
Summary of 1995-97 Data: Organic Chemicals Exceeding Selected Criteria (ppb, wet weight)_____________________________________________________________________________________________________________________________________ Aldrin Total Chlor- Dacthal DiazinonStation Station Sample Sample Chlor- pyrifosNumber Name Type* Date dane_____________________________________________________________________________________________________________________________________708.0 Anaheim Bay/Navy Marsh TCM 01/27/97 1.6**713.0 Huntington Harbour/Edinger Street TCM 01/17/96 0.7*713.0 Huntington Harbour/Edinger Street TCM 01/27/97 1.0*715.0 Huntington Harbour/Warner Ave Brdg TCM 01/27/97 1.7**725.0 Newport Bay/Crows Nest TCM 01/17/96725.0 Newport Bay/Crows Nest TCM 01/27/97 1.1*726.4 Newport Bay/Rhine Channel/End TCM 01/27/97 0.9*726.6 Newport Bay/Mariners Drive TCM 01/27/97 1.4* 1.0* 6.3**750.0 Oceanside RCM 01/18/96 5.1*882.7 San Diego Bay/Sampson Street Pier TCM 01/18/96_____________________________________________________________________________________________________________________________________ Total Dieldrin Total Endrin beta- delta- Gamma- HeptachlorStation DDT Endo- HCH HCH HCHNumber sulfan_____________________________________________________________________________________________________________________________________708.0713.0 0.2**713.0715.0725.0 159.1*725.0726.4726.6750.0882.7 0.5** 0.5*_____________________________________________________________________________________________________________________________________ Hepta- Hexa- Methoxy- Ethyl- Oxadiazon Total ToxapheneStation chlor- chloro- chlor para- PCBNumber epoxide benzene thion_____________________________________________________________________________________________________________________________________708.0713.0 0.3*713.0715.0 16.0*725.0725.0 1.5* 23.3*726.4 2.1* 23.5*726.6 4.6** 31.9*750.0882.7_____________________________________________________________________________________________________________________________________* RCM = Resident California Mussel * = Equals or exceeds EDL 85. ## = Equals or exceeds FDA Action Level. RBM = Resident Bay Mussel ** = Equals or exceeds EDL 95. TCM = Transplanted California Mussel

E-5
Appendix EState Mussel Watch Program
Summary of 1995-97 Data: Organic Chemicals Exceeding Selected Criteria (ppb, wet weight)_____________________________________________________________________________________________________________________________________ Aldrin Total Chlor- Dacthal DiazinonStation Station Sample Sample Chlor- pyrifosNumber Name Type* Date dane_____________________________________________________________________________________________________________________________________883.1 San Diego Bay/Chollas Creek TCM 01/18/96883.3 San Diego Bay/Chollas Creek/End TCM 01/28/97 1.1*883.6 San Diego Bay/7th Street Channel TCM 01/18/96883.8 San Diego Bay/Switzer Creek TCM 01/18/96885.1 San Diego Bay/Paleta Creek/End TCM 01/28/97885.3 San Diego Bay/7th Street Ch/Mid TCM 01/28/97886.0 San Diego Bay/NASSCO TCM 01/18/96888.0 San Diego Bay/Coronado Bridge RBM 01/28/97893.0 San Diego Bay/Laurel Street TCM 01/18/96894.0 SD Bay/Harbor Is/E Basin/Storm Dr TCM 01/28/97_____________________________________________________________________________________________________________________________________ Total Dieldrin Total Endrin beta- delta- Gamma- HeptachlorStation DDT Endo- HCH HCH HCHNumber sulfan_____________________________________________________________________________________________________________________________________883.1 1.0**883.3883.6 0.9**883.8 0.4**885.1885.3886.0 0.5**888.0893.0894.0_____________________________________________________________________________________________________________________________________ Hepta- Hexa- Methoxy- Ethyl- Oxadiazon Total ToxapheneStation chlor- chloro- chlor para- PCBNumber epoxide benzene thion_____________________________________________________________________________________________________________________________________883.1883.3 0.2*883.6883.8885.1 3.8**885.3 2.6*886.0888.0 0.6*893.0 1.4*894.0 0.2** 2.7* 6741.6##_____________________________________________________________________________________________________________________________________* RCM = Resident California Mussel * = Equals or exceeds EDL 85. ## = Equals or exceeds FDA Action Level. RBM = Resident Bay Mussel ** = Equals or exceeds EDL 95. TCM = Transplanted California Mussel
F-1
APPENDIX F
Summary of 1995-97 Data
Organic Chemicals Exceeding
Maximum Tissue Residue levels (MTRLs) in
Ocean Waters
(ppb, wet weight)

F-2
APPENDIX FState Mussel Watch Program
Summary of 1995-97 Data: Organic Chemicals Exceeding Maximum Tissue Residue Levels (MTRLs)In Ocean Waters(ppb, wet weight)
_______________________________________________________________________________________________________________________________Station Station Sample Sample Total Total Dieldrin Total TotalNumber Name Type* Date Chlor- DDT PCB PAH dane_______________________________________________________________________________________________________________________________ 2.0 Crescent City/STP Outfall RCM 04/09/97 1.9 0.3 1.5 3.0 Crescent City/Control RCM 04/10/97 0.4 0.4 15.6202.0 Bodega Head RCM 09/11/95 0.4 2.1202.0 Bodega Head RCM 08/29/96 0.6 4.8280.0 Russian River/S Goat Rock RCM 03/21/97 1.0 0.9 20.8400.6 Santa Cruz/Natural Bridges RCM 06/09/97 2.3 13.6 2.5 3.5 17.2414.0 Pacific Grove RCM 03/07/96 1.5 1.6 2.7414.0 Pacific Grove RCM 04/25/97 0.5 1.0 8.5 1.3648.0 Malibu RBM 01/17/96 7.4 41.7 13.0648.0 Malibu RCM 11/25/96 2.7 16.1 0.4 8.7650.0 Santa Monica RBM 01/17/96 9.1 57.8 0.4 22.2650.0 Santa Monica RCM 11/25/96 4.6 15.0 0.8 13.1 38.9662.0 Royal Palms RCM 01/18/96 2.6 121.7 0.5 17.2662.0 Royal Palms RCM 11/25/96 1.0 72.7 0.4 26.7664.0 Cabrillo Beach RCM 01/18/96 1.5 72.1 0.3 11.2750.0 Oceanside RCM 01/18/96 5.1 43.0 0.9 4.5750.0 Oceanside RCM 09/30/96 1.0 0.4 8.2_______________________________________________________________________________________________________________________________ * RCM = Resident California Mussel RBM = Resident Bay Mussel

G-1
APPENDIX G
Summary of 1995-97 Data
Organic Chemicals Exceeding
Maximum Tissue Residue levels (MTRLs) in
Enclosed Bays and Estuaries
(ppb, wet weight)

G-2
APPENDIX GState Mussel Watch Program
Summary of 1995-97 Data: Organic Chemicals Exceeding Maximum Tissue Residue Levels (MTRLs) inEnclosed Bays and Estuaries
(ppb, wet weight)_________________________________________________________________________________________________________________________________________________________Station Station Sample Sample Aldrin Total p,p' p,p' Dieldrin Total Toxa-Number Name Type* Date Chlor- DDT DDE PCB phene dane_________________________________________________________________________________________________________________________________________________________ 2.2 Crescent City Harbor/Inner Jetty RCM 04/09/97 5.8101.4 Arcata Bay/Jolly Giant Slough PAC 04/18/96 0.8102.6 Humboldt Bay/J Street RBM 04/17/96 9.0102.6 Humboldt Bay/J Street TCM 04/10/97 0.8102.7 Humboldt Bay/H Street GLY 04/17/96 84.8102.7 Humboldt Bay/H Street PAC 04/17/96 63.3102.7 Humboldt Bay/H Street RBM-s 04/17/96 73.0103.5 Humboldt Bay/Clark Slough TCM 04/10/97 5.5205.0 Bodega Harbor/Spud Point Marina TCM 03/21/97 10.7205.1 Bodega Bay/Porto Bodega RBM 03/21/97 13.4205.3 Bodega Bay/Mason's Marina TCM 03/21/97 5.4307.0 San Francisco Bay/Treasure Is TCM-a 01/26/81 11.0 4.3 96.7 15.3307.0 San Francisco Bay/Treasure Is TCM-a 02/02/82 9.3 5.9 84.5 25.7308.0 San Francisco Bay/Hunter's Point TCM-a 01/26/81 10.7 7.3 71.4 17.8309.0 San Mateo Bridge/8B TCM-a 02/09/81 11.5 8.3 60.9 14.9313.0 San Francisco Bay/near Redwood Cr TCM-a 01/26/81 16.0 10.9 63.9 17.6321.0 Dumbarton Bridge/Channel Marker 14 TCM-a 02/09/81 0.9 18.9 10.4 105.5 19.0400.7 Santa Cruz Harbor/Inner TCM 03/25/96 9.9 2.6 5.3401.0 Santa Cruz Harbor TCM 03/25/96 1.3 12.0403.0 Elkhorn Slough/Highway 1 Bridge TCM 03/12/97 40.7 7.0 16.1 42.0404.0 Sandholdt Bridge TCM 02/16/96 15.1 105.1 259.9 32.1 34.2 232.1404.0 Sandholdt Bridge TCM 03/04/97 15.2 91.1 235.5 27.6 32.2 228.5601.0 LA Harbor/National Steel TCM 01/18/96 33.0 67.5601.0 LA Harbor/National Steel TCM 01/28/97 0.8 144.0 12.8605.0 LA Harbor/Cabrillo Pier TCM 01/18/96 94.2 0.7 54.3616.0 LA Harbor/Consolidated Slip TCM 01/18/96 77.4616.0 LA Harbor/Consolidated Slip TCM 01/28/97 8.7 34.0 1.0 56.7 42.8618.0 LA Harbor/Angels Gate RCM 01/18/96 133.6 96.6664.0 Cabrillo Beach RCM 01/18/96 52.9 11.2708.0 Anaheim Bay/Navy Marsh TCM 01/27/97 9.0 49.7 1.4 35.8713.0 Huntington Harbour/Edinger Street TCM 01/17/96 16.2 33.8 1.5 25.2713.0 Huntington Harbour/Edinger Street TCM 01/27/97 8.5 1.3 12.9715.0 Huntington Harbour/Warner Ave Brdg TCM 01/17/96 13.8 1.0 22.1715.0 Huntington Harbour/Warner Ave Brdg TCM 01/27/97 9.7 1.4 32.3 16.0723.4 Newport Bay/Turning Basin TCM 01/17/96 0.8 19.0724.0 Newport Bay/Highway 1 Bridge TCM 01/17/96 9.3 57.6 1.2 18.5_________________________________________________________________________________________________________________________________________________________ * RCM = Resident California Mussel PAC = Shore Crab (pachygrapsus crassipes) TCM = Transplanted California Mussel (a = archive) GYL = Sand Worm (Glycera spp.) RBM = Resident Bay Mussel (s = small size)

G-3
APPENDIX GState Mussel Watch Program
Summary of 1995-97 Data: Organic Chemicals Exceeding Maximum Tissue Residue Levels (MTRLs) inEnclosed Bays and Estuaries
(ppb, wet weight)_________________________________________________________________________________________________________________________________________________________Station Station Sample Sample Aldrin Total p,p' p,p' Dieldrin Total Toxa-Number Name Type* Date Chlor- DDT DDE PCB phene dane_________________________________________________________________________________________________________________________________________________________725.0 Newport Bay/Crows Nest TCM 01/17/96 10.1 94.6 52.9 1.3 148.5725.0 Newport Bay/Crows Nest TCM 01/27/97 47.2 2.1 131.7 23.3726.4 Newport Bay/Rhine Channel/End TCM 01/17/96 0.9 102.0726.4 Newport Bay/Rhine Channel/End TCM 01/27/97 1.5 57.4 23.5726.6 Newport Bay/Mariners Drive TCM 01/27/97 1.8 10.4 31.9740.0 Dana Point Harbor/Boat Yard TCM 01/27/97 7.6882.7 San Diego Bay/Sampson Street Pier TCM 01/18/96 90.9883.1 San Diego Bay/Chollas Creek TCM 01/18/96 38.7883.1 San Diego Bay/Chollas Creek TCM 01/28/97 0.8 31.3883.2 San Diego Bay/Chollas Creek/Mouth TCM 01/28/97 74.3883.3 San Diego Bay/Chollas Creek/End TCM 01/28/97 14.5 1.5 65.7883.5 San Diego Bay/Tuna Docks TCM 01/28/97 74.1883.6 San Diego Bay/7th Street Channel TCM 01/18/96 92.5883.6 San Diego Bay/7th Street Channel TCM 01/28/97 54.9883.8 San Diego Bay/Switzer Creek TCM 01/18/96 32.5883.8 San Diego Bay/Switzer Creek TCM 01/28/97 36.2885.1 San Diego Bay/Paleta Creek/End TCM 01/28/97 10.4 0.9 119.3885.3 San Diego Bay/7th Street Ch/Mid TCM 01/28/97 8.6 0.9 102.9886.0 San Diego Bay/NASSCO TCM 01/18/96 59.5888.0 San Diego Bay/Coronado Bridge RBM 01/28/97 48.7893.0 San Diego Bay/Laurel Street TCM 01/18/96 111.1893.5 San Diego Bay/B Street Pier TCM 01/18/96 60.8894.0 SD Bay/Harbor Is/E Basin/Storm Dr TCM 01/28/97 9.3 0.7 6741.6_________________________________________________________________________________________________________________________________________________________ * RCM = Resident California Mussel PAC = Shore Crab (pachygrapsus crassipes) TCM = Transplanted California Mussel (a = archive) GYL = Sand Worm (Glycera spp.) RBM = Resident Bay Mussel (s = small size)

H-1
APPENDIX H
Summary of 1995-97 Data
Trace Elements Exceeding the
Median International Standards (MIS)
(ppm, wet weight)

H-2
APPENDIX HState Mussel Watch Program
Summary of 1995-97 Data: Trace Elements Excdeeding the Median International Standards (MIS)(ppm, wet weight)
______________________________________________________________________________________________________________________________________________Station Station Sample Sample Arsenic Cadmium Chromium Copper Mercury Lead Selenium ZincNumber Name Type* Date (1.4) (1.0) (1.0) (20.0) (0.5) (2.0) (0.3) (70.0)______________________________________________________________________________________________________________________________________________ 1.0 Crescent City Harbor RCM 04/09/97 1.1 2.0 Crescent City/STP Outfall RCM 04/09/97 2.3 2.2 Crescent City Harbor/Inner Jetty RCM 04/09/97 1.2 3.0 Crescent City/Control RCM 04/10/97 1.5100.0 Mad River Slough OYS 04/10/97 30.0 99.0101.8 Humboldt Bay/Halberson Shoreline RBM-s 04/17/96 2.0102.6 Humboldt Bay/J Street RBM 04/17/96 4.9102.6 Humboldt Bay/J Street RBM-s 04/17/96 1.7 4.1 0.31102.6 Humboldt Bay/J Street TCM 04/10/97 1.3102.7 Humboldt Bay/H Street RBM-s 04/17/96 2.8 1.8 18.1 0.32 77.0103.3 Humboldt Bay/E Street TCM 04/10/97 2.3103.5 Humboldt Bay/Clark Slough TCM 04/10/97 1.2202.0 Bodega Head RCM 09/11/95 1.6 1.5202.0 Bodega Head RCM 08/29/96 1.6 1.4 0.38203.0 Tomales Bay RBM 04/14/97 1.6203.0 Tomales Bay TCM 04/14/97 1.1203.7 Tomales Bay/Walker Creek Mouth 3 TCM 04/14/97 1.0205.0 Bodega Harbor/Spud Point Marina TCM 03/21/97 1.6205.3 Bodega Bay/Mason's Marina TCM 03/21/97 1.1205.5 Bodega Bay/Back Marsh RBM 03/21/97 1.1210.1 Walker Creek/Mine Creek TFC 01/17/97 0.79280.0 Russian River/S Goat Rock RCM 03/21/97 1.5 1.9400.7 Santa Cruz Harbor/Inner TCM 03/25/96 1.8 12.0 71.0401.0 Santa Cruz Harbor TCM 03/25/96 1.2 2.2403.0 Elkhorn Slough/Highway 1 Bridge TCM 03/12/97 1.7 1.5404.0 Sandholdt Bridge TCM 02/16/96 1.4404.0 Sandholdt Bridge TCM 03/04/97 1.1 1.2414.0 Pacific Grove RCM 03/07/96 1.2414.0 Pacific Grove RCM 04/25/97 1.5420.3 Monterey Harbor/C G Jetty/Inner TCM 02/13/96 6.9420.4 Monterey Harbor/C G Jetty/Inner 2 TCM 02/13/96 2.0421.0 Monterey Harbor/Slag Pile TCM 02/13/96 10.0601.0 LA Harbor/National Steel TCM 01/18/96 1.4 1.7616.0 LA Harbor/Consolidated Slip TCM 01/18/96 1.5 2.7648.0 Malibu RBM 01/17/96 1.6662.0 Royal Palms RCM 01/18/96 2.1664.0 Cabrillo Beach RCM 01/18/96 2.0______________________________________________________________________________________________________________________________________________ * RCM = Resident California Mussel TFC = Transplanted Fresh Water Clam ( ) Median International Standard in Parentheses. TCM = Transplanted California Mussel OYS = Oyster (Crassostrea gigas) RBM = Resident Bay Mussel (s = small size)

H-3
APPENDIX HState Mussel Watch Program
Summary of 1995-97 Data: Trace Elements Excdeeding the Median International Standards (MIS)(ppm, wet weight)
______________________________________________________________________________________________________________________________________________Station Station Sample Sample Arsenic Cadmium Chromium Copper Mercury Lead Selenium ZincNumber Name Type* Date (1.4) (1.0) (1.0) (20.0) (0.5) (2.0) (0.3) (70.0)______________________________________________________________________________________________________________________________________________708.0 Anaheim Bay/Navy Marsh TCM 01/27/97 1.5 1.7713.0 Huntington Harbour/Edinger Street TCM 01/17/96 1.4715.0 Huntington Harbour/Warner Ave Brdg TCM 01/17/96 1.4 1.8 1.0 76.0723.4 Newport Bay/Turning Basin TCM 01/17/96 1.5 1.0724.0 Newport Bay/Highway 1 Bridge TCM 01/17/96 1.4 1.3725.0 Newport Bay/Crows Nest TCM 01/17/96 1.4 2.2 84.0726.4 Newport Bay/Rhine Channel/End TCM 01/17/96 1.6 1.6 100.0726.4 Newport Bay/Rhine Channel/End TCM 01/27/97 1.2 2.0 77.0726.6 Newport Bay/Mariners Drive TCM 01/27/97 1.1750.0 Oceanside RCM 09/30/96 0.36882.2 24Th St Maritime Terminal/North TCM 01/18/96 1.4 1.1 85.0882.7 San Diego Bay/Sampson Street Pier TCM 01/18/96 1.2 1.9883.1 San Diego Bay/Chollas Creek TCM 01/28/97 1.1883.3 San Diego Bay/Chollas Creek/End TCM 01/28/97 1.2 1.1883.5 San Diego Bay/Tuna Docks TCM 01/28/97 1.1883.6 San Diego Bay/7th Street Channel TCM 01/18/96 1.2 3.2883.6 San Diego Bay/7th Street Channel TCM 01/28/97 1.1 0.49 73.0883.8 San Diego Bay/Switzer Creek TCM 01/28/97 1.3885.1 San Diego Bay/Paleta Creek/End TCM 01/28/97 2.8 87.0885.3 San Diego Bay/7th Street Ch/Mid TCM 01/28/97 1.2 2.3 76.0886.0 San Diego Bay/NASSCO TCM 01/18/96 1.9 3.1894.0 SD Bay/Harbor Is/E Basin/Storm Dr TCM 01/28/97 1.2 1.7 3.5 0.36______________________________________________________________________________________________________________________________________________ * RCM = Resident California Mussel TFC = Transplanted Fresh Water Clam ( ) Median International Standard in Parentheses. TCM = Transplanted California Mussel RBM = Resident Bay Mussel

I-1
APPENDIX I
Summary of 1995-97 DataTrace Elements Exceeding Elevated Data Levels (EDL)
(ppm, wet weight)

I-2
APPENDIX IState Mussel Watch Program
Summary of 1995-97 Data: Trace Elements Exceeding Elevated Data Levels (EDL)(ppm, wet weight)
Station Station Sample Sample Aluminum Cadmium Copper Manganese Nickel Silver ZincNumber Name Type* Date Arsenic Chromium Lead Mercury Selenium
1.0 Crescent City Harbor RCM 04/09/97 120.0* 1.10** 6.60** 2.70* 58.0** 2.0 Crescent City/STP Outfall RCM 04/09/97 160.0** 2.30** 2.00* 2.50* 0.085* 2.2 Crescent City Harbor/Inner Jetty RCM 04/09/97 120.0* 1.20** 2.30** 2.60* 3.0 Crescent City/Control RCM 04/10/97 110.0* 1.50** 2.00* 2.20*101.8 Humboldt Bay/Halberson Shoreline RBM-s 04/17/96 612.0** 1.98** 8.10** 1.48**102.6 Humboldt Bay/J Street RBM 04/17/96 263.0** 4.94** 3.60**102.6 Humboldt Bay/J Street RBM-s 04/17/96 599.0** 4.11** 8.00** 3.39** 43.0*102.6 Humboldt Bay/J Street TCM 04/10/97 280.0** 1.30*102.7 Humboldt Bay/H Street RBM-s 04/17/96 713.0** 1.84** 3.60* 18.09** 23.70** 1.52** 77.0**103.3 Humboldt Bay/E Street TCM 04/10/97 350.0** 2.30**103.5 Humboldt Bay/Clark Slough TCM 04/10/97 290.0** 1.20* 4.90*202.0 Bodega Head RCM 09/11/95 1.50* 0.60* 4.50** 0.76*203.0 Tomales Bay RBM 04/14/97 310.0** 1.60** 11.00**203.0 Tomales Bay TCM 04/14/97 240.0** 1.10* 30.00**203.3 Tomales Bay/Walker Creek Mouth 1 TCM 04/14/97 210.0* 0.87*203.5 Tomales Bay/Walker Creek Mouth 2 TCM 04/14/97 180.0* 0.82*203.7 Tomales Bay/Walker Creek Mouth 3 TCM 04/14/97 210.0* 1.00*203.9 Tomales Bay/Nicks Cove TCM 04/14/97 0.81*205.0 Bodega Harbor/Spud Point Marina TCM 03/21/97 210.0* 1.60* 0.80*205.1 Bodega Bay/Porto Bodega RBM 03/21/97 5.40** 0.054*205.3 Bodega Bay/Mason's Marina TCM 03/21/97 250.0** 1.10*205.5 Bodega Bay/Back Marsh RBM 03/21/97 310.0** 1.10*210.1 Walker Creek/Mine Creek TFC 01/17/97 0.790**210.3 Walker Creek/mid stream TFC 01/17/97 0.220**211.1 Lagunitas Creek/Bridge 1 TFC 01/17/97 0.087*211.3 Lagunitas Creek/Bridge 2 TFC 01/17/97 0.082*280.0 Russian River/S Goat Rock RCM 03/21/97 280.0** 1.50* 1.90** 1.70* 4.40**329.0 Guadalupe Creek/Almaden Expressway TFC 12/16/96 0.090*329.2 Guadalupe Creek/Hicks Road TFC 12/16/96 0.110**329.4 Alamitos Creek/Almaden Road TFC 12/16/96 0.110**400.6 Santa Cruz/Natural Bridges RCM 06/09/97 150.0** 2.60**400.7 Santa Cruz Harbor/Inner TCM 03/25/96 240.0** 1.80* 12.00** 9.70* 0.063* 71.0*401.0 Santa Cruz Harbor TCM 03/25/96 170.0* 2.20** 7.50*403.0 Elkhorn Slough/Highway 1 Bridge TCM 03/12/97 270.0** 1.70* 1.50* 1.50**404.0 Sandholdt Bridge TCM 02/16/96 220.0* 0.90* 12.00**404.0 Sandholdt Bridge TCM 03/04/97 330.0** 1.20* 1.10**414.0 Pacific Grove RCM 03/07/96 82.0* 0.91*414.0 Pacific Grove RCM 04/25/97 2.30**420.3 Monterey Harbor/C G Jetty/Inner TCM 02/13/96 6.90**
* RCM = Resident California Mussel TFC = Transplanted Freshwater Clam * = Equals or exceeds EDL 85. TCM = Transplanted California Mussel ** = Equals or exceeds EDL 95. RBM = Resident Bay Mussel (s = small size)

I-3
APPENDIX IState Mussel Watch Program
Summary of 1995-97 Data: Trace Elements Exceeding Elevated Data Levels (EDL)(ppm, wet weight)
Station Station Sample Sample Aluminum Cadmium Copper Manganese Nickel Silver ZincNumber Name Type* Date Arsenic Chromium Lead Mercury Selenium
420.4 Monterey Harbor/C G Jetty/Inner 2 TCM 02/13/96 2.00*420.5 Monterey Harbor/C G Jetty/Inner 3 TCM 02/13/96 1.80*421.0 Monterey Harbor/Slag Pile TCM 02/13/96 10.00**601.0 LA Harbor/National Steel TCM 01/18/96 1.70**616.0 LA Harbor/Consolidated Slip TCM 01/18/96 2.70**648.0 Malibu RBM 01/17/96 170.0* 1.60**648.0 Malibu RCM 11/25/96 140.0** 1.60* 2.90**650.0 Santa Monica RBM 01/17/96 190.0* 0.87* 0.081*650.0 Santa Monica RCM 11/25/96 170.0** 0.70* 1.90* 3.10**662.0 Royal Palms RCM 01/18/96 2.10**662.0 Royal Palms RCM 11/25/96 0.99*664.0 Cabrillo Beach RCM 01/18/96 82.0* 2.00** 0.720*708.0 Anaheim Bay/Navy Marsh TCM 01/27/97 300.0** 1.70** 1.40**713.0 Huntington Harbour/Edinger Street TCM 01/17/96 0.89* 1.10**713.0 Huntington Harbour/Edinger Street TCM 01/27/97 170.0*715.0 Huntington Harbour/Warner Ave Brdg TCM 01/17/96 1.80* 1.00* 1.30** 76.0*715.0 Huntington Harbour/Warner Ave Brdg TCM 01/27/97 180.0* 5.30* 62.0*723.4 Newport Bay/Turning Basin TCM 01/17/96 1.00* 1.00*724.0 Newport Bay/Highway 1 Bridge TCM 01/17/96 180.0* 0.95* 0.120** 0.92*725.0 Newport Bay/Crows Nest TCM 01/17/96 2.20** 13.00** 0.076* 2.20** 84.0**725.0 Newport Bay/Crows Nest TCM 01/27/97 9.70* 64.0*726.4 Newport Bay/Rhine Channel/End TCM 01/17/96 1.60* 1.60* 15.00** 7.30** 0.078* 1.80** 100.0**726.4 Newport Bay/Rhine Channel/End TCM 01/27/97 2.00** 15.00** 6.00* 0.057 1.80** 77.0*726.6 Newport Bay/Mariners Drive TCM 01/27/97 0.73* 0.86*740.0 Dana Point Harbor/Boat Yard TCM 01/27/97 220.0* 0.87* 8.90*750.0 Oceanside RCM 09/30/96 260.0** 0.89* 2.30** 3.30** 0.65*882.2 24Th St Maritime Terminal/North TCM 01/18/96 220.0* 1.10* 9.10* 8.80** 85.0**882.7 San Diego Bay/Sampson Street Pier TCM 01/18/96 1.90** 7.60* 60.0*883.1 San Diego Bay/Chollas Creek TCM 01/28/97 0.91*883.2 San Diego Bay/Chollas Creek/Mouth TCM 01/28/97 160.0* 0.82* 5.80* 6.80** 58.0*883.3 San Diego Bay/Chollas Creek/End TCM 01/28/97 1.10* 0.86* 68.0*883.5 San Diego Bay/Tuna Docks TCM 01/28/97 1.10* 61.0*883.6 San Diego Bay/7th Street Channel TCM 01/18/96 280.0** 3.20** 6.90* 67.0*883.6 San Diego Bay/7th Street Channel TCM 01/28/97 180.0* 1.10* 7.90* 5.60* 73.0*883.8 San Diego Bay/Switzer Creek TCM 01/28/97 1.30*885.1 San Diego Bay/Paleta Creek/End TCM 01/28/97 170.0* 2.80** 4.70* 87.0**885.3 San Diego Bay/7th Street Ch/Mid TCM 01/28/97 220.0* 1.20* 7.10* 2.30* 7.00** 76.0*886.0 San Diego Bay/NASSCO TCM 01/18/96 1.90* 3.10** 7.10* 66.0*888.0 San Diego Bay/Coronado Bridge RBM 01/28/97 2.30* 5.20*894.0 SD Bay/Harbor Is/E Basin/Storm Dr TCM 01/28/97 140.0* 1.70** 5.50* 3.50** 61.0*
* RCM = Resident California Mussel * = Equals or exceeds EDL 85. TCM = Transplanted California Mussel ** = Equals or exceeds EDL 95. RBM = Resident Bay Mussel

J-1
APPENDIX J
Summary of 1995-97 Data
Trace Elements in Mussel, Clam, Oyster, Shore Crab,
and Sand Worm
(ppm, wet weight)

J-2
APPENDIX JState Mussel Watch Program
Summary of 1995-97 Data: Trace Elements in Mussel, Clam, Oyster, Shore Crab, and Sand Worm(ppm, wet weight)
____________________________________________________________________________________________________________________________________________________________Station Station Sample Sample Aluminum Cadmium Copper Manganese Nickel SilverNumber Name Type* Date Arsenic Chromium Lead Mercury Selenium Zinc____________________________________________________________________________________________________________________________________________________________ 1.0 Crescent City Harbor RCM 04/09/97 120.0 NA 0.33 1.10 6.60 0.16 2.70 0.045 NA NA 0.014 58.0 2.0 Crescent City/STP Outfall RCM 04/09/97 160.0 NA 0.60 2.30 2.00 0.28 2.50 0.085 NA NA 0.350 25.0 2.2 Crescent City Harbor/Inner Jetty RCM 04/09/97 120.0 NA 0.37 1.20 2.30 0.18 2.60 0.029 NA NA 0.013 30.0 3.0 Crescent City/Control RCM 04/10/97 110.0 NA 0.87 1.50 2.00 0.10 2.20 0.039 NA NA 0.004 27.0100.0 Mad River Slough OYS 04/10/97 340.0 NA 0.55 0.84 30.00 0.06 12.00 0.041 NA NA 0.180 99.0101.4 Arcata Bay/Jolly Giant Slough PAC 04/18/96 508.0 ND 0.03 2.38 21.60 0.43 51.20 0.057 1.61 ND 0.192 32.0101.8 Humboldt Bay/Halberson Shoreline GLY 04/17/96 147.0 2.0 0.05 0.61 1.10 0.11 51.40 0.003 0.64 0.11 0.023 13.0101.8 Humboldt Bay/Halberson Shoreline PAC 04/17/96 714.0 ND 0.03 2.44 17.10 2.96 48.20 0.019 2.27 ND 0.073 30.0101.8 Humboldt Bay/Halberson Shoreline RBM-s 04/17/96 612.0 1.2 0.33 1.98 1.50 0.35 8.10 0.031 1.48 0.19 0.017 37.0102.6 Humboldt Bay/J Street GLY 04/17/96 423.0 0.1 0.06 2.81 1.90 0.64 7.50 0.018 2.25 0.12 0.019 23.0102.6 Humboldt Bay/J Street PAC 04/17/96 361.0 0.7 0.06 1.81 24.10 0.47 24.00 0.051 1.23 ND 0.089 31.0102.6 Humboldt Bay/J Street RBM 04/17/96 263.0 1.3 0.72 4.94 0.70 0.19 3.80 0.027 3.60 0.22 0.004 35.0102.6 Humboldt Bay/J Street RBM-s 04/17/96 599.0 1.7 0.33 4.11 1.00 0.44 8.00 0.047 3.39 0.31 0.013 43.0102.6 Humboldt Bay/J Street TCM 04/10/97 280.0 NA 0.75 1.30 2.60 0.27 4.10 0.034 NA NA 0.005 18.0102.7 Humboldt Bay/H Street GLY 04/17/96 54.0 10.1 0.30 2.32 13.40 1.86 3.40 0.018 1.95 0.05 0.165 58.0102.7 Humboldt Bay/H Street PAC 04/17/96 457.0 0.5 0.16 2.55 38.30 11.73 46.40 0.037 1.63 ND 0.048 57.0102.7 Humboldt Bay/H Street RBM-s 04/17/96 713.0 2.8 0.25 1.84 3.60 18.09 23.70 0.022 1.52 0.32 0.027 77.0103.3 Humboldt Bay/E Street TCM 04/10/97 350.0 NA 0.75 2.30 2.30 0.25 4.60 0.034 NA NA 0.003 25.0103.5 Humboldt Bay/Clark Slough TCM 04/10/97 290.0 NA 0.68 1.20 2.60 0.23 4.90 0.028 NA NA 0.014 24.0202.0 Bodega Head RCM 09/11/95 26.0 1.6 1.50 0.60 4.50 0.15 1.10 0.021 0.76 0.26 0.009 24.0202.0 Bodega Head RCM 08/29/96 28.0 1.6 1.40 0.40 0.94 0.14 1.00 0.025 0.39 0.38 0.005 22.0203.0 Tomales Bay RBM 04/14/97 310.0 NA 0.68 1.60 2.00 0.07 11.00 0.040 NA NA 0.010 18.0203.0 Tomales Bay TCM 04/14/97 240.0 NA 0.60 1.10 1.40 0.20 30.00 0.036 NA NA 0.015 29.0203.1 Tomales Bay/Vincent Landing TCM 04/14/97 48.0 NA 0.72 0.67 1.70 0.16 1.60 0.033 NA NA 0.011 31.0203.3 Tomales Bay/Walker Creek Mouth 1 TCM 04/14/97 210.0 NA 0.75 0.87 1.70 0.22 3.60 0.047 NA NA 0.028 33.0203.5 Tomales Bay/Walker Creek Mouth 2 TCM 04/14/97 180.0 NA 0.73 0.82 1.70 0.22 3.40 0.044 NA NA 0.011 34.0203.7 Tomales Bay/Walker Creek Mouth 3 TCM 04/14/97 210.0 NA 0.70 1.00 1.70 0.24 4.60 0.055 NA NA 0.016 29.0203.9 Tomales Bay/Nicks Cove TCM 04/14/97 93.0 NA 0.80 0.81 2.00 0.22 2.00 0.036 NA NA 0.011 31.0205.0 Bodega Harbor/Spud Point Marina TCM 03/21/97 210.0 NA 1.60 0.80 2.80 0.53 2.10 0.054 NA NA ND 50.0205.1 Bodega Bay/Porto Bodega RBM 03/21/97 150.0 NA 0.77 0.72 5.40 0.10 2.00 0.054 NA NA 0.003 40.0205.3 Bodega Bay/Mason's Marina TCM 03/21/97 250.0 NA 0.89 1.10 2.50 0.37 2.50 0.048 NA NA 0.004 38.0205.5 Bodega Bay/Back Marsh RBM 03/21/97 310.0 NA 0.75 1.10 2.00 0.14 2.70 0.049 NA NA 0.004 33.0210.1 Walker Creek/Mine Creek TFC 01/17/97 NA NA NA NA NA NA NA 0.790 NA NA NA NA 210.3 Walker Creek/mid stream TFC 01/17/97 NA NA NA NA NA NA NA 0.220 NA NA NA NA 211.1 Lagunitas Creek/Bridge 1 TFC 01/17/97 NA NA NA NA NA NA NA 0.087 NA NA NA NA 211.3 Lagunitas Creek/Bridge 2 TFC 01/17/97 NA NA NA NA NA NA NA 0.082 NA NA NA NA 280.0 Russian River/S Goat Rock RCM 03/21/97 280.0 NA 1.50 1.90 1.70 0.15 4.40 0.039 NA NA 0.015 32.0329.0 Guadalupe Creek/Almaden Expressway TFC 12/16/96 NA NA NA NA NA NA NA 0.090 NA NA NA NA 329.2 Guadalupe Creek/Hicks Road TFC 12/16/96 NA NA NA NA NA NA NA 0.110 NA NA NA NA 329.4 Alamitos Creek/Almaden Road TFC 12/16/96 NA NA NA NA NA NA NA 0.110 NA NA NA NA ____________________________________________________________________________________________________________________________________________________________* RCM = Resident California Mussel TFC = Transplanted Freshwater Clam GYL = Sand Worm (Glycera spp.) TCM = Transplanted California Mussel OYS = Oyster (Crassostrea gigas) NA = Not Analyzed RBM = Resident Bay Mussel (s = small size) PAC = Shore Crab (Pachygrapsus crassipes) ND = Not Detected

J-3
APPENDIX JState Mussel Watch Program
Summary of 1995-97 Data: Trace Elements in Mussel, Clam, Oyster, Shore Crab, and Sand Worm(ppm, wet weight)
____________________________________________________________________________________________________________________________________________________________Station Station Sample Sample Aluminum Cadmium Copper Manganese Nickel SilverNumber Name Type* Date Arsenic Chromium Lead Mercury Selenium Zinc____________________________________________________________________________________________________________________________________________________________400.6 Santa Cruz/Natural Bridges RCM 06/09/97 150.0 NA 0.77 0.53 2.60 0.13 1.80 0.015 NA NA 0.021 27.0400.7 Santa Cruz Harbor/Inner TCM 03/25/96 240.0 NA 1.80 12.00 9.70 0.62 3.30 0.063 NA NA 0.012 71.0401.0 Santa Cruz Harbor TCM 03/25/96 170.0 NA 1.20 2.20 7.50 0.51 1.90 0.055 NA NA 0.010 54.0403.0 Elkhorn Slough/Highway 1 Bridge TCM 03/12/97 270.0 NA 1.70 1.50 2.60 0.33 2.70 0.046 1.50 NA 0.009 34.0404.0 Sandholdt Bridge TCM 02/16/96 220.0 NA 1.40 0.90 1.60 0.33 12.00 0.050 NA NA 0.002 43.0404.0 Sandholdt Bridge TCM 03/04/97 330.0 0.8 1.10 1.20 2.30 0.42 3.60 0.046 1.10 0.29 0.005 34.0414.0 Pacific Grove RCM 03/07/96 82.0 NA 1.20 0.91 1.00 0.24 1.40 0.038 NA NA 0.026 32.0414.0 Pacific Grove RCM 04/25/97 28.0 1.5 0.98 0.36 2.30 0.25 0.85 0.018 0.55 0.08 0.011 29.0420.3 Monterey Harbor/C G Jetty/Inner TCM 02/13/96 NA NA NA NA NA 6.90 NA NA NA NA NA NA 420.4 Monterey Harbor/C G Jetty/Inner 2 TCM 02/13/96 NA NA NA NA NA 2.00 NA NA NA NA NA NA 420.5 Monterey Harbor/C G Jetty/Inner 3 TCM 02/13/96 NA NA NA NA NA 1.80 NA NA NA NA NA NA 421.0 Monterey Harbor/Slag Pile TCM 02/13/96 NA NA NA NA NA 10.00 NA NA NA NA NA NA 601.0 LA Harbor/National Steel TCM 01/18/96 120.0 NA 1.40 1.70 3.30 0.91 3.30 0.037 NA NA 0.012 46.0601.0 LA Harbor/National Steel TCM 01/28/97 120.0 1.2 0.75 0.39 2.70 0.97 3.10 0.029 NA NA 0.008 51.0616.0 LA Harbor/Consolidated Slip TCM 01/18/96 75.0 NA 1.50 2.70 3.70 1.10 3.10 0.032 NA NA 0.016 44.0616.0 LA Harbor/Consolidated Slip TCM 01/28/97 90.0 1.1 0.80 0.60 2.10 1.00 2.60 0.023 NA NA 0.007 43.0648.0 Malibu RBM 01/17/96 170.0 NA 0.46 1.60 1.10 0.09 3.60 0.011 NA NA 0.016 17.0648.0 Malibu RCM 11/25/96 140.0 NA 0.33 0.37 1.60 0.11 2.90 0.009 NA NA 0.023 22.0650.0 Santa Monica RBM 01/17/96 190.0 NA 0.17 0.87 1.10 0.22 3.00 0.015 NA NA 0.081 19.0650.0 Santa Monica RCM 11/25/96 170.0 NA 0.09 0.70 1.90 0.55 3.10 0.012 NA NA 0.410 26.0662.0 Royal Palms RCM 01/18/96 63.0 NA 0.56 2.10 1.30 0.29 1.90 0.024 NA NA 0.310 29.0662.0 Royal Palms RCM 11/25/96 58.0 NA 0.34 0.99 1.20 0.31 1.90 0.025 NA NA 0.270 29.0664.0 Cabrillo Beach RCM 01/18/96 82.0 NA 0.51 2.00 1.40 0.30 2.10 0.026 NA NA 0.720 27.0708.0 Anaheim Bay/Navy Marsh TCM 01/27/97 300.0 1.5 0.69 1.70 1.90 0.82 4.50 0.018 1.40 0.28 0.008 37.0713.0 Huntington Harbour/Edinger Street TCM 01/17/96 110.0 1.1 1.40 0.89 1.40 0.52 2.50 0.031 1.10 0.24 0.009 41.0713.0 Huntington Harbour/Edinger Street TCM 01/27/97 170.0 1.3 0.93 0.55 2.10 0.89 3.90 0.036 0.57 0.25 0.007 49.0715.0 Huntington Harbour/Warner Ave Brdg TCM 01/17/96 100.0 1.4 1.80 1.00 2.60 1.30 4.10 0.036 1.30 0.27 0.010 76.0715.0 Huntington Harbour/Warner Ave Brdg TCM 01/27/97 180.0 1.3 0.74 0.65 2.90 1.50 5.30 0.025 0.63 0.29 0.008 62.0723.4 Newport Bay/Turning Basin TCM 01/17/96 81.0 1.2 1.50 1.00 3.00 0.58 2.80 0.038 1.00 0.20 0.006 50.0724.0 Newport Bay/Highway 1 Bridge TCM 01/17/96 180.0 1.4 1.30 0.95 2.60 0.44 3.00 0.120 0.92 0.29 0.006 53.0725.0 Newport Bay/Crows Nest TCM 01/17/96 86.0 1.2 1.40 2.20 13.00 0.97 3.80 0.076 2.20 0.20 0.008 84.0725.0 Newport Bay/Crows Nest TCM 01/27/97 110.0 1.2 0.82 0.31 9.70 0.63 3.30 0.051 0.25 0.27 0.003 64.0726.4 Newport Bay/Rhine Channel/End TCM 01/17/96 52.0 1.3 1.60 1.60 15.00 0.81 7.30 0.078 1.80 0.24 0.007 100.0726.4 Newport Bay/Rhine Channel/End TCM 01/27/97 81.0 1.3 1.20 2.00 15.00 0.73 6.00 0.057 1.80 0.19 ND 77.0726.6 Newport Bay/Mariners Drive TCM 01/27/97 89.0 1.1 1.10 0.73 0.79 0.29 3.30 0.024 0.86 0.22 0.001 35.0740.0 Dana Point Harbor/Boat Yard TCM 01/27/97 220.0 1.3 0.76 0.87 8.90 0.44 1.90 0.030 0.75 ND ND 51.0750.0 Oceanside RCM 09/30/96 260.0 0.9 0.23 0.89 2.30 0.12 3.30 0.009 0.65 0.36 0.009 22.0882.2 24Th St Maritime Terminal/North TCM 01/18/96 220.0 NA 1.40 1.10 9.10 0.69 8.80 0.047 NA NA 0.052 85.0882.7 San Diego Bay/Sampson Street Pier TCM 01/18/96 89.0 NA 1.20 1.90 7.60 0.58 2.40 0.048 NA NA 0.036 60.0883.1 San Diego Bay/Chollas Creek TCM 01/28/97 130.0 1.2 1.10 0.91 3.60 1.20 2.50 0.035 0.71 0.22 0.017 54.0____________________________________________________________________________________________________________________________________________________________* RCM = Resident California Mussel TFC = Transplanted Freshwater Clam GYL = Sand Worm (Glycera spp.) TCM = Transplanted California Mussel OYS = Oyster (Crassostrea gigas) NA = Not Analyzed RBM = Resident Bay Mussel (s = small size) PAC = Shore Crab (Pachygrapsus crassipes) ND = Not Detected

J-4
APPENDIX JState Mussel Watch Program
Summary of 1995-97 Data: Trace Elements in Mussel, Clam, Oyster, Shore Crab, and Sand Worm(ppm, wet weight)
____________________________________________________________________________________________________________________________________________________________Station Station Sample Sample Aluminum Cadmium Copper Manganese Nickel SilverNumber Name Type* Date Arsenic Chromium Lead Mercury Selenium Zinc____________________________________________________________________________________________________________________________________________________________883.2 San Diego Bay/Chollas Creek/Mouth TCM 01/28/97 160.0 1.0 0.73 0.82 5.80 0.81 6.80 0.028 0.74 ND 0.020 58.0883.3 San Diego Bay/Chollas Creek/End TCM 01/28/97 130.0 1.2 1.20 1.10 3.60 1.20 3.60 0.030 0.86 0.24 0.016 68.0883.5 San Diego Bay/Tuna Docks TCM 01/28/97 120.0 1.3 0.85 1.10 4.40 0.91 3.60 0.032 0.67 0.28 0.017 61.0883.6 San Diego Bay/7th Street Channel TCM 01/18/96 280.0 NA 1.20 3.20 6.90 1.10 3.70 0.031 NA NA 0.051 67.0883.6 San Diego Bay/7th Street Channel TCM 01/28/97 180.0 1.2 0.71 1.10 7.90 0.81 5.60 0.028 0.83 0.49 0.022 73.0883.8 San Diego Bay/Switzer Creek TCM 01/28/97 72.0 1.0 0.90 1.30 2.40 0.54 2.10 0.026 0.46 ND 0.009 41.0885.1 San Diego Bay/Paleta Creek/End TCM 01/28/97 170.0 1.1 0.88 0.56 5.20 2.80 4.70 0.024 0.45 0.29 0.022 87.0885.3 San Diego Bay/7th Street Ch/Mid TCM 01/28/97 220.0 1.0 0.82 1.20 7.10 2.30 7.00 0.029 0.79 0.26 0.021 76.0886.0 San Diego Bay/NASSCO TCM 01/18/96 110.0 NA 1.90 3.10 7.10 0.74 3.60 0.031 NA NA 0.026 66.0888.0 San Diego Bay/Coronado Bridge RBM 01/28/97 130.0 0.8 0.69 0.44 2.30 0.52 5.20 0.019 0.31 0.21 0.010 37.0894.0 SD Bay/Harbor Is/E Basin/Storm Dr TCM 01/28/97 140.0 1.2 1.20 1.70 5.50 3.50 2.10 0.024 0.54 0.36 0.051 61.0____________________________________________________________________________________________________________________________________________________________* RCM = Resident California Mussel TFC = Transplanted Freshwater Clam GYL = Sand Worm (Glycera spp.) TCM = Transplanted California Mussel OYS = Oyster (Crassostrea gigas) NA = Not Analyzed RBM = Resident Bay Mussel (s = small size) PAC = Shore Crab (Pachygrapsus crassipes) ND = Not Detected

K-1
APPENDIX K
Summary of 1995-97 Data
Trace Elements in Mussel, Clam, Oyster, Shore Crab,
and Sand Worm
(ppm, dry weight)

K-2
APPENDIX KState Mussel Watch Program
Summary of 1995-97 Data: Trace Elements in Mussel, Clam, Oyster, Shore Crab, and Sand Worm(ppm, dry weight)
____________________________________________________________________________________________________________________________________________________________Station Station Sample Sample Aluminum Cadmium Copper Manganese Nickel SilverNumber Name Type* Date Arsenic Chromium Lead Mercury Selenium Zinc____________________________________________________________________________________________________________________________________________________________ 1.0 Crescent City Harbor RCM 04/09/97 967.0 NA 2.61 9.00 52.7 1.31 21.7 0.357 NA NA 0.110 467.0 2.0 Crescent City/STP Outfall RCM 04/09/97 1170.0 NA 4.50 17.40 14.9 2.13 18.8 0.636 NA NA 2.650 185.0 2.2 Crescent City Harbor/Inner Jetty RCM 04/09/97 736.0 NA 2.21 7.09 13.7 1.06 15.9 0.173 NA NA 0.078 178.0 3.0 Crescent City/Control RCM 04/10/97 748.0 NA 5.72 9.73 13.1 0.63 14.7 0.258 NA NA 0.024 175.0100.0 Mad River Slough OYS 04/10/97 2260.0 NA 3.67 5.60 198.0 0.42 81.6 0.271 NA NA 1.230 658.0101.4 Arcata Bay/Jolly Giant Slough PAC 04/18/96 1540.0 ND 0.09 7.20 65.4 1.30 155.0 0.174 4.9 ND 0.582 96.0101.8 Humboldt Bay/Halberson Shoreline GLY 04/17/96 1280.0 17.3 0.41 5.30 9.5 0.92 447.0 0.023 5.5 0.9 0.198 114.0101.8 Humboldt Bay/Halberson Shoreline PAC 04/17/96 2340.0 ND 0.11 8.00 56.2 9.72 158.0 0.063 7.4 ND 0.238 99.0101.8 Humboldt Bay/Halberson Shoreline RBM-s 04/17/96 5280.0 10.2 2.87 17.10 13.3 3.05 69.8 0.270 12.8 1.7 0.148 321.0102.6 Humboldt Bay/J Street GLY 04/17/96 3180.0 1.1 0.47 21.10 14.5 4.84 56.6 0.138 16.9 0.9 0.141 171.0102.6 Humboldt Bay/J Street PAC 04/17/96 1020.0 2.0 0.18 5.10 68.1 1.33 67.8 0.144 3.5 ND 0.252 88.0102.6 Humboldt Bay/J Street RBM 04/17/96 2800.0 14.3 7.65 52.60 7.6 1.98 40.7 0.288 38.3 2.3 0.043 374.0102.6 Humboldt Bay/J Street RBM-s 04/17/96 4870.0 13.8 2.67 33.40 8.4 3.60 65.0 0.386 27.6 2.5 0.107 348.0102.6 Humboldt Bay/J Street TCM 04/10/97 1570.0 NA 4.29 7.31 14.7 1.54 23.2 0.195 NA NA 0.031 102.0102.7 Humboldt Bay/H Street GLY 04/17/96 296.0 55.9 1.64 12.80 74.2 10.30 18.8 0.099 10.8 0.3 0.914 321.0102.7 Humboldt Bay/H Street PAC 04/17/96 1360.0 1.6 0.49 7.60 114.0 34.90 138.0 0.109 4.8 ND 0.143 170.0102.7 Humboldt Bay/H Street RBM-s 04/17/96 5990.0 23.7 2.14 15.50 30.2 152.00 199.0 0.188 12.8 2.7 0.225 651.0103.3 Humboldt Bay/E Street TCM 04/10/97 1940.0 NA 4.20 13.00 12.7 1.41 25.6 0.187 NA NA 0.018 142.0103.5 Humboldt Bay/Clark Slough TCM 04/10/97 1770.0 NA 4.19 7.37 15.9 1.38 29.9 0.172 NA NA 0.085 144.0202.0 Bodega Head RCM 09/11/95 150.0 9.4 8.70 3.50 26.0 0.90 6.6 0.120 4.4 1.5 0.054 140.0202.0 Bodega Head RCM 08/29/96 163.0 9.6 8.11 2.32 5.5 0.81 6.0 0.145 2.3 2.2 0.028 126.0203.0 Tomales Bay RBM 04/14/97 2850.0 NA 6.38 14.60 18.7 0.63 106.0 0.373 NA NA 0.095 168.0203.0 Tomales Bay TCM 04/14/97 1190.0 NA 3.01 5.54 7.2 1.00 150.0 0.184 NA NA 0.077 147.0203.1 Tomales Bay/Vincent Landing TCM 04/14/97 281.0 NA 4.19 3.90 10.0 0.94 9.0 0.192 NA NA 0.062 179.0203.3 Tomales Bay/Walker Creek Mouth 1 TCM 04/14/97 1230.0 NA 4.31 5.05 9.8 1.29 20.6 0.270 NA NA 0.164 193.0203.5 Tomales Bay/Walker Creek Mouth 2 TCM 04/14/97 1060.0 NA 4.45 4.98 10.3 1.32 20.7 0.267 NA NA 0.066 203.0203.7 Tomales Bay/Walker Creek Mouth 3 TCM 04/14/97 1270.0 NA 4.19 6.06 10.2 1.40 27.4 0.328 NA NA 0.097 170.0203.9 Tomales Bay/Nicks Cove TCM 04/14/97 514.0 NA 4.42 4.48 11.0 1.23 11.0 0.200 NA NA 0.061 173.0205.0 Bodega Harbor/Spud Point Marina TCM 03/21/97 1410.0 NA 10.70 5.44 19.1 3.57 14.4 0.364 NA NA ND 339.0205.1 Bodega Bay/Porto Bodega RBM 03/21/97 1130.0 NA 5.98 5.60 42.1 0.81 15.8 0.419 NA NA 0.020 309.0205.3 Bodega Bay/Mason's Marina TCM 03/21/97 1600.0 NA 5.57 6.75 15.9 2.34 16.0 0.300 NA NA 0.023 236.0205.5 Bodega Bay/Back Marsh RBM 03/21/97 2000.0 NA 4.87 7.29 12.8 0.94 17.7 0.317 NA NA 0.024 216.0210.1 Walker Creek/Mine Creek TFC 01/17/97 NA NA NA NA NA NA NA 5.690 NA NA NA NA 210.3 Walker Creek/mid stream TFC 01/17/97 NA NA NA NA NA NA NA 1.500 NA NA NA NA 211.1 Lagunitas Creek/Bridge 1 TFC 01/17/97 NA NA NA NA NA NA NA 0.487 NA NA NA NA 211.3 Lagunitas Creek/Bridge 2 TFC 01/17/97 NA NA NA NA NA NA NA 0.459 NA NA NA NA 280.0 Russian River/S Goat Rock RCM 03/21/97 1910.0 NA 10.10 13.20 11.6 1.03 30.6 0.266 NA NA 0.100 222.0329.0 Guadalupe Creek/Almaden Expressway TFC 12/16/96 NA NA NA NA NA NA NA 0.705 NA NA NA NA 329.2 Guadalupe Creek/Hicks Road TFC 12/16/96 NA NA NA NA NA NA NA 0.748 NA NA NA NA 329.4 Alamitos Creek/Almaden Road TFC 12/16/96 NA NA NA NA NA NA NA 0.898 NA NA NA NA ____________________________________________________________________________________________________________________________________________________________* RCM = Resident California Mussel TFC = Transplanted Freshwater Clam GLY = Sand Worm (Glycera spp.) TCM = Transplanted California Mussel OYS = Oyster (Crassostrea gigas) NA = Not Analyzed RBM = Resident Bay Mussel (s = small size) PAC = Shore Crab (Pachygrapsus crassipes) ND = Not Detected

K-3
APPENDIX KState Mussel Watch Program
Summary of 1995-97 Data: Trace Elements in Mussel, Clam, Oyster, Shore Crab, and Sand Worm(ppm, dry weight)
____________________________________________________________________________________________________________________________________________________________Station Station Sample Sample Aluminum Cadmium Copper Manganese Nickel SilverNumber Name Type* Date Arsenic Chromium Lead Mercury Selenium Zinc____________________________________________________________________________________________________________________________________________________________400.6 Santa Cruz/Natural Bridges RCM 06/09/97 860.0 NA 4.45 3.06 14.7 0.75 10.6 0.085 NA NA 0.120 155.0400.7 Santa Cruz Harbor/Inner TCM 03/25/96 2400.0 NA 18.00 120.00 96.0 6.10 33.0 0.620 NA NA 0.120 700.0401.0 Santa Cruz Harbor TCM 03/25/96 1500.0 NA 11.00 19.00 66.0 4.50 17.0 0.490 NA NA 0.087 480.0403.0 Elkhorn Slough/Highway 1 Bridge TCM 03/12/97 1620.0 NA 10.40 9.08 15.7 1.94 15.9 0.271 8.8 NA 0.053 205.0404.0 Sandholdt Bridge TCM 02/16/96 1500.0 NA 9.50 6.10 11.0 2.20 84.0 0.340 NA NA 0.017 290.0404.0 Sandholdt Bridge TCM 03/04/97 2400.0 5.8 7.88 8.69 16.5 3.06 26.3 0.335 8.1 2.1 0.038 246.0414.0 Pacific Grove RCM 03/07/96 510.0 NA 7.30 5.70 6.5 1.50 8.5 0.240 NA NA 0.160 200.0414.0 Pacific Grove RCM 04/25/97 213.0 11.6 7.35 2.71 17.0 1.85 6.4 0.133 4.1 0.6 0.080 218.0420.3 Monterey Harbor/C G Jetty/Inner TCM 02/13/96 NA NA NA NA NA 13.00 NA NA NA NA NA NA 420.4 Monterey Harbor/C G Jetty/Inner 2 TCM 02/13/96 NA NA NA NA NA 11.00 NA NA NA NA NA NA 420.5 Monterey Harbor/C G Jetty/Inner 3 TCM 02/13/96 NA NA NA NA NA 9.30 NA NA NA NA NA NA 421.0 Monterey Harbor/Slag Pile TCM 02/13/96 NA NA NA NA NA 28.00 NA NA NA NA NA NA 601.0 LA Harbor/National Steel TCM 01/18/96 970.0 NA 11.00 14.00 27.0 7.30 27.0 0.300 NA NA 0.094 370.0601.0 LA Harbor/National Steel TCM 01/28/97 946.0 9.4 6.03 3.13 21.5 7.85 24.7 0.235 NA NA 0.061 414.0616.0 LA Harbor/Consolidated Slip TCM 01/18/96 690.0 NA 14.00 25.00 34.0 10.00 29.0 0.300 NA NA 0.150 410.0616.0 LA Harbor/Consolidated Slip TCM 01/28/97 764.0 9.7 6.77 5.06 18.1 8.51 22.0 0.197 NA NA 0.056 366.0648.0 Malibu RBM 01/17/96 1000.0 NA 2.70 9.10 6.3 0.54 21.0 0.066 NA NA 0.097 100.0648.0 Malibu RCM 11/25/96 682.0 NA 1.61 1.81 7.8 0.53 14.2 0.042 NA NA 0.113 108.0650.0 Santa Monica RBM 01/17/96 940.0 NA 0.82 4.30 5.6 1.10 15.0 0.073 NA NA 0.400 93.0650.0 Santa Monica RCM 11/25/96 850.0 NA 0.44 3.49 9.2 2.71 15.2 0.059 NA NA 2.040 131.0662.0 Royal Palms RCM 01/18/96 370.0 NA 3.30 12.00 7.7 1.70 11.0 0.140 NA NA 1.800 170.0662.0 Royal Palms RCM 11/25/96 384.0 NA 2.24 6.61 8.0 2.04 12.5 0.165 NA NA 1.820 196.0664.0 Cabrillo Beach RCM 01/18/96 570.0 NA 3.60 14.00 9.9 2.10 15.0 0.180 NA NA 5.000 190.0708.0 Anaheim Bay/Navy Marsh TCM 01/27/97 1970.0 9.6 4.50 10.90 12.2 5.32 29.4 0.118 8.9 1.8 0.053 243.0713.0 Huntington Harbour/Edinger Street TCM 01/17/96 980.0 10.0 12.00 7.90 12.0 4.60 22.0 0.270 9.6 2.1 0.084 360.0713.0 Huntington Harbour/Edinger Street TCM 01/27/97 1240.0 9.4 6.90 4.12 15.8 6.62 29.0 0.272 4.3 1.9 0.049 367.0715.0 Huntington Harbour/Warner Ave Brdg TCM 01/17/96 810.0 11.0 14.00 7.80 20.0 9.90 32.0 0.280 9.8 2.1 0.077 590.0715.0 Huntington Harbour/Warner Ave Brdg TCM 01/27/97 1250.0 9.3 5.19 4.55 20.3 10.80 36.7 0.171 4.4 2.0 0.055 435.0723.4 Newport Bay/Turning Basin TCM 01/17/96 700.0 10.0 13.00 8.80 26.0 5.00 24.0 0.330 9.0 1.7 0.049 430.0724.0 Newport Bay/Highway 1 Bridge TCM 01/17/96 1400.0 11.0 10.00 7.30 20.0 3.40 23.0 0.930 7.1 2.2 0.049 410.0725.0 Newport Bay/Crows Nest TCM 01/17/96 660.0 8.9 11.00 17.00 100.0 7.40 29.0 0.580 17.2 1.5 0.062 640.0725.0 Newport Bay/Crows Nest TCM 01/27/97 845.0 9.6 6.46 2.44 76.2 4.99 26.0 0.399 2.0 2.1 0.024 501.0726.4 Newport Bay/Rhine Channel/End TCM 01/17/96 440.0 11.0 14.00 14.00 130.0 6.90 62.0 0.660 15.0 2.0 0.063 870.0726.4 Newport Bay/Rhine Channel/End TCM 01/27/97 656.0 10.6 9.59 15.80 117.0 5.89 48.6 0.463 14.2 1.6 ND 618.0726.6 Newport Bay/Mariners Drive TCM 01/27/97 816.0 10.5 10.20 6.74 7.3 2.63 29.9 0.217 7.9 2.0 0.012 321.0740.0 Dana Point Harbor/Boat Yard TCM 01/27/97 1720.0 9.8 5.94 6.78 69.3 3.45 14.6 0.231 5.9 ND ND 396.0750.0 Oceanside RCM 09/30/96 1510.0 5.4 1.32 5.16 13.2 0.69 19.3 0.051 3.7 2.1 0.051 127.0882.2 24Th St Maritime Terminal/North TCM 01/18/96 1400.0 NA 9.10 6.70 58.0 4.40 56.0 0.300 NA NA 0.330 540.0882.7 San Diego Bay/Sampson Street Pier TCM 01/18/96 750.0 NA 10.00 15.00 64.0 4.90 20.0 0.400 NA NA 0.300 500.0883.1 San Diego Bay/Chollas Creek TCM 01/28/97 983.0 9.1 8.82 7.02 27.8 9.06 19.5 0.273 5.5 1.7 0.129 420.0____________________________________________________________________________________________________________________________________________________________* RCM = Resident California Mussel TFC = Transplanted Freshwater Clam GLY = Sand Worm (Glycera spp.) TCM = Transplanted California Mussel OYS = Oyster (Crassostrea gigas) NA = Not Analyzed RBM = Resident Bay Mussel (s = small size) PAC = Shore Crab (Pachygrapsus crassipes) ND = Not Detected

K-4
APPENDIX KState Mussel Watch Program
Summary of 1995-97 Data: Trace Elements in Mussel, Clam, Oyster, Shore Crab, and Sand Worm(ppm, dry weight)
____________________________________________________________________________________________________________________________________________________________Station Station Sample Sample Aluminum Cadmium Copper Manganese Nickel SilverNumber Name Type* Date Arsenic Chromium Lead Mercury Selenium Zinc____________________________________________________________________________________________________________________________________________________________883.2 San Diego Bay/Chollas Creek/Mouth TCM 01/28/97 1270.0 8.2 5.84 6.59 46.7 6.46 54.1 0.224 5.9 ND 0.162 466.0883.3 San Diego Bay/Chollas Creek/End TCM 01/28/97 957.0 9.1 8.84 8.36 26.8 8.92 27.2 0.220 6.4 1.8 0.121 506.0883.5 San Diego Bay/Tuna Docks TCM 01/28/97 828.0 9.2 6.10 7.79 31.5 6.47 25.6 0.230 4.8 2.0 0.119 432.0883.6 San Diego Bay/7th Street Channel TCM 01/18/96 2200.0 NA 9.30 25.00 54.0 8.70 29.0 0.240 NA NA 0.400 520.0883.6 San Diego Bay/7th Street Channel TCM 01/28/97 1350.0 9.1 5.36 8.11 59.7 6.14 42.1 0.211 6.3 3.7 0.170 552.0883.8 San Diego Bay/Switzer Creek TCM 01/28/97 710.0 10.2 8.93 12.50 23.4 5.34 20.3 0.260 4.6 ND 0.085 406.0885.1 San Diego Bay/Paleta Creek/End TCM 01/28/97 1240.0 8.5 6.59 4.15 38.9 20.80 35.3 0.180 3.4 2.2 0.162 651.0885.3 San Diego Bay/7th Street Ch/Mid TCM 01/28/97 1550.0 7.0 5.93 8.80 50.9 16.80 50.0 0.206 5.7 1.9 0.150 547.0886.0 San Diego Bay/NASSCO TCM 01/18/96 870.0 NA 15.00 25.00 57.0 5.90 29.0 0.250 NA NA 0.210 530.0888.0 San Diego Bay/Coronado Bridge RBM 01/28/97 1250.0 7.8 6.46 4.15 21.3 4.84 48.1 0.178 2.9 1.9 0.091 346.0894.0 SD Bay/Harbor Is/E Basin/Storm Dr TCM 01/28/97 1110.0 9.2 9.34 13.20 43.4 27.60 16.9 0.194 4.3 2.8 0.402 480.0____________________________________________________________________________________________________________________________________________________________* RCM = Resident California Mussel TFC = Transplanted Freshwater Clam GLY = Sand Worm (Glycera spp.) TCM = Transplanted California Mussel OYS = Oyster (Crassostrea gigas) NA = Not Analyzed RBM = Resident Bay Mussel (s = small size) PAC = Shore Crab (Pachygrapsus crassipes) ND = Not Detected

L-1
APPENDIX L
Summary of 1995-97 Data
Trace Elements in Sediment
(ppm, dry weight)

L-2
APPENDIX LState Mussel Watch Program
Summary of 1995-97 Data: Trace Elements in Sediment (ppm, dry weight)____________________________________________________________________________________________________________________________________________________________Station Station Sample Sample Aluminum Cadmium Copper Manganese Nickel SilverNumber Name Type* Date Arsenic Chromium Lead Mercury Selenium Zinc____________________________________________________________________________________________________________________________________________________________203.1 Tomales Bay/Vincent Landing SED 04/14/97 99300.0 NA 0.32 183.00 23.1 8.08 574.0 0.723 NA NA 0.044 81.3203.7 Tomales Bay/Walker Creek Mouth 3 SED 04/14/97 112000.0 NA 3.56 202.00 29.5 7.25 416.0 2.930 NA NA 0.029 102.0299.1 Selby Slag 4 SED 10/27/95 63500.0 17.3 0.64 229.00 42.6 144.00 542.0 0.317 86.8 0.3 0.273 177.0302.6 Paradise Cove SED 10/26/95 71700.0 12.8 0.32 249.00 48.3 19.70 303.0 0.327 104.0 0.3 0.298 150.0306.1 Gashouse Cove/Laguna Street SED 12/07/95 71000.0 16.5 0.30 233.00 67.9 26.00 302.0 0.315 120.0 0.5 0.323 168.0306.2 Sansome Street/Pier 31 SED 12/06/95 68000.0 12.5 0.29 218.00 48.7 15.10 313.0 0.271 96.6 0.4 0.303 155.0306.3 Howard Street/Pier 14 SED 12/06/95 58700.0 10.4 0.47 257.00 48.6 41.30 220.0 0.338 77.4 0.3 1.690 133.0306.4 Central Basin/Outer SED 12/06/95 66400.0 17.3 0.25 188.00 73.1 32.90 473.0 0.265 82.2 0.4 0.316 143.0311.4 North South Bay SED 12/06/95 59400.0 6.3 0.13 196.00 20.8 11.40 277.0 0.164 98.6 0.2 0.159 103.0____________________________________________________________________________________________________________________________________________________________* SED = Sediments NA = Not Analyzed

M-1
APPENDIX M
Summary of 1995-97 DataOrganic Chemicals in Mussel, Oyster, Shore Crab, and Sand Worm
(ppb, wet weight)

M-2
APPENDIX MState Mussel Watch Program
Summary of 1995-97 Data: Organic Chemicals in Mussel, Oyster, Shore Crab, and Sand Worm (ppb, wet weight)____________________________________________________________________________________________________________________________________________________________ Aldrin alpha- cis- gamma- trans- cis- trans- Oxy- Total Chlor- DacthalStation Station Sample Sample Chlor- Chlor- Chlor- Chlor- Nona- Nona- chlor- Chlor- pyrifosNumber Name Type* Date dene dane dene dane chlor chlor dane dane____________________________________________________________________________________________________________________________________________________________ 1.0 Crescent City Harbor RCM 04/09/97 ND ND 0.5 0.3 0.3 ND 0.3 ND 1.4 ND ND 2.0 Crescent City/STP Outfall RCM 04/09/97 ND ND 0.6 ND 0.9 ND 0.3 ND 1.9 ND ND 2.2 Crescent City Harbor/Inner Jetty RCM 04/09/97 ND ND 0.6 0.3 0.5 ND 0.3 ND 1.6 ND ND 3.0 Crescent City/Control RCM 04/10/97 ND ND 0.2 ND 0.2 ND ND ND 0.4 ND ND 100.0 Mad River Slough OYS 04/10/97 ND ND 0.3 ND 0.3 ND ND ND 0.5 ND 0.3101.4 Arcata Bay/Jolly Giant Slough PAC 04/18/96 ND ND ND ND ND ND 0.8 0.6 1.4 ND ND 101.8 Humboldt Bay/Halberson Shoreline PAC 04/17/96 ND ND ND ND ND ND 0.9 0.8 1.7 ND ND 101.8 Humboldt Bay/Halberson Shoreline RBM-s 04/17/96 ND ND ND ND ND ND ND ND ND ND ND 101.8 Humboldt Bay/Halberson Shoreline GLY 04/17/96 ND ND 0.2 ND 0.1 ND 0.3 ND 0.7 ND ND 102.6 Humboldt Bay/J Street GLY 04/17/96 ND ND 0.1 ND ND 0.5 0.8 ND 1.4 0.8 ND ____________________________________________________________________________________________________________________________________________________________ Diaz- o,p' p,p' o,p' p,p' o,p' p,p' p,p' Total Di- Dieldrin Endo- Endo- Endo- Total Endrin EthionStation inon DDD DDD DDE DDE DDT DDT DDMU DDT Chloro- sulfan sulfan sulfan Endo-Number Benzophenone I II sulfate sulfan____________________________________________________________________________________________________________________________________________________________ 1.0 ND ND ND ND 1.2 ND ND ND 1.2 ND ND ND ND ND ND ND ND 2.0 ND ND ND ND 2.0 ND 0.4 ND 2.4 ND 0.3 ND ND ND ND ND ND 2.2 ND ND ND ND 0.9 ND ND ND 0.9 ND 0.6 ND ND ND ND ND ND 3.0 ND ND ND ND ND ND ND ND ND ND 0.4 ND ND ND ND ND ND 100.0 ND ND ND ND ND ND ND ND ND ND 0.2 ND ND ND ND ND ND 101.4 NA ND ND ND 0.4 ND ND ND 0.4 ND 0.8 ND ND ND ND NA ND 101.8 NA ND ND ND ND ND ND ND ND ND ND ND ND ND ND NA ND 101.8 NA ND ND ND 0.5 ND ND ND 0.5 ND ND ND ND ND ND NA ND 101.8 NA ND ND ND 0.2 ND ND ND 0.2 ND 0.3 ND ND ND ND NA ND 102.6 NA ND ND ND ND ND ND ND ND ND 0.6 ND ND ND ND NA ND ____________________________________________________________________________________________________________________________________________________________ alpha- beta- delta- gamma- Hepta- Hepta- Hexa- Methoxy- Ethyl- Methyl- Oxa- PCB PCB PCB Total PCT Tetra- Toxa-Station HCH HCH HCH HCH chlor chlor- chloro- chlor para- para- diazon 1248 1254 1260 PCB 5460 difon pheneNumber (Lindane) epoxide benzene thion thion____________________________________________________________________________________________________________________________________________________________ 1.0 ND ND ND ND ND ND ND ND ND ND ND ND 4.3 ND 4.3 NA ND ND 2.0 0.2 ND ND 0.2 ND ND ND ND ND ND ND ND 1.5 ND 1.5 NA ND ND 2.2 0.2 ND ND ND ND ND ND ND ND ND ND ND 5.8 ND 5.8 NA ND ND 3.0 0.3 ND ND ND ND ND ND ND ND ND ND ND ND ND ND NA ND ND 100.0 0.2 ND ND ND ND ND ND ND ND ND ND ND 3.5 ND 3.5 NA ND ND 101.4 ND ND ND ND ND ND ND ND NA NA NA ND ND ND ND ND NA ND 101.8 ND ND ND ND ND ND ND ND NA NA NA ND ND ND ND ND NA ND 101.8 ND ND ND ND ND ND ND ND NA NA NA ND ND ND ND ND NA ND 101.8 ND ND ND ND ND ND ND ND NA NA NA ND ND ND ND ND NA ND 102.6 ND ND ND ND ND ND ND ND NA NA NA ND ND ND ND ND NA ND ____________________________________________________________________________________________________________________________________________________________* RCM = Resident California Mussel OYS = Oyster (Crassostrea gigas) NA = Not Analyzed RBM = Resident Bay Mussel (s = small size) GLY = Sand Worm (Glycera spp.) ND = Not Detected TCM = Transplanted California Mussel (a = archive) PAC = Shore Crab (Pachygrapsus crassipes)

M-3
APPENDIX MState Mussel Watch Program
Summary of 1995-97 Data: Organic Chemicals in Mussel, Oyster, Shore Crab, and Sand Worm (ppb, wet weight)____________________________________________________________________________________________________________________________________________________________ Aldrin alpha- cis- gamma- trans- cis- trans- Oxy- Total Chlor- DacthalStation Station Sample Sample Chlor- Chlor- Chlor- Chlor- Nona- Nona- chlor- Chlor- pyrifosNumber Name Type* Date dene dane dene dane chlor chlor dane dane____________________________________________________________________________________________________________________________________________________________102.6 Humboldt Bay/J Street PAC 04/17/96 ND ND ND ND ND ND ND 1.9 1.9 ND ND 102.6 Humboldt Bay/J Street RBM 04/17/96 ND ND ND ND ND ND ND ND ND ND ND 102.6 Humboldt Bay/J Street TCM 04/10/97 ND ND 0.5 0.3 0.4 ND 0.3 ND 1.4 ND ND 102.7 Humboldt Bay/H Street RBM-s 04/17/96 ND ND ND ND ND ND ND ND ND ND ND 102.7 Humboldt Bay/H Street GLY 04/17/96 ND ND 0.5 ND ND 0.5 1.4 ND 2.4 ND ND 102.7 Humboldt Bay/H Street PAC 04/17/96 ND ND ND ND ND ND ND 0.6 0.6 ND ND 103.3 Humboldt Bay/E Street TCM 04/10/97 ND ND 0.4 ND 0.3 ND ND ND 0.7 ND ND 103.5 Humboldt Bay/Clark Slough TCM 04/10/97 ND ND 0.4 ND 0.4 ND 0.2 ND 1.1 ND ND 202.0 Bodega Head RCM 09/11/95 ND ND ND ND ND ND ND ND ND ND ND 202.0 Bodega Head RCM 08/29/96 ND ND ND ND ND ND ND ND ND ND ND ____________________________________________________________________________________________________________________________________________________________ Diaz- o,p' p,p' o,p' p,p' o,p' p,p' p,p' Total Di- Dieldrin Endo- Endo- Endo- Total Endrin EthionStation inon DDD DDD DDE DDE DDT DDT DDMU DDT Chloro- sulfan sulfan sulfan Endo-Number Benzophenone I II sulfate sulfan____________________________________________________________________________________________________________________________________________________________102.6 NA ND ND ND 2.5 ND ND ND 2.5 ND 0.6 ND ND ND ND NA ND 102.6 NA ND ND ND 0.5 ND ND ND 0.5 ND ND ND ND ND ND NA ND 102.6 ND ND ND ND 0.7 ND ND ND 0.7 ND 0.8 ND ND ND ND ND ND 102.7 NA ND ND ND 0.4 ND ND ND 0.4 ND ND ND ND ND ND NA ND 102.7 NA ND 1.3 ND 10.9 ND ND ND 12.2 ND 0.4 ND ND ND ND NA ND 102.7 NA ND ND ND 3.6 ND ND ND 3.6 ND 0.5 ND ND ND ND NA ND 103.3 ND ND ND ND 0.8 ND 0.2 ND 1.0 ND 0.6 ND ND ND ND ND ND 103.5 ND ND ND ND 0.6 ND ND ND 0.6 ND 0.5 ND ND ND ND ND ND 202.0 ND ND ND ND 1.3 ND ND ND 1.3 ND 0.4 ND ND NA ND ND ND 202.0 ND ND ND ND 0.9 ND ND ND 0.9 ND 0.6 ND ND ND ND ND ND ____________________________________________________________________________________________________________________________________________________________ alpha- beta- delta- gamma- Hepta- Hepta- Hexa- Methoxy- Ethyl- Methyl- Oxa- PCB PCB PCB Total PCT Tetra- Toxa-Station HCH HCH HCH HCH chlor chlor- chloro- chlor para- para- diazon 1248 1254 1260 PCB 5460 difon pheneNumber (Lindane) epoxide benzene thion thion____________________________________________________________________________________________________________________________________________________________102.6 ND ND ND ND ND ND 0.8 ND NA NA NA ND ND ND ND ND NA ND 102.6 ND ND ND ND ND ND ND ND NA NA NA ND 9.0 ND 9.0 ND NA ND 102.6 0.2 ND ND ND ND ND ND ND ND ND ND ND 4.2 ND 4.2 NA ND ND 102.7 ND ND ND ND ND ND ND ND NA NA NA ND 73.0 ND 73.0 ND NA ND 102.7 ND ND ND ND ND ND ND ND NA NA NA ND 55.4 29.4 84.8 ND NA ND 102.7 ND ND ND ND ND ND ND ND NA NA NA ND ND 63.3 63.3 ND NA ND 103.3 0.2 ND ND ND ND ND ND ND ND ND ND ND 4.7 ND 4.7 NA ND ND 103.5 ND ND ND ND ND ND ND ND ND ND ND ND 5.5 ND 5.5 NA ND ND 202.0 0.6 ND ND ND ND ND ND ND ND ND ND ND 2.1 ND 2.1 NA ND ND 202.0 0.4 ND ND ND ND ND ND ND ND ND ND ND 4.8 ND 4.8 NA ND ND ____________________________________________________________________________________________________________________________________________________________* RCM = Resident California Mussel OYS = Oyster (Crassostrea gigas) NA = Not Analyzed RBM = Resident Bay Mussel (s = small size) GLY = Sand Worm (Glycera spp.) ND = Not Detected TCM = Transplanted California Mussel (a = archive) PAC = Shore Crab (Pachygrapsus crassipes)

M-4
APPENDIX MState Mussel Watch Program
Summary of 1995-97 Data: Organic Chemicals in Mussel, Oyster, Shore Crab, and Sand Worm (ppb, wet weight)____________________________________________________________________________________________________________________________________________________________ Aldrin alpha- cis- gamma- trans- cis- trans- Oxy- Total Chlor- DacthalStation Station Sample Sample Chlor- Chlor- Chlor- Chlor- Nona- Nona- chlor- Chlor- pyrifosNumber Name Type* Date dene dane dene dane chlor chlor dane dane____________________________________________________________________________________________________________________________________________________________205.0 Bodega Harbor/Spud Point Marina TCM 03/21/97 ND 0.2 0.6 0.2 0.4 ND 0.3 ND 1.6 ND ND 205.1 Bodega Bay/Porto Bodega RBM 03/21/97 ND ND 0.3 ND 0.3 ND 0.2 ND 0.8 ND 0.3205.3 Bodega Bay/Mason's Marina TCM 03/21/97 ND ND 0.3 ND 0.2 ND ND ND 0.5 ND ND 205.5 Bodega Bay/Back Marsh RBM 03/21/97 ND ND 0.1 ND 0.1 ND ND ND 0.2 ND ND 280.0 Russian River/S Goat Rock RCM 03/21/97 ND ND 0.5 ND 0.3 ND 0.2 ND 1.0 ND ND 307.0 San Francisco Bay/Treasure Is TCM-a 01/26/81 ND 0.3 3.4 0.4 3.2 1.3 2.5 ND 11.0 ND 0.3307.0 San Francisco Bay/Treasure Is TCM-a 02/02/82 ND 0.3 3.0 0.3 2.5 1.1 2.0 ND 9.3 ND ND 308.0 San Francisco Bay/Hunter's Point TCM-a 01/26/81 ND 0.2 3.7 0.3 3.2 1.3 1.9 0.2 10.7 ND ND 309.0 San Mateo Bridge/8B TCM-a 02/09/81 ND 0.2 3.8 0.3 3.1 1.4 2.6 0.2 11.5 ND 0.6313.0 San Francisco Bay/near Redwood Cr TCM-a 01/26/81 ND 0.3 5.4 0.2 4.7 1.8 3.3 0.3 16.0 ND 0.5____________________________________________________________________________________________________________________________________________________________ Diaz- o,p' p,p' o,p' p,p' o,p' p,p' p,p' Total Di- Dieldrin Endo- Endo- Endo- Total Endrin EthionStation inon DDD DDD DDE DDE DDT DDT DDMU DDT Chloro- sulfan sulfan sulfan Endo-Number Benzophenone I II sulfate sulfan____________________________________________________________________________________________________________________________________________________________205.0 ND ND ND ND 1.5 ND ND ND 1.5 ND 0.4 ND ND ND ND ND ND 205.1 ND ND ND ND 2.1 ND ND ND 2.1 ND ND ND ND ND ND ND ND 205.3 ND ND ND ND 1.6 ND ND ND 1.6 ND 0.5 ND ND ND ND ND ND 205.5 ND ND ND ND 0.5 ND ND ND 0.5 ND ND ND ND ND ND ND ND 280.0 ND ND ND ND 1.7 ND 0.8 ND 2.4 ND 0.9 ND ND ND ND ND ND 307.0 ND 2.6 8.7 0.6 8.4 0.6 1.4 1.8 24.1 ND 4.3 0.1 ND ND 0.1 ND ND 307.0 ND 2.0 6.2 0.5 6.2 0.8 1.7 1.5 18.8 ND 5.9 ND 0.5 ND 0.5 ND ND 308.0 ND 2.0 5.5 ND 7.5 ND 1.5 1.4 18.0 ND 7.3 0.3 ND ND 0.3 ND ND 309.0 ND 1.3 3.7 ND 5.8 ND 1.5 0.9 13.2 ND 8.3 0.3 ND ND 0.3 ND ND 313.0 ND 1.4 3.6 ND 6.2 ND 1.7 1.2 14.1 ND 10.9 0.4 ND ND 0.4 ND ND ____________________________________________________________________________________________________________________________________________________________ alpha- beta- delta- gamma- Hepta- Hepta- Hexa- Methoxy- Ethyl- Methyl- Oxa- PCB PCB PCB Total PCT Tetra- Toxa-Station HCH HCH HCH HCH chlor chlor- chloro- chlor para- para- diazon 1248 1254 1260 PCB 5460 difon pheneNumber (Lindane) epoxide benzene thion thion____________________________________________________________________________________________________________________________________________________________205.0 ND ND ND ND ND ND 0.2 ND ND ND ND ND 8.6 2.1 10.7 NA ND ND 205.1 ND ND ND ND ND ND ND ND ND ND ND ND 13.4 ND 13.4 NA ND ND 205.3 ND ND ND ND ND ND ND ND ND ND ND ND 5.4 ND 5.4 NA ND ND 205.5 ND ND ND ND ND ND ND ND ND ND ND ND ND ND ND NA ND ND 280.0 0.2 ND ND ND ND ND ND ND ND ND ND ND ND ND ND NA ND ND 307.0 0.4 ND ND 0.4 ND 0.1 ND 0.2 ND ND ND 17.9 75.2 3.7 96.7 NA ND 15.3307.0 0.5 ND ND 0.4 ND 0.3 ND ND ND ND ND 16.9 64.6 2.9 84.5 NA ND 25.7308.0 0.3 ND ND ND ND 0.2 ND ND ND ND ND 10.1 57.0 4.3 71.4 NA ND 17.8309.0 0.3 ND ND 0.4 ND 0.3 ND 0.2 ND ND ND 9.3 47.3 4.3 60.9 NA ND 14.9313.0 0.3 ND ND 0.5 ND 0.3 0.2 0.3 ND ND ND 9.1 51.1 3.7 63.9 NA ND 17.6____________________________________________________________________________________________________________________________________________________________* RCM = Resident California Mussel OYS = Oyster (Crassostrea gigas) NA = Not Analyzed RBM = Resident Bay Mussel (s = small size) GLY = Sand Worm (Glycera spp.) ND = Not Detected TCM = Transplanted California Mussel (a = archive) PAC = Shore Crab (Pachygrapsus crassipes)

M-5
APPENDIX MState Mussel Watch Program
Summary of 1995-97 Data: Organic Chemicals in Mussel, Oyster, Shore Crab, and Sand Worm (ppb, wet weight)____________________________________________________________________________________________________________________________________________________________ Aldrin alpha- cis- gamma- trans- cis- trans- Oxy- Total Chlor- DacthalStation Station Sample Sample Chlor- Chlor- Chlor- Chlor- Nona- Nona- chlor- Chlor- pyrifosNumber Name Type* Date dene dane dene dane chlor chlor dane dane____________________________________________________________________________________________________________________________________________________________321.0 Dumbarton Bridge/Channel Marker 14 TCM-a 02/09/81 0.9 0.5 6.3 0.6 5.0 2.3 4.0 0.2 18.9 ND 1.3400.6 Santa Cruz/Natural Bridges RCM 06/09/97 ND ND 0.8 ND 0.7 0.2 0.7 ND 2.3 ND ND 400.7 Santa Cruz Harbor/Inner TCM 03/25/96 ND ND 3.3 ND 2.6 1.4 2.4 0.2 9.9 0.2 ND 401.0 Santa Cruz Harbor TCM 03/25/96 ND ND 2.4 ND 2.0 1.1 2.0 0.2 7.7 ND ND 403.0 Elkhorn Slough/Highway 1 Bridge TCM 03/12/97 ND ND 1.3 ND 1.2 0.4 0.8 ND 3.8 ND 0.7404.0 Sandholdt Bridge TCM 02/16/96 ND ND 4.7 ND 4.0 2.3 4.1 ND 15.1 2.0 6.6404.0 Sandholdt Bridge TCM 03/04/97 ND 0.3 4.4 ND 3.8 2.2 4.5 ND 15.2 1.1 2.8414.0 Pacific Grove RCM 03/07/96 ND ND 0.6 ND 0.5 ND 0.3 ND 1.5 ND ND 414.0 Pacific Grove RCM 04/25/97 ND ND 0.3 ND ND ND 0.2 ND 0.5 ND 0.3601.0 LA Harbor/National Steel TCM 01/18/96 ND ND 2.0 ND 1.9 1.2 1.8 ND 6.9 ND ND ____________________________________________________________________________________________________________________________________________________________ Diaz- o,p' p,p' o,p' p,p' o,p' p,p' p,p' Total Di- Dieldrin Endo- Endo- Endo- Total Endrin EthionStation inon DDD DDD DDE DDE DDT DDT DDMU DDT Chloro- sulfan sulfan sulfan Endo-Number Benzophenone I II sulfate sulfan____________________________________________________________________________________________________________________________________________________________321.0 ND 1.7 4.5 ND 8.2 ND 1.8 1.3 17.5 ND 10.4 0.7 ND 0.4 1.1 0.4 ND 400.6 ND ND 1.2 ND 9.4 ND 3.0 ND 13.6 ND 2.5 ND ND ND ND ND ND 400.7 ND ND 0.7 ND 3.2 ND 1.7 ND 5.6 ND 2.6 ND ND NA ND ND ND 401.0 ND ND 1.2 ND 5.4 ND 2.3 ND 8.9 ND 1.3 ND ND NA ND ND ND 403.0 ND 1.9 5.5 0.6 40.7 4.0 12.6 1.0 66.4 ND 7.0 ND ND ND ND ND ND 404.0 ND 12.4 36.7 6.3 259.9 13.7 105.1 7.7 441.8 ND 32.1 0.5 1.4 ND 1.9 4.0 ND 404.0 ND 10.4 44.5 4.4 235.5 24.8 91.1 5.1 415.8 ND 27.6 0.3 1.3 ND 1.6 2.2 ND 414.0 ND ND 0.9 ND 6.3 ND 1.8 ND 9.0 ND 1.6 ND ND NA ND ND ND 414.0 ND ND ND ND 2.9 ND 0.8 ND 3.7 ND 1.0 ND ND ND ND ND ND 601.0 ND 2.3 8.4 4.0 33.0 ND 1.9 2.6 52.2 ND 0.6 ND ND NA ND ND ND ____________________________________________________________________________________________________________________________________________________________ alpha- beta- delta- gamma- Hepta- Hepta- Hexa- Methoxy- Ethyl- Methyl- Oxa- PCB PCB PCB Total PCT Tetra- Toxa-Station HCH HCH HCH HCH chlor chlor- chloro- chlor para- para- diazon 1248 1254 1260 PCB 5460 difon pheneNumber (Lindane) epoxide benzene thion thion____________________________________________________________________________________________________________________________________________________________321.0 0.4 ND ND 1.1 ND 0.5 0.2 0.2 ND ND 0.4 26.7 75.1 3.8 105.5 NA ND 19.0400.6 ND ND ND ND ND ND ND ND ND ND ND ND 3.5 ND 3.5 NA ND ND 400.7 ND ND ND ND ND ND ND ND ND ND 0.3 ND 5.3 ND 5.3 NA ND ND 401.0 ND ND ND ND ND ND ND ND ND ND ND ND 12.0 ND 12.0 NA ND ND 403.0 ND ND ND ND ND ND ND ND 1.6 ND ND ND 14.4 1.7 16.1 NA ND 42.0404.0 ND ND ND ND ND 0.5 ND ND ND ND 1.0 ND 34.2 ND 34.2 NA ND 232.1404.0 ND ND ND ND ND 0.1 ND ND ND ND ND ND 28.2 4.0 32.2 NA ND 228.5414.0 0.3 ND ND ND ND ND ND ND ND ND ND ND 2.7 ND 2.7 NA ND ND 414.0 ND ND ND ND ND ND ND ND ND ND ND 8.5 ND ND 8.5 NA ND ND 601.0 ND ND ND ND ND ND ND ND ND ND ND 9.1 58.4 ND 67.5 NA ND ND ____________________________________________________________________________________________________________________________________________________________* RCM = Resident California Mussel OYS = Oyster (Crassostrea gigas) NA = Not Analyzed RBM = Resident Bay Mussel (s = small size) GLY = Sand Worm (Glycera spp.) ND = Not Detected TCM = Transplanted California Mussel (a = archive) PAC = Shore Crab (Pachygrapsus crassipes)

M-6
APPENDIX MState Mussel Watch Program
Summary of 1995-97 Data: Organic Chemicals in Mussel, Oyster, Shore Crab, and Sand Worm (ppb, wet weight)____________________________________________________________________________________________________________________________________________________________ Aldrin alpha- cis- gamma- trans- cis- trans- Oxy- Total Chlor- DacthalStation Station Sample Sample Chlor- Chlor- Chlor- Chlor- Nona- Nona- chlor- Chlor- pyrifosNumber Name Type* Date dene dane dene dane chlor chlor dane dane____________________________________________________________________________________________________________________________________________________________601.0 LA Harbor/National Steel TCM 01/28/97 ND 0.2 1.8 ND 1.4 0.7 0.9 ND 4.9 ND ND 605.0 LA Harbor/Cabrillo Pier TCM 01/18/96 ND ND 1.6 ND 1.5 0.7 1.2 ND 5.0 ND ND 616.0 LA Harbor/Consolidated Slip TCM 01/18/96 ND 0.1 2.2 0.2 2.1 1.2 2.2 0.1 8.1 ND ND 616.0 LA Harbor/Consolidated Slip TCM 01/28/97 ND 0.2 2.9 ND 2.4 1.3 1.9 ND 8.7 ND 0.3618.0 LA Harbor/Angels Gate RCM 01/18/96 ND ND 1.5 ND 1.5 0.7 1.4 ND 5.0 ND ND 648.0 Malibu RBM 01/17/96 ND ND 2.4 0.2 2.2 0.6 2.0 ND 7.4 ND ND 648.0 Malibu RCM 11/25/96 ND ND 0.8 ND 0.7 0.3 1.0 ND 2.7 ND ND 650.0 Santa Monica RBM 01/17/96 ND ND 2.5 0.3 2.9 ND 3.4 ND 9.1 ND ND 650.0 Santa Monica RCM 11/25/96 ND ND 1.5 ND 1.3 0.6 1.2 ND 4.6 ND ND 662.0 Royal Palms RCM 01/18/96 ND ND 0.9 ND 0.9 0.2 0.5 ND 2.6 ND ND ____________________________________________________________________________________________________________________________________________________________ Diaz- o,p' p,p' o,p' p,p' o,p' p,p' p,p' Total Di- Dieldrin Endo- Endo- Endo- Total Endrin EthionStation inon DDD DDD DDE DDE DDT DDT DDMU DDT Chloro- sulfan sulfan sulfan Endo-Number Benzophenone I II sulfate sulfan____________________________________________________________________________________________________________________________________________________________601.0 ND 1.6 5.4 2.1 31.0 0.6 2.8 2.3 45.8 ND 0.8 ND ND ND ND ND ND 605.0 ND 2.2 6.6 13.6 94.2 ND 2.0 8.7 127.2 ND 0.7 ND ND NA ND ND ND 616.0 ND 2.6 9.5 2.2 23.6 ND 2.3 1.4 41.6 ND 0.4 ND ND NA ND ND ND 616.0 ND 2.5 7.9 1.0 34.0 0.5 4.9 2.0 52.8 ND 1.0 ND ND ND ND ND ND 618.0 10.4 3.1 8.4 15.1 133.6 ND 3.0 15.1 178.4 ND 0.2 ND ND NA ND ND ND 648.0 ND 1.3 3.2 3.0 28.8 ND 1.2 4.2 41.7 ND 0.2 ND ND NA ND ND ND 648.0 ND ND 1.0 1.3 11.7 ND ND 2.0 16.1 ND 0.4 ND ND ND ND ND ND 650.0 ND 1.7 4.4 4.1 40.4 ND 0.8 6.3 57.8 ND 0.4 ND ND NA ND ND ND 650.0 ND ND 1.4 0.9 10.9 ND ND 1.8 15.0 ND 0.8 ND ND ND ND ND ND 662.0 ND 2.3 6.9 9.5 91.7 ND 1.9 9.4 121.7 ND 0.5 ND ND NA ND ND ND ____________________________________________________________________________________________________________________________________________________________ alpha- beta- delta- gamma- Hepta- Hepta- Hexa- Methoxy- Ethyl- Methyl- Oxa- PCB PCB PCB Total PCT Tetra- Toxa-Station HCH HCH HCH HCH chlor chlor- chloro- chlor para- para- diazon 1248 1254 1260 PCB 5460 difon pheneNumber (Lindane) epoxide benzene thion thion____________________________________________________________________________________________________________________________________________________________601.0 ND ND ND ND ND ND ND ND ND ND 1.2 32.6 107.2 4.2 144.0 NA ND 12.8605.0 ND ND ND ND ND ND ND ND ND ND ND 10.3 44.0 ND 54.3 NA ND ND 616.0 ND ND ND ND ND ND ND ND ND ND 0.4 8.8 68.5 ND 77.4 NA ND ND 616.0 ND ND ND ND ND ND ND ND ND ND 3.2 6.9 46.5 3.3 56.7 NA ND 42.8618.0 ND ND ND ND ND ND ND ND ND ND ND 9.0 87.6 ND 96.6 NA ND ND 648.0 0.2 ND ND ND ND ND ND ND ND ND ND ND 13.0 ND 13.0 NA ND ND 648.0 ND ND ND ND ND ND ND ND ND ND ND ND 8.7 ND 8.7 NA ND ND 650.0 0.3 ND ND ND ND ND ND ND ND ND 0.5 ND 22.2 ND 22.2 NA ND ND 650.0 ND ND ND ND ND ND ND ND ND ND ND ND 10.7 2.3 13.1 NA ND ND 662.0 ND ND ND ND ND ND ND ND ND ND ND ND 17.2 ND 17.2 NA ND ND ____________________________________________________________________________________________________________________________________________________________* RCM = Resident California Mussel OYS = Oyster (Crassostrea gigas) NA = Not Analyzed RBM = Resident Bay Mussel (s = small size) GLY = Sand Worm (Glycera spp.) ND = Not Detected TCM = Transplanted California Mussel (a = archive) PAC = Shore Crab (Pachygrapsus crassipes)

M-7
APPENDIX MState Mussel Watch Program
Summary of 1995-97 Data: Organic Chemicals in Mussel, Oyster, Shore Crab, and Sand Worm (ppb, wet weight)____________________________________________________________________________________________________________________________________________________________ Aldrin alpha- cis- gamma- trans- cis- trans- Oxy- Total Chlor- DacthalStation Station Sample Sample Chlor- Chlor- Chlor- Chlor- Nona- Nona- chlor- Chlor- pyrifosNumber Name Type* Date dene dane dene dane chlor chlor dane dane____________________________________________________________________________________________________________________________________________________________662.0 Royal Palms RCM 11/25/96 ND ND 0.3 ND 0.4 ND 0.3 ND 1.0 ND ND 664.0 Cabrillo Beach RCM 01/18/96 ND ND 0.6 ND 0.6 ND 0.4 ND 1.5 ND ND 708.0 Anaheim Bay/Navy Marsh TCM 01/27/97 ND 0.3 2.7 0.2 1.9 1.4 2.6 ND 9.0 1.6 ND 713.0 Huntington Harbour/Edinger Street TCM 01/17/96 ND 0.3 4.6 0.2 4.5 2.1 4.2 0.2 16.2 0.7 ND 713.0 Huntington Harbour/Edinger Street TCM 01/27/97 ND 0.2 2.6 0.1 2.3 1.1 2.2 0.1 8.5 1.0 ND 715.0 Huntington Harbour/Warner Ave Brdg TCM 01/17/96 ND 0.2 3.7 0.2 3.7 2.2 3.6 0.2 13.8 0.6 ND 715.0 Huntington Harbour/Warner Ave Brdg TCM 01/27/97 ND 0.3 2.7 0.3 2.5 1.5 2.4 ND 9.7 1.7 0.3723.4 Newport Bay/Turning Basin TCM 01/17/96 ND ND 1.9 ND 1.4 1.0 1.6 0.2 6.0 ND ND 724.0 Newport Bay/Highway 1 Bridge TCM 01/17/96 ND 0.1 2.8 0.1 2.2 1.5 2.4 0.1 9.3 ND 0.3725.0 Newport Bay/Crows Nest TCM 01/17/96 ND 0.2 2.9 0.2 2.0 1.8 2.6 0.4 10.1 ND ND ____________________________________________________________________________________________________________________________________________________________ Diaz- o,p' p,p' o,p' p,p' o,p' p,p' p,p' Total Di- Dieldrin Endo- Endo- Endo- Total Endrin EthionStation inon DDD DDD DDE DDE DDT DDT DDMU DDT Chloro- sulfan sulfan sulfan Endo-Number Benzophenone I II sulfate sulfan____________________________________________________________________________________________________________________________________________________________662.0 ND 0.8 2.5 4.5 59.2 ND 0.6 5.1 72.7 ND 0.4 ND ND ND ND ND ND 664.0 ND 1.1 3.8 6.0 52.9 ND 1.2 7.0 72.1 ND 0.3 ND ND NA ND ND ND 708.0 ND 2.1 4.5 3.0 49.7 0.7 3.0 3.9 66.9 ND 1.4 ND ND ND ND ND ND 713.0 ND 4.4 8.0 1.7 33.8 0.6 2.5 2.1 53.0 ND 1.5 ND ND NA ND ND ND 713.0 ND 1.4 3.1 0.6 21.5 0.6 4.7 1.2 33.1 ND 1.3 ND ND ND ND ND ND 715.0 ND 2.3 4.8 0.7 29.9 ND 0.8 1.2 39.7 ND 1.0 ND ND NA ND ND ND 715.0 ND 1.3 2.3 0.6 20.9 0.5 1.5 1.1 28.3 ND 1.4 ND ND ND ND ND ND 723.4 ND 0.7 2.8 0.3 18.0 ND 0.4 0.6 22.8 ND 0.8 ND ND NA ND ND ND 724.0 ND 1.9 8.1 1.5 57.6 ND 1.2 2.3 72.6 ND 1.2 ND ND NA ND ND ND 725.0 ND 1.7 6.7 1.1 52.9 ND 94.6 2.2 159.1 ND 1.3 ND ND NA ND ND ND ____________________________________________________________________________________________________________________________________________________________ alpha- beta- delta- gamma- Hepta- Hepta- Hexa- Methoxy- Ethyl- Methyl- Oxa- PCB PCB PCB Total PCT Tetra- Toxa-Station HCH HCH HCH HCH chlor chlor- chloro- chlor para- para- diazon 1248 1254 1260 PCB 5460 difon pheneNumber (Lindane) epoxide benzene thion thion____________________________________________________________________________________________________________________________________________________________662.0 ND ND ND ND ND ND ND ND ND ND ND 9.5 17.1 ND 26.7 NA ND ND 664.0 ND ND ND ND ND ND ND ND ND ND ND ND 11.2 ND 11.2 NA ND ND 708.0 ND ND ND ND ND ND ND ND ND ND 1.0 4.8 31.0 ND 35.8 NA ND ND 713.0 ND ND ND ND 0.2 0.3 ND ND ND ND 0.3 ND 25.2 ND 25.2 NA ND ND 713.0 ND ND ND ND ND 0.1 ND ND ND ND 0.3 ND 12.9 ND 12.9 NA ND ND 715.0 ND ND ND ND ND 0.1 ND ND ND ND 0.3 ND 22.1 ND 22.1 NA ND ND 715.0 ND ND ND ND ND 0.1 ND ND ND ND 0.5 10.1 22.3 ND 32.3 NA ND 16.0723.4 ND ND ND ND ND ND ND ND ND ND ND ND 19.0 ND 19.0 NA ND ND 724.0 ND ND ND ND ND ND ND ND ND ND 0.9 ND 18.5 ND 18.5 NA ND ND 725.0 ND ND ND ND ND ND ND ND ND ND 0.3 17.9 130.6 ND 148.5 NA ND ND ____________________________________________________________________________________________________________________________________________________________* RCM = Resident California Mussel OYS = Oyster (Crassostrea gigas) NA = Not Analyzed RBM = Resident Bay Mussel (s = small size) GLY = Sand Worm (Glycera spp.) ND = Not Detected TCM = Transplanted California Mussel (a = archive) PAC = Shore Crab (Pachygrapsus crassipes)

M-8
APPENDIX MState Mussel Watch Program
Summary of 1995-97 Data: Organic Chemicals in Mussel, Oyster, Shore Crab, and Sand Worm (ppb, wet weight)____________________________________________________________________________________________________________________________________________________________ Aldrin alpha- cis- gamma- trans- cis- trans- Oxy- Total Chlor- DacthalStation Station Sample Sample Chlor- Chlor- Chlor- Chlor- Nona- Nona- chlor- Chlor- pyrifosNumber Name Type* Date dene dane dene dane chlor chlor dane dane____________________________________________________________________________________________________________________________________________________________725.0 Newport Bay/Crows Nest TCM 01/27/97 ND 0.2 2.2 ND 1.7 1.6 1.8 0.2 7.8 1.1 0.3726.4 Newport Bay/Rhine Channel/End TCM 01/17/96 ND ND 1.4 0.1 1.0 1.3 1.4 0.2 5.4 ND ND 726.4 Newport Bay/Rhine Channel/End TCM 01/27/97 ND ND 1.5 0.1 1.2 1.0 1.2 ND 5.0 0.9 0.6726.6 Newport Bay/Mariners Drive TCM 01/27/97 ND 0.2 2.0 0.1 1.6 1.0 1.8 ND 6.7 1.4 1.0740.0 Dana Point Harbor/Boat Yard TCM 01/27/97 ND ND 0.6 ND 0.6 0.4 0.7 ND 2.3 ND ND 742.0 San Juan Creek RCM 01/18/96 ND ND 0.9 ND 0.8 0.4 1.1 ND 3.3 ND ND 750.0 Oceanside RCM 01/18/96 ND ND 1.5 ND 1.9 ND 1.7 ND 5.1 ND ND 750.0 Oceanside RCM 09/30/96 ND ND 0.4 ND 0.3 ND 0.4 ND 1.0 ND ND 882.7 San Diego Bay/Sampson Street Pier TCM 01/18/96 ND ND 0.6 ND 0.6 0.7 0.6 ND 2.5 ND ND 883.1 San Diego Bay/Chollas Creek TCM 01/18/96 ND ND 1.0 ND 1.2 1.0 1.3 ND 4.5 ND ND ____________________________________________________________________________________________________________________________________________________________ Diaz- o,p' p,p' o,p' p,p' o,p' p,p' p,p' Total Di- Dieldrin Endo- Endo- Endo- Total Endrin EthionStation inon DDD DDD DDE DDE DDT DDT DDMU DDT Chloro- sulfan sulfan sulfan Endo-Number Benzophenone I II sulfate sulfan____________________________________________________________________________________________________________________________________________________________725.0 ND 1.6 5.3 0.9 47.2 0.9 3.0 2.0 60.8 ND 2.1 ND ND ND ND ND ND 726.4 ND 0.7 3.0 ND 25.8 ND 0.4 ND 30.0 ND 0.9 ND ND NA ND ND ND 726.4 ND 0.9 3.0 0.4 24.9 0.6 3.5 0.9 34.1 ND 1.5 ND ND ND ND ND ND 726.6 6.3 1.7 5.5 0.8 31.9 1.5 6.7 1.4 49.4 ND 1.8 ND ND ND ND ND ND 740.0 ND ND ND ND 5.0 ND 0.6 ND 5.6 ND 0.3 1.0 ND ND 1.0 ND ND 742.0 ND ND 0.8 ND 6.1 ND 0.5 ND 7.4 ND ND ND ND NA ND ND ND 750.0 ND 1.8 5.1 1.2 31.3 ND 1.8 1.7 43.0 ND 0.9 ND ND ND ND ND ND 750.0 ND ND 0.7 ND 8.4 ND ND ND 9.1 ND 0.4 ND ND ND ND ND ND 882.7 ND ND 0.5 ND 2.4 ND 0.9 ND 3.8 ND 0.2 ND ND NA ND ND ND 883.1 ND ND 0.6 ND 2.4 ND 0.4 ND 3.4 ND 0.2 ND ND NA ND ND ND ____________________________________________________________________________________________________________________________________________________________ alpha- beta- delta- gamma- Hepta- Hepta- Hexa- Methoxy- Ethyl- Methyl- Oxa- PCB PCB PCB Total PCT Tetra- Toxa-Station HCH HCH HCH HCH chlor chlor- chloro- chlor para- para- diazon 1248 1254 1260 PCB 5460 difon pheneNumber (Lindane) epoxide benzene thion thion____________________________________________________________________________________________________________________________________________________________725.0 ND ND ND ND ND ND ND ND ND ND 1.5 23.1 106.3 2.3 131.7 NA ND 23.3726.4 ND ND ND ND ND ND ND ND ND ND 0.2 10.1 91.9 ND 102.0 NA ND ND 726.4 ND ND ND ND ND ND ND ND ND ND 2.1 9.5 46.8 1.0 57.4 NA ND 23.5726.6 ND ND ND ND ND ND ND ND ND ND 4.6 ND 10.4 ND 10.4 NA ND 31.9740.0 ND ND ND ND ND ND ND ND ND ND 0.8 ND 7.6 ND 7.6 NA ND ND 742.0 ND ND ND ND ND ND ND ND ND ND ND ND 4.9 ND 4.9 NA ND ND 750.0 0.4 ND ND ND ND ND ND ND ND ND ND ND 4.5 ND 4.5 NA ND ND 750.0 ND ND ND ND ND ND ND ND ND ND ND ND ND ND ND NA ND ND 882.7 ND 0.5 0.5 ND ND ND ND ND ND ND ND ND 90.9 ND 90.9 NA ND ND 883.1 ND 1.0 ND ND ND ND ND ND ND ND ND ND 38.7 ND 38.7 NA ND ND ____________________________________________________________________________________________________________________________________________________________* RCM = Resident California Mussel OYS = Oyster (Crassostrea gigas) NA = Not Analyzed RBM = Resident Bay Mussel (s = small size) GLY = Sand Worm (Glycera spp.) ND = Not Detected TCM = Transplanted California Mussel (a = archive) PAC = Shore Crab (Pachygrapsus crassipes)

M-9
APPENDIX MState Mussel Watch Program
Summary of 1995-97 Data: Organic Chemicals in Mussel, Oyster, Shore Crab, and Sand Worm (ppb, wet weight)____________________________________________________________________________________________________________________________________________________________ Aldrin alpha- cis- gamma- trans- cis- trans- Oxy- Total Chlor- DacthalStation Station Sample Sample Chlor- Chlor- Chlor- Chlor- Nona- Nona- chlor- Chlor- pyrifosNumber Name Type* Date dene dane dene dane chlor chlor dane dane____________________________________________________________________________________________________________________________________________________________883.1 San Diego Bay/Chollas Creek TCM 01/28/97 ND 0.2 2.2 0.1 2.0 1.1 1.6 ND 7.2 ND 0.3883.2 San Diego Bay/Chollas Creek/Mouth TCM 01/28/97 ND 0.2 1.8 ND 1.4 1.1 1.4 ND 5.9 ND ND 883.3 San Diego Bay/Chollas Creek/End TCM 01/28/97 ND 0.4 4.4 0.3 3.6 2.1 3.6 0.1 14.5 1.1 ND 883.5 San Diego Bay/Tuna Docks TCM 01/28/97 ND ND 1.7 ND 1.5 1.3 1.0 ND 5.6 0.6 ND 883.6 San Diego Bay/7th Street Channel TCM 01/18/96 ND ND 1.2 ND 1.2 0.1 1.8 ND 4.3 ND ND 883.6 San Diego Bay/7th Street Channel TCM 01/28/97 ND 0.1 1.5 ND 1.4 0.9 0.9 ND 4.8 ND 0.3883.8 San Diego Bay/Switzer Creek TCM 01/18/96 ND ND 1.1 ND 1.0 0.8 1.1 ND 3.9 ND ND 883.8 San Diego Bay/Switzer Creek TCM 01/28/97 ND 0.2 1.7 0.4 1.6 0.7 0.9 ND 5.7 0.4 0.3885.1 San Diego Bay/Paleta Creek/End TCM 01/28/97 ND 0.4 2.7 0.3 2.7 1.6 2.7 ND 10.4 ND ND 885.3 San Diego Bay/7th Street Ch/Mid TCM 01/28/97 ND 0.4 2.3 0.2 2.3 1.5 2.0 ND 8.6 ND ND ____________________________________________________________________________________________________________________________________________________________ Diaz- o,p' p,p' o,p' p,p' o,p' p,p' p,p' Total Di- Dieldrin Endo- Endo- Endo- Total Endrin EthionStation inon DDD DDD DDE DDE DDT DDT DDMU DDT Chloro- sulfan sulfan sulfan Endo-Number Benzophenone I II sulfate sulfan____________________________________________________________________________________________________________________________________________________________883.1 ND ND 0.7 ND 2.9 ND 1.2 ND 4.8 ND 0.8 ND ND ND ND ND ND 883.2 ND ND 0.8 ND 4.4 ND 1.1 ND 6.3 ND 0.6 ND ND ND ND ND ND 883.3 ND ND 1.2 ND 4.5 0.5 2.7 ND 8.8 ND 1.5 ND ND ND ND ND ND 883.5 ND ND 1.1 ND 4.1 ND 1.1 ND 6.3 ND 0.5 ND ND ND ND ND ND 883.6 ND 0.8 1.7 ND 6.9 ND 1.0 ND 10.4 ND ND ND ND NA ND ND ND 883.6 ND ND 0.8 ND 2.5 ND 0.8 ND 4.0 ND 0.5 ND ND ND ND ND ND 883.8 ND ND 0.5 ND 3.0 ND ND ND 3.5 ND 0.3 ND ND NA ND ND ND 883.8 ND ND 0.5 ND 1.5 ND 1.0 ND 3.1 ND 0.6 ND ND ND ND ND ND 885.1 ND 1.5 3.2 ND 7.1 0.6 1.5 ND 13.9 ND 0.9 ND ND ND ND ND ND 885.3 ND 1.3 2.2 ND 7.8 ND 1.1 0.7 13.2 ND 0.9 ND ND ND ND ND ND ____________________________________________________________________________________________________________________________________________________________ alpha- beta- delta- gamma- Hepta- Hepta- Hexa- Methoxy- Ethyl- Methyl- Oxa- PCB PCB PCB Total PCT Tetra- Toxa-Station HCH HCH HCH HCH chlor chlor- chloro- chlor para- para- diazon 1248 1254 1260 PCB 5460 difon pheneNumber (Lindane) epoxide benzene thion thion____________________________________________________________________________________________________________________________________________________________883.1 ND ND ND ND ND ND ND ND ND ND 0.7 ND 30.0 1.3 31.3 NA ND ND 883.2 ND ND ND ND ND ND ND ND ND ND 0.9 9.5 61.4 3.5 74.3 NA ND ND 883.3 ND ND ND ND ND 0.2 ND ND ND ND ND 17.5 46.4 1.8 65.7 NA ND ND 883.5 ND ND ND ND ND ND ND ND ND ND 0.9 6.7 61.6 5.8 74.1 NA ND ND 883.6 ND 0.9 ND ND ND ND ND ND ND ND ND ND 92.5 ND 92.5 NA ND ND 883.6 ND ND ND ND ND ND ND ND ND ND 1.0 ND 50.3 4.6 54.9 NA ND ND 883.8 ND 0.4 ND ND ND ND ND ND ND ND ND ND 32.5 ND 32.5 NA ND ND 883.8 ND ND ND ND ND ND ND ND ND ND 0.4 8.8 25.6 1.8 36.2 NA ND ND 885.1 ND ND ND ND ND ND ND ND ND ND 3.8 25.7 88.5 5.1 119.3 NA ND ND 885.3 ND ND ND ND ND ND ND ND ND ND 2.6 20.8 80.9 1.3 102.9 NA ND ND ____________________________________________________________________________________________________________________________________________________________* RCM = Resident California Mussel OYS = Oyster (Crassostrea gigas) NA = Not Analyzed RBM = Resident Bay Mussel (s = small size) GLY = Sand Worm (Glycera spp.) ND = Not Detected TCM = Transplanted California Mussel (a = archive) PAC = Shore Crab (Pachygrapsus crassipes)

M-10
APPENDIX MState Mussel Watch Program
Summary of 1995-97 Data: Organic Chemicals in Mussel, Oyster, Shore Crab, and Sand Worm (ppb, wet weight)____________________________________________________________________________________________________________________________________________________________ Aldrin alpha- cis- gamma- trans- cis- trans- Oxy- Total Chlor- DacthalStation Station Sample Sample Chlor- Chlor- Chlor- Chlor- Nona- Nona- chlor- Chlor- pyrifosNumber Name Type* Date dene dane dene dane chlor chlor dane dane____________________________________________________________________________________________________________________________________________________________886.0 San Diego Bay/NASSCO TCM 01/18/96 ND ND 1.1 ND 0.9 0.9 1.0 ND 3.9 ND ND 888.0 San Diego Bay/Coronado Bridge RBM 01/28/97 ND ND 0.7 ND 0.6 0.6 0.7 ND 2.6 ND 0.2893.0 San Diego Bay/Laurel Street TCM 01/18/96 ND ND 2.1 ND 2.0 1.3 1.9 ND 7.2 ND ND 893.5 San Diego Bay/B Street Pier TCM 01/18/96 ND ND 1.2 ND 1.0 0.9 1.0 ND 4.1 ND ND 894.0 SD Bay/Harbor Is/E Basin/Storm Dr TCM 01/28/97 ND 0.4 2.8 0.9 2.5 0.9 1.7 ND 9.3 ND 0.4____________________________________________________________________________________________________________________________________________________________ Diaz- o,p' p,p' o,p' p,p' o,p' p,p' p,p' Total Di- Dieldrin Endo- Endo- Endo- Total Endrin EthionStation inon DDD DDD DDE DDE DDT DDT DDMU DDT Chloro- sulfan sulfan sulfan Endo-Number Benzophenone I II sulfate sulfan____________________________________________________________________________________________________________________________________________________________886.0 ND ND 0.8 ND 3.4 ND 0.7 ND 4.9 ND 0.4 ND ND NA ND ND ND 888.0 ND ND 0.5 ND 2.2 ND 0.7 ND 3.4 ND 0.2 ND ND ND ND ND ND 893.0 ND ND 1.1 ND 3.7 ND 0.7 ND 5.5 ND 0.3 ND ND NA ND ND ND 893.5 ND ND 1.2 ND 4.9 ND 0.7 ND 6.8 ND 0.6 ND ND NA ND ND ND 894.0 ND 7.3 22.9 ND 3.7 1.5 0.7 1.0 37.1 ND 0.7 ND ND ND ND ND ND ____________________________________________________________________________________________________________________________________________________________ alpha- beta- delta- gamma- Hepta- Hepta- Hexa- Methoxy- Ethyl- Methyl- Oxa- PCB PCB PCB Total PCT Tetra- Toxa-Station HCH HCH HCH HCH chlor chlor- chloro- chlor para- para- diazon 1248 1254 1260 PCB 5460 difon pheneNumber (Lindane) epoxide benzene thion thion____________________________________________________________________________________________________________________________________________________________886.0 ND 0.5 ND ND ND ND ND ND ND ND ND ND 59.5 ND 59.5 NA ND ND 888.0 ND ND ND ND ND ND ND ND ND ND 0.6 12.2 35.1 1.4 48.7 NA ND ND 893.0 ND ND ND ND ND ND ND ND ND ND 1.4 14.4 96.7 ND 111.1 NA ND ND 893.5 ND ND ND ND ND ND ND ND ND ND ND ND 60.8 ND 60.8 NA ND ND 894.0 ND ND ND ND ND ND 0.2 ND ND ND 2.7 5617.2 1082.5 41.9 6741.6 NA ND ND ____________________________________________________________________________________________________________________________________________________________* RCM = Resident California Mussel OYS = Oyster (Crassostrea gigas) NA = Not Analyzed RBM = Resident Bay Mussel (s = small size) GLY = Sand Worm (Glycera spp.) ND = Not Detected TCM = Transplanted California Mussel (a = archive) PAC = Shore Crab (Pachygrapsus crassipes)

N-1
APPENDIX N
Summary of 1995-97 Data
Organic Chemicals in Mussel, Oyster, Shore Crab,
and Sand Worm
(ppb, dry weight)

N-2
APPENDIX NState Mussel Watch Program
Summary of 1995-97 Data: Organic Chemicals in Mussel, Oyster, Shore Crab, and Sand Worm (ppb, dry weight)____________________________________________________________________________________________________________________________________________________________ Aldrin alpha- cis- gamma- trans- cis- trans- Oxy- Total Chlor- DacthalStation Station Sample Sample Chlor- Chlor- Chlor- Chlor- Nona- Nona- chlor- Chlor- pyrifosNumber Name Type* Date dene dane dene dane chlor chlor dane dane____________________________________________________________________________________________________________________________________________________________ 1.0 Crescent City Harbor RCM 04/09/97 ND ND 3.5 2.5 2.1 ND 2.2 ND 10.3 ND ND 2.0 Crescent City/STP Outfall RCM 04/09/97 ND ND 4.2 ND 6.7 ND 2.6 ND 13.4 ND ND 2.2 Crescent City Harbor/Inner Jetty RCM 04/09/97 ND ND 3.3 1.6 3.0 ND 1.6 ND 9.6 ND ND 3.0 Crescent City/Control RCM 04/10/97 ND ND 1.4 ND 1.1 ND ND ND 2.5 ND ND 100.0 Mad River Slough OYS 04/10/97 ND ND 1.8 ND 1.7 ND ND ND 3.5 ND 2.3101.4 Arcata Bay/Jolly Giant Slough PAC 04/18/96 ND ND ND ND ND ND 2.6 2.1 4.7 ND ND 101.8 Humboldt Bay/Halberson Shoreline PAC 04/17/96 ND ND ND ND ND ND 3.3 2.6 5.9 ND ND 101.8 Humboldt Bay/Halberson Shoreline RBM-s 04/17/96 ND ND ND ND ND ND ND ND ND ND ND 101.8 Humboldt Bay/Halberson Shoreline GLY 04/17/96 ND ND 1.9 ND 1.3 ND 2.9 ND 6.1 ND ND 102.6 Humboldt Bay/J Street GLY 04/17/96 ND ND 1.0 ND ND 3.9 5.6 ND 10.5 5.8 ND ____________________________________________________________________________________________________________________________________________________________ Diaz- o,p' p,p' o,p' p,p' o,p' p,p' p,p' Total Di- Dieldrin Endo- Endo- Endo- Total Endrin EthionStation inon DDD DDD DDE DDE DDT DDT DDMU DDT Chloro- sulfan sulfan sulfan Endo-Number Benzophenone I II sulfate sulfan____________________________________________________________________________________________________________________________________________________________ 1.0 ND ND ND ND 9.1 ND ND ND 9.1 ND ND ND ND ND ND ND ND 2.0 ND ND ND ND 14.5 ND 3.1 ND 17.6 ND 2.5 ND ND ND ND ND ND 2.2 ND ND ND ND 5.4 ND ND ND 5.4 ND 3.6 ND ND ND ND ND ND 3.0 ND ND ND ND ND ND ND ND ND ND 2.4 ND ND ND ND ND ND 100.0 ND ND ND ND ND ND ND ND ND ND 1.2 ND ND ND ND ND ND 101.4 NA ND ND ND 1.4 ND ND ND 1.4 ND 2.8 ND ND ND ND ND NA 101.8 NA ND ND ND ND ND ND ND ND ND ND ND ND ND ND ND NA 101.8 NA ND ND ND 3.0 ND ND ND 3.0 ND ND ND ND ND ND ND NA 101.8 NA ND ND ND 1.6 ND ND ND 1.6 ND 2.6 ND ND ND ND ND NA 102.6 NA ND ND ND ND ND ND ND ND ND 4.1 ND ND ND ND ND NA ____________________________________________________________________________________________________________________________________________________________ alpha- beta- delta- gamma- Hepta- Hepta- Hexa- Meth- Ethyl- Methyl- Oxa- PCB PCB PCB Total PCT Tetra- Toxa-Station HCH HCH HCH HCH chlor chlor- chloro- oxy- para- para- diazon 1248 1254 1260 PCB 5460 difon pheneNumber (Lindane) epoxide benzene chlor thion thion____________________________________________________________________________________________________________________________________________________________ 1.0 ND ND ND ND ND ND ND ND ND ND ND ND 32.7 ND 32.7 NA ND ND 2.0 1.3 ND ND 1.4 ND ND ND ND ND ND ND ND 11.0 ND 11.0 NA ND ND 2.2 1.4 ND ND ND ND ND ND ND ND ND ND ND 33.5 ND 33.5 NA ND ND 3.0 1.7 ND ND ND ND ND ND ND ND ND ND ND ND ND ND NA ND ND 100.0 1.0 ND ND ND ND ND ND ND ND ND ND ND 23.2 ND 23.2 NA ND ND 101.4 ND ND ND ND ND ND ND ND NA NA NA ND ND ND ND ND NA ND 101.8 ND ND ND ND ND ND ND ND NA NA NA ND ND ND ND ND NA ND 101.8 ND ND ND ND ND ND ND ND NA NA NA ND ND ND ND ND NA ND 101.8 ND ND ND ND ND ND ND ND NA NA NA ND ND ND ND ND NA ND 102.6 ND ND ND ND ND ND ND ND NA NA NA ND ND ND ND ND NA ND ____________________________________________________________________________________________________________________________________________________________* RCM = Resident California Mussel OYS = Oyster (Crassostrea gigas) NA = Not Analyzed RBM = Resident Bay Mussel (s = small size) GLY = Sand Worm (Glycera spp.) ND = Not Detected TCM = Transplanted California Mussel (a = archive) PAC = Shore Crab (Pachygrapsus crassipes)

N-3
APPENDIX NState Mussel Watch Program
Summary of 1995-97 Data: Organic Chemicals in Mussel, Oyster, Shore Crab, and Sand Worm (ppb, dry weight)____________________________________________________________________________________________________________________________________________________________ Aldrin alpha- cis- gamma- trans- cis- trans- Oxy- Total Chlor- DacthalStation Station Sample Sample Chlor- Chlor- Chlor- Chlor- Nona- Nona- chlor- Chlor- pyrifosNumber Name Type* Date dene dane dene dane chlor chlor dane dane____________________________________________________________________________________________________________________________________________________________102.6 Humboldt Bay/J Street PAC 04/17/96 ND ND ND ND ND ND ND 5.7 5.7 ND ND 102.6 Humboldt Bay/J Street RBM 04/17/96 ND ND ND ND ND ND ND ND ND ND ND 102.6 Humboldt Bay/J Street TCM 04/10/97 ND ND 2.5 1.3 2.1 ND 1.4 ND 7.2 ND ND 102.7 Humboldt Bay/H Street RBM-s 04/17/96 ND ND ND ND ND ND ND ND ND ND ND 102.7 Humboldt Bay/H Street GLY 04/17/96 ND ND 3.1 ND ND 2.7 7.9 ND 13.7 ND ND 102.7 Humboldt Bay/H Street PAC 04/17/96 ND ND ND ND ND ND ND 1.8 1.8 ND ND 103.3 Humboldt Bay/E Street TCM 04/10/97 ND ND 2.2 ND 1.5 ND ND ND 3.7 ND ND 103.5 Humboldt Bay/Clark Slough TCM 04/10/97 ND ND 2.3 ND 2.2 ND 1.2 ND 5.7 ND ND 202.0 Bodega Head RCM 09/11/95 ND ND ND ND ND ND ND ND ND ND ND 202.0 Bodega Head RCM 08/29/96 ND ND ND ND ND ND ND ND ND ND ND ____________________________________________________________________________________________________________________________________________________________ Diaz- o,p' p,p' o,p' p,p' o,p' p,p' p,p' Total Di- Dieldrin Endo- Endo- Endo- Total Endrin EthionStation inon DDD DDD DDE DDE DDT DDT DDMU DDT Chloro- sulfan sulfan sulfan Endo-Number Benzophenone I II sulfate sulfan____________________________________________________________________________________________________________________________________________________________102.6 NA ND ND ND 7.5 ND ND ND 7.5 ND 1.7 ND ND ND ND ND NA 102.6 NA ND ND ND 4.5 ND ND ND 4.5 ND ND ND ND ND ND ND NA 102.6 ND ND ND ND 3.7 ND ND ND 3.7 ND 4.1 ND ND ND ND ND ND 102.7 NA ND ND ND 3.3 ND ND ND 3.3 ND ND ND ND ND ND ND NA 102.7 NA ND 7.5 ND 63.1 ND ND ND 70.6 ND 2.3 ND ND ND ND ND NA 102.7 NA ND ND ND 10.7 ND ND ND 10.7 ND 1.6 ND ND ND ND ND NA 103.3 ND ND ND ND 4.5 ND 1.0 ND 5.5 ND 3.4 ND ND ND ND ND ND 103.5 ND ND ND ND 3.0 ND ND ND 3.0 ND 2.5 ND ND ND ND ND ND 202.0 ND ND ND ND 7.5 ND ND ND 7.5 ND 2.1 ND ND NA ND ND ND 202.0 ND ND ND ND 5.5 ND ND ND 5.5 ND 3.9 ND ND ND ND ND ND ____________________________________________________________________________________________________________________________________________________________ alpha- beta- delta- gamma- Hepta- Hepta- Hexa- Meth- Ethyl- Methyl- Oxa- PCB PCB PCB Total PCT Tetra- Toxa-Station HCH HCH HCH HCH chlor chlor- chloro- oxy- para- para- diazon 1248 1254 1260 PCB 5460 difon pheneNumber (Lindane) epoxide benzene chlor thion thion____________________________________________________________________________________________________________________________________________________________102.6 ND ND ND ND ND ND 2.5 ND NA NA NA ND ND ND ND ND NA ND 102.6 ND ND ND ND ND ND ND ND NA NA NA ND 85.0 ND 85.0 ND NA ND 102.6 1.0 ND ND ND ND ND ND ND ND ND ND ND 21.9 ND 21.9 NA ND ND 102.7 ND ND ND ND ND ND ND ND NA NA NA ND 570.0 ND 570.0 ND NA ND 102.7 ND ND ND ND ND ND ND ND NA NA NA ND 320.0 170.0 490.0 ND NA ND 102.7 ND ND ND ND ND ND ND ND NA NA NA ND ND 190.0 190.0 ND NA ND 103.3 1.1 ND ND ND ND ND ND ND ND ND ND ND 25.9 ND 25.9 NA ND ND 103.5 ND ND ND ND ND ND ND ND ND ND ND ND 29.5 ND 29.5 NA ND ND 202.0 3.7 ND ND ND ND ND ND ND ND ND ND ND 11.8 ND 11.8 NA ND ND 202.0 2.2 ND ND ND ND ND ND ND ND ND ND ND 29.3 ND 29.3 NA ND ND ____________________________________________________________________________________________________________________________________________________________* RCM = Resident California Mussel OYS = Oyster (Crassostrea gigas) NA = Not Analyzed RBM = Resident Bay Mussel (s = small size) GLY = Sand Worm (Glycera spp.) ND = Not Detected TCM = Transplanted California Mussel (a = archive) PAC = Shore Crab (Pachygrapsus crassipes)

N-4
APPENDIX NState Mussel Watch Program
Summary of 1995-97 Data: Organic Chemicals in Mussel, Oyster, Shore Crab, and Sand Worm (ppb, dry weight)
____________________________________________________________________________________________________________________________________________________________ Aldrin alpha- cis- gamma- trans- cis- trans- Oxy- Total Chlor- DacthalStation Station Sample Sample Chlor- Chlor- Chlor- Chlor- Nona- Nona- chlor- Chlor- pyrifosNumber Name Type* Date dene dane dene dane chlor chlor dane dane____________________________________________________________________________________________________________________________________________________________205.0 Bodega Harbor/Spud Point Marina TCM 03/21/97 ND 1.3 4.0 1.3 2.9 ND 2.0 ND 11.5 ND ND 205.1 Bodega Bay/Porto Bodega RBM 03/21/97 ND ND 2.2 ND 2.2 ND 1.7 ND 6.2 ND 2.2205.3 Bodega Bay/Mason's Marina TCM 03/21/97 ND ND 1.4 ND 1.3 ND ND ND 2.7 ND ND 205.5 Bodega Bay/Back Marsh RBM 03/21/97 ND ND 1.0 ND 1.0 ND ND ND 2.0 ND ND 280.0 Russian River/S Goat Rock RCM 03/21/97 ND ND 3.4 ND 2.3 ND 1.4 ND 7.0 ND ND 307.0 San Francisco Bay/Treasure Is TCM-a 01/26/81 ND 2.1 23.4 3.1 22.3 8.6 17.0 ND 76.5 ND 2.3307.0 San Francisco Bay/Treasure Is TCM-a 02/02/82 ND 2.1 22.3 2.7 19.1 8.4 15.0 ND 69.6 ND ND 308.0 San Francisco Bay/Hunter's Point TCM-a 01/26/81 ND 1.3 25.9 1.8 22.9 9.4 13.6 1.2 76.0 ND ND 309.0 San Mateo Bridge/8B TCM-a 02/09/81 ND 1.6 28.2 2.5 22.8 10.4 19.1 1.4 86.0 ND 4.3313.0 San Francisco Bay/near Redwood Cr TCM-a 01/26/81 ND 1.7 32.8 1.5 28.2 10.8 19.9 1.6 96.5 ND 2.8____________________________________________________________________________________________________________________________________________________________ Diaz- o,p' p,p' o,p' p,p' o,p' p,p' p,p' Total Di- Dieldrin Endo- Endo- Endo- Total Endrin EthionStation inon DDD DDD DDE DDE DDT DDT DDMU DDT Chloro- sulfan sulfan sulfan Endo-Number Benzophenone I II sulfate sulfan____________________________________________________________________________________________________________________________________________________________205.0 ND ND ND ND 10.7 ND ND ND 10.7 ND 2.9 ND ND ND ND ND ND 205.1 ND ND ND ND 16.7 ND ND ND 16.7 ND ND ND ND ND ND ND ND 205.3 ND ND ND ND 9.4 ND ND ND 9.4 ND 2.9 ND ND ND ND ND ND 205.5 ND ND ND ND 5.2 ND ND ND 5.2 ND ND ND ND ND ND ND ND 280.0 ND ND ND ND 11.2 ND 5.3 ND 16.5 ND 6.4 ND ND ND ND ND ND 307.0 ND 17.9 60.5 4.2 58.5 4.1 9.9 12.3 167.4 ND 30.0 0.7 ND ND 0.7 ND ND 307.0 ND 15.2 46.4 3.5 46.9 5.8 12.5 11.3 141.6 ND 44.5 ND 3.8 ND 3.8 ND ND 308.0 ND 14.0 39.2 ND 53.5 ND 11.0 9.9 127.6 ND 51.5 2.3 ND ND 2.3 ND ND 309.0 ND 9.9 27.3 ND 43.3 ND 11.5 6.8 98.8 ND 62.1 2.5 ND ND 2.5 ND ND 313.0 ND 8.4 21.7 ND 37.3 ND 10.3 7.4 85.1 ND 65.9 2.6 ND ND 2.6 ND ND ____________________________________________________________________________________________________________________________________________________________ alpha- beta- delta- gamma- Hepta- Hepta- Hexa- Meth- Ethyl- Methyl- Oxa- PCB PCB PCB Total PCT Tetra- Toxa-Station HCH HCH HCH HCH chlor chlor- chloro- oxy- para- para- diazon 1248 1254 1260 PCB 5460 difon pheneNumber (Lindane) epoxide benzene chlor thion thion____________________________________________________________________________________________________________________________________________________________205.0 ND ND ND ND ND ND 1.0 ND ND ND ND ND 59.7 14.6 74.3 NA ND ND 205.1 ND ND ND ND ND ND ND ND ND ND ND ND 105.0 ND 105.0 NA ND ND 205.3 ND ND ND ND ND ND ND ND ND ND ND ND 31.2 ND 31.2 NA ND ND 205.5 ND ND ND ND ND ND ND ND ND ND ND ND ND ND ND NA ND ND 280.0 1.4 ND ND ND ND ND ND ND ND ND ND ND ND ND ND NA ND ND 307.0 3.0 ND ND 2.9 ND 0.9 ND 1.7 ND ND ND 124.0 522.0 25.4 671.4 NA ND 106.0307.0 3.5 ND ND 2.9 ND 1.9 ND ND ND ND ND 127.0 486.0 22.1 635.1 NA ND 193.0308.0 2.5 ND ND ND ND 1.3 ND ND ND ND ND 71.5 404.0 30.7 506.2 NA ND 126.0309.0 1.9 ND ND 2.9 ND 2.0 ND 1.2 ND ND ND 69.4 353.0 32.0 454.4 NA ND 111.0313.0 1.7 ND ND 3.1 ND 1.8 1.0 2.0 ND ND ND 54.8 308.0 22.1 384.9 NA ND 106.0____________________________________________________________________________________________________________________________________________________________* RCM = Resident California Mussel OYS = Oyster (Crassostrea gigas) NA = Not Analyzed RBM = Resident Bay Mussel (s = small size) GLY = Sand Worm (Glycera spp.) ND = Not Detected TCM = Transplanted California Mussel (a = archive) PAC = Shore Crab (Pachygrapsus crassipes)

N-5
APPENDIX NState Mussel Watch Program
Summary of 1995-97 Data: Organic Chemicals in Mussel, Oyster, Shore Crab, and Sand Worm (ppb, dry weight)____________________________________________________________________________________________________________________________________________________________ Aldrin alpha- cis- gamma- trans- cis- trans- Oxy- Total Chlor- DacthalStation Station Sample Sample Chlor- Chlor- Chlor- Chlor- Nona- Nona- chlor- Chlor- pyrifosNumber Name Type* Date dene dane dene dane chlor chlor dane dane____________________________________________________________________________________________________________________________________________________________321.0 Dumbarton Bridge/Channel Marker 14 TCM-a 02/09/81 5.8 3.3 39.9 3.9 31.4 14.6 25.2 1.4 119.7 ND 8.3400.6 Santa Cruz/Natural Bridges RCM 06/09/97 ND ND 4.3 ND 3.8 1.0 3.6 ND 12.7 ND ND 400.7 Santa Cruz Harbor/Inner TCM 03/25/96 ND ND 31.9 ND 25.2 13.1 23.2 2.1 95.5 1.4 ND 401.0 Santa Cruz Harbor TCM 03/25/96 ND ND 22.0 ND 18.3 10.0 18.4 1.6 70.3 ND ND 403.0 Elkhorn Slough/Highway 1 Bridge TCM 03/12/97 ND ND 8.2 ND 7.7 2.7 4.8 ND 23.4 ND 4.1404.0 Sandholdt Bridge TCM 02/16/96 ND ND 33.8 ND 29.1 16.7 29.2 ND 108.8 14.1 47.4404.0 Sandholdt Bridge TCM 03/04/97 ND 2.2 38.2 ND 32.9 19.0 38.7 ND 131.0 9.5 23.8414.0 Pacific Grove RCM 03/07/96 ND ND 3.6 ND 3.1 ND 1.9 ND 8.7 ND ND 414.0 Pacific Grove RCM 04/25/97 ND ND 2.6 ND ND ND 1.5 ND 4.1 ND 2.6601.0 LA Harbor/National Steel TCM 01/18/96 ND ND 15.1 ND 14.2 8.6 13.3 ND 51.2 ND ND ____________________________________________________________________________________________________________________________________________________________ Diaz- o,p' p,p' o,p' p,p' o,p' p,p' p,p' Total Di- Dieldrin Endo- Endo- Endo- Total Endrin EthionStation inon DDD DDD DDE DDE DDT DDT DDMU DDT Chloro- sulfan sulfan sulfan Endo-Number Benzophenone I II sulfate sulfan____________________________________________________________________________________________________________________________________________________________321.0 ND 11.0 28.4 ND 51.8 ND 11.6 8.2 111.0 ND 65.8 4.6 ND 2.3 6.9 2.4 ND 400.6 ND ND 6.7 ND 50.7 ND 16.2 ND 73.6 ND 13.4 ND ND ND ND ND ND 400.7 ND ND 7.1 ND 30.6 ND 16.1 ND 53.8 ND 25.2 ND ND NA ND ND ND 401.0 ND ND 11.3 ND 48.9 ND 20.7 ND 80.9 ND 12.0 ND ND NA ND ND ND 403.0 ND 11.7 34.2 3.9 253.0 25.1 78.4 6.3 412.6 ND 43.6 ND ND ND ND ND ND 404.0 ND 88.9 264.0 45.0 1870.0 98.8 756.0 55.5 3178.2 ND 231.0 3.7 10.2 ND 13.9 28.7 ND 404.0 ND 89.8 384.0 38.2 2030.0 214.0 785.0 43.8 3584.8 ND 238.0 2.8 10.9 ND 13.7 18.7 ND 414.0 ND ND 5.5 ND 37.4 ND 10.9 ND 53.8 ND 9.6 ND ND NA ND ND ND 414.0 ND ND ND ND 22.4 ND 6.4 ND 28.8 ND 7.7 ND ND ND ND ND ND 601.0 ND 17.4 62.6 30.0 246.0 ND 14.1 19.6 389.7 ND 4.1 ND ND NA ND ND ND ____________________________________________________________________________________________________________________________________________________________ alpha- beta- delta- gamma- Hepta- Hepta- Hexa- Meth- Ethyl- Methyl- Oxa- PCB PCB PCB Total PCT Tetra- Toxa-Station HCH HCH HCH HCH chlor chlor- chloro- oxy- para- para- diazon 1248 1254 1260 PCB 5460 difon pheneNumber (Lindane) epoxide benzene chlor thion thion____________________________________________________________________________________________________________________________________________________________321.0 2.5 ND ND 6.8 ND 2.9 1.4 1.4 ND ND 2.7 169.0 475.0 24.0 668.0 NA ND 120.0400.6 ND ND ND ND ND ND ND ND ND ND ND ND 18.7 ND 18.7 NA ND ND 400.7 ND ND ND ND ND ND ND ND ND ND 2.4 ND 50.7 ND 50.7 NA ND ND 401.0 ND ND ND ND ND ND ND ND ND ND ND ND 109.0 ND 109.0 NA ND ND 403.0 ND ND ND ND ND ND ND ND 10.0 ND ND ND 89.3 10.5 99.8 NA ND 261.0404.0 ND ND ND ND ND 3.4 ND ND ND ND 7.2 ND 246.0 ND 246.0 NA ND 1670.0404.0 ND ND ND ND ND 1.1 ND ND ND ND ND ND 243.0 34.4 277.4 NA ND 1970.0414.0 1.7 ND ND ND ND ND ND ND ND ND ND ND 15.9 ND 15.9 NA ND ND 414.0 ND ND ND ND ND ND ND ND ND ND ND 66.4 ND ND 66.4 NA ND ND 601.0 ND ND ND ND ND ND ND ND ND ND ND 67.5 436.0 ND 503.5 NA ND ND ____________________________________________________________________________________________________________________________________________________________* RCM = Resident California Mussel OYS = Oyster (Crassostrea gigas) NA = Not Analyzed RBM = Resident Bay Mussel (s = small size) GLY = Sand Worm (Glycera spp.) ND = Not Detected TCM = Transplanted California Mussel (a = archive) PAC = Shore Crab (Pachygrapsus crassipes)

N-6
APPENDIX NState Mussel Watch Program
Summary of 1995-97 Data: Organic Chemicals in Mussel, Oyster, Shore Crab, and Sand Worm (ppb, dry weight)____________________________________________________________________________________________________________________________________________________________ Aldrin alpha- cis- gamma- trans- cis- trans- Oxy- Total Chlor- DacthalStation Station Sample Sample Chlor- Chlor- Chlor- Chlor- Nona- Nona- chlor- Chlor- pyrifosNumber Name Type* Date dene dane dene dane chlor chlor dane dane____________________________________________________________________________________________________________________________________________________________601.0 LA Harbor/National Steel TCM 01/28/97 ND 1.3 14.6 ND 11.6 5.9 7.4 ND 40.8 ND ND 605.0 LA Harbor/Cabrillo Pier TCM 01/18/96 ND ND 9.6 ND 8.7 3.9 7.0 ND 29.2 ND ND 616.0 LA Harbor/Consolidated Slip TCM 01/18/96 ND 1.0 18.1 1.3 18.0 9.9 18.8 1.1 68.1 ND ND 616.0 LA Harbor/Consolidated Slip TCM 01/28/97 ND 1.3 23.3 ND 19.2 10.4 15.5 ND 69.7 ND 2.6618.0 LA Harbor/Angels Gate RCM 01/18/96 ND ND 9.8 ND 10.1 4.6 9.2 ND 33.6 ND ND 648.0 Malibu RBM 01/17/96 ND ND 13.7 1.3 12.1 3.6 11.1 ND 41.8 ND ND 648.0 Malibu RCM 11/25/96 ND ND 3.8 ND 3.3 1.6 4.8 ND 13.6 ND ND 650.0 Santa Monica RBM 01/17/96 ND ND 12.3 1.4 14.5 ND 16.7 ND 44.9 ND ND 650.0 Santa Monica RCM 11/25/96 ND ND 7.1 ND 6.4 2.7 5.8 ND 22.1 ND ND 662.0 Royal Palms RCM 01/18/96 ND ND 5.5 ND 5.3 1.1 3.1 ND 15.0 ND ND ____________________________________________________________________________________________________________________________________________________________ Diaz- o,p' p,p' o,p' p,p' o,p' p,p' p,p' Total Di- Dieldrin Endo- Endo- Endo- Total Endrin EthionStation inon DDD DDD DDE DDE DDT DDT DDMU DDT Chloro- sulfan sulfan sulfan Endo-Number Benzophenone I II sulfate sulfan____________________________________________________________________________________________________________________________________________________________601.0 ND 13.3 45.2 17.8 258.0 5.3 23.3 18.9 381.8 ND 6.6 ND ND ND ND ND ND 605.0 ND 12.8 38.7 80.1 554.0 ND 11.5 51.4 748.5 ND 4.3 ND ND NA ND ND ND 616.0 ND 22.0 80.0 18.4 198.0 ND 19.5 11.7 349.6 ND 3.6 ND ND NA ND ND ND 616.0 ND 20.0 63.0 8.2 272.0 4.2 39.6 15.8 422.8 ND 7.7 ND ND ND ND ND ND 618.0 69.0 20.4 56.0 101.0 891.0 ND 19.7 101.0 1189.1 ND 1.7 ND ND NA ND ND ND 648.0 ND 7.1 17.8 16.8 162.0 ND 6.9 23.6 234.2 ND 1.0 ND ND NA ND ND ND 648.0 ND ND 5.3 6.7 58.7 ND ND 9.8 80.4 ND 1.9 ND ND ND ND ND ND 650.0 ND 8.4 22.0 20.5 200.0 ND 4.1 31.1 286.0 ND 2.1 ND ND NA ND ND ND 650.0 ND ND 6.6 4.3 52.7 ND ND 8.8 72.4 ND 3.8 ND ND ND ND ND ND 662.0 ND 13.2 39.7 55.1 530.0 ND 10.8 54.4 703.2 ND 2.7 ND ND NA ND ND ND ____________________________________________________________________________________________________________________________________________________________ alpha- beta- delta- gamma- Hepta- Hepta- Hexa- Meth- Ethyl- Methyl- Oxa- PCB PCB PCB Total PCT Tetra- Toxa-Station HCH HCH HCH HCH chlor chlor- chloro- oxy- para- para- diazon 1248 1254 1260 PCB 5460 difon pheneNumber (Lindane) epoxide benzene chlor thion thion____________________________________________________________________________________________________________________________________________________________601.0 ND ND ND ND ND ND ND ND ND ND 10.0 272.0 893.0 34.7 1199.7 NA ND 107.0605.0 ND ND ND ND ND ND ND ND ND ND ND 60.5 259.0 ND 319.5 NA ND ND 616.0 ND ND ND ND ND ND ND ND ND ND 3.2 74.1 576.0 ND 650.1 NA ND ND 616.0 ND ND ND ND ND ND ND ND ND ND 25.3 54.9 372.0 26.8 453.7 NA ND 342.0618.0 ND ND ND ND ND ND ND ND ND ND ND 60.2 584.0 ND 644.2 NA ND ND 648.0 1.0 ND ND ND ND ND ND ND ND ND ND ND 73.0 ND 73.0 NA ND ND 648.0 ND ND ND ND ND ND ND ND ND ND ND ND 43.4 ND 43.4 NA ND ND 650.0 1.5 ND ND ND ND ND ND ND ND ND 2.3 ND 110.0 ND 110.0 NA ND ND 650.0 ND ND ND ND ND ND ND ND ND ND ND ND 51.9 11.3 63.2 NA ND ND 662.0 ND ND ND ND ND ND ND ND ND ND ND ND 99.3 ND 99.3 NA ND ND ____________________________________________________________________________________________________________________________________________________________* RCM = Resident California Mussel OYS = Oyster (Crassostrea gigas) NA = Not Analyzed RBM = Resident Bay Mussel (s = small size) GLY = Sand Worm (Glycera spp.) ND = Not Detected TCM = Transplanted California Mussel (a = archive) PAC = Shore Crab (Pachygrapsus crassipes)

N-7
APPENDIX NState Mussel Watch Program
Summary of 1995-97 Data: Organic Chemicals in Mussel, Oyster, Shore Crab, and Sand Worm (ppb, dry weight)____________________________________________________________________________________________________________________________________________________________ Aldrin alpha- cis- gamma- trans- cis- trans- Oxy- Total Chlor- DacthalStation Station Sample Sample Chlor- Chlor- Chlor- Chlor- Nona- Nona- chlor- Chlor- pyrifosNumber Name Type* Date dene dane dene dane chlor chlor dane dane____________________________________________________________________________________________________________________________________________________________662.0 Royal Palms RCM 11/25/96 ND ND 2.5 ND 3.0 ND 2.1 ND 7.5 ND ND 664.0 Cabrillo Beach RCM 01/18/96 ND ND 3.8 ND 4.1 ND 2.4 ND 10.3 ND ND 708.0 Anaheim Bay/Navy Marsh TCM 01/27/97 ND 1.4 15.3 1.1 10.8 7.7 14.7 ND 51.0 9.2 ND 713.0 Huntington Harbour/Edinger Street TCM 01/17/96 ND 2.5 35.6 1.8 34.5 16.4 32.6 1.2 124.6 5.4 ND 713.0 Huntington Harbour/Edinger Street TCM 01/27/97 ND 1.6 23.7 1.1 20.6 10.1 19.5 1.1 77.7 9.4 ND 715.0 Huntington Harbour/Warner Ave Brdg TCM 01/17/96 ND 2.0 30.6 1.5 30.5 18.3 30.0 1.4 114.3 4.9 ND 715.0 Huntington Harbour/Warner Ave Brdg TCM 01/27/97 ND 2.7 24.2 2.3 22.1 13.4 21.1 ND 85.8 14.7 2.4723.4 Newport Bay/Turning Basin TCM 01/17/96 ND ND 19.2 ND 14.1 10.0 16.8 1.9 62.0 ND ND 724.0 Newport Bay/Highway 1 Bridge TCM 01/17/96 ND 1.3 25.0 1.1 19.6 13.4 21.1 1.1 82.6 ND 2.3725.0 Newport Bay/Crows Nest TCM 01/17/96 ND 1.3 23.0 1.6 15.7 14.2 20.2 2.9 78.9 ND ND ____________________________________________________________________________________________________________________________________________________________ Diaz- o,p' p,p' o,p' p,p' o,p' p,p' p,p' Total Di- Dieldrin Endo- Endo- Endo- Total Endrin EthionStation inon DDD DDD DDE DDE DDT DDT DDMU DDT Chloro- sulfan sulfan sulfan Endo-Number Benzophenone I II sulfate sulfan____________________________________________________________________________________________________________________________________________________________662.0 ND 6.0 18.3 33.8 442.0 ND 4.8 38.0 542.9 ND 2.8 ND ND ND ND ND ND 664.0 ND 7.4 26.5 41.6 365.0 ND 8.3 48.4 497.2 ND 2.3 ND ND NA ND ND ND 708.0 ND 11.8 25.4 16.9 281.0 4.1 17.0 21.9 378.0 ND 7.7 ND ND ND ND ND ND 713.0 ND 34.2 61.2 13.0 260.0 4.6 19.1 16.0 408.1 ND 11.2 ND ND NA ND ND ND 713.0 ND 13.0 28.5 5.6 195.0 5.5 42.6 10.7 300.9 ND 12.2 ND ND ND ND ND ND 715.0 ND 18.8 39.5 6.1 247.0 ND 6.3 10.1 327.8 ND 8.5 ND ND NA ND ND ND 715.0 ND 11.1 20.7 5.2 185.0 4.5 13.7 10.2 250.4 ND 12.6 ND ND ND ND ND ND 723.4 ND 7.0 28.7 3.1 186.0 ND 4.0 6.5 235.3 ND 8.4 ND ND NA ND ND ND 724.0 ND 17.1 72.3 13.4 514.0 ND 10.8 20.6 648.2 ND 10.5 ND ND NA ND ND ND 725.0 ND 13.4 52.0 8.8 413.0 ND 739.0 17.0 1243.2 ND 10.2 ND ND NA ND ND ND ____________________________________________________________________________________________________________________________________________________________ alpha- beta- delta- gamma- Hepta- Hepta- Hexa- Meth- Ethyl- Methyl- Oxa- PCB PCB PCB Total PCT Tetra- Toxa-Station HCH HCH HCH HCH chlor chlor- chloro- oxy- para- para- diazon 1248 1254 1260 PCB 5460 difon pheneNumber (Lindane) epoxide benzene chlor thion thion____________________________________________________________________________________________________________________________________________________________662.0 ND ND ND ND ND ND ND ND ND ND ND 71.0 128.0 ND 199.0 NA ND ND 664.0 ND ND ND ND ND ND ND ND ND ND ND ND 77.2 ND 77.2 NA ND ND 708.0 ND ND ND ND ND ND ND ND ND ND 5.6 27.1 175.0 ND 202.1 NA ND ND 713.0 ND ND ND ND 1.7 1.9 ND ND ND ND 2.5 ND 194.0 ND 194.0 NA ND ND 713.0 ND ND ND ND ND 1.0 ND ND ND ND 3.2 ND 117.0 ND 117.0 NA ND ND 715.0 ND ND ND ND ND 1.1 ND ND ND ND 2.1 ND 183.0 ND 183.0 NA ND ND 715.0 ND ND ND ND ND 1.0 ND ND ND ND 4.5 89.3 197.0 ND 286.3 NA ND 142.0723.4 ND ND ND ND ND ND ND ND ND ND ND ND 196.0 ND 196.0 NA ND ND 724.0 ND ND ND ND ND ND ND ND ND ND 8.0 ND 165.0 ND 165.0 NA ND ND 725.0 ND ND ND ND ND ND ND ND ND ND 2.4 140.0 1020.0 ND 1160.0 NA ND ND ____________________________________________________________________________________________________________________________________________________________* RCM = Resident California Mussel OYS = Oyster (Crassostrea gigas) NA = Not Analyzed RBM = Resident Bay Mussel (s = small size) GLY = Sand Worm (Glycera spp.) ND = Not Detected TCM = Transplanted California Mussel (a = archive) PAC = Shore Crab (Pachygrapsus crassipes)

N-8
APPENDIX NState Mussel Watch Program
Summary of 1995-97 Data: Organic Chemicals in Mussel, Oyster, Shore Crab, and Sand Worm (ppb, dry weight)____________________________________________________________________________________________________________________________________________________________ Aldrin alpha- cis- gamma- trans- cis- trans- Oxy- Total Chlor- DacthalStation Station Sample Sample Chlor- Chlor- Chlor- Chlor- Nona- Nona- chlor- Chlor- pyrifosNumber Name Type* Date dene dane dene dane chlor chlor dane dane____________________________________________________________________________________________________________________________________________________________725.0 Newport Bay/Crows Nest TCM 01/27/97 ND 1.6 17.9 ND 14.1 13.4 14.6 1.6 63.3 9.3 2.5726.4 Newport Bay/Rhine Channel/End TCM 01/17/96 ND ND 15.7 1.0 10.7 14.2 15.8 1.6 59.0 ND ND 726.4 Newport Bay/Rhine Channel/End TCM 01/27/97 ND ND 16.0 1.2 12.1 10.1 12.6 ND 52.0 9.2 6.5726.6 Newport Bay/Mariners Drive TCM 01/27/97 ND 1.7 20.3 1.3 16.3 9.6 18.1 ND 67.4 14.4 9.9740.0 Dana Point Harbor/Boat Yard TCM 01/27/97 ND ND 4.9 ND 4.3 3.1 5.2 ND 17.6 ND ND 742.0 San Juan Creek RCM 01/18/96 ND ND 7.5 ND 6.9 3.8 9.4 ND 27.6 ND ND 750.0 Oceanside RCM 01/18/96 ND ND 7.7 ND 9.5 ND 8.8 ND 25.9 ND ND 750.0 Oceanside RCM 09/30/96 ND ND 2.1 ND 1.6 ND 2.4 ND 6.1 ND ND 882.7 San Diego Bay/Sampson Street Pier TCM 01/18/96 ND ND 5.1 ND 5.3 6.2 5.5 ND 22.1 ND ND 883.1 San Diego Bay/Chollas Creek TCM 01/18/96 ND ND 9.8 ND 11.5 9.5 12.1 ND 42.8 ND ND ____________________________________________________________________________________________________________________________________________________________ Diaz- o,p' p,p' o,p' p,p' o,p' p,p' p,p' Total Di- Dieldrin Endo- Endo- Endo- Total Endrin EthionStation inon DDD DDD DDE DDE DDT DDT DDMU DDT Chloro- sulfan sulfan sulfan Endo-Number Benzophenone I II sulfate sulfan____________________________________________________________________________________________________________________________________________________________725.0 ND 12.7 42.8 7.3 384.0 6.9 24.6 16.1 494.4 ND 17.3 ND ND ND ND ND ND 726.4 ND 8.2 33.2 ND 284.0 ND 4.6 ND 330.0 ND 10.1 ND ND NA ND ND ND 726.4 ND 9.0 31.5 4.3 259.0 6.2 35.9 9.6 355.6 ND 16.1 ND ND ND ND ND ND 726.6 63.2 16.6 55.2 7.7 319.0 15.5 66.7 13.7 494.4 ND 18.2 ND ND ND ND ND ND 740.0 ND ND ND ND 37.5 ND 4.4 ND 41.9 ND 2.4 7.6 ND ND 7.6 ND ND 742.0 ND ND 6.4 ND 52.1 ND 4.6 ND 63.1 ND ND ND ND NA ND ND ND 750.0 ND 9.2 26.1 6.1 159.0 ND 8.9 8.9 218.2 ND 4.6 ND ND ND ND ND ND 750.0 ND ND 4.0 ND 49.0 ND ND ND 53.0 ND 2.4 ND ND ND ND ND ND 882.7 ND ND 4.3 ND 21.5 ND 8.3 ND 34.2 ND 1.9 ND ND NA ND ND ND 883.1 ND ND 6.0 ND 22.2 ND 4.0 ND 32.2 ND 2.0 ND ND NA ND ND ND ____________________________________________________________________________________________________________________________________________________________ alpha- beta- delta- gamma- Hepta- Hepta- Hexa- Meth- Ethyl- Methyl- Oxa- PCB PCB PCB Total PCT Tetra- Toxa-Station HCH HCH HCH HCH chlor chlor- chloro- oxy- para- para- diazon 1248 1254 1260 PCB 5460 difon pheneNumber (Lindane) epoxide benzene chlor thion thion____________________________________________________________________________________________________________________________________________________________725.0 ND ND ND ND ND ND ND ND ND ND 11.9 188.0 864.0 18.7 1070.7 NA ND 189.0726.4 ND ND ND ND ND ND ND ND ND ND 2.2 111.0 1010.0 ND 1121.0 NA ND ND 726.4 ND ND ND ND ND ND ND ND ND ND 21.9 99.0 488.0 10.9 597.9 NA ND 245.0726.6 ND ND ND ND ND ND ND ND ND ND 46.0 ND 104.0 ND 104.0 NA ND 319.0740.0 ND ND ND ND ND ND ND ND ND ND 6.1 ND 57.3 ND 57.3 NA ND ND 742.0 ND ND ND ND ND ND ND ND ND ND ND ND 41.3 ND 41.3 NA ND ND 750.0 2.1 ND ND ND ND ND ND ND ND ND ND ND 23.0 ND 23.0 NA ND ND 750.0 ND ND ND ND ND ND ND ND ND ND ND ND ND ND ND NA ND ND 882.7 ND 4.7 4.4 ND ND ND ND ND ND ND ND ND 819.0 ND 819.0 NA ND ND 883.1 ND 9.7 ND ND ND ND ND ND ND ND ND ND 365.0 ND 365.0 NA ND ND ____________________________________________________________________________________________________________________________________________________________* RCM = Resident California Mussel OYS = Oyster (Crassostrea gigas) NA = Not Analyzed RBM = Resident Bay Mussel (s = small size) GLY = Sand Worm (Glycera spp.) ND = Not Detected TCM = Transplanted California Mussel (a = archive) PAC = Shore Crab (Pachygrapsus crassipes)

N-9
APPENDIX NState Mussel Watch Program
Summary of 1995-97 Data: Organic Chemicals in Mussel, Oyster, Shore Crab, and Sand Worm (ppb, dry weight)____________________________________________________________________________________________________________________________________________________________ Aldrin alpha- cis- gamma- trans- cis- trans- Oxy- Total Chlor- DacthalStation Station Sample Sample Chlor- Chlor- Chlor- Chlor- Nona- Nona- chlor- Chlor- pyrifosNumber Name Type* Date dene dane dene dane chlor chlor dane dane____________________________________________________________________________________________________________________________________________________________883.1 San Diego Bay/Chollas Creek TCM 01/28/97 ND 1.4 21.3 1.1 19.1 10.9 15.0 ND 68.8 ND 2.4883.2 San Diego Bay/Chollas Creek/Mouth TCM 01/28/97 ND 1.3 14.6 ND 11.5 9.2 11.0 ND 47.6 ND ND 883.3 San Diego Bay/Chollas Creek/End TCM 01/28/97 ND 3.4 34.3 2.2 28.0 16.3 28.5 1.1 113.8 8.5 ND 883.5 San Diego Bay/Tuna Docks TCM 01/28/97 ND ND 13.0 ND 10.8 9.8 7.8 ND 41.4 4.3 ND 883.6 San Diego Bay/7th Street Channel TCM 01/18/96 ND ND 8.6 ND 9.2 1.0 13.4 ND 32.3 ND ND 883.6 San Diego Bay/7th Street Channel TCM 01/28/97 ND 1.0 11.5 ND 11.0 6.8 7.2 ND 37.5 ND 2.2883.8 San Diego Bay/Switzer Creek TCM 01/18/96 ND ND 9.4 ND 8.2 7.3 9.1 ND 34.0 ND ND 883.8 San Diego Bay/Switzer Creek TCM 01/28/97 ND 2.3 18.5 4.6 17.5 7.7 10.1 ND 60.7 4.4 3.0885.1 San Diego Bay/Paleta Creek/End TCM 01/28/97 ND 3.0 21.1 2.5 20.4 12.4 20.6 ND 80.0 ND ND 885.3 San Diego Bay/7th Street Ch/Mid TCM 01/28/97 ND 3.0 18.6 1.2 18.5 11.6 16.0 ND 68.9 ND ND ____________________________________________________________________________________________________________________________________________________________ Diaz- o,p' p,p' o,p' p,p' o,p' p,p' p,p' Total Di- Dieldrin Endo- Endo- Endo- Total Endrin EthionStation inon DDD DDD DDE DDE DDT DDT DDMU DDT Chloro- sulfan sulfan sulfan Endo-Number Benzophenone I II sulfate sulfan____________________________________________________________________________________________________________________________________________________________883.1 ND ND 6.4 ND 28.2 ND 11.6 ND 46.2 ND 7.7 ND ND ND ND ND ND 883.2 ND ND 6.7 ND 35.3 ND 8.8 ND 50.8 ND 4.8 ND ND ND ND ND ND 883.3 ND ND 9.1 ND 35.2 4.1 21.2 ND 69.6 ND 12.2 ND ND ND ND ND ND 883.5 ND ND 8.1 ND 30.4 ND 8.5 ND 47.0 ND 3.8 ND ND ND ND ND ND 883.6 ND 5.9 12.5 ND 51.7 ND 7.6 ND 77.7 ND ND ND ND NA ND ND ND 883.6 ND ND 6.0 ND 19.3 ND 6.5 ND 31.8 ND 4.2 ND ND ND ND ND ND 883.8 ND ND 4.6 ND 25.6 ND ND ND 30.2 ND 2.4 ND ND NA ND ND ND 883.8 ND ND 5.3 ND 16.2 ND 11.0 ND 32.5 ND 6.6 ND ND ND ND ND ND 885.1 ND 11.7 24.7 ND 54.3 4.2 11.9 ND 106.8 ND 6.8 ND ND ND ND ND ND 885.3 ND 10.3 17.8 ND 62.7 ND 9.2 5.6 105.6 ND 7.0 ND ND ND ND ND ND ____________________________________________________________________________________________________________________________________________________________ alpha- beta- delta- gamma- Hepta- Hepta- Hexa- Meth- Ethyl- Methyl- Oxa- PCB PCB PCB Total PCT Tetra- Toxa-Station HCH HCH HCH HCH chlor chlor- chloro- oxy- para- para- diazon 1248 1254 1260 PCB 5460 difon pheneNumber (Lindane) epoxide benzene chlor thion thion____________________________________________________________________________________________________________________________________________________________883.1 ND ND ND ND ND ND ND ND ND ND 6.9 ND 288.0 12.9 300.9 NA ND ND 883.2 ND ND ND ND ND ND ND ND ND ND 7.0 76.4 495.0 27.9 599.3 NA ND ND 883.3 ND ND ND ND ND 1.2 ND ND ND ND ND 138.0 365.0 14.5 517.5 NA ND ND 883.5 ND ND ND ND ND ND ND ND ND ND 6.7 50.0 460.0 43.1 553.1 NA ND ND 883.6 ND 6.9 ND ND ND ND ND ND ND ND ND ND 690.0 ND 690.0 NA ND ND 883.6 ND ND ND ND ND ND ND ND ND ND 7.9 ND 396.0 36.2 432.2 NA ND ND 883.8 ND 3.7 ND ND ND ND ND ND ND ND ND ND 280.0 ND 280.0 NA ND ND 883.8 ND ND ND ND ND ND ND ND ND ND 4.2 93.8 272.0 19.5 385.3 NA ND ND 885.1 ND ND ND ND ND ND ND ND ND ND 29.1 198.0 681.0 39.1 918.1 NA ND ND 885.3 ND ND ND ND ND ND ND ND ND ND 21.0 166.0 647.0 10.4 823.4 NA ND ND ____________________________________________________________________________________________________________________________________________________________* RCM = Resident California Mussel OYS = Oyster (Crassostrea gigas) NA = Not Analyzed RBM = Resident Bay Mussel (s = small size) GLY = Sand Worm (Glycera spp.) ND = Not Detected TCM = Transplanted California Mussel (a = archive) PAC = Shore Crab (Pachygrapsus crassipes)

N-10
APPENDIX NState Mussel Watch Program
Summary of 1995-97 Data: Organic Chemicals in Mussel, Oyster, Shore Crab, and Sand Worm (ppb, dry weight)____________________________________________________________________________________________________________________________________________________________ Aldrin alpha- cis- gamma- trans- cis- trans- Oxy- Total Chlor- DacthalStation Station Sample Sample Chlor- Chlor- Chlor- Chlor- Nona- Nona- chlor- Chlor- pyrifosNumber Name Type* Date dene dane dene dane chlor chlor dane dane____________________________________________________________________________________________________________________________________________________________886.0 San Diego Bay/NASSCO TCM 01/18/96 ND ND 8.9 ND 6.9 7.2 8.1 ND 31.0 ND ND 888.0 San Diego Bay/Coronado Bridge RBM 01/28/97 ND ND 9.0 ND 7.6 6.6 8.5 ND 31.6 ND 2.5893.0 San Diego Bay/Laurel Street TCM 01/18/96 ND ND 17.0 ND 16.5 11.0 15.4 ND 59.9 ND ND 893.5 San Diego Bay/B Street Pier TCM 01/18/96 ND ND 8.8 ND 7.0 6.1 6.7 ND 28.6 ND ND 894.0 SD Bay/Harbor Is/E Basin/Storm Dr TCM 01/28/97 ND 3.5 22.8 7.1 20.6 7.2 13.4 ND 74.6 ND 3.4____________________________________________________________________________________________________________________________________________________________ Diaz- o,p' p,p' o,p' p,p' o,p' p,p' p,p' Total Di- Dieldrin Endo- Endo- Endo- Total Endrin EthionStation inon DDD DDD DDE DDE DDT DDT DDMU DDT Chloro- sulfan sulfan sulfan Endo-Number Benzophenone I II sulfate sulfan____________________________________________________________________________________________________________________________________________________________886.0 ND ND 6.4 ND 27.0 ND 5.6 ND 39.0 ND 2.8 ND ND NA ND ND ND 888.0 ND ND 5.8 ND 26.3 ND 8.9 ND 41.0 ND 2.0 ND ND ND ND ND ND 893.0 ND ND 8.8 ND 30.4 ND 6.0 ND 45.2 ND 2.2 ND ND NA ND ND ND 893.5 ND ND 8.4 ND 34.2 ND 5.2 ND 47.8 ND 4.5 ND ND NA ND ND ND 894.0 ND 59.0 185.0 ND 29.7 12.2 5.4 7.9 299.2 ND 5.6 ND ND ND ND ND ND ____________________________________________________________________________________________________________________________________________________________ alpha- beta- delta- gamma- Hepta- Hepta- Hexa- Meth- Ethyl- Methyl- Oxa- PCB PCB PCB Total PCT Tetra- Toxa-Station HCH HCH HCH HCH chlor chlor- chloro- oxy- para- para- diazon 1248 1254 1260 PCB 5460 difon pheneNumber (Lindane) epoxide benzene chlor thion thion____________________________________________________________________________________________________________________________________________________________886.0 ND 4.2 ND ND ND ND ND ND ND ND ND ND 472.0 ND 472.0 NA ND ND 888.0 ND ND ND ND ND ND ND ND ND ND 7.2 147.0 423.0 17.1 587.1 NA ND ND 893.0 ND ND ND ND ND ND ND ND ND ND 11.9 119.0 799.0 ND 918.0 NA ND ND 893.5 ND ND ND ND ND ND ND ND ND ND ND ND 428.0 ND 428.0 NA ND ND 894.0 ND ND ND ND ND ND 1.4 ND ND ND 21.6 45300.0 8730.0 338.0 54368.0 NA ND ND ____________________________________________________________________________________________________________________________________________________________* RCM = Resident California Mussel OYS = Oyster (Crassostrea gigas) NA = Not Analyzed RBM = Resident Bay Mussel (s = small size) GLY = Sand Worm (Glycera spp.) ND = Not Detected TCM = Transplanted California Mussel (a = archive) PAC = Shore Crab (Pachygrapsus crassipes)

O-1
APPENDIX O
Summary of 1995-97 Data
Organic Chemicals in Mussel, Oyster, Shore Crab,
and Sand Worm
(ppb, lipid weight)
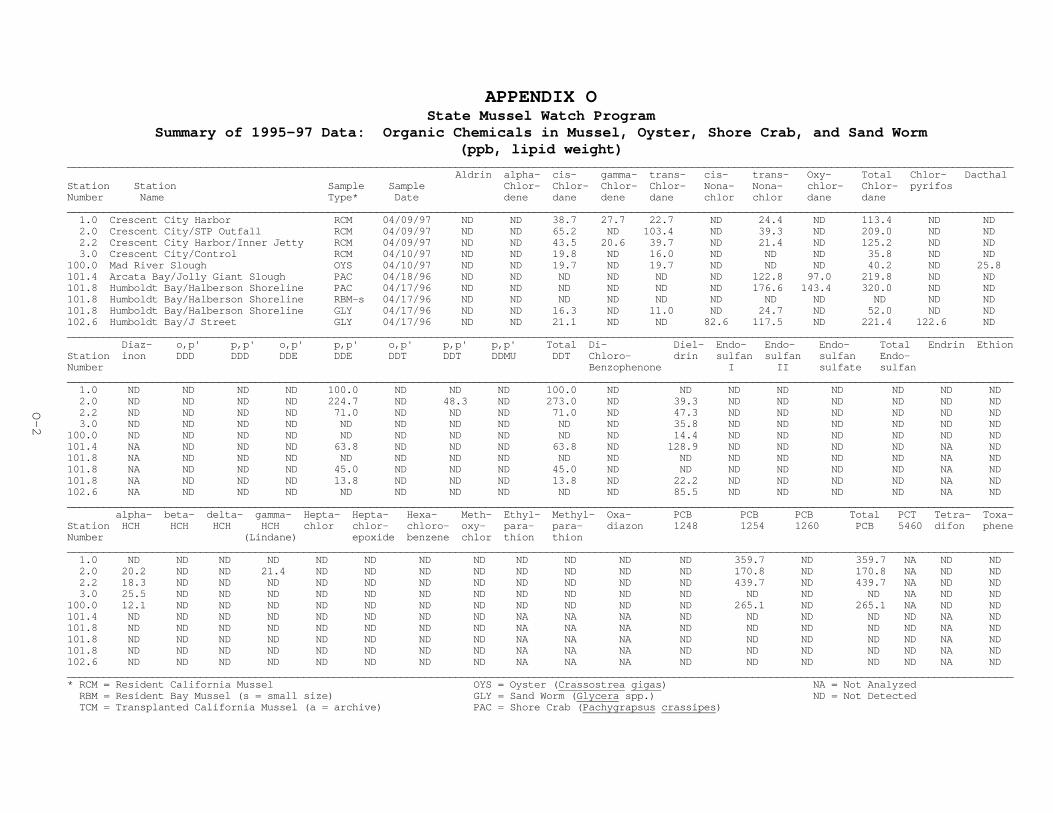
O-2
APPENDIX OState Mussel Watch Program
Summary of 1995-97 Data: Organic Chemicals in Mussel, Oyster, Shore Crab, and Sand Worm(ppb, lipid weight)
____________________________________________________________________________________________________________________________________________________________ Aldrin alpha- cis- gamma- trans- cis- trans- Oxy- Total Chlor- DacthalStation Station Sample Sample Chlor- Chlor- Chlor- Chlor- Nona- Nona- chlor- Chlor- pyrifosNumber Name Type* Date dene dane dene dane chlor chlor dane dane____________________________________________________________________________________________________________________________________________________________ 1.0 Crescent City Harbor RCM 04/09/97 ND ND 38.7 27.7 22.7 ND 24.4 ND 113.4 ND ND 2.0 Crescent City/STP Outfall RCM 04/09/97 ND ND 65.2 ND 103.4 ND 39.3 ND 209.0 ND ND 2.2 Crescent City Harbor/Inner Jetty RCM 04/09/97 ND ND 43.5 20.6 39.7 ND 21.4 ND 125.2 ND ND 3.0 Crescent City/Control RCM 04/10/97 ND ND 19.8 ND 16.0 ND ND ND 35.8 ND ND 100.0 Mad River Slough OYS 04/10/97 ND ND 19.7 ND 19.7 ND ND ND 40.2 ND 25.8101.4 Arcata Bay/Jolly Giant Slough PAC 04/18/96 ND ND ND ND ND ND 122.8 97.0 219.8 ND ND 101.8 Humboldt Bay/Halberson Shoreline PAC 04/17/96 ND ND ND ND ND ND 176.6 143.4 320.0 ND ND 101.8 Humboldt Bay/Halberson Shoreline RBM-s 04/17/96 ND ND ND ND ND ND ND ND ND ND ND 101.8 Humboldt Bay/Halberson Shoreline GLY 04/17/96 ND ND 16.3 ND 11.0 ND 24.7 ND 52.0 ND ND 102.6 Humboldt Bay/J Street GLY 04/17/96 ND ND 21.1 ND ND 82.6 117.5 ND 221.4 122.6 ND ____________________________________________________________________________________________________________________________________________________________ Diaz- o,p' p,p' o,p' p,p' o,p' p,p' p,p' Total Di- Diel- Endo- Endo- Endo- Total Endrin EthionStation inon DDD DDD DDE DDE DDT DDT DDMU DDT Chloro- drin sulfan sulfan sulfan Endo-Number Benzophenone I II sulfate sulfan____________________________________________________________________________________________________________________________________________________________ 1.0 ND ND ND ND 100.0 ND ND ND 100.0 ND ND ND ND ND ND ND ND 2.0 ND ND ND ND 224.7 ND 48.3 ND 273.0 ND 39.3 ND ND ND ND ND ND 2.2 ND ND ND ND 71.0 ND ND ND 71.0 ND 47.3 ND ND ND ND ND ND 3.0 ND ND ND ND ND ND ND ND ND ND 35.8 ND ND ND ND ND ND 100.0 ND ND ND ND ND ND ND ND ND ND 14.4 ND ND ND ND ND ND 101.4 NA ND ND ND 63.8 ND ND ND 63.8 ND 128.9 ND ND ND ND NA ND 101.8 NA ND ND ND ND ND ND ND ND ND ND ND ND ND ND NA ND 101.8 NA ND ND ND 45.0 ND ND ND 45.0 ND ND ND ND ND ND NA ND 101.8 NA ND ND ND 13.8 ND ND ND 13.8 ND 22.2 ND ND ND ND NA ND 102.6 NA ND ND ND ND ND ND ND ND ND 85.5 ND ND ND ND NA ND ____________________________________________________________________________________________________________________________________________________________ alpha- beta- delta- gamma- Hepta- Hepta- Hexa- Meth- Ethyl- Methyl- Oxa- PCB PCB PCB Total PCT Tetra- Toxa-Station HCH HCH HCH HCH chlor chlor- chloro- oxy- para- para- diazon 1248 1254 1260 PCB 5460 difon pheneNumber (Lindane) epoxide benzene chlor thion thion____________________________________________________________________________________________________________________________________________________________ 1.0 ND ND ND ND ND ND ND ND ND ND ND ND 359.7 ND 359.7 NA ND ND 2.0 20.2 ND ND 21.4 ND ND ND ND ND ND ND ND 170.8 ND 170.8 NA ND ND 2.2 18.3 ND ND ND ND ND ND ND ND ND ND ND 439.7 ND 439.7 NA ND ND 3.0 25.5 ND ND ND ND ND ND ND ND ND ND ND ND ND ND NA ND ND 100.0 12.1 ND ND ND ND ND ND ND ND ND ND ND 265.1 ND 265.1 NA ND ND 101.4 ND ND ND ND ND ND ND ND NA NA NA ND ND ND ND ND NA ND 101.8 ND ND ND ND ND ND ND ND NA NA NA ND ND ND ND ND NA ND 101.8 ND ND ND ND ND ND ND ND NA NA NA ND ND ND ND ND NA ND 101.8 ND ND ND ND ND ND ND ND NA NA NA ND ND ND ND ND NA ND 102.6 ND ND ND ND ND ND ND ND NA NA NA ND ND ND ND ND NA ND ____________________________________________________________________________________________________________________________________________________________* RCM = Resident California Mussel OYS = Oyster (Crassostrea gigas) NA = Not Analyzed RBM = Resident Bay Mussel (s = small size) GLY = Sand Worm (Glycera spp.) ND = Not Detected TCM = Transplanted California Mussel (a = archive) PAC = Shore Crab (Pachygrapsus crassipes)

O-3
APPENDIX OState Mussel Watch Program
Summary of 1995-97 Data: Organic Chemicals in Mussel, Oyster, Shore Crab, and Sand Worm(ppb, lipid weight)
____________________________________________________________________________________________________________________________________________________________ Aldrin alpha- cis- gamma- trans- cis- trans- Oxy- Total Chlor- DacthalStation Station Sample Sample Chlor- Chlor- Chlor- Chlor- Nona- Nona- chlor- Chlor- pyrifosNumber Name Type* Date dene dane dene dane chlor chlor dane dane____________________________________________________________________________________________________________________________________________________________102.6 Humboldt Bay/J Street PAC 04/17/96 ND ND ND ND ND ND ND 153.2 153.2 ND ND 102.6 Humboldt Bay/J Street RBM 04/17/96 ND ND ND ND ND ND ND ND ND ND ND 102.6 Humboldt Bay/J Street TCM 04/10/97 ND ND 30.6 15.9 26.1 ND 16.6 ND 88.5 ND ND 102.7 Humboldt Bay/H Street RBM-s 04/17/96 ND ND ND ND ND ND ND ND ND ND ND 102.7 Humboldt Bay/H Street GLY 04/17/96 ND ND 16.7 ND ND 14.4 42.4 ND 73.4 ND ND 102.7 Humboldt Bay/H Street PAC 04/17/96 ND ND ND ND ND ND ND 61.5 61.5 ND ND 103.3 Humboldt Bay/E Street TCM 04/10/97 ND ND 24.1 ND 16.9 ND ND ND 41.0 ND ND 103.5 Humboldt Bay/Clark Slough TCM 04/10/97 ND ND 30.1 ND 28.1 ND 15.1 ND 73.3 ND ND 202.0 Bodega Head RCM 09/11/95 ND ND ND ND ND ND ND ND ND ND ND 202.0 Bodega Head RCM 08/29/96 ND ND ND ND ND ND ND ND ND ND ND ____________________________________________________________________________________________________________________________________________________________ Diaz- o,p' p,p' o,p' p,p' o,p' p,p' p,p' Total Di- Diel- Endo- Endo- Endo- Total Endrin EthionStation inon DDD DDD DDE DDE DDT DDT DDMU DDT Chloro- drin sulfan sulfan sulfan Endo-Number Benzophenone I II sulfate sulfan____________________________________________________________________________________________________________________________________________________________102.6 NA ND ND ND 202.0 ND ND ND 202.0 ND 45.6 ND ND ND ND NA ND 102.6 NA ND ND ND 64.8 ND ND ND 64.8 ND ND ND ND ND ND NA ND 102.6 ND ND ND ND 45.2 ND ND ND 45.2 ND 51.0 ND ND ND ND ND ND 102.7 NA ND ND ND 49.3 ND ND ND 49.3 ND ND ND ND ND ND NA ND 102.7 NA ND 40.2 ND 338.0 ND ND ND 378.1 ND 12.5 ND ND ND ND NA ND 102.7 NA ND ND ND 359.9 ND ND ND 359.9 ND 53.1 ND ND ND ND NA ND 103.3 ND ND ND ND 48.8 ND 11.4 ND 60.2 ND 36.8 ND ND ND ND ND ND 103.5 ND ND ND ND 39.0 ND ND ND 39.0 ND 32.2 ND ND ND ND ND ND 202.0 ND ND ND ND 444.6 ND ND ND 444.6 ND 126.2 ND ND NA ND ND ND 202.0 ND ND ND ND 95.5 ND ND ND 95.5 ND 67.2 ND ND ND ND ND ND ____________________________________________________________________________________________________________________________________________________________ alpha- beta- delta- gamma- Hepta- Hepta- Hexa- Meth- Ethyl- Methyl- Oxa- PCB PCB PCB Total PCT Tetra- Toxa-Station HCH HCH HCH HCH chlor chlor- chloro- oxy- para- para- diazon 1248 1254 1260 PCB 5460 difon pheneNumber (Lindane) epoxide benzene chlor thion thion____________________________________________________________________________________________________________________________________________________________102.6 ND ND ND ND ND ND 66.9 ND NA NA NA ND ND ND ND ND NA ND 102.6 ND ND ND ND ND ND ND ND NA NA NA ND 1234.2 ND 1234.2 ND NA ND 102.6 12.1 ND ND ND ND ND ND ND ND ND ND ND 269.4 ND 269.4 NA ND ND 102.7 ND ND ND ND ND ND ND ND NA NA NA ND 8483.7 ND 8483.7 ND NA ND 102.7 ND ND ND ND ND ND ND ND NA NA NA ND 1713.9 910.5 2624.5 ND NA ND 102.7 ND ND ND ND ND ND ND ND NA NA NA ND ND 6390.9 6390.9 ND NA ND 103.3 12.1 ND ND ND ND ND ND ND ND ND ND ND 282.5 ND 282.5 NA ND ND 103.5 ND ND ND ND ND ND ND ND ND ND ND ND 376.0 ND 376.0 NA ND ND 202.0 220.4 ND ND ND ND ND ND ND ND ND ND ND 704.1 ND 702.4 NA ND ND 202.0 37.8 ND ND ND ND ND ND ND ND ND ND ND 506.8 ND 506.8 NA ND ND ____________________________________________________________________________________________________________________________________________________________* RCM = Resident California Mussel OYS = Oyster (Crassostrea gigas) NA = Not Analyzed RBM = Resident Bay Mussel (s = small size) GLY = Sand Worm (Glycera spp.) ND = Not Detected TCM = Transplanted California Mussel (a = archive) PAC = Shore Crab (Pachygrapsus crassipes)
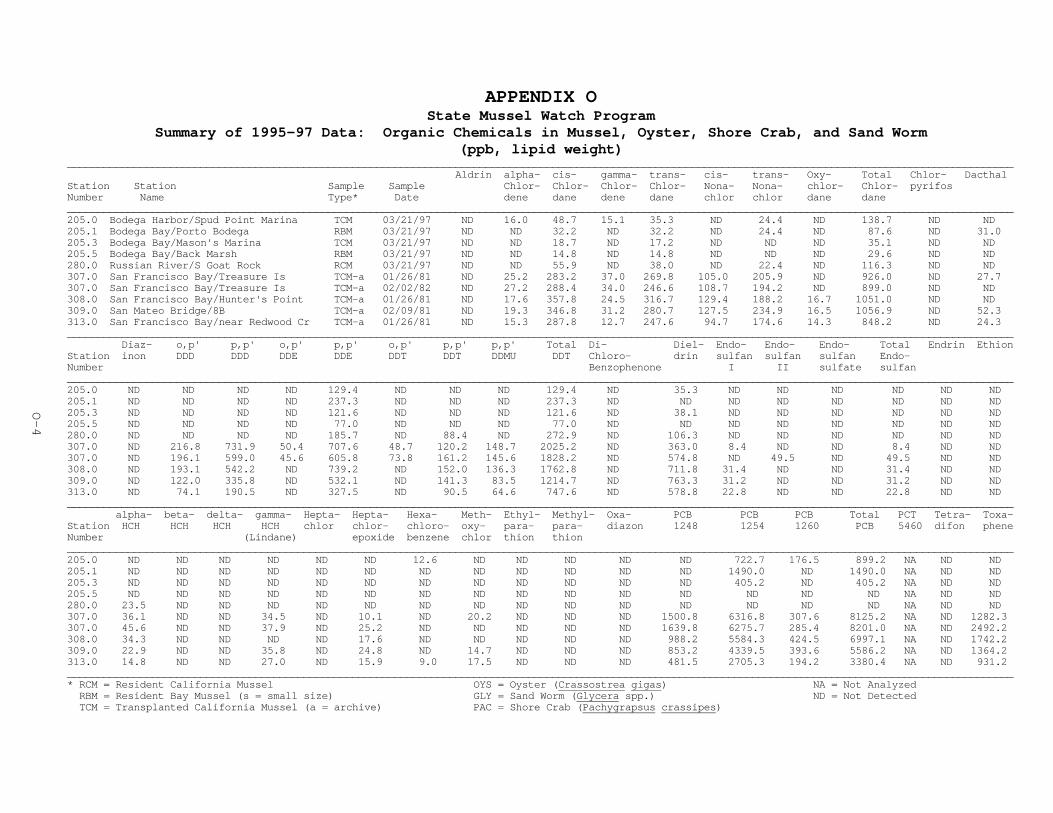
O-4
APPENDIX OState Mussel Watch Program
Summary of 1995-97 Data: Organic Chemicals in Mussel, Oyster, Shore Crab, and Sand Worm(ppb, lipid weight)
____________________________________________________________________________________________________________________________________________________________ Aldrin alpha- cis- gamma- trans- cis- trans- Oxy- Total Chlor- DacthalStation Station Sample Sample Chlor- Chlor- Chlor- Chlor- Nona- Nona- chlor- Chlor- pyrifosNumber Name Type* Date dene dane dene dane chlor chlor dane dane____________________________________________________________________________________________________________________________________________________________205.0 Bodega Harbor/Spud Point Marina TCM 03/21/97 ND 16.0 48.7 15.1 35.3 ND 24.4 ND 138.7 ND ND 205.1 Bodega Bay/Porto Bodega RBM 03/21/97 ND ND 32.2 ND 32.2 ND 24.4 ND 87.6 ND 31.0205.3 Bodega Bay/Mason's Marina TCM 03/21/97 ND ND 18.7 ND 17.2 ND ND ND 35.1 ND ND 205.5 Bodega Bay/Back Marsh RBM 03/21/97 ND ND 14.8 ND 14.8 ND ND ND 29.6 ND ND 280.0 Russian River/S Goat Rock RCM 03/21/97 ND ND 55.9 ND 38.0 ND 22.4 ND 116.3 ND ND 307.0 San Francisco Bay/Treasure Is TCM-a 01/26/81 ND 25.2 283.2 37.0 269.8 105.0 205.9 ND 926.0 ND 27.7307.0 San Francisco Bay/Treasure Is TCM-a 02/02/82 ND 27.2 288.4 34.0 246.6 108.7 194.2 ND 899.0 ND ND 308.0 San Francisco Bay/Hunter's Point TCM-a 01/26/81 ND 17.6 357.8 24.5 316.7 129.4 188.2 16.7 1051.0 ND ND 309.0 San Mateo Bridge/8B TCM-a 02/09/81 ND 19.3 346.8 31.2 280.7 127.5 234.9 16.5 1056.9 ND 52.3313.0 San Francisco Bay/near Redwood Cr TCM-a 01/26/81 ND 15.3 287.8 12.7 247.6 94.7 174.6 14.3 848.2 ND 24.3____________________________________________________________________________________________________________________________________________________________ Diaz- o,p' p,p' o,p' p,p' o,p' p,p' p,p' Total Di- Diel- Endo- Endo- Endo- Total Endrin EthionStation inon DDD DDD DDE DDE DDT DDT DDMU DDT Chloro- drin sulfan sulfan sulfan Endo-Number Benzophenone I II sulfate sulfan____________________________________________________________________________________________________________________________________________________________205.0 ND ND ND ND 129.4 ND ND ND 129.4 ND 35.3 ND ND ND ND ND ND 205.1 ND ND ND ND 237.3 ND ND ND 237.3 ND ND ND ND ND ND ND ND 205.3 ND ND ND ND 121.6 ND ND ND 121.6 ND 38.1 ND ND ND ND ND ND 205.5 ND ND ND ND 77.0 ND ND ND 77.0 ND ND ND ND ND ND ND ND 280.0 ND ND ND ND 185.7 ND 88.4 ND 272.9 ND 106.3 ND ND ND ND ND ND 307.0 ND 216.8 731.9 50.4 707.6 48.7 120.2 148.7 2025.2 ND 363.0 8.4 ND ND 8.4 ND ND 307.0 ND 196.1 599.0 45.6 605.8 73.8 161.2 145.6 1828.2 ND 574.8 ND 49.5 ND 49.5 ND ND 308.0 ND 193.1 542.2 ND 739.2 ND 152.0 136.3 1762.8 ND 711.8 31.4 ND ND 31.4 ND ND 309.0 ND 122.0 335.8 ND 532.1 ND 141.3 83.5 1214.7 ND 763.3 31.2 ND ND 31.2 ND ND 313.0 ND 74.1 190.5 ND 327.5 ND 90.5 64.6 747.6 ND 578.8 22.8 ND ND 22.8 ND ND ____________________________________________________________________________________________________________________________________________________________ alpha- beta- delta- gamma- Hepta- Hepta- Hexa- Meth- Ethyl- Methyl- Oxa- PCB PCB PCB Total PCT Tetra- Toxa-Station HCH HCH HCH HCH chlor chlor- chloro- oxy- para- para- diazon 1248 1254 1260 PCB 5460 difon pheneNumber (Lindane) epoxide benzene chlor thion thion____________________________________________________________________________________________________________________________________________________________205.0 ND ND ND ND ND ND 12.6 ND ND ND ND ND 722.7 176.5 899.2 NA ND ND 205.1 ND ND ND ND ND ND ND ND ND ND ND ND 1490.0 ND 1490.0 NA ND ND 205.3 ND ND ND ND ND ND ND ND ND ND ND ND 405.2 ND 405.2 NA ND ND 205.5 ND ND ND ND ND ND ND ND ND ND ND ND ND ND ND NA ND ND 280.0 23.5 ND ND ND ND ND ND ND ND ND ND ND ND ND ND NA ND ND 307.0 36.1 ND ND 34.5 ND 10.1 ND 20.2 ND ND ND 1500.8 6316.8 307.6 8125.2 NA ND 1282.3307.0 45.6 ND ND 37.9 ND 25.2 ND ND ND ND ND 1639.8 6275.7 285.4 8201.0 NA ND 2492.2308.0 34.3 ND ND ND ND 17.6 ND ND ND ND ND 988.2 5584.3 424.5 6997.1 NA ND 1742.2309.0 22.9 ND ND 35.8 ND 24.8 ND 14.7 ND ND ND 853.2 4339.5 393.6 5586.2 NA ND 1364.2313.0 14.8 ND ND 27.0 ND 15.9 9.0 17.5 ND ND ND 481.5 2705.3 194.2 3380.4 NA ND 931.2____________________________________________________________________________________________________________________________________________________________* RCM = Resident California Mussel OYS = Oyster (Crassostrea gigas) NA = Not Analyzed RBM = Resident Bay Mussel (s = small size) GLY = Sand Worm (Glycera spp.) ND = Not Detected TCM = Transplanted California Mussel (a = archive) PAC = Shore Crab (Pachygrapsus crassipes)

O-5
APPENDIX OState Mussel Watch Program
Summary of 1995-97 Data: Organic Chemicals in Mussel, Oyster, Shore Crab, and Sand Worm(ppb, lipid weight)
____________________________________________________________________________________________________________________________________________________________ Aldrin alpha- cis- gamma- trans- cis- trans- Oxy- Total Chlor- DacthalStation Station Sample Sample Chlor- Chlor- Chlor- Chlor- Nona- Nona- chlor- Chlor- pyrifosNumber Name Type* Date dene dane dene dane chlor chlor dane dane____________________________________________________________________________________________________________________________________________________________321.0 Dumbarton Bridge/Channel Marker 14 TCM-a 02/09/81 0.9 31.5 381.8 37.6 300.6 140.0 241.2 13.9 1146.7 ND 80.0400.6 Santa Cruz/Natural Bridges RCM 06/09/97 ND ND 59.3 ND 51.8 14.1 48.9 ND 174.1 ND ND 400.7 Santa Cruz Harbor/Inner TCM 03/25/96 ND ND 1371.1 ND 1083.1 562.8 997.1 92.2 4105.8 62.0 ND 401.0 Santa Cruz Harbor TCM 03/25/96 ND ND 687.5 ND 571.9 312.2 575.0 49.4 2196.0 ND ND 403.0 Elkhorn Slough/Highway 1 Bridge TCM 03/12/97 ND ND 100.0 ND 92.5 32.3 58.7 ND 283.5 ND 49.6404.0 Sandholdt Bridge TCM 02/16/96 ND ND 509.5 ND 438.7 251.7 440.2 ND 1640.2 212.6 714.6404.0 Sandholdt Bridge TCM 03/04/97 ND 30.8 524.9 ND 452.6 260.7 532.0 ND 1800.9 130.3 327.0414.0 Pacific Grove RCM 03/07/96 ND ND 138.8 ND 120.1 ND 73.3 ND 332.2 ND ND 414.0 Pacific Grove RCM 04/25/97 ND ND 43.2 ND ND ND 26.2 ND 68.1 ND 43.2601.0 LA Harbor/National Steel TCM 01/18/96 ND ND 735.6 ND 692.0 418.5 648.0 ND 2494.2 ND ND ____________________________________________________________________________________________________________________________________________________________ Diaz- o,p' p,p' o,p' p,p' o,p' p,p' p,p' Total Di- Diel- Endo- Endo- Endo- Total Endrin EthionStation inon DDD DDD DDE DDE DDT DDT DDMU DDT Chloro- drin sulfan sulfan sulfan Endo-Number Benzophenone I II sulfate sulfan____________________________________________________________________________________________________________________________________________________________321.0 ND 105.4 272.1 ND 495.8 ND 110.9 78.8 1063.0 ND 630.3 44.2 ND 22.4 66.1 23.0 ND 400.6 ND ND 91.8 ND 694.8 ND 222.2 ND 1008.9 ND 183.7 ND ND ND ND ND ND 400.7 ND ND 305.8 ND 1314.9 ND 691.7 ND 2312.8 ND 1083.1 ND ND NA ND ND ND 401.0 ND ND 353.1 ND 1528.1 ND 646.9 ND 2528.1 ND 375.0 ND ND NA ND ND ND 403.0 ND 141.4 414.3 47.4 3062.4 303.8 948.9 76.7 4994.7 ND 527.8 ND ND ND ND ND ND 404.0 ND 1340.2 3980.0 678.4 28192.0 1489.5 11397.4 836.8 47914.3 ND 3482.5 55.8 154.0 ND 209.5 432.8 ND 404.0 ND 1234.6 5277.3 524.9 27900.5 2940.8 10789.1 601.9 49270.1 ND 3271.3 37.9 149.3 ND 188.4 257.1 ND 414.0 ND ND 211.6 ND 1434.5 ND 418.0 ND 2064.4 ND 369.4 ND ND NA ND ND ND 414.0 ND ND ND ND 375.6 ND 107.3 ND 483.0 ND 129.6 ND ND ND ND ND ND 601.0 ND 848.0 3050.2 1461.8 11986.9 ND 686.9 954.9 18989.1 ND 200.4 ND ND NA ND ND ND ____________________________________________________________________________________________________________________________________________________________ alpha- beta- delta- gamma- Hepta- Hepta- Hexa- Meth- Ethyl- Methyl- Oxa- PCB PCB PCB Total PCT Tetra- Toxa-Station HCH HCH HCH HCH chlor chlor- chloro- oxy- para- para- diazon 1248 1254 1260 PCB 5460 difon pheneNumber (Lindane) epoxide benzene chlor thion thion____________________________________________________________________________________________________________________________________________________________321.0 24.2 ND ND 64.8 ND 27.9 13.3 13.3 ND ND 25.5 1618.2 4548.5 229.7 6396.4 NA ND 1149.1400.6 ND ND ND ND ND ND ND ND ND ND ND ND 256.3 ND 256.3 NA ND ND 400.7 ND ND ND ND ND ND ND ND ND ND 104.1 ND 2177.7 ND 2178.9 NA ND ND 401.0 ND ND ND ND ND ND ND ND ND ND ND ND 3406.3 ND 3406.3 NA ND ND 403.0 ND ND ND ND ND ND ND ND 121.1 ND ND ND 1081.2 127.1 1208.3 NA ND 3159.4404.0 ND ND ND ND ND 51.0 ND ND ND ND 109.1 ND 3708.2 ND 3708.7 NA ND 25176.8404.0 ND ND ND ND ND 15.4 ND ND ND ND ND ND 3340.1 472.8 3812.8 NA ND 27075.8414.0 64.4 ND ND ND ND ND ND ND ND ND ND ND 609.6 ND 609.8 NA ND ND 414.0 ND ND ND ND ND ND ND ND ND ND ND 1112.6 ND ND 1112.6 NA ND ND 601.0 ND ND ND ND ND ND ND ND ND ND ND 3290.9 21243.6 ND 24534.2 NA ND ND ____________________________________________________________________________________________________________________________________________________________* RCM = Resident California Mussel OYS = Oyster (Crassostrea gigas) NA = Not Analyzed RBM = Resident Bay Mussel (s = small size) GLY = Sand Worm (Glycera spp.) ND = Not Detected TCM = Transplanted California Mussel (a = archive) PAC = Shore Crab (Pachygrapsus crassipes)

O-6
APPENDIX OState Mussel Watch Program
Summary of 1995-97 Data: Organic Chemicals in Mussel, Oyster, Shore Crab, and Sand Worm(ppb, lipid weight)
____________________________________________________________________________________________________________________________________________________________ Aldrin alpha- cis- gamma- trans- cis- trans- Oxy- Total Chlor- DacthalStation Station Sample Sample Chlor- Chlor- Chlor- Chlor- Nona- Nona- chlor- Chlor- pyrifosNumber Name Type* Date dene dane dene dane chlor chlor dane dane____________________________________________________________________________________________________________________________________________________________601.0 LA Harbor/National Steel TCM 01/28/97 ND 21.6 236.5 ND 187.8 95.9 118.9 ND 662.2 ND ND 605.0 LA Harbor/Cabrillo Pier TCM 01/18/96 ND ND 237.9 ND 216.2 96.9 174.0 ND 725.0 ND ND 616.0 LA Harbor/Consolidated Slip TCM 01/18/96 ND 49.8 901.3 65.7 896.2 490.8 936.0 52.7 3392.9 ND ND 616.0 LA Harbor/Consolidated Slip TCM 01/28/97 ND 19.5 355.3 ND 293.0 158.7 236.9 ND 1063.5 ND 39.1618.0 LA Harbor/Angels Gate RCM 01/18/96 ND ND 167.9 ND 173.7 78.4 157.9 ND 578.0 ND ND 648.0 Malibu RBM 01/17/96 ND ND 154.4 14.1 136.3 40.7 125.1 ND 470.4 ND ND 648.0 Malibu RCM 11/25/96 ND ND 44.1 ND 39.4 18.8 57.1 ND 159.4 ND ND 650.0 Santa Monica RBM 01/17/96 ND ND 142.8 16.7 168.3 ND 193.9 ND 521.7 ND ND 650.0 Santa Monica RCM 11/25/96 ND ND 114.8 ND 103.9 44.5 93.8 ND 357.0 ND ND 662.0 Royal Palms RCM 01/18/96 ND ND 389.3 ND 377.4 77.8 223.5 ND 1067.9 ND ND ____________________________________________________________________________________________________________________________________________________________ Diaz- o,p' p,p' o,p' p,p' o,p' p,p' p,p' Total Di- Diel- Endo- Endo- Endo- Total Endrin EthionStation inon DDD DDD DDE DDE DDT DDT DDMU DDT Chloro- drin sulfan sulfan sulfan Endo-Number Benzophenone I II sulfate sulfan____________________________________________________________________________________________________________________________________________________________601.0 ND 216.2 732.4 289.2 4183.8 85.1 378.4 306.8 6190.5 ND 106.8 ND ND ND ND ND ND 605.0 ND 318.1 961.8 1990.8 13769.0 ND 285.8 1277.5 18603.1 ND 105.7 ND ND NA ND ND ND 616.0 ND 1095.4 3983.3 916.3 9858.6 ND 971.1 582.4 17406.7 ND 179.1 ND ND NA ND ND ND 616.0 ND 305.3 962.2 124.5 4151.4 63.5 604.4 241.8 6451.8 ND 117.2 ND ND ND ND ND ND 618.0 1186.9 350.9 963.3 1737.4 15326.8 ND 338.9 1737.4 20454.7 ND 28.6 ND ND NA ND ND ND 648.0 ND 79.6 200.5 189.2 1825.1 ND 77.8 265.9 2638.1 ND 11.3 ND ND NA ND ND ND 648.0 ND ND 61.8 78.8 690.6 ND ND 114.7 946.5 ND 22.4 ND ND ND ND ND ND 650.0 ND 97.2 255.4 238.0 2321.8 ND 47.1 361.0 3320.6 ND 24.5 ND ND NA ND ND ND 650.0 ND ND 107.0 68.8 852.3 ND ND 142.2 1170.3 ND 61.7 ND ND ND ND ND ND 662.0 ND 939.9 2826.3 3922.6 37732.5 ND 768.7 3872.8 50063.4 ND 192.2 ND ND NA ND ND ND ____________________________________________________________________________________________________________________________________________________________ alpha- beta- delta- gamma- Hepta- Hepta- Hexa- Meth- Ethyl- Methyl- Oxa- PCB PCB PCB Total PCT Tetra- Toxa-Station HCH HCH HCH HCH chlor chlor- chloro- oxy- para- para- diazon 1248 1254 1260 PCB 5460 difon pheneNumber (Lindane) epoxide benzene chlor thion thion____________________________________________________________________________________________________________________________________________________________601.0 ND ND ND ND ND ND ND ND ND ND 162.2 4410.8 14481.1 562.2 19454.1 NA ND 1735.1605.0 ND ND ND ND ND ND ND ND ND ND ND 1504.4 6437.1 ND 7940.8 NA ND ND 616.0 ND ND ND ND ND ND ND ND ND ND 156.9 3690.4 28677.8 ND 32369.0 NA ND ND 616.0 ND ND ND ND ND ND ND ND ND ND 385.8 837.6 5677.7 409.0 6924.3 NA ND 5219.8618.0 ND ND ND ND ND ND ND ND ND ND ND 1035.6 10045.9 ND 11081.4 NA ND ND 648.0 11.6 ND ND ND ND ND ND ND ND ND ND ND 822.2 ND 822.4 NA ND ND 648.0 ND ND ND ND ND ND ND ND ND ND ND ND 510.6 ND 510.6 NA ND ND 650.0 17.6 ND ND ND ND ND ND ND ND ND 27.0 ND 1277.0 ND 1277.0 NA ND ND 650.0 ND ND ND ND ND ND ND ND ND ND ND ND 839.1 182.8 1021.9 NA ND ND 662.0 ND ND ND ND ND ND ND ND ND ND ND ND 7070.0 ND 7069.5 NA ND ND ____________________________________________________________________________________________________________________________________________________________* RCM = Resident California Mussel OYS = Oyster (Crassostrea gigas) NA = Not Analyzed RBM = Resident Bay Mussel (s = small size) GLY = Sand Worm (Glycera spp.) ND = Not Detected TCM = Transplanted California Mussel (a = archive) PAC = Shore Crab (Pachygrapsus crassipes)

O-7
APPENDIX OState Mussel Watch Program
Summary of 1995-97 Data: Organic Chemicals in Mussel, Oyster, Shore Crab, and Sand Worm(ppb, lipid weight)
____________________________________________________________________________________________________________________________________________________________ Aldrin alpha- cis- gamma- trans- cis- trans- Oxy- Total Chlor- DacthalStation Station Sample Sample Chlor- Chlor- Chlor- Chlor- Nona- Nona- chlor- Chlor- pyrifosNumber Name Type* Date dene dane dene dane chlor chlor dane dane____________________________________________________________________________________________________________________________________________________________662.0 Royal Palms RCM 11/25/96 ND ND 42.1 ND 51.0 ND 35.7 ND 128.8 ND ND 664.0 Cabrillo Beach RCM 01/18/96 ND ND 121.4 ND 129.6 ND 78.2 ND 329.1 ND ND 708.0 Anaheim Bay/Navy Marsh TCM 01/27/97 ND 14.7 159.4 11.2 112.3 80.6 152.9 ND 531.2 96.5 ND 713.0 Huntington Harbour/Edinger Street TCM 01/17/96 ND 57.9 825.0 40.8 799.5 380.0 755.4 27.8 2886.4 124.6 ND 713.0 Huntington Harbour/Edinger Street TCM 01/27/97 ND 24.6 356.6 16.4 310.1 151.6 293.7 16.4 1166.7 142.1 ND 715.0 Huntington Harbour/Warner Ave Brdg TCM 01/17/96 ND 52.0 812.1 39.5 809.4 485.5 796.0 37.9 3032.5 130.0 ND 715.0 Huntington Harbour/Warner Ave Brdg TCM 01/27/97 ND 45.0 396.2 37.7 362.8 219.2 345.4 ND 1407.8 240.9 39.2723.4 Newport Bay/Turning Basin TCM 01/17/96 ND ND 651.0 ND 478.3 338.8 569.9 62.9 2101.1 ND ND 724.0 Newport Bay/Highway 1 Bridge TCM 01/17/96 ND 39.5 756.8 33.0 593.2 405.7 638.7 34.6 2501.4 ND 68.4725.0 Newport Bay/Crows Nest TCM 01/17/96 ND 27.4 500.7 34.7 341.8 309.2 439.8 63.3 1716.7 ND ND ____________________________________________________________________________________________________________________________________________________________ Diaz- o,p' p,p' o,p' p,p' o,p' p,p' p,p' Total Di- Diel- Endo- Endo- Endo- Total Endrin EthionStation inon DDD DDD DDE DDE DDT DDT DDMU DDT Chloro- drin sulfan sulfan sulfan Endo-Number Benzophenone I II sulfate sulfan____________________________________________________________________________________________________________________________________________________________662.0 ND 102.0 312.5 577.8 7554.9 ND 81.6 649.2 9278.1 ND 48.5 ND ND ND ND ND ND 664.0 ND 236.2 848.3 1331.6 11683.2 ND 265.1 1549.2 15913.5 ND 73.9 ND ND NA ND ND ND 708.0 ND 122.9 264.7 175.9 2925.9 42.3 177.1 228.2 3935.9 ND 80.0 ND ND ND ND ND ND 713.0 ND 792.5 1418.2 301.3 6025.0 105.9 442.6 370.8 9456.2 ND 259.5 ND ND NA ND ND ND 713.0 ND 195.4 429.0 84.7 2930.3 82.0 640.7 161.2 4521.9 ND 183.1 ND ND ND ND ND ND 715.0 ND 498.9 1048.3 160.5 6554.2 ND 168.0 268.0 8697.6 ND 226.5 ND ND NA ND ND ND 715.0 ND 181.4 339.6 85.6 3034.8 74.0 225.0 166.9 4107.4 ND 206.1 ND ND ND ND ND ND 723.4 ND 236.0 973.4 106.6 6308.4 ND 135.7 219.2 7979.0 ND 286.4 ND ND NA ND ND ND 724.0 ND 517.6 2188.6 405.7 15558.9 ND 327.0 623.5 19621.1 ND 317.8 ND ND NA ND ND ND 725.0 ND 291.7 1132.0 191.2 8990.5 ND 16087.1 370.1 27062.4 ND 222.1 ND ND NA ND ND ND ____________________________________________________________________________________________________________________________________________________________ alpha- beta- delta- gamma- Hepta- Hepta- Hexa- Meth- Ethyl- Methyl- Oxa- PCB PCB PCB Total PCT Tetra- Toxa-Station HCH HCH HCH HCH chlor chlor- chloro- oxy- para- para- diazon 1248 1254 1260 PCB 5460 difon pheneNumber (Lindane) epoxide benzene chlor thion thion____________________________________________________________________________________________________________________________________________________________662.0 ND ND ND ND ND ND ND ND ND ND ND 1213.0 2187.5 ND 3401.8 NA ND ND 664.0 ND ND ND ND ND ND ND ND ND ND ND ND 2470.2 ND 2471.1 NA ND ND 708.0 ND ND ND ND ND ND ND ND ND ND 58.2 282.4 1822.3 ND 2104.1 NA ND ND 713.0 ND ND ND ND 39.6 44.6 ND ND ND ND 59.2 ND 4495.5 ND 4495.5 NA ND ND 713.0 ND ND ND ND ND 15.0 ND ND ND ND 47.8 ND 1758.2 ND 1758.2 NA ND ND 715.0 ND ND ND ND ND 28.7 ND ND ND ND 56.4 ND 4855.3 ND 4855.9 NA ND ND 715.0 ND ND ND ND ND 17.4 ND ND ND ND 74.0 1464.4 3230.8 ND 4695.2 NA ND 2329.5723.4 ND ND ND ND ND ND ND ND ND ND ND ND 6646.9 ND 6647.5 NA ND ND 724.0 ND ND ND ND ND ND ND ND ND ND 241.6 ND 4994.6 ND 4994.6 NA ND ND 725.0 ND ND ND ND ND ND ND ND ND ND 52.4 3047.6 22204.1 ND 25251.7 NA ND ND ____________________________________________________________________________________________________________________________________________________________* RCM = Resident California Mussel OYS = Oyster (Crassostrea gigas) NA = Not Analyzed RBM = Resident Bay Mussel (s = small size) GLY = Sand Worm (Glycera spp.) ND = Not Detected TCM = Transplanted California Mussel (a = archive) PAC = Shore Crab (Pachygrapsus crassipes)

O-8
APPENDIX OState Mussel Watch Program
Summary of 1995-97 Data: Organic Chemicals in Mussel, Oyster, Shore Crab, and Sand Worm(ppb, lipid weight)
____________________________________________________________________________________________________________________________________________________________ Aldrin alpha- cis- gamma- trans- cis- trans- Oxy- Total Chlor- DacthalStation Station Sample Sample Chlor- Chlor- Chlor- Chlor- Nona- Nona- chlor- Chlor- pyrifosNumber Name Type* Date dene dane dene dane chlor chlor dane dane____________________________________________________________________________________________________________________________________________________________725.0 Newport Bay/Crows Nest TCM 01/27/97 ND 27.0 297.3 ND 233.8 223.0 243.2 27.0 1051.3 154.1 41.9726.4 Newport Bay/Rhine Channel/End TCM 01/17/96 ND ND 585.7 37.3 399.2 529.5 589.3 61.5 2202.5 ND ND 726.4 Newport Bay/Rhine Channel/End TCM 01/27/97 ND ND 302.0 21.6 227.4 190.2 237.3 ND 978.4 172.6 121.6726.6 Newport Bay/Mariners Drive TCM 01/27/97 ND 25.9 309.0 19.8 248.1 146.1 275.5 ND 1025.9 219.2 152.2740.0 Dana Point Harbor/Boat Yard TCM 01/27/97 ND ND 71.3 ND 62.5 45.0 76.8 ND 256.6 ND ND 742.0 San Juan Creek RCM 01/18/96 ND ND 167.6 ND 154.1 83.6 208.7 ND 613.8 ND ND 750.0 Oceanside RCM 01/18/96 ND ND 360.6 ND 446.8 ND 412.4 ND 1219.6 ND ND 750.0 Oceanside RCM 09/30/96 ND ND 34.3 ND 26.7 ND 39.0 ND 100.0 ND ND 882.7 San Diego Bay/Sampson Street Pier TCM 01/18/96 ND ND 202.5 ND 208.9 242.6 215.3 ND 869.2 ND ND 883.1 San Diego Bay/Chollas Creek TCM 01/18/96 ND ND 360.3 ND 424.7 350.2 447.0 ND 1581.9 ND ND ____________________________________________________________________________________________________________________________________________________________ Diaz- o,p' p,p' o,p' p,p' o,p' p,p' p,p' Total Di- Diel- Endo- Endo- Endo- Total Endrin EthionStation inon DDD DDD DDE DDE DDT DDT DDMU DDT Chloro- drin sulfan sulfan sulfan Endo-Number Benzophenone I II sulfate sulfan____________________________________________________________________________________________________________________________________________________________725.0 ND 210.8 710.8 121.6 6382.4 114.9 409.5 267.6 8217.6 ND 287.8 ND ND ND ND ND ND 726.4 ND 304.5 1238.1 ND 10591.8 ND 170.9 ND 12305.3 ND 376.6 ND ND NA ND ND ND 726.4 ND 170.6 592.2 82.3 4874.5 117.7 676.5 180.4 6694.1 ND 303.9 ND ND ND ND ND ND 726.6 962.0 252.7 840.2 117.2 4855.4 235.9 1015.2 208.5 7525.1 ND 277.0 ND ND ND ND ND ND 740.0 ND ND ND ND 547.2 ND 63.6 ND 610.8 ND 35.1 109.7 ND ND 109.7 ND ND 742.0 ND ND 142.4 ND 1157.8 ND 101.3 ND 1401.5 ND ND ND ND NA ND ND ND 750.0 ND 432.5 1227.2 288.3 7475.7 ND 418.4 416.5 10258.5 ND 213.8 ND ND ND ND ND ND 750.0 ND ND 64.8 ND 798.1 ND ND ND 861.9 ND 39.0 ND ND ND ND ND ND 882.7 ND ND 170.6 ND 846.5 ND 328.0 ND 1344.7 ND 74.8 ND ND NA ND ND ND 883.1 ND ND 220.2 ND 819.9 ND 148.4 ND 1188.5 ND 72.5 ND ND NA ND ND ND ____________________________________________________________________________________________________________________________________________________________ alpha- beta- delta- gamma- Hepta- Hepta- Hexa- Meth- Ethyl- Methyl- Oxa- PCB PCB PCB Total PCT Tetra- Toxa-Station HCH HCH HCH HCH chlor chlor- chloro- oxy- para- para- diazon 1248 1254 1260 PCB 5460 difon pheneNumber (Lindane) epoxide benzene chlor thion thion____________________________________________________________________________________________________________________________________________________________725.0 ND ND ND ND ND ND ND ND ND ND 197.3 3124.3 14360.8 310.8 17797.3 NA ND 3141.9726.4 ND ND ND ND ND ND ND ND ND ND 80.3 4139.3 37668.0 ND 41807.8 NA ND ND 726.4 ND ND ND ND ND ND ND ND ND ND 411.8 1862.8 9186.3 205.9 11254.9 NA ND 4611.8726.6 ND ND ND ND ND ND ND ND ND ND 700.2 ND 1582.9 ND 1582.9 NA ND 4855.4740.0 ND ND ND ND ND ND ND ND ND ND 89.9 ND 835.5 ND 835.5 NA ND ND 742.0 ND ND ND ND ND ND ND ND ND ND ND ND 917.1 ND 917.7 NA ND ND 750.0 100.2 ND ND ND ND ND ND ND ND ND ND ND 1081.2 ND 1081.4 NA ND ND 750.0 ND ND ND ND ND ND ND ND ND ND ND ND ND ND ND NA ND ND 882.7 ND 184.4 0.5 ND ND ND ND ND ND ND ND ND 32237.6 ND 32237.2 NA ND ND 883.1 ND 358.9 ND ND ND ND ND ND ND ND ND ND 13480.8 ND 13480.8 NA ND ND ____________________________________________________________________________________________________________________________________________________________* RCM = Resident California Mussel OYS = Oyster (Crassostrea gigas) NA = Not Analyzed RBM = Resident Bay Mussel (s = small size) GLY = Sand Worm (Glycera spp.) ND = Not Detected TCM = Transplanted California Mussel (a = archive) PAC = Shore Crab (Pachygrapsus crassipes)

O-9
APPENDIX OState Mussel Watch Program
Summary of 1995-97 Data: Organic Chemicals in Mussel, Oyster, Shore Crab, and Sand Worm(ppb, lipid weight)
____________________________________________________________________________________________________________________________________________________________ Aldrin alpha- cis- gamma- trans- cis- trans- Oxy- Total Chlor- DacthalStation Station Sample Sample Chlor- Chlor- Chlor- Chlor- Nona- Nona- chlor- Chlor- pyrifosNumber Name Type* Date dene dane dene dane chlor chlor dane dane____________________________________________________________________________________________________________________________________________________________883.1 San Diego Bay/Chollas Creek TCM 01/28/97 ND 29.8 441.4 23.9 395.6 224.6 310.1 ND 1423.5 ND 49.7883.2 San Diego Bay/Chollas Creek/Mouth TCM 01/28/97 ND 20.0 212.7 ND 168.0 134.0 159.8 ND 693.3 ND ND 883.3 San Diego Bay/Chollas Creek/End TCM 01/28/97 ND 48.4 491.0 31.5 400.9 233.1 407.7 15.8 1628.4 121.6 ND 883.5 San Diego Bay/Tuna Docks TCM 01/28/97 ND ND 175.1 ND 145.9 131.8 105.6 ND 558.3 58.3 ND 883.6 San Diego Bay/7th Street Channel TCM 01/18/96 ND ND 61.6 ND 65.8 7.1 95.5 ND 230.0 ND ND 883.6 San Diego Bay/7th Street Channel TCM 01/28/97 ND 16.8 188.1 ND 180.4 110.8 117.3 ND 613.4 ND 36.1883.8 San Diego Bay/Switzer Creek TCM 01/18/96 ND ND 416.8 ND 364.9 323.3 401.5 ND 1506.1 ND ND 883.8 San Diego Bay/Switzer Creek TCM 01/28/97 ND 44.6 369.4 93.4 350.3 152.9 201.7 ND 1212.3 87.1 59.5885.1 San Diego Bay/Paleta Creek/End TCM 01/28/97 ND 39.4 283.9 34.2 274.6 166.8 277.7 ND 1077.7 ND ND 885.3 San Diego Bay/7th Street Ch/Mid TCM 01/28/97 ND 45.3 277.7 17.9 275.3 172.8 238.4 ND 1027.4 ND ND ____________________________________________________________________________________________________________________________________________________________ Diaz- o,p' p,p' o,p' p,p' o,p' p,p' p,p' Total Di- Diel- Endo- Endo- Endo- Total Endrin EthionStation inon DDD DDD DDE DDE DDT DDT DDMU DDT Chloro- drin sulfan sulfan sulfan Endo-Number Benzophenone I II sulfate sulfan____________________________________________________________________________________________________________________________________________________________883.1 ND ND 133.2 ND 582.5 ND 240.6 ND 956.3 ND 159.1 ND ND ND ND ND ND 883.2 ND ND 98.7 ND 514.7 ND 128.1 ND 740.3 ND 70.5 ND ND ND ND ND ND 883.3 ND ND 130.6 ND 503.4 58.6 302.9 ND 995.5 ND 174.6 ND ND ND ND ND ND 883.5 ND ND 109.7 ND 409.5 ND 114.7 ND 633.8 ND 50.3 ND ND ND ND ND ND 883.6 ND 42.1 89.1 ND 368.5 ND 53.8 ND 553.5 ND ND ND ND NA ND ND ND 883.6 ND ND 97.9 ND 315.7 ND 105.7 ND 520.6 ND 68.3 ND ND ND ND ND ND 883.8 ND ND 205.3 ND 1133.6 ND ND ND 1338.9 ND 107.3 ND ND NA ND ND ND 883.8 ND ND 106.2 ND 322.7 ND 218.7 ND 649.7 ND 131.6 ND ND ND ND ND ND 885.1 ND 157.5 332.6 ND 731.6 57.0 160.6 ND 1439.4 ND 92.2 ND ND ND ND ND ND 885.3 ND 153.8 265.8 ND 934.5 ND 137.1 83.4 1573.3 ND 104.9 ND ND ND ND ND ND ____________________________________________________________________________________________________________________________________________________________ alpha- beta- delta- gamma- Hepta- Hepta- Hexa- Meth- Ethyl- Methyl- Oxa- PCB PCB PCB Total PCT Tetra- Toxa-Station HCH HCH HCH HCH chlor chlor- chloro- oxy- para- para- diazon 1248 1254 1260 PCB 5460 difon pheneNumber (Lindane) epoxide benzene chlor thion thion____________________________________________________________________________________________________________________________________________________________883.1 ND ND ND ND ND ND ND ND ND ND 143.1 ND 5954.3 266.4 6220.7 NA ND ND 883.2 ND ND ND ND ND ND ND ND ND ND 102.2 1112.8 7212.7 406.6 8732.1 NA ND ND 883.3 ND ND ND ND ND 16.9 ND ND ND ND ND 1974.1 5220.7 207.2 7400.9 NA ND ND 883.5 ND ND ND ND ND ND ND ND ND ND 90.5 674.0 6201.2 581.5 7456.7 NA ND ND 883.6 ND 48.9 ND ND ND ND ND ND ND ND ND ND 4918.1 ND 4918.1 NA ND ND 883.6 ND ND ND ND ND ND ND ND ND ND 128.9 ND 6480.7 592.8 7073.5 NA ND ND883.8 ND 164.1 ND ND ND ND ND ND ND ND ND ND 12396.9 ND 12397.0 NA ND ND 883.8 ND ND ND ND ND ND ND ND ND ND 84.9 1872.6 5428.9 388.5 7690.0 NA ND ND 885.1 ND ND ND ND ND ND ND ND ND ND 391.7 2667.4 9174.1 526.4 12367.9 NA ND ND 885.3 ND ND ND ND ND ND ND ND ND ND 313.5 2473.2 9640.0 154.9 12268.2 NA ND ND ____________________________________________________________________________________________________________________________________________________________* RCM = Resident California Mussel OYS = Oyster (Crassostrea gigas) NA = Not Analyzed RBM = Resident Bay Mussel (s = small size) GLY = Sand Worm (Glycera spp.) ND = Not Detected TCM = Transplanted California Mussel (a = archive) PAC = Shore Crab (Pachygrapsus crassipes)

O-10
APPENDIX OState Mussel Watch Program
Summary of 1995-97 Data: Organic Chemicals in Mussel, Oyster, Shore Crab, and Sand Worm(ppb, lipid weight)
____________________________________________________________________________________________________________________________________________________________ Aldrin alpha- cis- gamma- trans- cis- trans- Oxy- Total Chlor- DacthalStation Station Sample Sample Chlor- Chlor- Chlor- Chlor- Nona- Nona- chlor- Chlor- pyrifosNumber Name Type* Date dene dane dene dane chlor chlor dane dane____________________________________________________________________________________________________________________________________________________________886.0 San Diego Bay/NASSCO TCM 01/18/96 ND ND 271.4 ND 210.4 218.6 246.3 ND 947.0 ND ND 888.0 San Diego Bay/Coronado Bridge RBM 01/28/97 ND ND 114.6 ND 97.5 85.1 108.4 ND 407.1 ND 32.5893.0 San Diego Bay/Laurel Street TCM 01/18/96 ND ND 759.0 ND 736.9 491.1 687.5 ND 2674.5 ND ND 893.5 San Diego Bay/B Street Pier TCM 01/18/96 ND ND 239.1 ND 191.6 165.3 182.8 ND 778.7 ND ND 894.0 SD Bay/Harbor Is/E Basin/Storm Dr TCM 01/28/97 ND 70.5 463.9 145.9 418.0 145.9 272.1 ND 1516.4 ND 68.8____________________________________________________________________________________________________________________________________________________________ Diaz- o,p' p,p' o,p' p,p' o,p' p,p' p,p' Total Di- Diel- Endo- Endo- Endo- Total Endrin EthionStation inon DDD DDD DDE DDE DDT DDT DDMU DDT Chloro- drin sulfan sulfan sulfan Endo-Number Benzophenone I II sulfate sulfan____________________________________________________________________________________________________________________________________________________________886.0 ND ND 195.6 ND 823.7 ND 170.2 ND 1189.6 ND 86.4 ND ND NA ND ND ND 888.0 ND ND 74.3 ND 337.5 ND 114.6 ND 526.3 ND 24.8 ND ND ND ND ND ND 893.0 ND ND 393.0 ND 1357.2 ND 269.4 ND 2019.6 ND 95.9 ND ND NA ND ND ND 893.5 ND ND 229.5 ND 930.3 ND 140.4 ND 1300.4 ND 121.3 ND ND NA ND ND ND 894.0 ND 1200.0 3760.7 ND 603.3 247.5 109.8 160.7 6082.0 ND 113.1 ND ND ND ND ND ND ____________________________________________________________________________________________________________________________________________________________ alpha- beta- delta- gamma- Hepta- Hepta- Hexa- Meth- Ethyl- Methyl- Oxa- PCB PCB PCB Total PCT Tetra- Toxa-Station HCH HCH HCH HCH chlor chlor- chloro- oxy- para- para- diazon 1248 1254 1260 PCB 5460 difon pheneNumber (Lindane) epoxide benzene chlor thion thion____________________________________________________________________________________________________________________________________________________________886.0 ND 128.3 ND ND ND ND ND ND ND ND ND ND 14399.5 ND 14400.0 NA ND ND 888.0 ND ND ND ND ND ND ND ND ND ND 92.9 1888.5 5435.0 219.8 7543.3 NA ND ND 893.0 ND ND ND ND ND ND ND ND ND ND 531.4 5313.7 35675.3 ND 40988.2 NA ND ND 893.5 ND ND ND ND ND ND ND ND ND ND ND ND 11643.7 ND 11642.9 NA ND ND 894.0 ND ND ND ND ND ND 27.9 ND ND ND 439.3 920852.4 177462.3 6870.5 1105185.0 NA ND ND ____________________________________________________________________________________________________________________________________________________________* RCM = Resident California Mussel OYS = Oyster (Crassostrea gigas) NA = Not Analyzed RBM = Resident Bay Mussel (s = small size) GLY = Sand Worm (Glycera spp.) ND = Not Detected TCM = Transplanted California Mussel (a = archive) PAC = Shore Crab (Pachygrapsus crassipes)

P-1
APPENDIX P
Summary of 1995-97 Data
Organic Chemicals in Sediment
(ppb, dry weight)

P-2
APPENDIX PState Mussel Watch Program
Summary of 1995-97 Data: Organic Chemicals in Sediment (ppb, dry weight)____________________________________________________________________________________________________________________________________________________________ Aldrin alpha- cis- gamma- trans- cis- trans- Oxy- Total Chlor- DacthalStation Station Sample Sample Chlor- Chlor- Chlor- Chlor- Nona- Nona- chlor- Chlor- pyrifosNumber Name Type* Date dene dane dene dane chlor chlor dane dane____________________________________________________________________________________________________________________________________________________________299.1 Selby Slag 4 SED 10/27/95 ND ND ND ND ND ND ND ND ND ND ND 302.6 Paradise Cove SED 10/26/95 ND ND ND ND ND ND ND ND ND ND ND 306.1 Gashouse Cove/Laguna Street SED 12/07/95 ND ND ND ND ND ND ND ND ND ND ND 306.2 Sansome Street/Pier 31 SED 12/06/95 ND ND ND ND ND ND ND ND ND ND ND 306.3 Howard Street/Pier 14 SED 12/06/95 ND ND ND ND 1.0 1.1 ND ND 2.1 ND ND 306.4 Central Basin/Outer SED 12/06/95 ND ND ND ND ND ND ND ND ND ND ND 311.4 North South Bay SED 12/06/95 ND ND ND ND ND ND ND ND ND ND ND ____________________________________________________________________________________________________________________________________________________________ Diaz- o,p' p,p' o,p' p,p' o,p' p,p' p,p' Total Di- Dieldrin Endo- Endo- Endo- Total Endrin EthionStation inon DDD DDD DDE DDE DDT DDT DDMU DDT Chloro- sulfan sulfan sulfan Endo-Number Benzophenone I II sulfate sulfan____________________________________________________________________________________________________________________________________________________________299.1 NA ND 1.0 ND 1.8 ND ND ND 2.8 ND ND ND ND ND ND ND NA 302.6 NA ND 2.3 ND 1.7 ND ND ND 4.0 ND ND ND ND ND ND ND NA 306.1 NA ND 2.0 ND 1.9 ND ND ND 4.0 ND 3.9 ND ND ND ND ND NA 306.2 NA ND 1.5 ND 1.6 ND 1.7 ND 4.8 ND ND ND ND ND ND ND NA 306.3 NA 1.7 5.0 ND 2.9 ND 1.6 ND 11.3 ND ND ND ND ND ND ND NA 306.4 NA 0.0 1.7 ND 1.4 ND ND ND 3.1 ND ND ND ND ND ND ND NA 311.4 NA ND ND ND ND ND ND ND ND ND ND ND ND ND ND ND NA ____________________________________________________________________________________________________________________________________________________________ alpha- beta- delta- gamma- Hepta- Hepta- Hexa- Meth- Ethyl- Methyl- Oxa- PCB PCB PCB Total PCT Tetra- Toxa-Station HCH HCH HCH HCH chlor chlor- chloro- oxy- para- para- diazon 1248 1254 1260 PCB 5460 difon pheneNumber (Lindane) epoxide benzene chlor thion thion____________________________________________________________________________________________________________________________________________________________299.1 ND 2.6 ND ND ND ND ND 1.7 NA NA ND NA NA NA NA ND NA ND 302.6 ND 2.8 ND ND ND ND ND 1.3 NA NA ND NA NA NA NA ND NA ND 306.1 ND 6.5 ND ND ND ND ND 2.8 NA NA ND NA NA NA NA ND NA ND 306.2 ND 6.8 ND ND ND ND ND 2.4 NA NA ND NA NA NA NA ND NA ND 306.3 ND 16.0 ND ND ND ND ND 8.2 NA NA ND NA NA NA NA ND NA ND 306.4 ND 7.9 ND ND ND ND ND 3.1 NA NA ND NA NA NA NA ND NA ND 311.4 ND 1.7 ND ND ND ND ND ND NA NA ND NA NA NA NA ND NA ND ____________________________________________________________________________________________________________________________________________________________* SED = Sediment NA = Not Analyzed ND = Not Detected

Q-1
APPENDIX Q
Summary of 1995-97 Data
PAHs in Mussel, Oyster, Abalone Jingle, Shore Crab,
and Sand Worm
(ppb, wet weight)

Q-2
APPENDIX QState Mussel Watch Program
Summary of 1995-97 Data: PAHs in Mussel, Oyster, Abalone Jingle, Shore Crab, and Sand Worm(ppb, wet weight)
_________________________________________________________________________________________________________________________________________________________________Station Station Sample Sample Total Anthracene Anthracene, Anthracene, Biphenyl Chrysene FluorantheneNumber Name Type* Date PAH benz(a) dibenz(a,h)_________________________________________________________________________________________________________________________________________________________________ 1.0 Crescent City Harbor RCM 04/09/97 186.1 1.9 4.1 ND ND 9.7 14.3 2.0 Crescent City/STP Outfall RCM 04/09/97 ND ND ND ND ND ND ND 2.2 Crescent City Harbor/Inner Jetty RCM 04/09/97 14.6 ND ND ND ND ND 2.8 3.0 Crescent City/Control RCM 04/10/97 15.6 ND ND ND ND ND 1.5100.0 Mad River Slough OYS 04/10/97 43.0 ND ND ND ND ND 8.4101.4 Arcata Bay/Jolly Giant Slough PAC 04/18/96 3.6 ND ND ND ND ND ND 101.5 Humboldt Bay/Eureka SM.22 TCM 02/15/95 24.2 ND ND ND ND ND 3.2101.8 Humboldt Bay/Halberson Shoreline RBM-s 04/17/96 110.6 2.5 6.9 ND ND 9.2 20.5101.8 Humboldt Bay/Halberson Shoreline PAC 04/17/96 ND ND ND ND ND ND ND 101.8 Humboldt Bay/Halberson Shoreline GLY 04/17/96 18.9 ND 1.6 ND ND 1.3 2.1_________________________________________________________________________________________________________________________________________________________________Station Fluoranthene, Fluoranthene, Fluorene Naphthalene Naphthalene, Naphthalene, Naphthalene, Naphthalene, Naphthene,Number benzo(b) benzo(k) 1-methyl 2-methyl 2,6-dimethyl 2,3,5-trimethyl ace_________________________________________________________________________________________________________________________________________________________________ 1.0 6.6 2.7 7.3 10.1 4.1 7.0 19.3 13.9 ND 2.0 ND ND ND ND ND ND ND ND ND 2.2 ND ND ND ND ND 3.3 ND ND ND 3.0 ND ND ND ND ND 1.6 1.6 ND ND 100.0 ND ND 2.2 ND 1.6 2.3 1.9 ND ND 101.4 ND ND ND ND ND ND ND ND ND 101.5 ND ND 2.2 ND ND 4.7 ND ND ND 101.8 6.2 6.7 1.8 2.0 1.9 2.7 ND ND ND 101.8 ND ND ND ND ND ND ND ND ND 101.8 ND 1.3 ND 2.0 ND ND ND ND 2.3_________________________________________________________________________________________________________________________________________________________________Station Naphthylene, Perylene Perylene, Phenanthrene Phenanthrene, Pyrene Pyrene, Pyrene, Pyrene,Number ace benzo(ghi) 1-methyl benzo(a) benzo(e) indeno(1,2,3-cd)_________________________________________________________________________________________________________________________________________________________________ 1.0 ND 1.4 1.5 25.7 32.2 16.6 1.8 4.5 1.5 2.0 ND ND ND ND ND ND ND ND ND 2.2 ND ND ND 6.6 ND 1.9 ND ND ND 3.0 ND ND ND 5.2 3.7 2.0 ND ND ND 100.0 ND ND ND 9.8 9.6 7.1 ND ND ND 101.4 ND ND ND ND ND 3.6 ND ND ND 101.5 ND ND ND 10.2 ND 4.0 ND ND ND 101.8 ND 4.7 4.0 12.3 ND 15.8 4.7 4.7 4.1101.8 ND ND ND ND ND ND ND ND ND 101.8 ND 1.4 ND 1.4 ND 4.3 1.3 ND ND _________________________________________________________________________________________________________________________________________________________________* RCM = Resident California Mussel POD = Abalone Jingle (Pododesmus cepio) ND = Not Detected TCM = Transplanted California Mussel PAC = Shore Crab (Pachygrapsus crassipes) RBM = Resident Bay Mussel (s = small size) GYL = Sand Worm (Glycera spp.) OYS = Oyster (Crassostrea gigas)

Q-3
APPENDIX QState Mussel Watch Program
Summary of 1995-97 Data: PAHs in Mussel, Oyster, Abalone Jingle, Shore Crab, and Sand Worm(ppb, wet weight)
_________________________________________________________________________________________________________________________________________________________________Station Station Sample Sample Total Anthracene Anthracene, Anthracene, Biphenyl Chrysene FluorantheneNumber Name Type* Date PAH benz(a) dibenz(a,h)_________________________________________________________________________________________________________________________________________________________________102.6 Humboldt Bay/J Street RCM 02/15/95 181.6 1.0 8.3 ND ND 10.9 63.8102.6 Humboldt Bay/J Street PAC 02/15/95 106.6 ND 2.7 ND 2.7 5.2 13.9102.6 Humboldt Bay/J Street TCM 02/15/95 27.7 ND ND ND ND ND 4.3102.6 Humboldt Bay/J Street POD 02/15/95 7168.1 461.9 301.1 28.4 81.2 456.3 1170.6102.6 Humboldt Bay/J Street GLY 04/17/96 35.9 ND 1.4 ND ND 2.7 5.7102.6 Humboldt Bay/J Street PAC 04/17/96 19.4 ND ND ND ND 5.2 5.0102.6 Humboldt Bay/J Street RBM 04/17/96 91.3 1.6 6.1 5.4 ND 9.7 12.0102.6 Humboldt Bay/J Street TCM 04/10/97 77.4 ND 2.3 ND ND 3.1 14.4102.7 Humboldt Bay/H Street TCM 02/15/95 23.3 ND ND ND ND ND 3.0102.7 Humboldt Bay/H Street RBM-s 04/17/96 126.4 2.8 7.2 ND 1.7 9.6 23.5_________________________________________________________________________________________________________________________________________________________________Station Fluoranthene, Fluoranthene, Fluorene Naphthalene Naphthalene, Naphthalene, Naphthalene, Naphthalene, Naphthene,Number benzo(b) benzo(k) 1-methyl 2-methyl 2,6-dimethyl 2,3,5-trimethyl ace_________________________________________________________________________________________________________________________________________________________________102.6 9.6 3.7 1.1 ND ND 1.0 ND ND ND 102.6 7.4 2.3 2.1 5.6 3.9 4.8 5.4 ND 5.4102.6 ND ND 2.1 ND ND 5.3 ND ND ND 102.6 286.1 103.2 422.6 254.3 104.7 61.3 37.0 9.7 525.5102.6 1.7 ND ND 3.8 ND ND ND ND 7.1102.6 ND ND ND ND ND ND ND ND 4.1102.6 5.7 5.9 1.1 1.3 1.2 1.6 ND ND 1.4102.6 ND ND 4.2 ND 1.9 4.9 ND ND 2.3102.7 ND ND 2.0 ND ND 6.6 ND ND ND 102.7 5.7 6.2 2.4 3.9 3.3 4.4 ND ND 3.9_________________________________________________________________________________________________________________________________________________________________Station Naphthylene, Perylene Perylene, Phenanthrene Phenanthrene, Pyrene Pyrene, Pyrene, Pyrene,Number ace benzo(ghi) 1-methyl benzo(a) benzo(e) indeno(1,2,3-cd)_________________________________________________________________________________________________________________________________________________________________102.6 ND 1.3 2.3 19.0 1.9 46.6 1.9 7.4 1.9102.6 ND ND 3.9 11.0 ND 19.7 3.5 4.1 3.1102.6 ND ND ND 11.2 ND 4.8 ND ND ND 102.6 43.4 49.7 79.8 1453.0 51.4 774.2 190.7 131.3 90.5102.6 ND ND ND 3.6 ND 10.0 ND ND ND 102.6 ND ND ND ND ND 5.2 ND ND ND 102.6 ND 4.4 3.5 5.9 ND 10.4 4.2 5.4 4.6102.6 ND ND ND 20.8 7.3 16.1 ND ND ND 102.7 ND ND ND 8.4 ND 3.4 ND ND ND 102.7 ND 2.3 4.3 17.5 ND 17.4 2.7 5.0 2.7_________________________________________________________________________________________________________________________________________________________________* RCM = Resident California Mussel POD = Abalone Jingle (Pododesmus cepio) ND = Not Detected TCM = Transplanted California Mussel PAC = Shore Crab (Pachygrapsus crassipes) RBM = Resident Bay Mussel (s = small size) GYL = Sand Worm (Glycera spp.) OYS = Oyster (Crassostrea gigas)

Q-4
APPENDIX QState Mussel Watch Program
Summary of 1995-97 Data: PAHs in Mussel, Oyster, Abalone Jingle, Shore Crab, and Sand Worm(ppb, wet weight)
_________________________________________________________________________________________________________________________________________________________________Station Station Sample Sample Total Anthracene Anthracene, Anthracene, Biphenyl Chrysene FluorantheneNumber Name Type* Date PAH benz(a) dibenz(a,h)_________________________________________________________________________________________________________________________________________________________________102.7 Humboldt Bay/H Street PAC 04/17/96 103.9 ND 5.8 10.2 ND 11.8 3.9102.7 Humboldt Bay/H Street GLY 04/17/96 103.5 ND ND ND ND 4.5 39.6103.3 Humboldt Bay/E Street TCM 04/10/97 49.8 ND ND ND ND 3.3 8.1103.5 Humboldt Bay/Clark Slough TCM 04/10/97 54.1 2.1 3.8 ND ND 4.5 8.7104.1 Humboldt Bay/Union Oil Plant TCM 02/15/95 29.0 ND ND ND ND 1.6 4.2104.2 Humboldt Bay/Coal Oil Gas Plant TCM 02/15/95 41.2 ND ND ND ND ND 6.0104.3 Humboldt Bay/Old Pac. Lumber TCM 02/15/95 13.7 ND ND ND ND ND 2.0202.0 Bodega Head RCM 08/29/96 ND ND ND ND ND ND ND 205.0 Bodega Harbor/Spud Point Marina TCM 03/21/97 79.2 1.8 2.0 ND 1.2 5.2 12.3205.1 Bodega Bay/Porto Bodega RBM 03/21/97 233.3 ND 7.5 ND ND 28.0 77.4_________________________________________________________________________________________________________________________________________________________________Station Fluoranthene, Fluoranthene, Fluorene Naphthalene Naphthalene, Naphthalene, Naphthalene, Naphthalene, Naphthene,Number benzo(b) benzo(k) 1-methyl 2-methyl 2,6-dimethyl 2,3,5-trimethyl ace_________________________________________________________________________________________________________________________________________________________________102.7 8.4 11.1 ND ND ND ND ND ND ND 102.7 ND ND 16.3 2.3 ND ND ND ND 2.1103.3 ND ND 3.1 ND ND 2.9 1.9 ND ND 103.5 2.0 ND 2.9 ND ND 3.1 2.0 ND ND 104.1 ND ND 1.9 ND ND 6.4 ND ND ND 104.2 ND ND 2.8 1.8 ND 5.3 ND ND 2.2104.3 ND ND ND ND ND 3.8 ND ND ND 202.0 ND ND ND ND ND ND ND ND ND 205.0 1.8 1.2 2.6 ND 3.3 6.9 4.1 3.5 ND 205.1 9.0 3.5 3.9 ND 1.5 2.4 2.3 2.7 ND _________________________________________________________________________________________________________________________________________________________________Station Naphthylene, Perylene Perylene, Phenanthrene Phenanthrene, Pyrene Pyrene, Pyrene, Pyrene,Number ace benzo(ghi) 1-methyl benzo(a) benzo(e) indeno(1,2,3-cd)_________________________________________________________________________________________________________________________________________________________________102.7 ND 7.4 10.4 ND ND 4.8 10.5 7.8 11.8102.7 ND ND ND 7.1 ND 29.1 ND 2.6 ND 103.3 ND ND ND 14.1 4.8 9.7 ND 2.0 ND 103.5 ND ND ND 16.4 2.7 5.9 ND ND ND 104.1 ND ND ND 10.7 ND 4.2 ND ND ND 104.2 ND ND ND 16.5 ND 6.5 ND ND ND 104.3 ND ND ND 5.9 ND 2.1 ND ND ND 202.0 ND ND ND ND ND ND ND ND ND 205.0 ND ND ND 17.1 4.2 9.3 1.6 1.2 ND 205.1 ND 1.8 ND 25.7 15.1 44.3 2.2 6.0 ND _________________________________________________________________________________________________________________________________________________________________* RCM = Resident California Mussel POD = Abalone Jingle (Pododesmus cepio) ND = Not Detected TCM = Transplanted California Mussel PAC = Shore Crab (Pachygrapsus crassipes) RBM = Resident Bay Mussel (s = small size) GYL = Sand Worm (Glycera spp.) OYS = Oyster (Crassostrea gigas)

Q-5
APPENDIX QState Mussel Watch Program
Summary of 1995-97 Data: PAHs in Mussel, Oyster, Abalone Jingle, Shore Crab, and Sand Worm(ppb, wet weight)
_________________________________________________________________________________________________________________________________________________________________Station Station Sample Sample Total Anthracene Anthracene, Anthracene, Biphenyl Chrysene FluorantheneNumber Name Type* Date PAH benz(a) dibenz(a,h)_________________________________________________________________________________________________________________________________________________________________205.3 Bodega Bay/Mason's Marina TCM 03/21/97 50.5 ND 2.0 ND ND 4.4 8.4205.5 Bodega Bay/Back Marsh RBM 03/21/97 47.2 1.0 1.4 ND ND 3.4 7.4280.0 Russian River/S Goat Rock RCM 03/21/97 20.8 ND ND ND 6.9 ND 1.6400.6 Santa Cruz/Natural Bridges RCM 06/09/97 17.2 ND ND ND ND ND 3.0403.0 Elkhorn Slough/Highway 1 Bridge TCM 03/12/97 37.0 ND ND ND ND ND 4.4404.0 Sandholdt Bridge TCM 03/04/97 42.7 1.2 1.2 ND ND 2.0 4.3414.0 Pacific Grove RCM 04/25/97 1.3 ND ND ND ND ND ND 601.0 LA Harbor/National Steel TCM 01/28/97 240.4 5.0 ND ND ND 33.9 62.5616.0 LA Harbor/Consolidated Slip TCM 01/28/97 257.5 3.2 16.6 ND ND 40.0 42.2650.0 Santa Monica RCM 11/25/96 38.9 ND 2.2 ND ND 2.4 4.7_________________________________________________________________________________________________________________________________________________________________Station Fluoranthene, Fluoranthene, Fluorene Naphthalene Naphthalene, Naphthalene, Naphthalene, Naphthalene, Naphthene,Number benzo(b) benzo(k) 1-methyl 2-methyl 2,6-dimethyl 2,3,5-trimethyl ace_________________________________________________________________________________________________________________________________________________________________205.3 ND ND 3.9 ND ND 2.9 ND 3.7 ND 205.5 1.4 ND 2.8 ND 1.9 3.2 2.0 ND ND 280.0 ND ND ND ND ND 1.6 ND ND ND 400.6 ND ND ND ND ND ND ND ND ND 403.0 ND ND 1.8 8.1 2.0 3.8 ND ND ND 404.0 ND ND 2.8 6.4 1.2 2.8 1.2 ND ND 414.0 ND ND ND ND ND ND ND ND ND 601.0 26.9 9.3 2.0 ND 2.2 ND ND ND ND 616.0 18.1 7.3 1.9 ND 3.8 5.1 3.2 5.3 2.5650.0 ND ND 3.6 ND ND 3.6 ND ND ND _________________________________________________________________________________________________________________________________________________________________Station Naphthylene, Perylene Perylene, Phenanthrene Phenanthrene, Pyrene Pyrene, Pyrene, Pyrene,Number ace benzo(ghi) 1-methyl benzo(a) benzo(e) indeno(1,2,3-cd)_________________________________________________________________________________________________________________________________________________________________205.3 ND ND ND 20.4 4.8 ND ND ND ND 205.5 1.0 ND ND 10.4 6.7 4.7 ND ND ND 280.0 ND ND ND 4.6 3.1 3.0 ND ND ND 400.6 ND ND ND 5.7 4.8 3.7 ND ND ND 403.0 ND ND ND 6.7 5.4 4.8 ND ND ND 404.0 ND ND ND 12.3 2.8 4.4 ND ND ND 414.0 ND ND ND 1.3 ND ND ND ND ND 601.0 1.2 ND ND 5.8 2.5 61.7 7.1 20.3 ND 616.0 2.5 ND 3.6 7.1 10.6 55.3 6.1 18.7 4.4650.0 ND ND ND 14.9 3.7 4.0 ND ND ND _________________________________________________________________________________________________________________________________________________________________* RCM = Resident California Mussel POD = Abalone Jingle (Pododesmus cepio) ND = Not Detected TCM = Transplanted California Mussel PAC = Shore Crab (Pachygrapsus crassipes) RBM = Resident Bay Mussel (s = small size) GYL = Sand Worm (Glycera spp.) OYS = Oyster (Crassostrea gigas)

Q-6
APPENDIX QState Mussel Watch Program
Summary of 1995-97 Data: PAHs in Mussel, Oyster, Abalone Jingle, Shore Crab, and Sand Worm(ppb, wet weight)
_________________________________________________________________________________________________________________________________________________________________Station Station Sample Sample Total Anthracene Anthracene, Anthracene, Biphenyl Chrysene FluorantheneNumber Name Type* Date PAH benz(a) dibenz(a,h)_________________________________________________________________________________________________________________________________________________________________740.0 Dana Point Harbor/Boat Yard TCM 01/27/97 33.2 1.6 3.3 ND ND 6.7 3.1750.0 Oceanside RCM 09/30/96 8.2 ND ND ND ND ND 1.6883.1 San Diego Bay/Chollas Creek TCM 01/28/97 2610.4 41.2 358.0 13.1 8.1 352.5 394.3883.2 San Diego Bay/Chollas Creek/Mouth TCM 01/28/97 16291.6 691.2 1541.0 38.4 45.7 1108.6 4289.5883.3 San Diego Bay/Chollas Creek/End TCM 01/28/97 5028.1 47.7 449.1 6.4 7.9 430.1 1523.2883.5 San Diego Bay/Tuna Docks TCM 01/28/97 2913.3 115.4 231.6 3.8 5.7 211.2 892.8883.6 San Diego Bay/7th Street Channel TCM 01/28/97 13347.7 476.2 856.8 20.0 36.6 749.0 4079.6883.8 San Diego Bay/Switzer Creek TCM 01/28/97 307.0 5.9 29.4 2.3 1.6 32.6 77.4885.1 San Diego Bay/Paleta Creek/End TCM 01/28/97 5620.6 121.8 479.9 9.0 10.7 540.3 1608.9885.3 San Diego Bay/7th Street Ch/Mid TCM 01/28/97 22287.3 399.3 1773.9 32.1 42.2 1360.8 7524.9_________________________________________________________________________________________________________________________________________________________________Station Fluoranthene, Fluoranthene, Fluorene Naphthalene Naphthalene, Naphthalene, Naphthalene, Naphthalene, Naphthene,Number benzo(b) benzo(k) 1-methyl 2-methyl 2,6-dimethyl 2,3,5-trimethyl ace_________________________________________________________________________________________________________________________________________________________________740.0 2.4 ND ND ND 1.3 4.6 1.5 ND ND 750.0 ND ND ND ND ND 1.7 ND ND ND 883.1 67.7 27.7 26.6 5.7 9.5 7.6 ND 5.7 20.4883.2 1128.2 293.3 292.1 20.1 45.2 126.5 44.4 18.5 169.1883.3 200.5 40.2 87.3 ND 4.8 12.3 8.2 5.2 59.7883.5 107.6 28.1 46.8 ND 4.6 16.6 6.3 4.0 27.6883.6 503.4 112.7 338.5 19.0 34.7 80.1 31.1 16.4 186.0883.8 14.3 5.4 5.9 ND 2.0 2.8 ND 1.2 3.2885.1 307.8 66.0 93.0 5.3 10.5 23.9 14.1 7.8 68.4885.3 1158.3 275.4 226.0 7.2 43.6 102.1 49.5 19.1 185.5_________________________________________________________________________________________________________________________________________________________________Station Naphthylene, Perylene Perylene, Phenanthrene Phenanthrene, Pyrene Pyrene, Pyrene, Pyrene,Number ace benzo(ghi) 1-methyl benzo(a) benzo(e) indeno(1,2,3-cd)_________________________________________________________________________________________________________________________________________________________________740.0 ND ND ND 4.2 1.6 1.8 1.3 ND ND 750.0 ND 1.8 ND 3.0 ND ND ND ND ND 883.1 8.9 ND 171.1 233.4 13.6 688.2 94.9 45.7 16.6883.2 14.9 162.1 129.9 2219.5 143.8 2771.5 369.1 494.5 134.6883.3 6.3 24.8 25.3 799.9 58.5 1078.6 29.0 98.6 24.8883.5 4.4 17.0 10.8 459.6 31.4 594.0 24.2 58.4 11.2883.6 16.4 72.2 58.2 2529.6 140.1 2554.4 137.6 244.3 54.9883.8 1.6 ND 3.0 50.8 3.0 49.7 3.6 8.4 2.7885.1 4.6 31.6 33.7 708.7 61.6 1171.8 57.4 155.3 28.5885.3 14.7 134.5 118.3 3021.3 302.1 4568.4 325.6 485.2 117.4_________________________________________________________________________________________________________________________________________________________________* RCM = Resident California Mussel POD = Abalone Jingle (Pododesmus cepio) ND = Not Detected TCM = Transplanted California Mussel PAC = Shore Crab (Pachygrapsus crassipes) RBM = Resident Bay Mussel (s = small size) GYL = Sand Worm (Glycera spp.) OYS = Oyster (Crassostrea gigas)

Q-7
APPENDIX QState Mussel Watch Program
Summary of 1995-97 Data: PAHs in Mussel, Oyster, Abalone Jingle, Shore Crab, and Sand Worm(ppb, wet weight)
_________________________________________________________________________________________________________________________________________________________________Station Station Sample Sample Total Anthracene Anthracene, Anthracene, Biphenyl Chrysene FluorantheneNumber Name Type* Date PAH benz(a) dibenz(a,h)_________________________________________________________________________________________________________________________________________________________________888.0 San Diego Bay/Coronado Bridge RBM 01/28/97 279.7 2.6 21.6 3.7 ND 40.0 78.0894.0 SD Bay/Harbor Is/E Basin/Storm Dr TCM 01/28/97 134.2 2.8 8.7 ND ND 17.9 38.9_________________________________________________________________________________________________________________________________________________________________Station Fluoranthene, Fluoranthene, Fluorene Naphthalene Naphthalene, Naphthalene, Naphthalene, Naphthalene, Naphthene,Number benzo(b) benzo(k) 1-methyl 2-methyl 2,6-dimethyl 2,3,5-trimethyl ace_________________________________________________________________________________________________________________________________________________________________888.0 36.0 13.1 ND ND ND ND ND ND ND 894.0 11.0 5.3 ND ND ND ND ND ND ND _________________________________________________________________________________________________________________________________________________________________Station Naphthylene, Perylene Perylene, Phenanthrene Phenanthrene, Pyrene Pyrene, Pyrene, Pyrene,Number ace benzo(ghi) 1-methyl benzo(a) benzo(e) indeno(1,2,3-cd)_________________________________________________________________________________________________________________________________________________________________888.0 ND ND 3.9 8.3 ND 43.1 5.5 19.3 4.8894.0 ND ND 3.3 6.3 ND 25.9 3.3 8.0 2.9_________________________________________________________________________________________________________________________________________________________________* RCM = Resident California Mussel POD = Abalone Jingle (Pododesmus cepio) ND = Not Detected TCM = Transplanted California Mussel PAC = Shore Crab (Pachygrapsus crassipes) RBM = Resident Bay Mussel (s = small size) GYL = Sand Worm (Glycera spp.) OYS = Oyster (Crassostrea gigas)

R-1
APPENDIX R
Summary of 1995-97 Data
PAHs in Mussel, Oyster, Abalone Jingle, Shore Crab,
and Sand Worm
(ppb, dry weight)

R-2
APPENDIX RState Mussel Watch Program
Summary of 1995-97 Data: PAHs in Mussel, Oyster, Abalone Jingle, Shore Crab, and Sand Worm(ppb, dry weight)
__________________________________________________________________________________________________________________________________________________________________Station Station Sample Sample Total Anthracene Anthracene, Anthracene, Biphenyl Chrysene FluorantheneNumber Name Type* Date PAH benz(a) dibenz(a,h)__________________________________________________________________________________________________________________________________________________________________ 1.0 Crescent City Harbor RCM 04/09/97 1420.6 14.4 30.9 ND ND 74.1 109.0 2.0 Crescent City/STP Outfall RCM 04/09/97 ND ND ND ND ND ND ND 2.2 Crescent City Harbor/Inner Jetty RCM 04/09/97 84.8 ND ND ND ND ND 16.0 3.0 Crescent City/Control RCM 04/10/97 101.6 ND ND ND ND ND 10.0100.0 Mad River Slough OYS 04/10/97 284.5 ND ND ND ND ND 55.9101.4 Arcata Bay/Jolly Giant Slough PAC 04/18/96 11.9 ND ND ND ND ND ND 101.5 Humboldt Bay/Eureka SM.22 TCM 02/15/95 145.0 ND ND ND ND ND 19.0101.8 Humboldt Bay/Halberson Shoreline RBM-s 04/17/96 723.1 16.2 45.4 ND ND 60.1 134.0101.8 Humboldt Bay/Halberson Shoreline GLY 04/17/96 165.7 ND 13.9 ND ND 11.1 18.8101.8 Humboldt Bay/Halberson Shoreline PAC 04/17/96 ND ND ND ND ND ND ND _________________________________________________________________________________________________________________________________________________________________Station Fluoranthene, Fluoranthene, Fluorene Naphthalene Naphthalene, Naphthalene, Naphthalene, Naphthalene, Naphthene,Number benzo(b) benzo(k) 1-methyl 2-methyl 2,6-dimethyl 2,3,5-trimethyl ace_________________________________________________________________________________________________________________________________________________________________ 1.0 50.4 20.6 56.0 77.1 31.3 53.1 147.0 106.0 ND 2.0 ND ND ND ND ND ND ND ND ND 2.2 ND ND ND ND ND 19.3 ND ND ND 3.0 ND ND ND ND ND 10.1 10.4 ND ND 100.0 ND ND 14.8 ND 10.8 15.4 12.8 ND ND 101.4 ND ND ND ND ND ND ND ND ND 101.5 ND ND 13.0 ND ND 28.0 ND ND ND 101.8 40.2 43.9 11.9 13.3 12.5 17.5 ND ND ND 101.8 ND 11.3 ND 17.4 ND ND ND ND 20.1101.8 ND ND ND ND ND ND ND ND ND _________________________________________________________________________________________________________________________________________________________________Station Naphthylene, Perylene Perylene, Phenanthrene Phenanthrene, Pyrene Pyrene, Pyrene, Pyrene,Number ace benzo(ghi) 1-methyl benzo(a) benzo(e) indeno(1,2,3-cd)_________________________________________________________________________________________________________________________________________________________________ 1.0 ND 10.8 11.5 196.0 246.0 127.0 13.5 34.4 11.5 2.0 ND ND ND ND ND ND ND ND ND 2.2 ND ND ND 38.3 ND 11.2 ND ND ND 3.0 ND ND ND 33.9 23.9 13.3 ND ND ND 100.0 ND ND ND 64.7 63.3 46.8 ND ND ND 101.4 ND ND ND ND ND 11.9 ND ND ND 101.5 ND ND ND 61.0 ND 24.0 ND ND ND 101.8 ND 30.8 26.3 80.3 ND 103.0 30.6 30.4 26.7101.8 ND 12.3 ND 12.3 ND 37.5 11.0 ND ND 101.8 ND ND ND ND ND ND ND ND ND _________________________________________________________________________________________________________________________________________________________________* RCM = Resident California Mussel POD = Abalone Jingle (Pododesmus cepio) ND = Not Detected TCM = Transplanted California Mussel PAC = Shore Crab (Pachygrapsus crassipes) RBM = Resident Bay Mussel (s = small size) GYL = Sand Worm (Glycera spp.) OYS = Oyster (Crassostrea gigas)

R-3
APPENDIX RState Mussel Watch Program
Summary of 1995-97 Data: PAHs in Mussel, Oyster, Abalone Jingle, Shore Crab, and Sand Worm(ppb, dry weight)
__________________________________________________________________________________________________________________________________________________________________Station Station Sample Sample Total Anthracene Anthracene, Anthracene, Biphenyl Chrysene FluorantheneNumber Name Type* Date PAH benz(a) dibenz(a,h)__________________________________________________________________________________________________________________________________________________________________102.6 Humboldt Bay/J Street TCM 02/15/95 173.0 ND ND ND ND ND 27.0102.6 Humboldt Bay/J Street POD 02/15/95 38332.0 2470.0 1610.0 152.0 434.0 2440.0 6260.0102.6 Humboldt Bay/J Street PAC 02/15/95 515.0 ND 13.0 ND 13.0 25.0 67.0102.6 Humboldt Bay/J Street RCM 02/15/95 2136.0 12.0 97.0 ND ND 128.0 751.0102.6 Humboldt Bay/J Street RBM 04/17/96 861.3 14.7 57.5 51.3 ND 91.6 113.0102.6 Humboldt Bay/J Street GLY 04/17/96 261.8 ND 10.0 ND ND 19.4 41.4102.6 Humboldt Bay/J Street PAC 04/17/96 59.0 ND ND ND ND 15.7 15.1102.6 Humboldt Bay/J Street TCM 04/10/97 400.9 ND 12.1 ND ND 16.1 74.5102.7 Humboldt Bay/H Street TCM 02/15/95 131.0 ND ND ND ND ND 17.0102.7 Humboldt Bay/H Street RBM-s 04/17/96 987.9 21.5 56.2 ND 13.5 74.7 184.0_________________________________________________________________________________________________________________________________________________________________Station Fluoranthene, Fluoranthene, Fluorene Naphthalene Naphthalene, Naphthalene, Naphthalene, Naphthalene, Naphthene,Number benzo(b) benzo(k) 1-methyl 2-methyl 2,6-dimethyl 2,3,5-trimethyl ace_________________________________________________________________________________________________________________________________________________________________102.6 ND ND 13.0 ND ND 33.0 ND ND ND 102.6 1530.0 552.0 2260.0 1360.0 560.0 328.0 198.0 52.0 2810.0102.6 36.0 11.0 10.0 27.0 19.0 23.0 26.0 ND 26.0102.6 113.0 43.0 13.0 ND ND 12.0 ND ND ND 102.6 53.5 56.0 10.3 12.5 11.0 15.0 ND ND 12.8102.6 12.1 ND ND 27.8 ND ND ND ND 52.0102.6 ND ND ND ND ND ND ND ND 12.4102.6 ND ND 21.6 ND 10.0 25.5 ND ND 11.8102.7 ND ND 11.0 ND ND 37.0 ND ND ND 102.7 44.8 48.2 18.8 30.2 25.4 34.4 ND ND 30.2_________________________________________________________________________________________________________________________________________________________________Station Naphthylene, Perylene Perylene, Phenanthrene Phenanthrene, Pyrene Pyrene, Pyrene, Pyrene,Number ace benzo(ghi) 1-methyl benzo(a) benzo(e) indeno(1,2,3-cd)_________________________________________________________________________________________________________________________________________________________________102.6 ND ND ND 70.0 ND 30.0 ND ND ND 102.6 232.0 266.0 427.0 7770.0 275.0 4140.0 1020.0 702.0 484.0102.6 ND ND 19.0 53.0 ND 95.0 17.0 20.0 15.0102.6 ND 15.0 27.0 224.0 22.0 548.0 22.0 87.0 22.0102.6 ND 41.7 33.4 55.7 ND 97.6 39.4 50.6 43.7102.6 ND ND ND 26.4 ND 72.7 ND ND ND 102.6 ND ND ND ND ND 15.8 ND ND ND 102.6 ND ND ND 108.0 37.9 83.4 ND ND ND 102.7 ND ND ND 47.0 ND 19.0 ND ND ND 102.7 ND 17.8 33.8 137.0 ND 136.0 21.2 39.1 21.1_________________________________________________________________________________________________________________________________________________________________* RCM = Resident California Mussel POD = Abalone Jingle (Pododesmus cepio) ND = Not Detected TCM = Transplanted California Mussel PAC = Shore Crab (Pachygrapsus crassipes) RBM = Resident Bay Mussel (s = small size) GYL = Sand Worm (Glycera spp.) OYS = Oyster (Crassostrea gigas)

R-4
APPENDIX RState Mussel Watch Program
Summary of 1995-97 Data: PAHs in Mussel, Oyster, Abalone Jingle, Shore Crab, and Sand Worm(ppb, dry weight)
__________________________________________________________________________________________________________________________________________________________________Station Station Sample Sample Total Anthracene Anthracene, Anthracene, Biphenyl Chrysene FluorantheneNumber Name Type* Date PAH benz(a) dibenz(a,h)__________________________________________________________________________________________________________________________________________________________________102.7 Humboldt Bay/H Street PAC 04/17/96 311.9 ND 17.4 30.5 ND 35.5 11.7102.7 Humboldt Bay/H Street GLY 04/17/96 598.1 ND ND ND ND 25.8 229.0103.3 Humboldt Bay/E Street TCM 04/10/97 275.2 ND ND ND ND 18.4 44.8103.5 Humboldt Bay/Clark Slough TCM 04/10/97 302.3 11.7 21.2 ND ND 25.0 48.7104.1 Humboldt Bay/Union Oil Plant TCM 02/15/95 181.0 ND ND ND ND 10.0 26.0104.2 Humboldt Bay/Coal Oil Gas Plant TCM 02/15/95 247.0 ND ND ND ND ND 36.0104.3 Humboldt Bay/Old Pac. Lumber TCM 02/15/95 84.0 ND ND ND ND ND 12.0202.0 Bodega Head RCM 08/29/96 ND ND ND ND ND ND ND 205.0 Bodega Harbor/Spud Point Marina TCM 03/21/97 733.2 16.8 18.1 ND 11.1 48.1 114.0205.1 Bodega Bay/Porto Bodega RBM 03/21/97 1822.9 ND 58.3 ND ND 219.0 605.0_________________________________________________________________________________________________________________________________________________________________Station Fluoranthene, Fluoranthene, Fluorene Naphthalene Naphthalene, Naphthalene, Naphthalene, Naphthalene, Naphthene,Number benzo(b) benzo(k) 1-methyl 2-methyl 2,6-dimethyl 2,3,5-trimethyl ace_________________________________________________________________________________________________________________________________________________________________102.7 25.3 33.2 ND ND ND ND ND ND ND 102.7 ND ND 94.1 13.1 ND ND ND ND 11.9103.3 ND ND 17.0 ND ND 16.2 10.3 ND ND 103.5 11.4 ND 16.0 ND ND 17.4 11.0 ND ND 104.1 ND ND 12.0 ND ND 40.0 ND ND ND 104.2 ND ND 17.0 11.0 ND 32.0 ND ND 13.0104.3 ND ND ND ND ND 23.0 ND ND ND 202.0 ND ND ND ND ND ND ND ND ND 205.0 16.3 10.8 24.2 ND 30.1 64.1 38.0 32.5 ND 205.1 70.6 27.4 30.4 ND 11.8 18.6 17.7 20.7 ND _________________________________________________________________________________________________________________________________________________________________Station Naphthylene, Perylene Perylene, Phenanthrene Phenanthrene, Pyrene Pyrene, Pyrene, Pyrene,Number ace benzo(ghi) 1-methyl benzo(a) benzo(e) indeno(1,2,3-cd)_________________________________________________________________________________________________________________________________________________________________102.7 ND 22.3 31.3 ND ND 14.4 31.5 23.3 35.5102.7 ND ND ND 41.2 ND 168.0 ND 15.0 ND 103.3 ND ND ND 77.7 26.3 53.6 ND 10.9 ND 103.5 ND ND ND 91.8 15.1 33.0 ND ND ND 104.1 ND ND ND 67.0 ND 26.0 ND ND ND 104.2 ND ND ND 99.0 ND 39.0 ND ND ND 104.3 ND ND ND 36.0 ND 13.0 ND ND ND 202.0 ND ND ND ND ND ND ND ND ND 205.0 ND ND ND 158.0 38.5 86.2 15.3 11.1 ND 205.1 ND 14.2 ND 201.0 118.0 346.0 17.5 46.7 ND _________________________________________________________________________________________________________________________________________________________________* RCM = Resident California Mussel POD = Abalone Jingle (Pododesmus cepio) ND = Not Detected TCM = Transplanted California Mussel PAC = Shore Crab (Pachygrapsus crassipes) RBM = Resident Bay Mussel (s = small size) GYL = Sand Worm (Glycera spp.) OYS = Oyster (Crassostrea gigas)

R-5
APPENDIX RState Mussel Watch Program
Summary of 1995-97 Data: PAHs in Mussel, Oyster, Abalone Jingle, Shore Crab, and Sand Worm(ppb, dry weight)
__________________________________________________________________________________________________________________________________________________________________Station Station Sample Sample Total Anthracene Anthracene, Anthracene, Biphenyl Chrysene FluorantheneNumber Name Type* Date PAH benz(a) dibenz(a,h)__________________________________________________________________________________________________________________________________________________________________205.3 Bodega Bay/Mason's Marina TCM 03/21/97 290.5 ND 11.8 ND ND 25.4 48.1205.5 Bodega Bay/Back Marsh RBM 03/21/97 476.7 10.5 13.7 ND ND 34.1 74.5280.0 Russian River/S Goat Rock RCM 03/21/97 140.8 ND ND ND 46.9 ND 10.8400.6 Santa Cruz/Natural Bridges RCM 06/09/97 92.9 ND ND ND ND ND 16.2403.0 Elkhorn Slough/Highway 1 Bridge TCM 03/12/97 229.8 ND ND ND ND ND 27.5404.0 Sandholdt Bridge TCM 03/04/97 367.9 10.4 10.1 ND ND 17.0 37.4414.0 Pacific Grove RCM 04/25/97 14.7 ND ND ND ND ND ND 601.0 LA Harbor/National Steel TCM 01/28/97 2062.7 42.3 ND ND ND 287.0 530.0616.0 LA Harbor/Consolidated Slip TCM 01/28/97 2830.0 35.6 182.0 ND ND 440.0 464.0650.0 Santa Monica RCM 11/25/96 188.1 ND 10.7 ND ND 11.5 22.6_________________________________________________________________________________________________________________________________________________________________Station Fluoranthene, Fluoranthene, Fluorene Naphthalene Naphthalene, Naphthalene, Naphthalene, Naphthalene, Naphthene,Number benzo(b) benzo(k) 1-methyl 2-methyl 2,6-dimethyl 2,3,5-trimethyl ace_________________________________________________________________________________________________________________________________________________________________205.3 ND ND 22.3 ND ND 16.7 ND 21.4 ND 205.5 14.0 ND 28.4 ND 19.4 32.4 19.7 ND ND 280.0 ND ND ND ND ND 11.0 ND ND ND 400.6 ND ND ND ND ND ND ND ND ND 403.0 ND ND 11.0 50.0 12.2 23.7 ND ND ND 404.0 ND ND 24.0 55.3 10.7 23.9 10.7 ND ND 414.0 ND ND ND ND ND ND ND ND ND 601.0 228.0 78.7 16.9 ND 18.9 ND ND ND 25.4616.0 199.0 79.7 21.0 ND 42.1 56.2 35.6 58.2 27.5650.0 ND ND 17.2 ND ND 17.2 ND ND ND _________________________________________________________________________________________________________________________________________________________________Station Naphthylene, Perylene Perylene, Phenanthrene Phenanthrene, Pyrene Pyrene, Pyrene, Pyrene,Number ace benzo(ghi) 1-methyl benzo(a) benzo(e) indeno(1,2,3-cd)_________________________________________________________________________________________________________________________________________________________________205.3 ND ND ND 117.0 27.8 ND ND ND ND 205.5 10.0 ND ND 105.0 67.7 47.3 ND ND ND 280.0 ND ND ND 30.9 21.0 20.2 ND ND ND 400.6 ND ND ND 30.9 25.7 20.1 ND ND ND 403.0 ND ND ND 41.8 33.8 29.8 ND ND ND 404.0 ND ND ND 106.0 24.4 38.0 ND ND ND 414.0 ND ND ND 14.7 ND ND ND ND ND 601.0 10.2 ND ND 49.1 21.2 523.0 60.0 172.0 ND 616.0 27.5 ND 39.4 77.6 116.0 608.0 67.0 205.0 48.6650.0 ND ND ND 71.9 17.8 19.2 ND ND ND _________________________________________________________________________________________________________________________________________________________________* RCM = Resident California Mussel POD = Abalone Jingle (Pododesmus cepio) ND = Not Detected TCM = Transplanted California Mussel PAC = Shore Crab (Pachygrapsus crassipes) RBM = Resident Bay Mussel (s = small size) GYL = Sand Worm (Glycera spp.) OYS = Oyster (Crassostrea gigas)

R-6
APPENDIX RState Mussel Watch Program
Summary of 1995-97 Data: PAHs in Mussel, Oyster, Abalone Jingle, Shore Crab, and Sand Worm(ppb, dry weight)
__________________________________________________________________________________________________________________________________________________________________Station Station Sample Sample Total Anthracene Anthracene, Anthracene, Biphenyl Chrysene FluorantheneNumber Name Type* Date PAH benz(a) dibenz(a,h)__________________________________________________________________________________________________________________________________________________________________740.0 Dana Point Harbor/Boat Yard TCM 01/27/97 310.2 14.8 30.5 ND ND 62.5 29.0750.0 Oceanside RCM 09/30/96 53.3 ND ND ND ND ND 10.6883.1 San Diego Bay/Chollas Creek TCM 01/28/97 28069.2 443.0 3850.0 141.0 86.6 3790.0 4240.0883.2 San Diego Bay/Chollas Creek/Mouth TCM 01/28/97 141666.0 6010.0 13400.0 334.0 397.0 9640.0 37300.0883.3 San Diego Bay/Chollas Creek/End TCM 01/28/97 44894.0 426.0 4010.0 57.1 70.2 3840.0 13600.0883.5 San Diego Bay/Tuna Docks TCM 01/28/97 24277.4 962.0 1930.0 32.0 47.8 1760.0 7440.0883.6 San Diego Bay/7th Street Channel TCM 01/28/97 107643.0 3840.0 6910.0 161.0 295.0 6040.0 32900.0883.8 San Diego Bay/Switzer Creek TCM 01/28/97 3528.7 68.2 338.0 27.0 18.5 375.0 890.0885.1 San Diego Bay/Paleta Creek/End TCM 01/28/97 60436.0 1310.0 5160.0 96.6 115.0 5810.0 17300.0885.3 San Diego Bay/7th Street Ch/Mid TCM 01/28/97 275151.3 4930.0 21900.0 396.0 521.0 16800.0 92900.0_________________________________________________________________________________________________________________________________________________________________Station Fluoranthene, Fluoranthene, Fluorene Naphthalene Naphthalene, Naphthalene, Naphthalene, Naphthalene, Naphthene,Number benzo(b) benzo(k) 1-methyl 2-methyl 2,6-dimethyl 2,3,5-trimethyl ace_________________________________________________________________________________________________________________________________________________________________740.0 22.8 ND ND ND 11.9 42.7 13.8 ND ND 750.0 ND ND ND ND ND 11.1 ND ND ND 883.1 728.0 298.0 286.0 61.1 102.0 81.5 ND 61.7 219.0883.2 9810.0 2550.0 2540.0 175.0 393.0 1100.0 386.0 161.0 1470.0883.3 1790.0 359.0 779.0 ND 43.0 110.0 72.9 46.7 533.0883.5 897.0 234.0 390.0 ND 38.4 138.0 52.3 32.9 230.0883.6 4060.0 909.0 2730.0 153.0 280.0 646.0 251.0 132.0 1500.0883.8 164.0 62.5 68.2 ND 23.6 32.4 ND 13.6 36.4885.1 3310.0 710.0 1000.0 56.6 113.0 257.0 152.0 83.9 735.0885.3 14300.0 3400.0 2790.0 88.3 538.0 1260.0 611.0 236.0 2290.0_________________________________________________________________________________________________________________________________________________________________Station Naphthylene, Perylene Perylene, Phenanthrene Phenanthrene, Pyrene Pyrene, Pyrene, Pyrene,Number ace benzo(ghi) 1-methyl benzo(a) benzo(e) indeno(1,2,3-cd)_________________________________________________________________________________________________________________________________________________________________740.0 ND ND ND 39.3 14.6 16.6 11.7 ND ND 750.0 ND 12.0 ND 19.6 ND ND ND ND ND 883.1 95.3 ND 1840.0 2510.0 146.0 7400.0 1020.0 491.0 179.0883.2 130.0 1410.0 1130.0 19300.0 1250.0 24100.0 3210.0 4300.0 1170.0883.3 56.1 221.0 226.0 7142.0 522.0 9630.0 259.0 880.0 221.0883.5 37.1 142.0 89.6 3830.0 262.0 4950.0 202.0 487.0 93.3883.6 132.0 582.0 469.0 20400.0 1130.0 20600.0 1110.0 1970.0 443.0883.8 18.2 ND 34.5 584.0 34.1 571.0 41.7 96.3 31.5885.1 49.9 340.0 362.0 7620.0 662.0 12600.0 617.0 1670.0 306.0885.3 181.0 1660.0 1460.0 37300.0 3730.0 56400.0 4020.0 5990.0 1450.0_________________________________________________________________________________________________________________________________________________________________* RCM = Resident California Mussel POD = Abalone Jingle (Pododesmus cepio) ND = Not Detected TCM = Transplanted California Mussel PAC = Shore Crab (Pachygrapsus crassipes) RBM = Resident Bay Mussel (s = small size) GYL = Sand Worm (Glycera spp.) OYS = Oyster (Crassostrea gigas)

R-7
APPENDIX RState Mussel Watch Program
Summary of 1995-97 Data: PAHs in Mussel, Oyster, Abalone Jingle, Shore Crab, and Sand Worm(ppb, dry weight)
__________________________________________________________________________________________________________________________________________________________________Station Station Sample Sample Total Anthracene Anthracene, Anthracene, Biphenyl Chrysene FluorantheneNumber Name Type* Date PAH benz(a) dibenz(a,h)__________________________________________________________________________________________________________________________________________________________________888.0 San Diego Bay/Coronado Bridge RBM 01/28/97 4053.1 37.2 313.0 53.3 ND 579.0 1130.0894.0 SD Bay/Harbor Is/E Basin/Storm Dr TCM 01/28/97 1198.1 24.8 78.0 ND ND 160.0 347.0_________________________________________________________________________________________________________________________________________________________________Station Fluoranthene, Fluoranthene, Fluorene Naphthalene Naphthalene, Naphthalene, Naphthalene, Naphthalene, Naphthene,Number benzo(b) benzo(k) 1-methyl 2-methyl 2,6-dimethyl 2,3,5-trimethyl ace_________________________________________________________________________________________________________________________________________________________________888.0 522.0 190.0 ND ND ND ND ND ND ND 894.0 98.3 47.2 ND ND ND ND ND ND ND _________________________________________________________________________________________________________________________________________________________________Station Naphthylene, Perylene Perylene, Phenanthrene Phenanthrene, Pyrene Pyrene, Pyrene, Pyrene,Number ace benzo(ghi) 1-methyl benzo(a) benzo(e) indeno(1,2,3-cd)_________________________________________________________________________________________________________________________________________________________________888.0 ND ND 55.9 120.0 ND 624.0 79.4 280.0 69.3894.0 ND ND 29.5 55.9 ND 231.0 29.1 71.2 26.1_________________________________________________________________________________________________________________________________________________________________* RCM = Resident California Mussel POD = Abalone Jingle (Pododesmus cepio) ND = Not Detected TCM = Transplanted California Mussel PAC = Shore Crab (Pachygrapsus crassipes) RBM = Resident Bay Mussel (s = small size) GYL = Sand Worm (Glycera spp.) OYS = Oyster (Crassostrea gigas)

S-1
APPENDIX S
Summary of 1995-97 DataPAHs in Mussel, Oyster, Abalone Jingle, Shore Crab, and Sand Worm
(ppb, lipid weight)

S-2
APPENDIX SState Mussel Watch Program
Summary of 1995-97 Data: PAHs in Mussel, Oyster, Abalone Jingle, Shore Crab, and Sand Worm(ppb, lipid weight)
__________________________________________________________________________________________________________________________________________________________________Station Station Sample Sample Total Anthracene Anthracene, Anthracene, Biphenyl Chrysene FluorantheneNumber Name Type* Date PAH benz(a) dibenz(a,h)__________________________________________________________________________________________________________________________________________________________________ 1.0 Crescent City Harbor RCM 04/09/97 15639.9 159.0 340.0 ND ND 816.0 1200.0 2.0 Crescent City/STP Outfall RCM 04/09/97 ND ND ND ND ND ND ND 2.2 Crescent City Harbor/Inner Jetty RCM 04/09/97 1113.0 ND ND ND ND ND 210.0 3.0 Crescent City/Control RCM 04/10/97 1476.0 ND ND ND ND ND 145.0100.0 Mad River Slough OYS 04/10/97 3253.0 ND ND ND ND ND 639.0101.4 Arcata Bay/Jolly Giant Slough PAC 04/18/96 595.0 ND ND ND ND ND ND 101.5 Humboldt Bay/Eureka SM.22 TCM 02/15/95 2816.3 ND ND ND ND ND 368.6101.8 Humboldt Bay/Halberson Shoreline RBM-s 04/17/96 11064.0 248.0 695.0 ND ND 920.0 2050.0101.8 Humboldt Bay/Halberson Shoreline PAC 04/17/96 ND ND ND ND ND ND ND 101.8 Humboldt Bay/Halberson Shoreline GLY 04/17/96 1452.3 ND 121.5 ND ND 97.7 164.6_________________________________________________________________________________________________________________________________________________________________Station Fluoranthene, Fluoranthene, Fluorene Naphthalene Naphthalene, Naphthalene, Naphthalene, Naphthalene, Naphthene,Number benzo(b) benzo(k) 1-methyl 2-methyl 2,6-dimethyl 2,3,5-trimethyl ace_________________________________________________________________________________________________________________________________________________________________ 1.0 555.0 224.9 616.0 849.0 345.0 585.0 1618.0 1167.0 ND 2.0 ND ND ND ND ND ND ND ND ND 2.2 ND ND ND ND ND 253.0 ND ND ND 3.0 ND ND ND ND ND 147.0 151.0 ND ND 100.0 ND ND 169.0 ND 124.0 176.0 146.0 ND ND 101.4 ND ND ND ND ND ND ND ND ND 101.5 ND ND 252.3 ND ND 544.2 ND ND ND 101.8 615.0 672.0 182.0 203.0 191.0 268.0 ND ND ND 101.8 ND ND ND ND ND ND ND ND ND 101.8 ND 99.2 ND 152.3 ND ND ND ND 176.1_________________________________________________________________________________________________________________________________________________________________Station Naphthylene, Perylene Perylene, Phenanthrene Phenanthrene, Pyrene Pyrene, Pyrene, Pyrene,Number ace benzo(ghi) 1-methyl benzo(a) benzo(e) indeno(1,2,3-cd)_________________________________________________________________________________________________________________________________________________________________ 1.0 ND 119.0 127.0 2158.0 2708.0 1398.0 149.0 379.0 127.0 2.0 ND ND ND ND ND ND ND ND ND 2.2 ND ND ND 503.0 ND 147.0 ND ND ND 3.0 ND ND ND 493.0 347.0 193.0 ND ND ND 100.0 ND ND ND 740.0 724.0 535.0 ND ND ND 101.4 ND ND ND ND ND 595.0 ND ND ND 101.5 ND ND ND 1184.9 ND 466.3 ND ND ND 101.8 ND 471.0 402.0 1229.0 ND 1576.0 468.0 465.0 409.0101.8 ND ND ND ND ND ND ND ND ND 101.8 ND 107.7 ND 107.7 ND 329.2 96.2 ND ND _________________________________________________________________________________________________________________________________________________________________* RCM = Resident California Mussel POD = Abalone Jingle (Pododesmus cepio) ND = Not Detected TCM = Transplanted California Mussel PAC = Shore Crab (Pachygrapsus crassipes) RBM = Resident Bay Mussel (s = small size) GYL = Sand Worm (Glycera spp.) OYS = Oyster (Crassostrea gigas)

S-3
APPENDIX SState Mussel Watch Program
Summary of 1995-97 Data: PAHs in Mussel, Oyster, Abalone Jingle, Shore Crab, and Sand Worm(ppb, lipid weight)
__________________________________________________________________________________________________________________________________________________________________Station Station Sample Sample Total Anthracene Anthracene, Anthracene, Biphenyl Chrysene FluorantheneNumber Name Type* Date PAH benz(a) dibenz(a,h)__________________________________________________________________________________________________________________________________________________________________102.6 Humboldt Bay/J Street RCM 02/15/95 60533.3 340.0 2750.0 ND ND 3626.7 21280.0102.6 Humboldt Bay/J Street PAC 02/15/95 2216.4 ND 55.9 ND 55.9 107.7 288.4102.6 Humboldt Bay/J Street TCM 02/15/95 3181.6 ND ND ND ND ND 496.5102.6 Humboldt Bay/J Street POD 02/15/95 445222.4 28688.8 18700.0 1765.2 5041.0 28340.4 72709.3102.6 Humboldt Bay/J Street GLY 04/17/96 5124.3 ND 195.7 ND ND 380.0 810.0102.6 Humboldt Bay/J Street PAC 04/17/96 1618.3 ND ND ND ND 430.8 414.2102.6 Humboldt Bay/J Street RBM 04/17/96 13045.7 222.9 871.4 777.1 ND 1387.1 1711.4102.6 Humboldt Bay/J Street TCM 04/10/97 4929.0 ND 149.0 ND ND 198.0 916.0102.7 Humboldt Bay/H Street TCM 02/15/95 2287.3 ND ND ND ND ND 297.1102.7 Humboldt Bay/H Street RBM-s 04/17/96 14050.0 305.6 798.9 ND 192.2 1062.2 2616.7_________________________________________________________________________________________________________________________________________________________________Station Fluoranthene, Fluoranthene, Fluorene Naphthalene Naphthalene, Naphthalene, Naphthalene, Naphthalene, Naphthene,Number benzo(b) benzo(k) 1-methyl 2-methyl 2,6-dimethyl 2,3,5-trimethyl ace_________________________________________________________________________________________________________________________________________________________________102.6 3203.3 1220.0 370.0 ND ND 340.0 ND ND ND 102.6 154.9 47.4 43.0 116.2 81.7 99.0 111.8 ND 111.8102.6 ND ND 239.1 ND ND 606.9 ND ND ND 102.6 17770.8 6411.2 26249.7 15796.3 6504.4 3809.9 2300.0 603.7 32637.9102.6 237.1 ND ND 544.3 ND ND ND ND 1017.1102.6 ND ND ND ND ND ND ND ND 340.0102.6 810.0 848.6 155.7 190.0 167.1 227.1 ND ND 194.3102.6 ND ND 266.0 ND 123.0 313.0 ND ND 145.0102.7 ND ND 192.2 ND ND 646.1 ND ND ND 102.7 636.7 685.6 267.8 430.0 361.1 488.9 ND ND 430.0_________________________________________________________________________________________________________________________________________________________________Station Naphthylene, Perylene Perylene, Phenanthrene Phenanthrene, Pyrene Pyrene, Pyrene, Pyrene,Number ace benzo(ghi) 1-methyl benzo(a) benzo(e) indeno(1,2,3-cd)_________________________________________________________________________________________________________________________________________________________________102.6 ND 426.7 766.7 6346.7 623.3 15526.7 623.3 2466.7 623.3102.6 ND ND 81.7 228.1 ND 408.9 73.2 86.1 64.7102.6 ND ND ND 1287.4 ND 551.7 ND ND ND 102.6 2694.4 3089.4 4959.6 90247.8 3194.4 48085.7 11847.2 8153.4 5621.7102.6 ND ND ND 517.1 ND 1422.9 ND ND ND 102.6 ND ND ND ND ND 433.3 ND ND ND 102.6 ND 631.4 505.7 842.9 ND 1478.6 597.1 765.7 661.4102.6 ND ND ND 1328.0 466.0 1025.0 ND ND ND 102.7 ND ND ND 820.6 ND 331.4 ND ND ND 102.7 ND 253.3 481.1 1948.9 ND 1934.4 301.1 555.6 300.0_________________________________________________________________________________________________________________________________________________________________* RCM = Resident California Mussel POD = Abalone Jingle (Pododesmus cepio) ND = Not Detected TCM = Transplanted California Mussel PAC = Shore Crab (Pachygrapsus crassipes) RBM = Resident Bay Mussel (s = small size) GYL = Sand Worm (Glycera spp.) OYS = Oyster (Crassostrea gigas)

S-4
APPENDIX SState Mussel Watch Program
Summary of 1995-97 Data: PAHs in Mussel, Oyster, Abalone Jingle, Shore Crab, and Sand Worm(ppb, lipid weight)
__________________________________________________________________________________________________________________________________________________________________Station Station Sample Sample Total Anthracene Anthracene, Anthracene, Biphenyl Chrysene FluorantheneNumber Name Type* Date PAH benz(a) dibenz(a,h)__________________________________________________________________________________________________________________________________________________________________102.7 Humboldt Bay/H Street PAC 04/17/96 10387.0 ND 579.0 1016.0 ND 1182.0 390.0102.7 Humboldt Bay/H Street GLY 04/17/96 3233.8 ND ND ND ND 139.4 1238.1103.3 Humboldt Bay/E Street TCM 04/10/97 3000.0 ND ND ND ND 201.0 488.0103.5 Humboldt Bay/Clark Slough TCM 04/10/97 3706.0 143.0 260.0 ND ND 307.0 597.0104.1 Humboldt Bay/Union Oil Plant TCM 02/15/95 3575.3 ND ND ND ND 197.5 513.6104.2 Humboldt Bay/Coal Oil Gas Plant TCM 02/15/95 4968.7 ND ND ND ND ND 724.1104.3 Humboldt Bay/Old Pac. Lumber TCM 02/15/95 1876.7 ND ND ND ND ND 268.5202.0 Bodega Head RCM 08/29/96 ND ND ND ND ND ND ND 205.0 Bodega Harbor/Spud Point Marina TCM 03/21/97 6654.2 152.0 164.0 ND 101.0 437.0 1035.0205.1 Bodega Bay/Porto Bodega RBM 03/21/97 25924.4 ND 829.0 ND ND 3115.0 8604.0_________________________________________________________________________________________________________________________________________________________________Station Fluoranthene, Fluoranthene, Fluorene Naphthalene Naphthalene, Naphthalene, Naphthalene, Naphthalene, Naphthene,Number benzo(b) benzo(k) 1-methyl 2-methyl 2,6-dimethyl 2,3,5-trimethyl ace_________________________________________________________________________________________________________________________________________________________________102.7 842.0 1106.0 ND ND ND ND ND ND ND 102.7 ND ND 508.8 70.9 ND ND ND ND 64.4103.3 ND ND 185.0 ND ND 177.0 112.0 ND ND 103.5 140.0 ND 196.0 ND ND 213.0 135.0 ND ND 104.1 ND ND 237.0 ND ND 790.1 ND ND ND 104.2 ND ND 342.2 221.7 ND 643.4 ND ND 261.5104.3 ND ND ND ND ND 513.7 ND ND ND 202.0 ND ND ND ND ND ND ND ND ND 205.0 148.0 97.2 220.0 ND 273.0 582.0 345.0 295.0 ND 205.1 1004.0 388.4 432.0 ND 168.0 265.0 252.0 294.0 ND _________________________________________________________________________________________________________________________________________________________________Station Naphthylene, Perylene Perylene, Phenanthrene Phenanthrene, Pyrene Pyrene, Pyrene, Pyrene,Number ace benzo(ghi) 1-methyl benzo(a) benzo(e) indeno(1,2,3-cd)_________________________________________________________________________________________________________________________________________________________________102.7 ND 743.0 1042.0 ND ND 480.0 1049.0 776.0 1182.0102.7 ND ND ND 222.8 ND 908.1 ND 81.3 ND 103.3 ND ND ND 847.0 287.0 584.0 ND 119.0 ND 103.5 ND ND ND 1125.0 185.0 405.0 ND ND ND 104.1 ND ND ND 1323.5 ND 513.6 ND ND ND 104.2 ND ND ND 1991.6 ND 784.3 ND ND ND 104.3 ND ND ND 804.1 ND 290.4 ND ND ND 202.0 ND ND ND ND ND ND ND ND ND 205.0 ND ND ND 1434.0 349.0 782.0 139.0 101.0 ND 205.1 ND 202.0 ND 2859.0 1678.0 4921.0 249.0 664.0 ND _________________________________________________________________________________________________________________________________________________________________* RCM = Resident California Mussel POD = Abalone Jingle (Pododesmus cepio) ND = Not Detected TCM = Transplanted California Mussel PAC = Shore Crab (Pachygrapsus crassipes) RBM = Resident Bay Mussel (s = small size) GYL = Sand Worm (Glycera spp.) OYS = Oyster (Crassostrea gigas)

S-5
APPENDIX SState Mussel Watch Program
Summary of 1995-97 Data: PAHs in Mussel, Oyster, Abalone Jingle, Shore Crab, and Sand Worm(ppb, lipid weight)
__________________________________________________________________________________________________________________________________________________________________Station Station Sample Sample Total Anthracene Anthracene, Anthracene, Biphenyl Chrysene FluorantheneNumber Name Type* Date PAH benz(a) dibenz(a,h)__________________________________________________________________________________________________________________________________________________________________205.3 Bodega Bay/Mason's Marina TCM 03/21/97 3773.0 ND 153.0 ND ND 330.0 625.0205.5 Bodega Bay/Back Marsh RBM 03/21/97 6941.0 153.0 199.0 ND ND 496.0 1085.0280.0 Russian River/S Goat Rock RCM 03/21/97 2342.0 ND ND ND 780.0 ND 180.0400.6 Santa Cruz/Natural Bridges RCM 06/09/97 1272.0 ND ND ND ND ND 222.0403.0 Elkhorn Slough/Highway 1 Bridge TCM 03/12/97 2782.0 ND ND ND ND ND 333.0404.0 Sandholdt Bridge TCM 03/04/97 5081.0 144.0 139.0 ND ND 235.0 516.0414.0 Pacific Grove RCM 04/25/97 164.0 ND ND ND ND ND ND 601.0 LA Harbor/National Steel TCM 01/28/97 32890.3 675.0 ND ND ND 4576.0 8451.0616.0 LA Harbor/Consolidated Slip TCM 01/28/97 31404.5 395.0 2020.0 ND ND 4883.0 5149.0650.0 Santa Monica RCM 11/25/96 3042.0 ND 173.0 ND ND 186.0 365.0_________________________________________________________________________________________________________________________________________________________________Station Fluoranthene, Fluoranthene, Fluorene Naphthalene Naphthalene, Naphthalene, Naphthalene, Naphthalene, Naphthene,Number benzo(b) benzo(k) 1-methyl 2-methyl 2,6-dimethyl 2,3,5-trimethyl ace_________________________________________________________________________________________________________________________________________________________________205.3 ND ND 290.0 ND ND 217.0 ND 278.0 ND 205.5 204.0 ND 413.0 ND 282.0 472.0 287.0 ND ND 280.0 ND ND ND ND ND 183.0 ND ND ND 400.6 ND ND ND ND ND ND ND ND ND 403.0 ND ND 133.0 605.0 148.0 287.0 ND ND ND 404.0 ND ND 331.0 764.0 148.0 330.0 148.0 ND ND 414.0 ND ND ND ND ND ND ND ND ND 601.0 3636.0 1253.3 269.0 ND 301.0 ND ND ND 405.0616.0 2208.0 884.5 233.0 ND 467.0 624.0 395.0 646.0 305.0650.0 ND ND 278.0 ND ND 278.0 ND ND ND _________________________________________________________________________________________________________________________________________________________________Station Naphthylene, Perylene Perylene, Phenanthrene Phenanthrene, Pyrene Pyrene, Pyrene, Pyrene,Number ace benzo(ghi) 1-methyl benzo(a) benzo(e) indeno(1,2,3-cd)_________________________________________________________________________________________________________________________________________________________________205.3 ND ND ND 1519.0 361.0 ND ND ND ND 205.5 146.0 ND ND 1529.0 986.0 689.0 ND ND ND 280.0 ND ND ND 514.0 349.0 336.0 ND ND ND 400.6 ND ND ND 423.0 352.0 275.0 ND ND ND 403.0 ND ND ND 506.0 409.0 361.0 ND ND ND 404.0 ND ND ND 1464.0 337.0 525.0 ND ND ND 414.0 ND ND ND 164.0 ND ND ND ND ND 601.0 163.0 ND ND 783.0 338.0 8340.0 957.0 2743.0 ND 616.0 305.0 ND 437.0 861.0 1287.0 6747.0 744.0 2275.0 539.0650.0 ND ND ND 1163.0 288.0 311.0 ND ND ND _________________________________________________________________________________________________________________________________________________________________* RCM = Resident California Mussel POD = Abalone Jingle (Pododesmus cepio) ND = Not Detected TCM = Transplanted California Mussel PAC = Shore Crab (Pachygrapsus crassipes) RBM = Resident Bay Mussel (s = small size) GYL = Sand Worm (Glycera spp.) OYS = Oyster (Crassostrea gigas)

S-6
APPENDIX SState Mussel Watch Program
Summary of 1995-97 Data: PAHs in Mussel, Oyster, Abalone Jingle, Shore Crab, and Sand Worm(ppb, lipid weight)
__________________________________________________________________________________________________________________________________________________________________Station Station Sample Sample Total Anthracene Anthracene, Anthracene, Biphenyl Chrysene FluorantheneNumber Name Type* Date PAH benz(a) dibenz(a,h)__________________________________________________________________________________________________________________________________________________________________740.0 Dana Point Harbor/Boat Yard TCM 01/27/97 3648.0 174.0 359.0 ND ND 735.0 341.0750.0 Oceanside RCM 09/30/96 777.0 ND ND ND ND ND 154.0883.1 San Diego Bay/Chollas Creek TCM 01/28/97 522044.8 8240.0 71610.0 2623.0 1611.0 70494.0 78864.0883.2 San Diego Bay/Chollas Creek/Mouth TCM 01/28/97 1916617.0 81312.0 181294.0 4519.0 5371.0 130424.0 504647.0883.3 San Diego Bay/Chollas Creek/End TCM 01/28/97 564962.8 5361.0 50463.0 719.0 883.0 48324.0 171146.0883.5 San Diego Bay/Tuna Docks TCM 01/28/97 294257.1 11661.0 23394.0 388.0 579.0 21333.0 90182.0883.6 San Diego Bay/7th Street Channel TCM 01/28/97 1711321.0 61046.0 109851.0 2559.0 4690.0 96021.0 523026.0883.8 San Diego Bay/Switzer Creek TCM 01/28/97 65316.5 1262.0 6257.0 500.0 342.0 6941.0 16474.0885.1 San Diego Bay/Paleta Creek/End TCM 01/28/97 585440.5 12691.0 49988.0 936.0 1114.0 56284.0 167594.0885.3 San Diego Bay/7th Street Ch/Mid TCM 01/28/97 2653246.0 47539.0 211179.0 3819.0 5024.0 162000.0 895821.0_________________________________________________________________________________________________________________________________________________________________Station Fluoranthene, Fluoranthene, Fluorene Naphthalene Naphthalene, Naphthalene, Naphthalene, Naphthalene, Naphthene,Number benzo(b) benzo(k) 1-methyl 2-methyl 2,6-dimethyl 2,3,5-trimethyl ace_________________________________________________________________________________________________________________________________________________________________740.0 268.0 ND ND ND 140.0 502.0 162.0 ND ND 750.0 ND ND ND ND ND 162.0 ND ND ND 883.1 13541.0 5498.8 5320.0 1136.0 1897.0 1516.0 ND 1148.0 4073.0883.2 132724.0 34459.5 34365.0 2368.0 5317.0 14882.0 5222.0 2178.0 19888.0883.3 22526.0 4522.8 9803.0 ND 541.0 1384.0 917.0 588.0 6707.0883.5 10873.0 2822.1 4727.0 ND 465.0 1673.0 634.0 399.0 2788.0883.6 64544.0 14525.3 43400.0 2432.0 4451.0 10270.0 3990.0 2098.0 23846.0883.8 3036.0 1154.5 1262.0 ND 437.0 600.0 ND 252.0 674.0885.1 32066.0 6842.5 9688.0 548.0 1095.0 2490.0 1473.0 813.0 7120.0885.3 137893.0 32785.7 26904.0 851.0 5188.0 12150.0 5892.0 2276.0 22082.0_________________________________________________________________________________________________________________________________________________________________Station Naphthylene, Perylene Perylene, Phenanthrene Phenanthrene, Pyrene Pyrene, Pyrene, Pyrene,Number ace benzo(ghi) 1-methyl benzo(a) benzo(e) indeno(1,2,3-cd)_________________________________________________________________________________________________________________________________________________________________740.0 ND ND ND 462.0 172.0 195.0 138.0 ND ND 750.0 ND 175.0 ND 286.0 ND ND ND ND ND 883.1 1773.0 ND 34224.0 46686.0 2716.0 137640.0 18972.0 9133.0 3329.0883.2 1759.0 19076.0 15288.0 261118.0 16912.0 326059.0 43429.0 58176.0 15829.0883.3 706.0 2781.0 2844.0 89877.0 6569.0 121187.0 3259.0 11074.0 2781.0883.5 450.0 1721.0 1086.0 46424.0 3176.0 60000.0 2448.0 5903.0 1131.0883.6 2098.0 9252.0 7456.0 324308.0 17964.0 327487.0 17646.0 31318.0 7043.0883.8 337.0 ND 639.0 10810.0 631.0 10570.0 772.0 1783.0 583.0885.1 483.0 3294.0 3507.0 73819.0 6413.0 122063.0 5977.0 16178.0 2964.0885.3 1745.0 16007.0 14079.0 359679.0 35968.0 543857.0 38764.0 57761.0 13982.0_________________________________________________________________________________________________________________________________________________________________* RCM = Resident California Mussel POD = Abalone Jingle (Pododesmus cepio) ND = Not Detected TCM = Transplanted California Mussel PAC = Shore Crab (Pachygrapsus crassipes) RBM = Resident Bay Mussel (s = small size) GYL = Sand Worm (Glycera spp.) OYS = Oyster (Crassostrea gigas)

S-7
APPENDIX SState Mussel Watch Program
Summary of 1995-97 Data: PAHs in Mussel, Oyster, Abalone Jingle, Shore Crab, and Sand Worm(ppb, lipid weight)
__________________________________________________________________________________________________________________________________________________________________Station Station Sample Sample Total Anthracene Anthracene, Anthracene, Biphenyl Chrysene FluorantheneNumber Name Type* Date PAH benz(a) dibenz(a,h)__________________________________________________________________________________________________________________________________________________________________888.0 San Diego Bay/Coronado Bridge RBM 01/28/97 43037.4 395.0 3323.0 566.0 ND 6146.0 11995.0894.0 SD Bay/Harbor Is/E Basin/Storm Dr TCM 01/28/97 21995.2 455.0 1432.0 ND ND 2938.0 6371.0_________________________________________________________________________________________________________________________________________________________________Station Fluoranthene, Fluoranthene, Fluorene Naphthalene Naphthalene, Naphthalene, Naphthalene, Naphthalene, Naphthene,Number benzo(b) benzo(k) 1-methyl 2-methyl 2,6-dimethyl 2,3,5-trimethyl ace_________________________________________________________________________________________________________________________________________________________________888.0 5541.0 2029.4 ND ND ND ND ND ND ND 894.0 1805.0 865.2 ND ND ND ND ND ND ND _________________________________________________________________________________________________________________________________________________________________Station Naphthylene, Perylene Perylene, Phenanthrene Phenanthrene, Pyrene Pyrene, Pyrene, Pyrene,Number ace benzo(ghi) 1-methyl benzo(a) benzo(e) indeno(1,2,3-cd)_________________________________________________________________________________________________________________________________________________________________888.0 ND ND 593.0 1274.0 ND 6624.0 843.0 2972.0 736.0894.0 ND ND 542.0 1026.0 ND 4241.0 534.0 1307.0 479.0_________________________________________________________________________________________________________________________________________________________________* RCM = Resident California Mussel POD = Abalone Jingle (Pododesmus cepio) ND = Not Detected TCM = Transplanted California Mussel PAC = Shore Crab (Pachygrapsus crassipes) RBM = Resident Bay Mussel (s = small size) GYL = Sand Worm (Glycera spp.) OYS = Oyster (Crassostrea gigas)

T-1
APPENDIX T
Summary of 1995-97 Data
PAHs in Sediment
(ppb, dry weight)

T-2
APPENDIX TState Mussel Watch Program
Summary of 1995-97 Data: PAHs in Sediment (ppb, dry weight)__________________________________________________________________________________________________________________________________________________________________Station Station Sample Sample Total Anthracene Anthracene, Anthracene, Biphenyl Chrysene FluorantheneNumber Name Type* Date PAH benz(a) dibenz(a,h)__________________________________________________________________________________________________________________________________________________________________101.5 Humboldt Bay/Eureka SM.22 SED 02/15/95 1607.2 17.5 23.4 ND 69.9 62.2 82.1102.6 Humboldt Bay/J Street SED 02/15/95 12293.6 212.0 564.0 95.4 181.0 512.0 2260.0102.7 Humboldt Bay/H Street SED 02/15/95 2672.9 34.5 75.6 28.2 70.2 78.8 239.0102.8 Humboldt Bay/Davenport Mar. C St SED 02/15/95 1617.4 15.1 22.7 7.7 67.8 38.7 120.0104.1 Humboldt Bay/Union Oil Plant SED 02/15/95 1677.9 19.7 22.1 ND 72.3 39.5 98.0104.2 Humboldt Bay/Coal Oil Gas Plant SED 02/15/95 1982.7 26.2 33.8 11.9 66.0 62.0 217.0104.3 Humboldt Bay/Old Pac. Lumber SED 02/15/95 2768.0 25.2 57.7 21.7 69.9 72.6 277.0299.1 Selby Slag 4 SED 10/27/95 2128.1 104.0 212.0 ND 9.8 300.0 348.0302.6 Paradise Cove SED 10/26/95 2255.9 30.1 139.0 60.7 14.9 131.0 278.0306.1 Gashouse Cove/Laguna Street SED 12/07/95 4101.2 135.0 253.0 52.3 18.1 357.0 515.0_________________________________________________________________________________________________________________________________________________________________Station Fluoranthene, Fluoranthene, Fluorene Naphthalene Naphthalene, Naphthalene, Naphthalene, Naphthalene, Naphthene,Number benzo(b) benzo(k) 1-methyl 2-methyl 2,6-dimethyl 2,3,5-trimethyl ace_________________________________________________________________________________________________________________________________________________________________101.5 72.2 16.5 71.1 111.0 135.0 243.0 76.8 31.8 15.1102.6 604.0 258.0 445.0 266.0 268.0 572.0 90.1 32.0 624.0102.7 162.0 51.3 75.2 130.0 135.0 243.0 77.8 33.9 12.0102.8 58.8 12.3 77.0 112.0 131.0 237.0 72.6 31.6 17.0104.1 77.1 17.0 75.4 126.0 138.0 249.0 81.3 33.1 11.9104.2 92.1 24.6 70.9 113.0 125.0 226.0 76.0 28.5 17.3104.3 169.0 50.2 70.9 137.0 129.0 230.0 70.3 31.9 11.1299.1 155.0 22.8 34.1 16.8 8.4 15.1 13.5 8.2 16.2302.6 110.0 175.0 20.2 30.6 14.7 22.3 15.1 10.3 12.4306.1 350.0 26.2 40.1 61.4 40.2 40.5 26.2 17.9 39.8_________________________________________________________________________________________________________________________________________________________________Station Naphthylene, Perylene Perylene, Phenanthrene Phenanthrene, Pyrene Pyrene, Pyrene, Pyrene,Number ace benzo(ghi) 1-methyl benzo(a) benzo(e) indeno(1,2,3-cd)_________________________________________________________________________________________________________________________________________________________________101.5 ND 40.3 36.3 239.0 82.1 82.7 33.2 41.5 24.5102.6 27.1 146.0 258.0 1920.0 122.0 1810.0 438.0 301.0 288.0102.7 22.8 70.0 129.0 270.0 89.6 280.0 147.0 103.0 115.0102.8 6.8 40.8 33.5 250.0 72.3 110.0 25.4 38.3 19.0104.1 9.2 49.8 39.8 232.0 80.3 98.0 36.3 46.4 25.7104.2 7.5 48.2 52.8 276.0 71.4 180.0 59.6 54.4 42.5104.3 13.5 86.8 171.0 257.0 77.2 304.0 171.0 115.0 149.0299.1 7.8 40.6 99.3 124.0 21.1 282.0 120.0 86.9 82.5302.6 16.0 82.9 169.0 106.0 13.7 348.0 186.0 134.0 136.0306.1 23.7 72.8 321.0 303.0 ND 648.0 317.0 188.0 255.0_________________________________________________________________________________________________________________________________________________________________ * SED = Sediment ND = Not Detected

T-3
APPENDIX TState Mussel Watch Program
Summary of 1995-97 Data: PAHs in Sediment (ppb, dry weight)__________________________________________________________________________________________________________________________________________________________________Station Station Sample Sample Total Anthracene Anthracene, Anthracene, Biphenyl Chrysene FluorantheneNumber Name Type* Date PAH benz(a) dibenz(a,h)__________________________________________________________________________________________________________________________________________________________________306.2 Sansome Street/Pier 31 SED 12/06/95 5294.7 170.0 323.0 ND 27.4 313.0 928.0306.3 Howard Street/Pier 14 SED 12/06/95 11177.4 250.0 1040.0 72.1 27.6 706.0 1350.0306.4 Central Basin/Outer SED 12/06/95 7939.1 428.0 641.0 87.1 16.3 844.0 1060.0311.4 North South Bay SED 12/06/95 810.2 10.0 31.8 ND 6.6 40.2 73.1_________________________________________________________________________________________________________________________________________________________________Station Fluoranthene, Fluoranthene, Fluorene Naphthalene Naphthalene, Naphthalene, Naphthalene, Naphthalene, Naphthene,Number benzo(b) benzo(k) 1-methyl 2-methyl 2,6-dimethyl 2,3,5-trimethyl ace_________________________________________________________________________________________________________________________________________________________________306.2 346.0 24.6 90.1 57.1 22.4 38.6 26.4 16.1 70.1306.3 1100.0 11.0 98.3 122.0 31.5 61.3 31.1 26.9 49.4306.4 845.0 55.7 86.4 46.0 15.6 27.7 19.6 11.4 39.1311.4 90.3 8.2 8.4 13.3 6.4 9.6 7.4 ND 7.4_________________________________________________________________________________________________________________________________________________________________Station Naphthylene, Perylene Perylene, Phenanthrene Phenanthrene, Pyrene Pyrene, Pyrene, Pyrene,Number ace benzo(ghi) 1-methyl benzo(a) benzo(e) indeno(1,2,3-cd)_________________________________________________________________________________________________________________________________________________________________306.2 31.3 86.6 343.0 498.0 ND 1030.0 368.0 230.0 255.0306.3 53.2 237.0 1070.0 394.0 110.0 1880.0 923.0 601.0 932.0306.4 17.8 139.0 599.0 387.0 35.4 853.0 689.0 432.0 564.0311.4 5.2 24.0 91.8 42.9 7.0 101.0 81.4 56.6 87.7_________________________________________________________________________________________________________________________________________________________________ * SED = Sediment ND = Not Detected

U-1
APPENDIX U
Field and Laboratory Operations

U-2
FIELD AND LABORATORY OPERATIONS
Sample Collection
The State Mussel Watch Program (SMWP) collects about 100 mussels at eachstation, which are randomly divided into two groups for trace element andsynthetic organic chemical analysis. Based on recommendations by Goldberg(1980) and Risebrough et al. (1980), the SMWP samples 45 mussels, threereplicates of 15 individuals each, for trace elements at each site. Traceelement results in the SMWP represent a mean value for the three replicates.A single replicate of 45 composited individuals is analyzed for syntheticorganic compounds.
Mussels of 55 to 65 mm in length are collected wherever possible in order toreduce size related effects. Mussels are collected from the highest tidalheight where they occur in adequate numbers to reduce variability induced byhabitat height. Stainless steel pry bars are used to collect mussels offrocks. The pry bars are cleaned and rinsed in the laboratory and rinsedagain with seawater prior to use.
At locations where mussels are unavailable and sampling can be accomplishedusing scuba equipment, transplanted samples are used. The mussel transplantsystem used is one of the following three systems; 1) In an area of deepwater and no structures, a bottom anchored submerged buoy system is used;2) In areas with structures (i.e. pilings, floating docks, etc.), apolypropylene line may be tied between two pilings or a line hung beneath adock; 3) In areas of shallow water, samples may be placed on PVC or woodenstakes that are pounded into the substrate. Transplanted mussels are placedin polypropylene mesh bags and kept cool in ice chests for no more than 48hours prior to deployment. To minimize the risk of contamination of themussel from boat exhaust or surface film during deployment or retrieval,mussel samples are placed in polyethylene bags, where they remain untilsubmerged and deployed. Upon retrieval from the subsurface buoy system,samples are again placed in polyethylene bags before being brought throughthe air-water interface. Once collected, the transplants are triple bagged.To minimize contamination caused by handling the mussel samples, polyethylenegloves are worn during collection, as well as processing, of mussel samples.A two month transplant period is adequate in most cases where pollutantuptake rates are expected to be high, but for trace elements in lesscontaminated environments, a six month interval may be necessary for anadequate sample (Stephenson et al. 1980). A four to six month transplantinterval is used for organic chemicals to be consistent with transplantperiods for trace elements.
Mussels to be analyzed for trace elements are placed in a ZIPLOCKR
polyethylene bag of 4 mm thickness. The samples are placed inside twoadditional polyethylene ZIPLOCKR bags. Mussels to be analyzed for syntheticorganic compounds are placed in a bag constructed of two layers of "heavyduty" aluminum foil. Prior to use, the foil is cleaned by heating to 500oC orby rinsing in hexane. Samples in the foil bags are placed in twopolyethylene ZIPLOCKR bags. After bagging, all samples are placed in non-metallic ice chests and frozen using dry ice and stored at or below -20oCuntil processed.

U-3
Laboratory Analysis
A detailed description of procedures and techniques discussed below can befound in the Department of Fish and Game's (DFG) Laboratory Quality AssuranceProgram Plan (DFG 1990). The following is a summary of the 1995-96 and1996-97 Quality Assurance/Quality Control (QA\QC) results provided by theDFG's Water Pollution Control and Moss Landing Laboratories. Copies of theLaboratory Quality Assurance Program Plan and QA\QC results are availableupon request.
Trace Elements Analytical Techniques in Tissue and Sediment
The following procedures were employed for mussel dissection andhomogenization for trace element analysis: Frozen mussels were removedindividually from the bags, cleaned of epiphytic organisms and debris underrunning deionized water by personnel wearing polyethylene gloves, and allowedto thaw in clean polyethylene trays. Adductor muscles were severed andgonads removed with a MICROR-cleaned stainless steel scalpel. Gonads wereremoved from mussels to reduce variability in trace element concentrationsdue to the sex of the organism (Stephenson et al. 1987). The remainder ofthe soft part was placed in a pre-weighted, acid-cleaned polypropylene 4 oz.jar and re-weighed. The shell lengths were also taken at this time. Sampleswere then homogenized to a paste-like consistency in the jars using aBrinkmann Polytron (Model PT10-35) equipped with a titanium generator (ModelPTA 20). The homogenized samples were then refrozen at -20oC until analyzed.
A Perkin-Elmer Model 2280 spectrophotometer with deuterium arc backgroundcorrector and digital display was used for techniques employing conventional(flame) atomic absorption spectrophotometry (Al, Cd, Cu, Mn, Zn) and coldvapor technique for mercury. A Perkin-Elmer Model 3030 Zeeman atomicabsorption spectrophotometer equipped with an HGA-600 graphite furnace and anAS-60 autosampler was used for techniques requiring a graphite furnace (Ag,As, Cr, Ni, Pb, Se). All analytical values were corrected using proceduralblanks. Trace element detection limits are presented in Table U-1 Thetechnique used for digesting samples was known as "Teflon vessel digestion".Separate techniques were performed on sediments and tissues in the "Teflonvessel digestion" technique.
The "Teflon vessel digestion" technique for tissue and sediment wereperformed as follows: Samples were weighed into pre-cleaned 125 ml Teflondigestion vessels. Three grams of tissue and one gram of sediment were used.Digestion of each tissue sample was accomplished by adding a 4:1 concentratedHNO3: 3 ml concentrated HClO4 mixture and heating the sample on a warm (75oC)hotplate 2-3 hours. After the initial reaction, the Teflon vessel was cappedand heated in a 130oC oven for four hours. Once the digestate had cooled itwas transferred to a clean polyethylene bottle and diluted up to 20 ml withType ll water. Sediment samples were digested using the same mixture astissue samples except, instead of warming on a hotplate, sediment sampleswere heated in a 130oC oven for four hours. After the initial reaction, 3 mlof hydrofluoric acid was added to the sediment sample and the Teflon vesselreturned to a 130oC oven for 12 hours. Twenty ml of boric acid (2.5%) wasadded to each sediment sample before again returning to a 130oC oven foranother 8 hours. Once the digestate was cool it was transferred to a cleanpolyethylene bottle and brought up to 20 ml with Type ll water.

U-4
To protect sample integrity, all materials contacting samples duringlaboratory operations were analyzed for trace element content. To ensureaccuracy, reference materials from the National Bureau of Standards (NBS)were analyzed (Table U-2).
Synthetic Organic Compounds Analytical Techniques in Tissues - 1996
A 50 gram sample of tissue was spiked with a surrogate mixture of 4,4'-dibromo-octafluorobiphenyl, decachlorobiphenyl, and dibutylchlorendate (DBOB,DCB, DBCE) and extracted twice with acetonitrile by shaking for two hours onan orbital shaker at 300 rpm. The sample extracts were combined, filtered,and partitioned with petroleum ether. An aliquot of the petroleum etherextract was eluted through a FlorisilR column. The FlorisilR columns wereeluted with petroleum ether (Fraction 1), six percent ethyl ether/petroleumether (Fraction 2), and 15 percent ethyl ether/petroleum ether (Fraction 3).Fractions 2 and 3 were spiked with decachlorobiphenyl and all of thefractions were concentrated to an appropriate volume in a ZymarkR Turbovapconcentrator prior to analysis by gas chromatography. The DCB was used as asurrogate to determine analyte recovery of the F1 compounds and to determinerelative retention times for all fractions. DBOB was used to check theanalyte recovery of the F2 compounds but was found to elute with the F1compounds. DBCE was used to check the analyte recovery of the F3 compounds.The percent recoveries for the surrogate compounds are listed in Table U-5for 1996. A mixture of synthetic standards was eluted through the FlorisilR
column to determine the recovery and separation characteristics of thecolumn. The distribution of synthetic organic compounds in the threefractions are listed in Table U-3. The detection limits for syntheticorganics in mussels are presented in Table U-4.
At stations where the SMWP had previously detected endosulfan, samples wereanalyzed for endosulfan I, endosulfan II, and endosulfan sulfate. Thisrequired an additional elution through FlorisilR with 50 percent ethylether/petroleum ether (Fraction 4, Table U-3). All other stations wereanalyzed for endosulfan I only. This fraction was also spiked withdecachlorobiphenyl prior to the concentration step. All of the 50 percentextracts were diluted with iso-octane by a factor of ten prior to analysis bygas chromatography because of the high lipid content of the fraction.
Procedure for Lipid Determination
Synthetic organic concentrations in organisms vary with lipid content so itis customary to provide lipid data when reporting tissue concentrations. Athoroughly homogenized sample weighing approximately 5 g (wet weight) ismacerated and dried with anhydrous granular sodium sulfate. The dried sampleis transferred to a blender with 150 ml of petroleum ether and blended fortwo minutes at high speed. The liquid is vacuum-filtered into a 250 mlfilter flask through a 10 cm Buchner funnel containing Whatman #1 filterpaper. The sample is blended once more with an additional 150 mL ofpetroleum ether and filtered. The filtrate is concentrated to approximately25 mL with heat (steam bath) and nitrogen blowdown. The remaining filtrateis then quantitatively transferred into a 50 mL pre-weighed planchet. Thepetroleum ether is evaporated, the planchet containing the residue isreweighed, and the percent lipid is calculated.

U-5
SMW Samples Analyzed with the Bay Protection Toxic Cleanup Program
The Water Pollution Control Laboratory analyzed sediment samples for the BayProtection and Toxic Cleanup Program - Group 17b. This group of samples alsoincluded sediment samples from the 1995 SMW program. These samples wereanalyzed for chlorinated hydrocarbons, PCBs and PAHs.
Polynuclear Aromatic Hydrocarbon Compounds (PAHs) and ChlorinatedHydrocarbons Analytical Techniques in Sediment
Thawed samples were stirred to a homogeneous appearance and two samplealiquots were removed, one for percent moisture determination (5 grams) andone for chemical analysis (20 grams). Sodium sulfate, activated copper andextraction surrogates were added to the bottle containing the 20 gramanalytical sample which was then extracted three times with methylenechloride. After combining the three extraction aliquots, the extract wasdivided into two portions, one for chlorinated hydrocarbon (CH) analysis andthe other for polycyclic aromatic hydrocarbon (PAH) analysis.
The CH portion was eluted through an activated Florisil column, separatingthe analytes into two fractions. Fraction 1 analytes were eluted withpetroleum ether and fraction 2 analytes were eluted with 50% ethyl ether inpetroleum ether. The two fractions were concentrated to 2 mL final volumeusing a Zymark Turbovap II evaporator.
The PAH aliquot was eluted through a silica gel/alumina column with methylenechloride. The extract was concentrated to 1 mL final volume using Kuderna-Danish (K-D) apparatus and a heated water bath.Two sediment samples were spiked with solutions containing knownconcentrations of target analytes (chlorinated hydrocarbons, PCB congenersand PAHs) to assess accuracy and matrix effects. Percent recoveries for theseanalytes can be found in Tables U-10 (chlorinated hydrocarbons), Table U-11(PCB congeners) and Table U-12 (PAHs).
Method blanks, representative of all materials and solutions contacting thesample, were prepared and analyzed. To preclude errors due to contamination,a vertical solvent was blank was prepared for each set of glassware used inthe extraction and analyzed before introducing a new sample.
Synthetic Organic Compounds Analytical Techniques in Tissue - 1997
A 25 gram sample of tissue was spiked with a synthetic organic surrgatesolution (DBOB, PCB congener 207, DBCE). The sample was dried with sodiumsulfate and extracted three times by shaking with methylene chloride on anorbital shaker at 300 rpm. After combining the extracts, the sample wasevaportated in a ZymarkR Turbovap to 10 mLs. A 2 mL aliquot was removed andplaced in a tared planchett for lipid analysis. After the solventevaporated, the planchett was briefly dried in a 70oC oven to remove residualwater. The percent lipid was then calculated. A 4 mL aliquot was elutedthrough a Florisil column as described above and four fractions (0%, 6%, 15%,and 50% petroleum ether/ethyl ether) were collected. The percent recoveriesfor the surrogate compounds are listed in Table U-6.

U-6
Mussel samples were spiked in duplicate with a solution containing knownconcentrations of target analytes to asses accuracy and matrix effects.Percent recoveries of the target analytes from the matrix spikes for 1996 and1997 are listed in Table U-7.
Approximately 10 percent of samples were analyzed in duplicate to determinemethod precision. Precision results are listed in Table U-8 (1996) andTable U-9 (1997). Method blanks, representative of all materials andsolutions contacting the sample, were prepared and analyzed. To precludeerrors due to contamination, a vertical solvent was blank was prepared foreach set of glassware used in the extraction and analyzed before introducinga new sample.
Polynuclear Aromatic Hydrocarbon Compounds (PAHs) AnalyticalTechniques in Tissue
Ten grams of tissue was spiked with a PAH surrogate solution that containseight deuterated PAH compounds. The sample was dried, placed in a stainlesssteel cell and extracted by forcing heated solvents (1:1 solution ofmethylene chloride:acetone) under pressure through the sample. The extractwas solvent exchanged into methylene chloride and eluted through a gelpermeation chromatograph to remove most of the lipids. The extract wasfurther cleaned up by eluting it through a silica gel/alumina column.
Table U-13 lists the PAH dry weight detection limits for tissue. PAHsurrogate recoveries are listed in Table U-14. Tables U-15 and U-16 list thematrix spike recoveries and duplicate analysis results respectively.
Instrument and Analytical Conditions for Chlorinated Hydrocarbons
Sample extracts for chlorinated hydrocarbons were analyzed using a VarianModel 3500 gas chromatograph equipped with a Model 8035 autosampler,temperature programmable on-column injector, and dual Ni63 electron capturedetectors. A 5 meter J&W DB5 fused silica capillary pre-column is connectedto the temperature programmable injector, the column effluent is split usinga press-fit "Y" connector to a 60 meter J&W DB5 and a 60 meter J&W DB17column. The DB5 and DB17 columns are connected to the electron capturedetectors. All three columns have a 0.25 mm ID and a 0.25 um liquid phasethickness. Helium was used as the carrier gas at a linear velocity of 35cm/sec and nitrogen was used as the detector makeup gas at a flow of 25ml/min. Chromatographic data was acquired and processed with a Hewlett-Packard Chem-Station, version A.03.02.
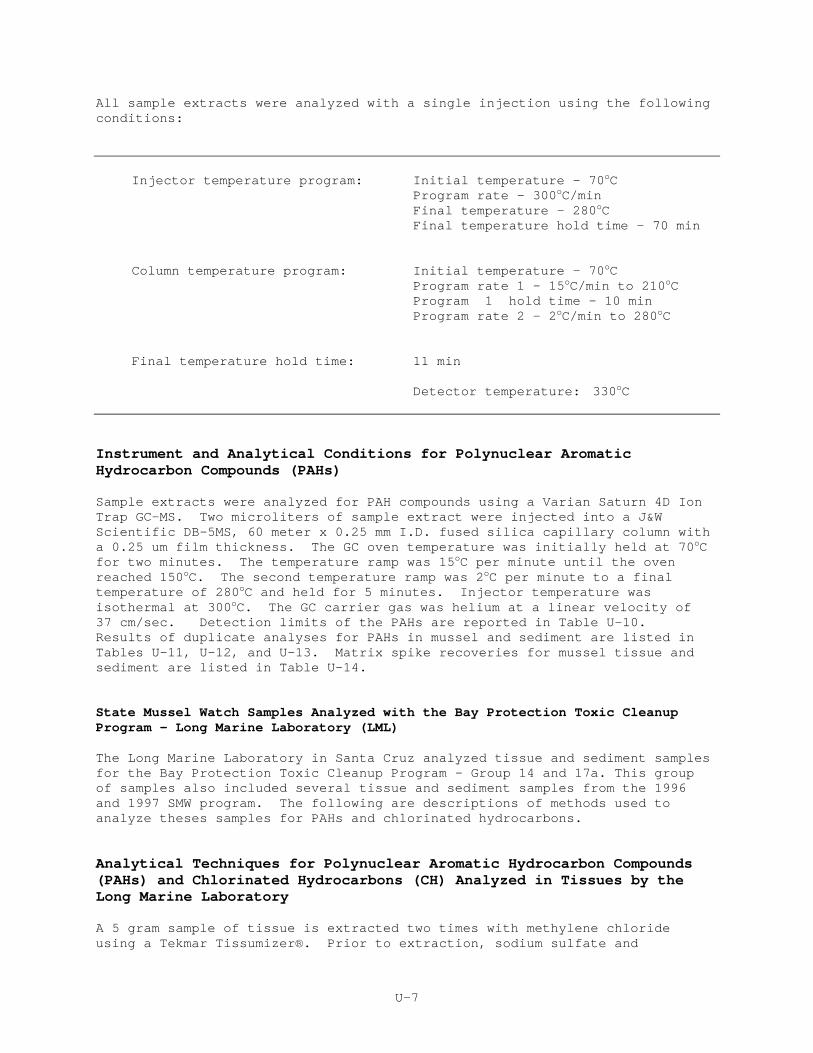
U-7
All sample extracts were analyzed with a single injection using the followingconditions:
Injector temperature program: Initial temperature - 70oCProgram rate - 300oC/minFinal temperature - 280oCFinal temperature hold time – 70 min
Column temperature program: Initial temperature - 70oCProgram rate 1 - 15oC/min to 210oCProgram 1 hold time - 10 minProgram rate 2 - 2oC/min to 280oC
Final temperature hold time: 11 min
Detector temperature: 330oC
Instrument and Analytical Conditions for Polynuclear AromaticHydrocarbon Compounds (PAHs)
Sample extracts were analyzed for PAH compounds using a Varian Saturn 4D IonTrap GC-MS. Two microliters of sample extract were injected into a J&WScientific DB-5MS, 60 meter x 0.25 mm I.D. fused silica capillary column witha 0.25 um film thickness. The GC oven temperature was initially held at 70oCfor two minutes. The temperature ramp was 15oC per minute until the ovenreached 150oC. The second temperature ramp was 2oC per minute to a finaltemperature of 280oC and held for 5 minutes. Injector temperature wasisothermal at 300oC. The GC carrier gas was helium at a linear velocity of37 cm/sec. Detection limits of the PAHs are reported in Table U-10.Results of duplicate analyses for PAHs in mussel and sediment are listed inTables U-11, U-12, and U-13. Matrix spike recoveries for mussel tissue andsediment are listed in Table U-14.
State Mussel Watch Samples Analyzed with the Bay Protection Toxic CleanupProgram - Long Marine Laboratory (LML)
The Long Marine Laboratory in Santa Cruz analyzed tissue and sediment samplesfor the Bay Protection Toxic Cleanup Program - Group 14 and 17a. This groupof samples also included several tissue and sediment samples from the 1996and 1997 SMW program. The following are descriptions of methods used toanalyze theses samples for PAHs and chlorinated hydrocarbons.
Analytical Techniques for Polynuclear Aromatic Hydrocarbon Compounds(PAHs) and Chlorinated Hydrocarbons (CH) Analyzed in Tissues by theLong Marine Laboratory
A 5 gram sample of tissue is extracted two times with methylene chlorideusing a Tekmar Tissumizer®. Prior to extraction, sodium sulfate and

U-8
extraction surrogates are added to the sample. After combining the twoextraction aliquots, the extract is divided into three portions: one forlipid weight determination, one for chlorinated hydrocarbon (CH) analysis,and one for PAHs.
The CH portion is eluted through a silica/alumina column, separating theanalytes into two fractions (Table U-17). Fraction 1 (F1) analytes areeluted using 1% methylene chloride in pentane and contains > 90% of p,p'-DDEand < 10% of p,p'-DDT. Fraction 2 (F2) analytes are eluted using 1% acetonein methylene chloride. The F2 fraction undergoes additional cleanup usingsize-exclusion High Performance Liquid Chromatography (HPLC/SEC). The F1 andF2 fractions are concentrated to 125 uL using a combination of rotaryevaporator, tube heater, and nitrogen gas evaporation.
The PAH aliquot is eluted through a silica/alumina column using 100%methylene chloride. The eluate is further cleaned using HPLC/SEC. The PAHfraction is concentrated to 125 uL, using a combination of rotary evaporator,tube heater, and nitrogen gas evaporation.
Table U-18 lists the dry weight detection limits for chlorinated hydrocarbonsin sediment and tissue; Table U-19 lists the dry weight detection limits forPAHs in tissue and sediments.
Analytical Techniques for Polynuclear Aromatic Hydrocarbon Compounds (PAHs)and Chlorinated Hydrocarbons (CH) Analyzed in Sediment by the Long MarineLaboratory
Samples are removed from the freezer and allowed to thaw. Each sample isstirred to a homogeneous appearance and two 10 gram sample aliquots areremoved, one for dry weight determination and one for chemical analysis.
The dry weight sample is placed into a pre-weighed aluminum planchet anddried at 100˚C for 24 hrs. The dried sample is re-weighed to determine thesample's percent moisture.
The analytical sample is extracted three times with methylene chloride in a250-mL amber Boston round bottle on a modified rock tumbler. Prior torolling, sodium sulfate, copper, and extraction surrogates are added to thebottle. The sodium sulfate dehydrates the sample allowing for efficientsediment extraction. The copper, which is activated with hydrochloric acid,complexes free sulfur in the sediment.
After combining the three extraction aliquots, the extract is divided intotwo portions, one for chlorinated hydrocarbon (CH) analysis and the other forpolycyclic aromatic hydrocarbon (PAH) analysis.
The CH portion is eluted through a silica/alumina column, separating theanalytes into two fractions (Table U-17). Fraction 1 (F1) is eluted with1% methylene chloride in pentane and contains > 90% of p,p'-DDE and < 10% ofp,p'-DDT. Fraction 2 (F2) analytes are eluted with 1% acetone in methylenechloride. The two fractions are exchanged into hexane and concentrated to500 uL using a combination of rotary evaporation, controlled boiling on tubeheaters, and dry nitrogen blow downs. The F1 is treated a second time with aminimal amount of activated copper to ensure complete removal of sulfur priorto GC analysis.

U-9
The extract's PAH portion is eluted through a silica/alumina column withmethylene chloride. The "cleaned" eluate is exchanged into hexane andconcentrated to 500 uL in the same manner as the CH fractions.
Instrument and Analytical Conditions (Long Marine Laboratory)
The F1 and F2 fractions are analyzed by Gas Chromatography for chlorinatedhydrocarbon analysis utilizing an Electron Capture Detector (GC/ECD). Asingle 2 uL splitless injection is directed onto two columns of differentpolarity (DB-17 & DB-5) to provide two dimensional confirmation of eachanalyte. The lowest analytical results are reported.
The PAH fraction is analyzed by Gas Chromatography Mass Spectrometry (GC/MS)for aromatic hydrocarbon analysis. A single 2 uL splitless injection ischromatographed on a DB-5 ms column and analyzed in a single ion monitoring(SIM) mode.
All analytes of interest are quantified using internal standard methodologiesand are corrected for surrogate recoveries.
Quality control (QC) measures are routinely performed during sample analysesas described in the Bay Protection and Toxic Cleanup Program QualityAssurance Project Plan (BPTCP QAPP)1. The QC measures include the tracking ofaccuracy and precision as performance indices, instrument calibrationverification, the dilution of samples which exceed the instrument'scalibrated range and the documentation of surrogate recoveries.
Instrumental calibration is verified with continuing calibration check (CCC)solutions every 10-16 hours. Solutions purchased from the National Instituteof Standards and Technology (NIST) are used to prepare mid-level CCCsolutions with each analytical batch. The stability of all non-NIST analytecalibrations are monitored through the analysis of mid-level standards on16-20 hour intervals.
All surrogates are inspected for acceptable recoveries prior to sampleanalysis. Samples which have recoveries exceeding the criterion of 50%-150%are subjected to re-analysis or re-extraction. Marginal recoveries which arein control yet exceed the range of 60% - 120% are closely inspected andcorrective action is taken as appropriate. All corrective action is fullydocumented.
Prior to GC analysis, samples are spiked with a 20 fold excess of dilutioninternal standards. Therefore, samples exceeding the calibrated range of theinstrument are subjected to a standard 1:20 dilution and reanalyzed.Deuterated fluoranthene (d12-FLA) is utilized as the PAH DIL-Istd.
Tracking of analytical precision and accuracy is accomplished through the useof method duplicates, matrix spikes, and Standard Reference Materials (SRMs)at a minimum of 5% each. Matrix spikes provide a means for assessingmethodological performance for analytes not found in available SRMs. Matrixspike recoveries are presented in Tables U-20 through U-23. Tissues are
1 Stephenson, M., M. Pucket, N. Morgan, and M. Reid. 1994. Bay Protection and Toxic CleanupProgram: Quality Assurance Project Plan. Bay Protection and Toxic Cleanup Program, State WaterResources Control Board, Sacramento, CA.

U-10
enriched such that resulting analyte levels are greater than ten times themethod detection limit.
Hard copies of all chromatograms, area percent reports, and internal standardreports are generated and archived for each sample analyzed. Additionally,all phases of the analysis are archived magnetically on mini data cartridges.

U-11
TABLE U-1
State Mussel Watch ProgramTrace Element Detection Limits
Tissue and Sediment
Detection LimitElement (ug/g, ppm dry weight) (ug/g, ppm wet weight)
Aluminum 1.0 0.2Arsenic 0.25 0.04Cadmium 0.002 0.0003Chromium 0.02 0.003Copper 0.003 0.0005Mercury 0.03 0.005Manganese 0.05 0.008Nickel 0.1 0.02Lead 0.03 0.005Selenium 0.1 0.02Silver 0.002 0.0003Titanium 0.5 0.08Zinc 0.02 0.003

U-12
TABLE U-2
State Mussel Watch ProgramTrace Element Analysis of Reference Materials (ug/g, dry weight)*
1995-96** 1996-97**
1566a - NBS Oyster 1566a - NBS Oyster
Ag1.51±0.16(1.68±0.15)
1.71±0.15(1.68±0.15)
Al204±9.54
(202.5±14.1)201±7.74
(202.5±14.1)
As13.5±0.751(14.0±1.2)
11.8±0.141(14.0±1.2)
Cd4.32±0.10(4.15±0.38)
4.39±0.10(4.15±0.38)
Cr1.11±0.08(1.43±0.46)
1.14±0.04(1.43±0.46)
Cu64.7±0.80(66.3±4.3)
65.2±0.39(66.3±4.3)
Hg0.064±0.004(0.064±0.007)
0.0629±0.001(0.064±0.007)
Mn12.1±0.954(12.3±1.5)
12.4±0.58(12.3±1.5)
Ni2.19±0.22(2.25±0.44)
2.31±0.06(2.25±0.44)
Pb0.429±0.011(0.371±0.014)
0.360±0.040(0.371±0.014)
Se2.12±0.452.21±0.24
1.85±0.0(2.21±0.24)
Zn840±21(830±57)
859±30.7(830±57)
* Sample values are given first, followed by reference values inparentheses, both values include 95% confidence interval whereappropriate.NBS refers to the National Bureau of Standards.
** Sample Year = State Fiscal Year (July 1 - June 30).

U-13
TABLE U-3
State Mussel Watch ProgramDistribution of Synthetic Organic Compounds Among
Four Fractions of a Standard FlorisilR Column
(0%) Fraction 1 (6%) Fraction 2 (15%) Fraction 3
HCH, alpha* HCH, alpha* dacthalaldrin HCH, beta diazinonchlordene, alpha HCH, gamma dichlorobenzophenone, p,p'chlordene, gamma HCH, delta dieldrinDDE, o,p' cis-chlordane endosulfan IDDE, p,p' trans-chlordane endrinDDMU, p,p'* chlorpyrifos malathionDDT, o,p' DDD, o,p' oxadiazonDDT, p,p'* DDD, p,p' parathion, ethyl heptachlor DDMU p,p'* parathion, methyl hexachlorobenzene DDT, p,p'* tetradifon (tedion)trans-nonachlor dicofol (kelthane)PCB 1248 ethionPCB 1254 heptachlor epoxidePCB 1260 methoxychlor
cis-nonachlor (50%) Fraction 4 oxychlordanetoxaphene endosulfan II
endosulfan sulfate
* Found in both 0% and 6% fractions.

U-14
TABLE U-4
State Mussel Watch ProgramSynthetic Organic Compounds Analyzed
and Their Detection Limits in Mussel and Sediment
Detection LimitCompound (ng/g, ppb dry weight)
aldrin 1cis-chlordane 1trans-chlordane 1chlordene, alpha 1chlordene, gamma 1chlorpyrifos 4dacthal 2DDD, o,'p 5DDD, p,p' 3DDE, o,p' 3DDE, p,p' 3DDMU,p,p' 5DDT, o,p' 4DDT, p,p' 4diazinon 50dichlorobenzophenone-p,p' 3dicofol (Kelthane) 10dieldrin 1endosulfan I 1endosulfan II 10endosulfan sulfate 50endrin 6ethion 20HCH, alpha 1HCH, beta 3HCH, gamma 0.8HCH, delta 2heptachlor 1heptachlor epoxide 1HCB 1methoxychlor 15cis-nonachlor 1trans-nonachlor 1oxadiazon 2oxychlordane 1parathion, ethyl 10parathion, methyl 10PCB 1248 50PCB 1254 10PCB 1260 10PCT 5460 10tetradifon (Tedion) 10toxaphene 100tributyltin 20
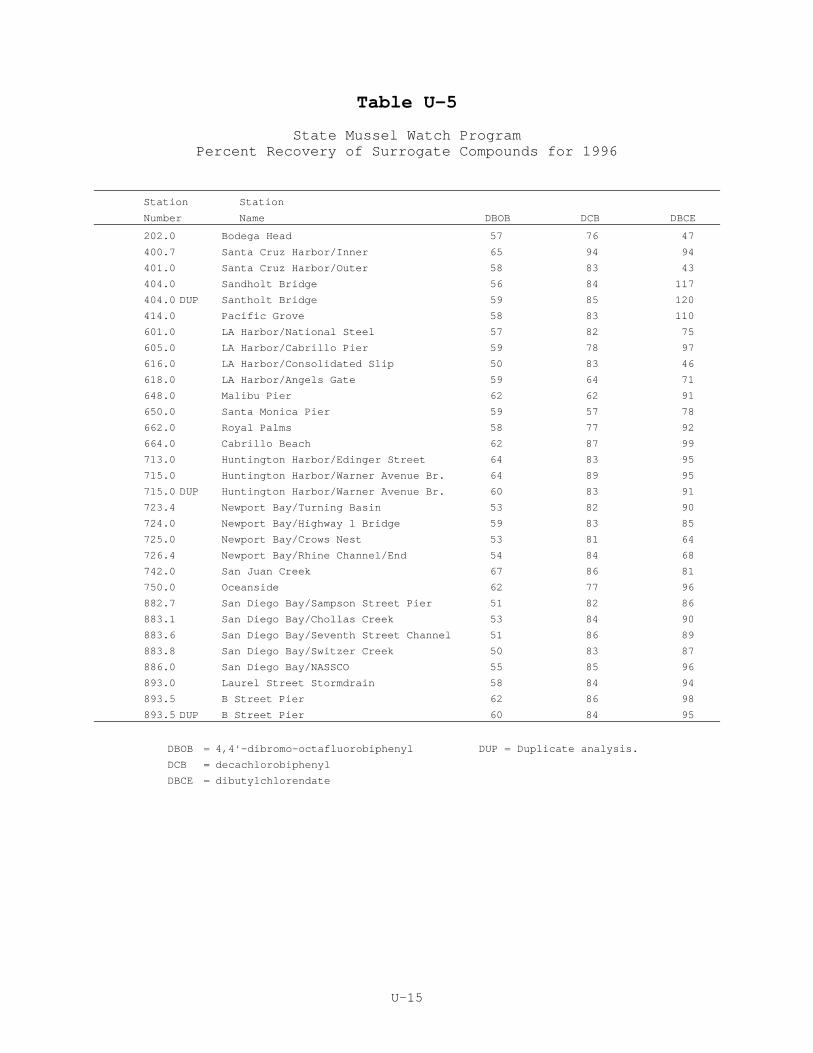
U-15
Table U-5
State Mussel Watch ProgramPercent Recovery of Surrogate Compounds for 1996
Station Station
Number Name DBOB DCB DBCE
202.0 Bodega Head 57 76 47
400.7 Santa Cruz Harbor/Inner 65 94 94
401.0 Santa Cruz Harbor/Outer 58 83 43
404.0 Sandholt Bridge 56 84 117
404.0 DUP Santholt Bridge 59 85 120
414.0 Pacific Grove 58 83 110
601.0 LA Harbor/National Steel 57 82 75
605.0 LA Harbor/Cabrillo Pier 59 78 97
616.0 LA Harbor/Consolidated Slip 50 83 46
618.0 LA Harbor/Angels Gate 59 64 71
648.0 Malibu Pier 62 62 91
650.0 Santa Monica Pier 59 57 78
662.0 Royal Palms 58 77 92
664.0 Cabrillo Beach 62 87 99
713.0 Huntington Harbor/Edinger Street 64 83 95
715.0 Huntington Harbor/Warner Avenue Br. 64 89 95
715.0 DUP Huntington Harbor/Warner Avenue Br. 60 83 91
723.4 Newport Bay/Turning Basin 53 82 90
724.0 Newport Bay/Highway 1 Bridge 59 83 85
725.0 Newport Bay/Crows Nest 53 81 64
726.4 Newport Bay/Rhine Channel/End 54 84 68
742.0 San Juan Creek 67 86 81
750.0 Oceanside 62 77 96
882.7 San Diego Bay/Sampson Street Pier 51 82 86
883.1 San Diego Bay/Chollas Creek 53 84 90
883.6 San Diego Bay/Seventh Street Channel 51 86 89
883.8 San Diego Bay/Switzer Creek 50 83 87
886.0 San Diego Bay/NASSCO 55 85 96
893.0 Laurel Street Stormdrain 58 84 94
893.5 B Street Pier 62 86 98
893.5 DUP B Street Pier 60 84 95
DBOB = 4,4'-dibromo-octafluorobiphenyl DUP = Duplicate analysis.
DCB = decachlorobiphenyl
DBCE = dibutylchlorendate

U-16
Table U-6
State Mussel Watch ProgramPercent Recovery of Synthetic Organic Surrogate Compounds for 1997
Station Station PCB Congener
Number Name DBOB 207 DBCE
1.0 Crescent City Harbor 70 88 63
2.0 Crescent City/STP Outfall 66 87 61
2.1 Crescent City Harbor Jetty 79 97 77
3.0 Crescent City/Control 67 87 72
100.0 Mad River Slough 89 96 57
102.6 Humboldt Bay/J Street 82 98 59
103.3 Humboldt Bay/E Street 64 85 67
103.5 Clark Slough 67 86 58
202.0 Bodega Bay 64 82 64
205.0 Bodega Bay/Spud Pt. Marina 69 73 67
205.1 Bodega Bay/Porto Bodega 61 78 97
205.3 Bodega Bay/Mason’s Marina 67 65 71
205.5 Bodega Bay/Back Marsh 68 88 74
280.0 Russian River/Goat Rock 64 85 69
400.6 Santa Cruz/Natual Bridges 68 86 64
403.0 Elkhorn Slough/Hwy. 1 Bridge 61 54 66
404.0 Sandholdt Bridge 86 101 68
404.0 DUP Sandholdt Bridge 64 85 66
414.0 Pacific Grove 63 84 74
601.0 LA Harbor/National Steel 54 50 62
616.0 LA Harbor/Consolidated Slip 65 57 61
616.0 DUP LA Harbor/Consolidated Slip 69 87 53
648.0 Malibu Pier 75 93 56
650.0 Santa Monica Bay 65 52 65
662.0 Royal Palms 77 102 67
707.0 Anaheim Bay/Navy Harbor 59 79 64
707.0 Dup Anaheim Bay/Navy Harbor 51 54 63
708.0 Anaheim Bay/Navy Marsh 58 81 56
708.5 Anaheim Bay/Navy Marsh 1 54 80 63
713.0 Huntington Harbor/Edinger St. 60 80 81
715.0 Huntington Harbor/Warner Ave. Bridge 69 94 76
725.0 Newport Bay/Crow’s Nest 68 90 55
726.4 Newport Bay/Rhine Channel/End 70 96 62
726.6 Newport Bay/Mariners Drive 71 95 76
740.0 Dana Point Harbor/Boat Yard 68 89 61
750.0 Oceanside 63 53 73
883.1 San Diego/Chollas Creek 61 86 72
883.2 San Diego/Chollas Creek/Mouth 64 83 68
883.3 San Diego/Chollas Creek/Mouth 69 93 78
883.5 San Diego/Tuna Docks 65 59 63
883.6 San Diego/7th Street Channel 58 58 69
883.8 San Diego/Switzer Creek 56 84 60
885.1 San Diego Bay/Paleta Creek/End 57 84 63
894.0 S.D.Bay/Harbor Is./E.Basin/Storm Drain 58 62 120
DBOB = 4,4'-dibromo-octafluorobiphenyl Dup = Duplicate analysis.
DBCE = dibutylchlorendate
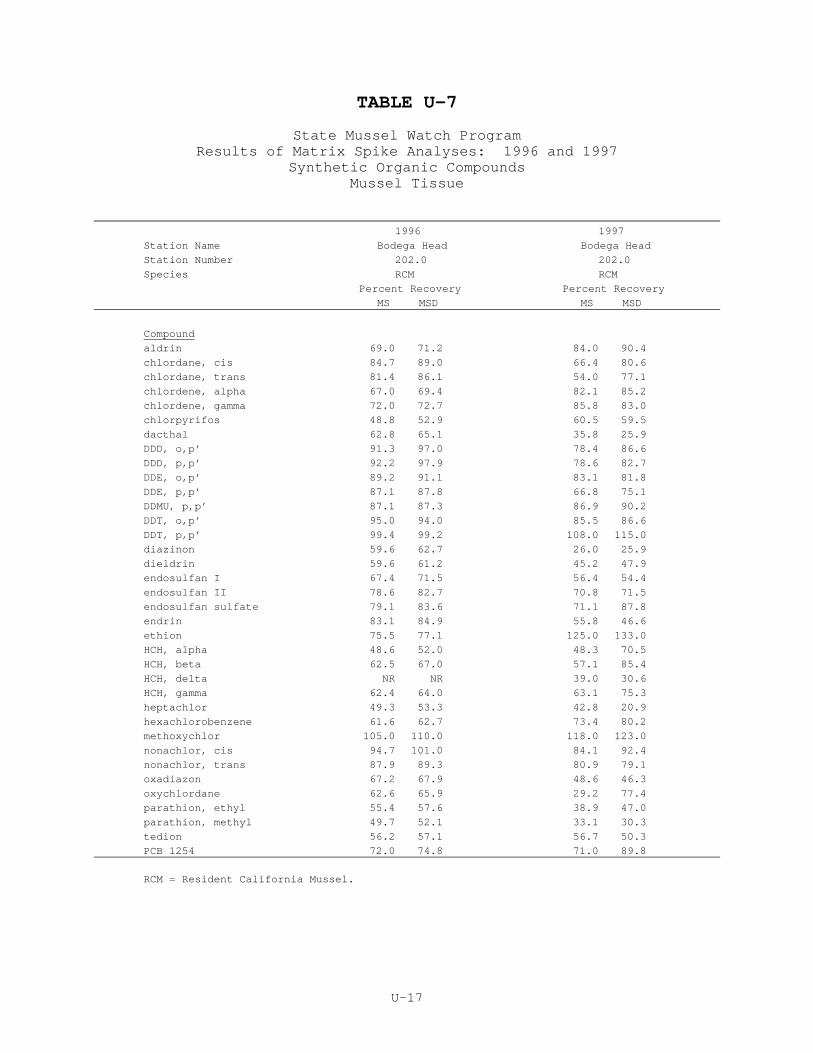
U-17
TABLE U-7
State Mussel Watch ProgramResults of Matrix Spike Analyses: 1996 and 1997
Synthetic Organic CompoundsMussel Tissue
1996 1997
Station Name Bodega Head Bodega Head
Station Number 202.0 202.0
Species RCM RCM
Percent Recovery Percent Recovery
MS MSD MS MSD
Compound
aldrin 69.0 71.2 84.0 90.4
chlordane, cis 84.7 89.0 66.4 80.6
chlordane, trans 81.4 86.1 54.0 77.1
chlordene, alpha 67.0 69.4 82.1 85.2
chlordene, gamma 72.0 72.7 85.8 83.0
chlorpyrifos 48.8 52.9 60.5 59.5
dacthal 62.8 65.1 35.8 25.9
DDD, o,p’ 91.3 97.0 78.4 86.6
DDD, p,p’ 92.2 97.9 78.6 82.7
DDE, o,p’ 89.2 91.1 83.1 81.8
DDE, p,p’ 87.1 87.8 66.8 75.1
DDMU, p,p’ 87.1 87.3 86.9 90.2
DDT, o,p’ 95.0 94.0 85.5 86.6
DDT, p,p’ 99.4 99.2 108.0 115.0
diazinon 59.6 62.7 26.0 25.9
dieldrin 59.6 61.2 45.2 47.9
endosulfan I 67.4 71.5 56.4 54.4
endosulfan II 78.6 82.7 70.8 71.5
endosulfan sulfate 79.1 83.6 71.1 87.8
endrin 83.1 84.9 55.8 46.6
ethion 75.5 77.1 125.0 133.0
HCH, alpha 48.6 52.0 48.3 70.5
HCH, beta 62.5 67.0 57.1 85.4
HCH, delta NR NR 39.0 30.6
HCH, gamma 62.4 64.0 63.1 75.3
heptachlor 49.3 53.3 42.8 20.9
hexachlorobenzene 61.6 62.7 73.4 80.2
methoxychlor 105.0 110.0 118.0 123.0
nonachlor, cis 94.7 101.0 84.1 92.4
nonachlor, trans 87.9 89.3 80.9 79.1
oxadiazon 67.2 67.9 48.6 46.3
oxychlordane 62.6 65.9 29.2 77.4
parathion, ethyl 55.4 57.6 38.9 47.0
parathion, methyl 49.7 52.1 33.1 30.3
tedion 56.2 57.1 56.7 50.3
PCB 1254 72.0 74.8 71.0 89.8
RCM = Resident California Mussel.

U-18
TABLE U-8
State Mussel Watch ProgramResults of Duplicate Sample Analysis
1996 Synthetic Organic Compounds Quality Control - Mussel Tissue(ng/g dry weight)
Station Name Sandholdt Bridge Hunting Harbor/ San Diego Bay/Warner Ave. Bridge B Street Pier
Station Number 404.0 715.0 893.5Species TCM TCM TCMREPLICATE 1 2 1 2 1 2
CompoundAldrinchlordane, cis 33.9 32.4 30.7 30.8 8.80 8.07chlordane, trans 29.1 28.5 30.6 29.6 7.04 6.64chlordene, alpha 1.96 1.84chlordene, gamma 1.49 1.55chlorpyrifos 14.2 11.9 4.91 5.70dacthal 47.4 47.5DDD, o,p’ 89.0 85.3 18.8 18.1DDD, p,p’ 264 254 39.5 38.5 8.45 6.84DDE, o,p’ 45.1 44.5 6.06 5.50DDE, p,p’ 1870 1830 248 228 34.3 34.0DDMU, p,p’ 55.6 58.6 10.1 8.18DDT, o,p’ 98.9 116DDT, p,p’ 756 731 5.15 4.40 5.16 4.91diazinondieldrin 231 229 8.55 9.10 4.47 2.27endosulfan I 3.71 1.44endosulfan II 10.2 9.5endosulfan sulfateendrin 28.8 27.1ethionHCH, alphaHCH, beta <RL 5.07HCH, deltaHCH, gammaheptachlorheptachlor epoxide 3.39 3.52 1.09 0.905hexachlorobenzenemethoxychlornonachlor,cis 16.8 14.6 18.4 17.8 6.08 5.41nonachlor, trans 29.3 31.8 30.0 29.3 6.73 6.09oxadiazon 7.25 4.64 2.13 2.39oxychlordane 1.43 1.33parathion, ethylparathion, methyltediontoxaphene 1670 1460PCB 1254 247 277 184 161 428 427PCB 1260 15.2 15.4
Percent moisture 86.1 86.3 87.9 88.3 85.8 86.3Percent lipid 0.922 0.987 0.456 0.449 0.522 0.474
TCM = Transplanted California Mussel.

U-19
TABLE U-9
State Mussel Watch ProgramResults of Duplicate Sample Analysis
1997 Synthetic Organic Compounds Quality Control - Mussel Tissue(ng/g dry weight)
Station Name Sandholdt Bridge LA Harbor/ Anaheim Bay/Consolidated Slip Navy Harbor
Station Number 404.0 616.0 707.0Species TCM TCM TCMREPLICATE 1 2 1 2 1 2
CompoundAldrinchlordane, cis 38.2 34.6 23.3 24.8 17.4 17.4chlordane, trans 32.9 25.8 19.2 20.7 17.3 16.4chlordene, alpha 2.24 1.69 1.31 1.96 1.49 NDchlordene, gammachlorpyrifos 9.51 8.93 ND 5.32 9.07 8.28dacthal 23.8 26.2 2.57 2.78DDD, o,p’ 89.8 83.5 20.0 20.9 12.3 12.1DDD, p,p’ 384 368 63.0 68.2 25.7 22.9DDE, o,p’ 38.2 31.1 8.19 16.6 14.9 9.41DDE, p,p’ 2000 1500 272 228 271 240DDMU, p,p’ 43.8 38.0 15.8 16.5 20.9 17.2DDT, o,p’ 214 152 4.16 6.06 5.08 NDDDT, p,p’ 785 728 39.6 41.7 24.9 24.5diazinondieldrin 238 230 7.68 8.16 10.1 10.5endosulfan I 2.77 3.81endosulfan II 10.9 11.7endosulfan sulfateendrin 18.7 18.1ethionHCH, alphaHCH, betaHCH, deltaHCH, gammaheptachlorheptachlor epoxide 1.14 1.38hexachlorobenzenemethoxychlornonachlor,cis 19.0 17.4 10.4 11.3 9.12 7.4nonachlor, trans 38.7 30.2 15.5 18.4 16.1 11.4oxadiazon 25.3 27.0 6.6 3.99oxychlordaneparathion, ethylparathion, methyltediontoxaphene 1970 1940 342 348PCB 1248 54.9 89.8PCB 1254 243 152 372 460PCB 1260 34.4 25.7 26.8 28.3
Percent moisture 88.4 88.4 87.5 87.4 83.6 83.6Percent lipid 0.844 0.853 0.819 0.877 1.39 1.33
TCM = Transplanted California Mussel.

U-20
TABLE U-10
Bay Protection Toxic Cleanup - Group 17bResults of Matrix Spike Analyses in Sediment: Chlorinated Hydrocarbons
Matrix Spike Matrix Spike DuplicateCompound Percent Recovery Percent Recovery
Aldrin 66 64Chlordane, cis 52 51Chlordane, trans 83 82Chlordene, alpha 73 72Chlordene, gamma 70 68Chlorpyrifos 117 115Dacthal 85 83DDD, o,p’ 93 91DDD, p,p’ 79 78DDE, o,p’ 81 80DDE, p,p’ 85 84DDT, o,p’ 85 84DDT, p,p’ 90 88DDMU, p,p’ 87 85Oxadiazon 91 89Dieldrin 94 93Endosulfan I 83 82Endosulfan II 92 90Endosulfan sulfate 95 93Endrin 77 75HCH, alpha 70 61HCH, beta 117 114HCH, gamma 63 62HCH, delta 82 80Heptachlor 43 42Heptachlor epoxide 83 82Hexachlorobenzene 65 64Methoxychlor 89 87Nonachlor, cis 88 86Nonachlor, trans 84 82Oxychlordane 82 80

U-21
TABLE U-11
Bay Protection Toxic Cleanup - Group 17bResults of Matrix Spike Analyses in Sediment: PCB Congeners
Matrix Spike Matrix Spike DuplicatePCB Congener No. Percent Recovery Percent Recovery
8 64 6718 70 7328 75 7544 84 8352 77 7466 88 87
101 81 80105 88 91118 88 87128 89 90138 83 82153 82 88170 99 98180 92 90187 90 98195 96 95206 98 97

U-22
TABLE U-12
Bay Protection Toxic Cleanup - Group 17bResults of Matrix Spike Analyses in Sediment: PAHs
Matrix Spike Matrix Spike DuplicateCompound Percent Recovery Percent Recovery
naphthalene 102 1021-methylnaphthalene 100 992-methylnaphthalene 101 102biphenyl 96 952,6-dimethylnaphthalene 91 91acenaphthylene 98 99acenaphthene 96 972,3,5-trimethylnaphthalene 100 102fluorene 102 100phenanthrene 105 101anthracene 117 1041-methylphenanthrene 129 123fluoranthene 96 75pyrene 95 79benzo[a]anthracene 112 93chrysene 114 93benzo[e]fluroanthene 195 140benzo[k]fluroanthene 24 40benzo[e]pyrene 117 98benzo[a]pyrene 126 102perylene 98 83indeno[123-cd)pyrene 122 78dibenzo[a]anthracene 106 82benzo[g,h,i]perylene 117 88

U-23
TABLE U-13
State Mussel Watch ProgramPolynuclear Aromatic Hydrocarbons (PAHs) Analyzedand Their Detection Limits in Mussel and Sediment
Detection LimitCompound (ng/g, ppb dry weight)
naphthalene 101-methylnaphthalene 102-methylnaphthalene 10biphenyl 102,6-dimethylnaphthalene 10acenaphthylene 10acenaphthene 102,3,5-trimethylnaphthalene 10fluorene 10phenanthrene 10anthracene 101-methylphenanthrene 10fluoranthene 10pyrene 10benz[a]anthracene 10chrysene 10benzo[b]fluoranthene 10benzo[k]fluoranthene 10benzo[e]pyrene 10benzo[a]pyrene 10perylene 10indeno[1,2,3-cd]pyrene 10dibenz[a,h]anthracene 10benzo[ghi]perylene 10

U-24
TABLE U-14
State Mussel Watch ProgramPercent Recovery of Deuterated PAH Surrogate Compounds for 1997
Station Station d8- d10- d10- d10- d12- d12- d12- d12-Number Name NPH BPH ACE PYR BAA BEP PER BGP
1.0 Crescent City Harbor 60 107 93 135 230 134 106 1232.1 Crescent City/Harbor Jetty 72 113 119 119 136 123 103 1093.0 Crrescent City Control 29 45 60 52 69 58 56 40
100.0 Mad River Slough 25 45 60 47 76 65 64 53102.6 Humboldt Bay/J Street 52 65 63 59 66 50 44 33103.3 Humboldt Bay/E Street 26 89 96 93 119 104 99 88103.5 Clark Slough 44 54 62 78 72 66 63 64202.0 Bodega Bay 20 47 61 57 68 62 57 56205.0 Bodega Bay/Spud Point Marina 56 83 102 99 82 77 67 71205.1 Bodega Bay/Port Bodega 34 70 75 65 94 62 64 47205.3 Bodega Bay/Mason’s Marina 10 52 54 51 73 64 58 55205.5 Bodega Bay/Back Marsh 19 59 81 73 101 86 80 61280.0 Russian River/Goat Rock 49 90 136 120 148 142 132 120400.6 Santa Cruz/Natural Bridges 40 82 99 91 118 89 85 65403.0 Elkhorn Slough/Hwy 1 Bridge 55 96 115 101 119 84 84 62414.0 Pacific Grove 66 81 85 104 96 95 69 100404.0 Sandholdt Bridge 67 139 143 141 171 132 124 105404.0 Dup Sandholdt Bridge 55 128 132 135 156 134 125 111650.0 Santa Monica Pier 16 45 61 60 76 65 61 56707.0 Anaheim Bay/Navy Harbor 6 85 115 103 188 130 119 132707.0 Dup Anaheim Bay/Navy Harbor 28 79 93 83 116 92 87 71708.5 Anaheim Bay/Navy Marsh 1 19 50 77 74 100 76 77 63740.0 Dana Point Harbor/Boat Yard 62 78 95 126 108 107 101 102750.0 Oceanside 62 75 85 100 92 92 62 89883.1 San Diego Bay/Chollas Ck 73 74 88 103 91 90 71 67883.2 San Diego Bay/Chollas Ck/Mouth 82 82 88 108 98 81 75 63883.3 San Diego Bay/Chollas Ck/End 71 69 84 110 74 77 53 70883.5 San Diego Bay/Tuna Docks 73 77 89 107 94 88 77 82883.6 San Diego Bay/7th St. Channel 75 78 87 97 86 80 72 73883.8 San Diego Bay/Switzer Ck 63 76 82 93 77 72 54 62885.1 San Diego Bay/Paleta Ck/End 70 80 90 99 54 61 48 51885.3 San Diego Bay/7th St Ch/Mid 66 72 76 105 96 90 79 78888.0 San Diego Bay/Coronado Bridge 38 43 46 64 49 60 34 50894.0 SD Bay/Harbor Is/E.Basin/Storm 61 66 74 96 78 76 58 67
d8-NPH = naphthalene-d8 d12-BAA = benzo[a]anthracene-d12d10-BPH = biphenyl-d10 d12-BEP = benzo[e]pyrene-d12d10-ACE = acenaphthene-d10 d12-PER = perylene-d12d10-PYR = pyrene-d10 d12-BGP = benzo[g,h,i]perylene-d12
DUP = Duplicate analysis.

U-25
TABLE U-15
State Mussel Watch ProgramResults of Matrix Spike Analyses: 1997 Polynuclear Aromatic
Hydrocarbons (PAHs)
Station Name Bodega Head Crescent City/STP Outfall
Station Number 202.0 2.0Species TCM TCM
Percent Recovery Percent RecoveryMS MSD MS MSD
Compoundnaphthalene 100 99 115 1071-methylnaphthalene 96 99 97 972-methylnaphthalene 104 109 105 100biphenyl 100 103 104 1012,6-dimethylnaphthalene 105 105 99 96acenaphthylene 102 99 102 93acenaphthene 97 99 100 1022,3,5-trimethylnaphthalene 100 102 105 102fluorene 118 119 115 107phenanthrene 111 113 115 111anthracene 94 92 62 581-methylphenanthrene 123 123 96 102fluoranthene 124 128 92 110pyrene 116 121 94 105benz[a]anthracene 109 109 98 94chrysene 119 121 124 127benzo[b]fluoranthene 101 103 96 99benzo[k]fluoranthene 104 101 97 99benzo[e]pyrene 115 89 94 97benzo[a]pyrene 86 86 72 66perylene 104 97 87 77indeno[1,2,3-cd]pyrene 101 87 90 87dibenz[a,h]anthracene 82 74 92 88benzo[ghi]perylene 94 85 92 89
TCM = Transplanted California Mussel

U-26
TABLE U-16
State Mussel Watch ProgramResults of Duplicate Sample Analysis: 1997 Polynuclear Aromatic
Hydrocarbons Quality Control(ng/g dry weight)
Station Name Sandholdt Bridge Anaheim Bay/ LA Harbor/Navy Harbor Consolidated
SlipStation Number 404.0 707.0 616.0Species TCM TCM TCMREPLICATE 1 2 1 2 1 2
Compoundnaphthalene 55.3 94.7 <50 <50 <50 <501-methylnaphthalene 10.7 16.1 <10 <10 <10 <102-methylnaphthalene 23.9 33.7 12.7 16.5 56.2 71.7biphenyl <10 <10 <10 <10 <10 <102,6-dimethylnaphthalene 10.7 12.3 10.4 10.3 35.6 44.7acenaphthylene <10 <10 <10 <10 27.5 27.8acenaphthene <10 <10 24.3 23.4 27.5 40.12,3,5-trimethylnaphthalene <10 <10 14.0 12.7 58.2 47.8fluorene 24.0 23.9 36.8 38.7 21.0 20.1phenanthrene 106 107 180 167 77.6 95.6anthracene 10.4 11.6 51.1 51.6 35.6 43.21-methylphenanthrene 24.4 25.3 34.9 29.8 116 78.7fluoranthene 37.4 41.0 117 144 464 703pyrene 38.0 41.7 126 143 608 848benz[a]anthracene 10.1 10.1 29.2 30.5 182 215chrysene 17.0 16.4 43.6 49.3 440 388benzo[b]fluoranthene <10 <10 22.3 17.1 199 236benzo[k]fluoranthene <10 <10 <10 <10 79.7 83.8benzo[e]pyrene <10 <10 16.3 13.9 205 242benzo[a]pyrene <10 <10 <10 <10 <10 <10perylene <10 <10 <10 <10 <10 <10indeno[1,2,3-cd]pyrene <10 <10 <10 <10 48.6 30.3dibenz[a,h]anthracene <10 <10 <10 <10 <10 <10benzo[ghi]perylene <10 <10 <10 <10 39.4 56.3
percent moisture 88.4 88.4 83.6 83.6 90.0 90.0
TCM = Transplanted California Mussel.

U-27
TABLE U-17
Bay Protection Toxic Cleanup ProgramDistribution of Synthetic Organic Compounds Among
Two Fractions of a Silica/Alumina Column
Fraction 1 Fraction 2 Fraction 1 & 2
Aldrin Chlordane, cis DDE, p,p’Chlordene, alpha Chlordane, trans DDT, p,p’Chlordene, gamma Chlorpyrifos DDMU, p,p’DDE, o,p’ Dacthal Nonachlor, transDDT, o,p’ DDD, o,p’Heptachlor DDD, p,p’Hexachlorobenzene DCBP, p,p’Mirex MethoxychlorDieldrinEndosulfan IEndosulfan IIEndosulfan sulfateEndrinHCH, alphaHCH, betaHCH, gammaHCH, deltaHeptachlor epoxideNonachlor, cisOxychlordane

U-28
TABLE U-18
Bay Protection Toxic Cleanup ProgramSynthetic Organic Compounds Analyzed and Their Detection Limits
Detection Limit Detection Limit(ng/g, ppb dry weight) (ng/g, ppb dry weight)
Compound Sediment Tissue
Aldrin 0.5 1.0Chlordene, alpha 0.5 1.0Chlordene, gamma 0.5 1.0DDE, o,p’ 1.0 3.0DDT, o,p’ 1.0 4.0Heptachlor 0.5 1.0Hexachlorobenzene 0.2 1.0Mirex 0.5 1.0DDE, p,p’ 1.0 1.0DDT, p,p’ 1.0 4.0DDMU, p,p’ 2.0 5.0Nonachlor, trans 0.5 1.0Chlordane, cis 0.5 1.0Chlordane, trans 0.5 1.0Chlorpyrifos 1.0 4.0Dacthal 0.2 2.0DDD, o,p’ 1.0 5.0DDD, p,p’ 0.4 3.0DCBP, p,p’ 3.0 25Methoxychlor 1.5 15Dieldrin 0.5 1.0Endosulfan I 0.5 1.0Endosulfan II 1.0 3.0Endosulfan sulfate 2.0 5.0Endrin 2.0 6.0HCH, alpha 0.2 1.0HCH, beta 1.0 3.0HCH, gamma 0.2 0.8HCH, delta 0.5 2.0Heptachlor epoxide 0.5 1.0Nonachlor, cis 0.5 1.0Oxychlordane 0.5 1.0

U-29
TABLE U-19
Bay Protection Toxic Cleanup ProgramPolynuclear Aromatic Hydrocarbons (PAHs)
Analyzed and Their Detection Limits
Tissue Sedimentdry weight dry weight
Compound (ng/g, ppb) (ng/g, ppb)
naphthalene 10 51-methylnaphthalene 10 52-methylnaphthalene 10 5biphenyl 10 52,6-dimethylnaphthalene 10 5acenaphthylene 10 5acenaphthene 10 52,3,5-trimethylnaphthalene 10 5fluorene 10 5phenanthrene 10 5anthracene 10 51-methylphenanthrene 10 5fluoranthene 10 5pyrene 10 5benz[a]anthracene 10 5chrysene 10 5benzo[b]fluoranthene 10 5benzo[k]fluoranthene 10 5benzo[e]pyrene 10 5benzo[a]pyrene 10 5perylene 10 5indeno[1,2,3-cd]pyrene 15 5dibenz[a,h]anthracene 15 5benzo[ghi]perylene 15 5

U-30
TABLE U-20
Bay Protection Toxic Cleanup - Group 14Results of Matrix Spike Analyses: Polynuclear Aromatic Hydrocarbons
(PAHs)
Compound Percent Recovery Percent RecoveryTCM TCM
naphthalene 94 991-methylnaphthalene 101 1052-methylnaphthalene 104 108biphenyl 107 1102,6-dimethylnaphthalene 107 110acenaphthylene 97 103acenaphthene 98 1032,3,5-trimethylnaphthalene 102 107fluorene 104 109phenanthrene 106 110anthracene 109 1151-methylphenanthrene 114 118fluoranthene 102 106pyrene 91 95benz[a]anthracene 95 98chrysene 84 90benzo[b]fluoranthene 101 106benzo[k]fluoranthene 94 99benzo[e]pyrene 97 99benzo[a]pyrene 97 104perylene 99.5 100indeno[1,2,3-cd]pyrene 101 107dibenz[a,h]anthracene 99 107benzo[ghi]perylene 94 99
TCM = Transplanted California Mussel

U-31
TABLE U-21
Bay Protection Toxic Cleanup Group 17AResults of Matrix Spike Analyses: Chlorinated Hydrocarbons
Compound Percent RecoveryTCM
Aldrin 108Chlordane, cis 76Chlordane, trans 85Chlordene, alpha 97Chlordene, gamma 94Chlorpyrifos 89Dacthal 80DDE, o,p’ 97DDE, p,p’ 106DDD, o,p’ 76DDD, p,p’ 114DDT, o,p’ 94DDT, p,p’ 85DDMU, p,p’ 109Diclorobenzophenone 103Dieldrin 74Endrin 82Endosulfan I 79Endosulfan II 76Endosulfan sulfate 84Hexachlorobenzene 100HCH, alpha 97HCH, beta 90HCH, gamma 84HCH, delta 94Heptachlor 106Heptachlor epoxide 83Nonachlor, cis 85Nonachlor, trans 89Methoxychlor 77Mirex 101Oxadiazon 76Oxychlordane 73
TCM = Transplanted California Mussel

U-32
TABLE U-22
Bay Protection Toxic Cleanup - Group 17AResults of Matrix Spike Analyses: Polychlorinated Biphenyls (PCBs)
PCB Congener No. Percent RecoveryTCM
5 1068 112
15 NR18 10827 9328 11629 10931 11144 10449 10552 11266 11470 10874 8187 9295 10497 8399 102
101 108105 108110 105118 114128 105132 101137 86138 108149 105151 108153 108156 95157 102158 93170 113174 103177 112180 109183 105187 106189 109194 107195 109201 118203 108206 104209 98
PCT 5460 96TCM = Transplanted California Mussel

U-33
TABLE U-23
Bay Protection Toxic Cleanup - Group 17AResults of Matrix Spike Analyses: Polynuclear Aromatic Hydrocarbons
(PAHs)
Compound Percent RecoveryTCM
naphthalene 991-methylnaphthalene 952-methylnaphthalene 94biphenyl 952,6-dimethylnaphthalene 100acenaphthylene 98acenaphthene 1002,3,5-trimethylnaphthalene 97fluorene 98phenanthrene 98anthracene 891-methylphenanthrene 100fluoranthene 90pyrene 90benz[a]anthracene 73chrysene 80benzo[b]fluoranthene 77benzo[k]fluoranthene 89benzo[e]pyrene 91benzo[a]pyrene 76perylene 83indeno[1,2,3-cd]pyrene 92dibenz[a,h]anthracene 84benzo[ghi]perylene 90
TCM = Transplanted California Mussel
V-1
APPENDIX V
Median International Standards

V-2
Median International Standards
In 1982, the Food and Agricultural Organization (FAO) of the United Nationsconducted a survey of standards and legal limits for metals includingmercury, pesticides, and other contaminants in fishery products. This was inresponse to frequent inquiries from institutions and companies active ininternational commerce that found it difficult finding such information.
The FAO surveyed nations that were members of the FAO as well as those whowere not. Most nations cooperated with the survey and, in certain othercases, the standards were drawn from other sources. The FAO took all of theresponses and presented them in a report entitled "Compilation of LegalLimits for Hazardous Substances in Fish and Fishery Products" (Nauen 1983).Most of the limits were presented in a standard format and in standard unitsof fresh or live weight. Exceptions are clearly noted.
Nearly all of the standards for pesticides were from the United States(FDA standards). However, with the exception of mercury, the United Stateshas no standards for trace metals in fishery products. It is this very lackof standards that makes interpretation of some of the SMWP findingsdifficult.
Table V-1 summarizes the standards and guidelines for metals from the FAOreport. The table notes whether the standards are for freshwater fish,marine fish, shellfish, or a combination of these. When more than onestandard was listed by the FAO report, those values closest to a standard forfresh weight, edible portion were chosen. Exceptions are clearly noted inthe table. Standards for each element are arranged in ascending order. Thecountry of origin and the approximate date of adoption are also noted.
As can be seen in Table V-1, some of the standards are not truly for edibleportion, fresh weight. For example, some standards refer to canned productsor protein. In the case of India, the standards are on a dry weight basis.If the Indian standards were stated in fresh weight terms, they would beapproximately one fifth or one sixth of the stated standard.
Table V-1 has many striking features. One feature is that most of thestandards are surprisingly similar. Another feature is the large number ofcountries that have standards for metals. Also, although many of thesecountries are less developed nations, the standards adopted by these nationsdo not differ from those of the more developed nations.
The standards were not summarized for mercury because there is a USFDAstandard of 1.0 ppm for methyl mercury in the edible portions of fish andshellfish. This was, incidentally, the highest limit set by any nation in theFAO study. The great majority of nations have set a mercury standard of0.5 ppm.
Median International Standards presented in Table 4 were calculated from thestandards listed in Table V-1. The median standard was chosen for use forseveral reasons. The median is less influenced than the mean by outliers inthe data. Also, direct comparisons of standards for fresh versus cannedversus dry can be misleading. By using median standards, these misleadingcomparisons can be more easily avoided. In most cases, the MedianInternational Standard is actually a standard set by one or more nationsrather than an average value not actually set by any country. The median wascalculated as follows. All standards or guidelines (with the exception of

V-3
the Indian standards which are based on dry weight) were considered to bemore-or-less equivalent. For the purposes of calculating the median, theIndian standards were divided by five. The median was calculated as themiddle value of all of the standards (e.g., the fourth of seven valuesarranged in ascending order). In a few cases, the number of standards waseven. In this event, the two mid-values were averaged (most were notdifferent). None of the adjusted dry-weight standards from India ended up asa median or as part of a mid-value pair.
For obvious reasons, the Median International Standards can only be used toprovide a general idea of what other nations have chosen to use as astandard. The range of all values is listed in Table 4 as a reminder ofthis. However, with the lack of American standards, Median InternationalStandards can provide a guidepost for those responsible for interpretingtrace metal findings in fish and shellfish tissue.

V-4
TABLE V-1
International Standards for Trace Elements in Fish and Molluscs
ApproximateFreshwater Marine Molluscs/ Date of
Element Standard Fish Fish Shellfish Country Adoption
Antimony 1.0 ppm x x x Hong Kong 19831.0 ppm x x x New Zealand 19711.5 ppm x x x Australia 1982
Arsenic 0.1 ppm x x x Venezuela -1.0 ppm x x x Chile -1.0 ppm d d x India -1.0 ppm x x x New Zealand 19711.0 ppm e e e United Kingdom 19591.4 ppm x Hong Kong 19831.5 ppm x x x Australia 19821.5 ppm c c c Thailand 19823.5 ppm p p Canada 19765.0 ppm x x x Finland 19805.0 ppm x x x Zambia 1976
Cadmium 0.05 ppm x x Netherlands -0.1 ppm c c c Switzerland 19820.1 ppm r x Venezuela -0.2 ppm x x Australia 19820.3 ppm r r Finland -0.5 ppm x W. Germany 19791.0 ppm x Netherlands -1.0 ppm x x New Zealand 19712.0 ppm x Australia 19822.0 ppm x x x Hong Kong 1983
Chromium 1.0 ppm x x x Hong Kong 1983
Copper 10.0 ppm x x x Chile -10.0 ppm d d India -10.0 ppm x x Venezuela -20.0 ppm c c c Thailand 198220.0 ppm g g g United Kingdom 195630.0 ppm x x x Australia 198230.0 ppm x x x New Zealand 1971100.0 ppm x x Zambia 1976
Fluoride 150.0 ppm p p Canada 1979
Fluorine 10.0 ppm x x New Zealand 197125.0 ppm x x Zambia 1976
p - in protein g - recommended guidelinee - except where natural levels are higher d - dry weight basisc - in metal containers r - revised limit (proposed)

V-5
TABLE V-1 (continued)
International Standards for Trace Elements in Fish and Molluscs
ApproximateFreshwater Marine Molluscs/ Date of
Element Standard Fish Fish Shellfish Country Adoption
Lead 0.5 ppm p p Canada 19790.5 ppm x W. Germany 19790.5 ppm x x Netherlands -1.0 ppm x x x Sweden 19791.0 ppm c c c Switzerland 19821.0 ppm c c c Thailand 19822.0 ppm x x Australia 19822.0 ppm x x x Chile 19822.0 ppm x Finland 19802.0 ppm x Italy 19782.0 ppm x Netherlands -2.0 ppm x x New Zealand -2.0 ppm l l Sweden 19792.0 ppm x x United Kingdom 19802.0 ppm x x Venezuela -2.5 ppm x Australia 19825.0 ppm d d India -6.0 ppm x x x Hong Kong 198310.0 ppm x x Zambia 1976
Mercury International Standards for Mercury range from 0.1 ppm to 1.0 ppm. Twenty-eight countries have established standards for Mercury. The U. S. Food andDrug Administration has set an action level of 1.0 ppm in the edible portionof fish and molluscs. The median international standard is 0.5 ppm.
Selenium 0.3 ppm x x x Chile 19822.0 ppm x x Australia 19822.0 ppm x x New Zealand 1971
Tin 50.0 ppm x x Australia 1982100.0 ppm x x Venezuela -150.0 ppm c c c Finland 1979150.0 ppm x x New Zealand 1977230.0 ppm x x x Hong Kong 1983250.0 ppm d d India -250.0 ppm x x Thailand 1982250.0 ppm g,c g,c g,c United Kingdom 1973
Zinc 40.0 ppm x x x Australia 198240.0 ppm x x New Zealand 197150.0 ppm d d India -50.0 ppm g g United Kingdom 1953100.0 ppm x x x Chile 1982100.0 ppm x x Zambia 1976
p - in protein g - recommended guidelinee - except where natural levels are higher d - dry weight basis c - in metal containers r - revised limit (proposed)l - in liver

W-1
APPENDIX W
Elevated Data Levels

W-2
Elevated Data Levels (EDL)
An EDL is defined for the purposes of the SMWP as that concentration of atoxic substance in mussels or clams that equals or exceeds a specifiedpercentile (such as 85 percent) of all SMWP measurements of the toxicsubstance in the same species and exposure condition (resident or transplant)between 1977 and 1997. EDLs were determined as follows:
(1) All SMWP data from 1977 through 1997 were pooled by species andexposure, (2) The concentrations of each toxicant were ranked from highestto lowest concentration down to, and including, instances when a chemical wasnot detected, (3) The cumulative frequency of occurrence and percentileranking for all concentrations were calculated, (4) The concentration of thetoxic substance representing the 85th percentile was identified anddesignated the 85 percent EDL or EDL 85, and (5) The concentration of thetoxic substance representing the 95th percentile was identified anddesignated the 95 percent EDL or EDL 95. The EDL 85 is that concentration ofa toxic substance that equals or exceeds 85 percent of all SMWP measurementsof the toxic substance in the same species and exposure between 1977 and1997. The EDL 95 is that concentration of a toxic substance that equals orexceeds 95 percent of all SMWP measurements of the toxic substance in thesame species and exposure between 1977 and 1997. EDLs for trace elements aresummarized in Tables 5 and 7. EDLs for synthetic organic substances aresummarized in Tables 8 through 12.
Because EDLs are based on the relative ranking of each measurement, ratherthan a percentage of the highest concentration obtained, they are notinfluenced by unusually high (anomalous) toxicant values. Thischaracteristic of EDLs is especially desirable in the evaluation of syntheticorganic toxicants where the highest concentration may be as much as ten timesthe next highest concentration. EDLs do, however, reflect the biases of thedata upon which they have been based.
Because they are based on SMWP data rather than an absolute number externalto the SMWP, EDLs, when exceeded, can provide a sensitive first indication ofelevated toxicant levels in California waters. As such, EDLs fulfill themonitoring function of the SMWP effectively. In addition, EDLs may beexpressed in dry weight to eliminate data variability due to moisture contentand to conform to scientific literature relevant to mussel or clam monitoringprograms worldwide. However, EDLs do not assess adverse impacts, nor do theynecessarily represent concentrations that may be damaging to the mussels,clams, or to a human consuming these species. They do not directly relate toMaximum Tissue Residue levels (MTRLs), FDA action levels, NAS guidelines, orMedian International Standards (MIS).

NORTH COAST REGION (1)5550 Skylane Blvd., Ste. ASanta Rosa, CA 95403(707) 576-2220
SAN FRANCISCO BAY REGION (2)1515 Clay Street, Ste. 1400Oakland, CA 94612(510) 622-2300
CENTRAL COAST REGION (3)81 Higuera Street, Ste. 200San Luis Obispo, CA 93401-5427(805) 549-3147
LOS ANGELES REGION (4)320 W. 4th Street, Ste. 200Los Angeles, CA 90013(213) 576-6600
CENTRAL VALLEY REGION (5)3443 Routier Road, Suite ASacramento, CA 95827-3098(916) 255-3000
FRESNO BRANCH OFFICE3614 East Ashlan AvenueFresno, CA 93726(559) 445-5116
REDDING BRANCH OFFICE415 Knollcrest Drive, Suite 100Redding, CA 96002(530) 224-4845
LAHONTAN REGION (6)2501 Lake Tahoe Blvd.South Lake Tahoe, CA 96150(530) 542-5400
VICTORVILLE BRANCH OFFICE15428 Civic Drive, Ste. 100Victorville, CA 92392-2383(760) 241-6583
COLORADO RIVER BASIN REGION (7)73-720 Fred Waring Dr., Ste. 100Palm Desert, CA 92260(760) 346-7491
SANTA ANA REGION (8)California Tower3737 Main Street, Ste. 500Riverside, CA 92501-3339(909) 782-4130
SAN DIEGO REGION (9)9771 Clairemont Mesa Blvd., Ste. ASan Diego, CA 92124(619) 467-2952
STATE OF CALIFORNIAGray Davis, Governor
CALIFORNIA ENVIRONMENTALPROTECTION AGENCYWinston H. Hickox, Secretary
STATE WATER RESOURCESCONTROL BOARDArthur G. Baggett, Jr., Vice Chair
STATE WATER RESOURCES CONTROL BOARDP.O. BOX 100, Sacramento, CA 95812-0100
www.swrcb.ca.gov
Office of Legislative and Public Affairs: (916) 341-5250Water Quality Information: (916) 341-5455
Clean Water Programs Information: (916) 341-5700Water Rights Information: (916) 341-5300
CALIFORNIA REGIONAL WATER QUALITY CONTROL BOARDS
11/00
SISKIYOU
MODOC
DELNORTE
HUMBOLDT
TRINITY SHASTA
LASSEN
PLUMAS
TEHAMA
SIERRA
NEVADA
PLACER
EL DORADO
AMADOR
CALAVERAS
ALPINE
BUTTEGLENNMENDOCINO
LAKE
NAPA
COLUSA
YUBAS
UTTE
R
SACRAMENTO
YOLOSONOMA
ALAMEDA
MAR
IN
SANJOAQUIN
TUOLUMNE
MARIPOSA
MONO
STANISLAUSSA
N M
ATEO
SANFRANCISCO
SANTACLARA
SANTA CRUZ
MERCED
FRESNO
INYO
TULARE
KINGS
MONTEREY
SAN LUISOBISPO
SANTABARBARA
KERN
VENTURA
LOSANGELES
SANBERNARDINO
ORANGE
SANBENITO
RIVERSIDE
IMPERIAL
SAN DIEGO
MADERA
SOLANO
CONTRA
COSTA
