california community colleges chancellor's...
TRANSCRIPT

California Community Colleges Chancellor's Office
Report on Staffing for Fall 2010 Statewide Detail
Table of Contents Page
Employee Category Headcount Distribution by District 1
Employee Category Headcount Distribution by District/Primary Location 4
Employee Category Full-t ime Equivalency (FTE) Distribution by District/College 11
EEO6 Occupational Activity Headcount Distribution by District/Primary Location 17
Employee Category Ethnicity/Gender Headcount Distribution by District 23
Employee Category Age Headcount Distribution b y District 35
Employee Category Employee Status Distribution by District 53
Employee Category Salary Distribution by District 65
Employee Category Hourly Rate Distribution by District 76
Statewide Full-t ime Equivalency (FTE) Summary by Taxonomy of Programs (TOP) Code 82
Statewide Full-t ime Equivalency (FTE) Summary by Administrative and Support Activit ies (ASA) Code 102
Appendix Employee Category Specif ications 106

California Community Colleges Chancellor's OfficeReport on Staffing for Fall 2010
Employee Category Headcount Distribution by District
Educational Administrator
Tenured / Tenure Track
Academic Temporary
Classified Administrator
Classified Professional
Classified Support
District Total
Allan Hancock 27 152 451 4 25 187 846
Antelope Valley 27 183 413 36 194 853
Barstow 10 39 110 10 51 220
Butte 21 175 552 26 23 270 1,067
Cabrillo 15 208 383 19 260 885
Cerritos 24 277 465 26 6 316 1,114
Chabot-Las Positas 22 284 591 38 1 356 1,292
Chaffey 17 202 625 17 21 251 1,133
Citrus 30 168 261 6 33 291 789
Coast 50 432 1,066 83 3 763 2,397
Compton 14 84 221 7 14 107 447
Contra Costa 55 444 944 50 64 366 1,923
Copper Mountain 11 31 99 5 47 193
Desert 18 107 359 8 11 199 702
El Camino 25 330 512 32 57 351 1,307
Feather River 5 25 63 16 2 45 156
Foothill-Deanza 46 507 822 33 164 450 2,022
Gavilan 19 79 208 6 13 113 438
Glendale 31 233 530 32 13 308 1,147
Grossmont-Cuyamaca 33 306 914 10 33 393 1,689
Hartnell 7 86 223 19 10 120 465
Imperial 15 140 210 1 19 142 527
Kern 29 373 490 53 57 399 1,401
Lake Tahoe 6 40 122 2 4 53 227
Lassen 6 40 97 9 7 53 212
Note: Headcount is unduplicated by district. The employee category specification is documented in Appendix Employee Category Specification.
Data Element Definitions: California Community Colleges Management Information System Data Element Dictionary
All Districts Reporting
Data Source: CCCCO MIS Database for the reporting period Fall Term 2010 Page 1 of 104
June 30, 2011

California Community Colleges Chancellor's OfficeReport on Staffing for Fall 2010
Employee Category Headcount Distribution by District
Educational Administrator
Tenured / Tenure Track
Academic Temporary
Classified Administrator
Classified Professional
Classified Support
District Total
Long Beach 33 316 614 20 27 500 1,510
Los Angeles 114 1,257 3,230 40 219 1,828 6,688
Los Rios 80 1,019 1,478 40 78 1,052 3,747
Marin 23 88 251 2 16 192 572
Mendocino-Lake 8 50 262 12 84 416
Merced 16 172 351 26 2 253 820
Mira Costa 15 166 472 14 18 239 924
Monterey 10 116 272 12 17 184 611
Mt. San Antonio 38 386 825 35 4 555 1,843
Mt. San Jacinto 14 150 561 10 82 226 1,043
Napa Valley 16 94 279 13 5 156 563
North Orange 49 534 1,136 49 1 631 2,400
Ohlone 15 122 326 27 19 160 669
Palo Verde 7 40 81 3 78 209
Palomar 22 273 848 17 37 397 1,594
Pasadena 36 386 673 9 367 1,471
Peralta 60 307 749 87 322 1,525
Rancho Santiago 50 310 995 7 37 610 2,009
Redwoods 22 93 252 33 56 127 583
Rio Hondo 23 186 356 9 3 253 830
Riverside 55 367 1,000 40 44 556 2,062
San Bernardino 34 222 514 35 48 342 1,195
San Diego 95 682 2,089 73 983 3,922
San Francisco 43 793 1,034 2 80 749 2,701
San Joaquin Delta 12 214 285 38 16 455 1,020
San Jose-Evergreen 22 216 481 23 21 329 1,092
Note: Headcount is unduplicated by district. The employee category specification is documented in Appendix Employee Category Specification.
Data Element Definitions: California Community Colleges Management Information System Data Element Dictionary
All Districts Reporting
Data Source: CCCCO MIS Database for the reporting period Fall Term 2010 Page 2 of 104
June 30, 2011

California Community Colleges Chancellor's OfficeReport on Staffing for Fall 2010
Employee Category Headcount Distribution by District
Educational Administrator
Tenured / Tenure Track
Academic Temporary
Classified Administrator
Classified Professional
Classified Support
District Total
San Luis Obispo 14 156 397 11 18 230 826
San Mateo 31 307 643 16 70 384 1,451
Santa Barbara 1 213 407 53 102 289 1,065
Santa Clarita 29 184 437 58 7 224 939
Santa Monica 44 307 980 53 461 1,845
Sequoias 37 157 334 3 8 201 740
Shasta-Tehama-Trinity 27 123 293 15 210 668
Sierra 19 215 680 24 234 1,172
Siskiyous 5 49 156 1 24 80 315
Solano 11 155 314 11 7 157 655
Sonoma 36 291 1,029 7 61 398 1,822
South Orange 31 350 891 50 15 532 1,869
Southwestern 23 224 685 34 372 1,338
State Center 53 492 1,045 30 29 618 2,267
Ventura 27 380 818 7 24 477 1,733
Victor Valley 13 130 451 1 23 185 803
West Hills 63 59 70 1 72 254 519
West Kern 6 50 61 9 14 142 282
West Valley-Mission 19 304 478 15 40 282 1,138
Yosemite 32 284 474 50 25 646 1,511
Yuba 24 134 257 17 13 175 620
STATEWIDE TOTAL 2,020 18,068 41,045 1,486 2,166 24,264 89,049
Note: Headcount is unduplicated by district. The employee category specification is documented in Appendix Employee Category Specification.
Data Element Definitions: California Community Colleges Management Information System Data Element Dictionary
All Districts Reporting
Data Source: CCCCO MIS Database for the reporting period Fall Term 2010 Page 3 of 104
June 30, 2011

California Community Colleges Chancellor's OfficeReport on Staffing for Fall 2010
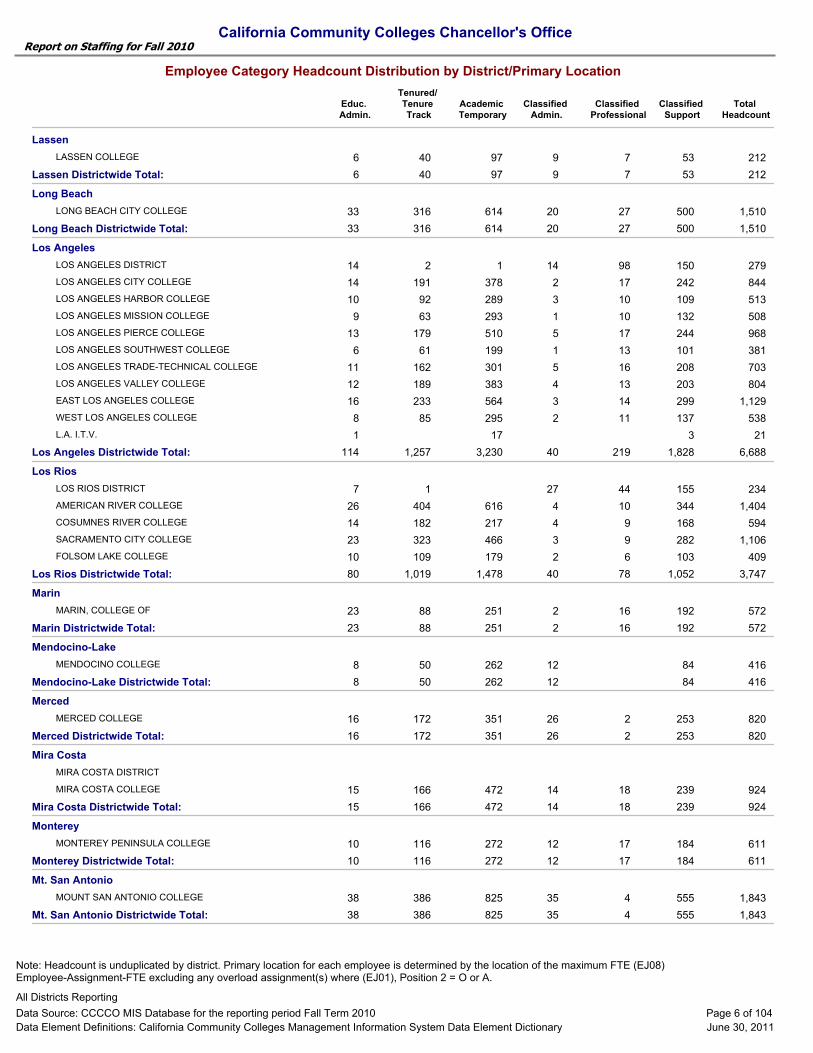
Employee Category Headcount Distribution by District/Primary Location
Educ. Admin.
Total Headcount
Classified Support
Classified Professional
Classified Admin.
Academic Temporary
Tenured/ Tenure Track
Allan Hancock
25 4 152ALLAN HANCOCK COLLEGE 451 846 187 27
846 187 25 4 451 152 27Allan Hancock Districtwide Total:
Antelope Valley
36 183ANTELOPE VALLEY COLLEGE 413 853 194 27
853 194 36 413 183 27Antelope Valley Districtwide Total:
Barstow
10 7BARSTOW DISTRICT 72 45 10
32BARSTOW COLLEGE 110 148 6
220 51 10 110 39 10Barstow Districtwide Total:
Butte
23 26 175BUTTE COLLEGE 552 1,067 270 21
1,067 270 23 26 552 175 21Butte Districtwide Total:
Cabrillo
19 208CABRILLO COLLEGE 383 885 260 15
885 260 19 383 208 15Cabrillo Districtwide Total:
Cerritos
6 26 277CERRITOS COLLEGE 465 1,114 316 24
1,114 316 6 26 465 277 24Cerritos Districtwide Total:
Chabot-Las Positas
23CHABOT-LAS POSITAS DISTRICT 139 114 2
5 99LAS POSITAS COLLEGE 265 470 93 8
1 10 185CHABOT COLLEGE 326 683 149 12
1,292 356 1 38 591 284 22Chabot-Las Positas Districtwide Total:
Chaffey
21 17 202CHAFFEY COLLEGE 625 1,133 251 17
1,133 251 21 17 625 202 17Chaffey Districtwide Total:
Citrus
33 6 168CITRUS COLLEGE 261 789 291 30
789 291 33 6 261 168 30Citrus Districtwide Total:
Coast
1 17COAST DISTRICT 109 86 5
1 21 42COASTLINE COMMUNITY COLLEGE 258 513 180 11
19 130GOLDEN WEST COLLEGE 316 666 186 15
1 26 260ORANGE COAST COLLEGE 492 1,109 311 19
2,397 763 3 83 1,066 432 50Coast Districtwide Total:
Compton
14 7 84COMPTON COMMUNITY COLLEGE 221 447 107 14
447 107 14 7 221 84 14Compton Districtwide Total:
Contra Costa
17 22CONTRA COSTA DISTRICT 73 31 3
8 7 92CONTRA COSTA COLLEGE 196 389 74 12
28 10 242DIABLO VALLEY COLLEGE 511 993 174 28
11 11 110LOS MEDANOS COLLEGE 237 468 87 12
1,923 366 64 50 944 444 55Contra Costa Districtwide Total:
Note: Headcount is unduplicated by district. Primary location for each employee is determined by the location of the maximum FTE (EJ08) Employee-Assignment-FTE excluding any overload assignment(s) where (EJ01), Position 2 = O or A.
Data Element Definitions: California Community Colleges Management Information System Data Element Dictionary
All Districts Reporting
Data Source: CCCCO MIS Database for the reporting period Fall Term 2010 Page 4 of 104
June 30, 2011

California Community Colleges Chancellor's OfficeReport on Staffing for Fall 2010
Employee Category Headcount Distribution by District/Primary Location
Educ. Admin.
Total Headcount
Classified Support
Classified Professional
Classified Admin.
Academic Temporary
Tenured/ Tenure Track
Copper Mountain
COPPER MOUNTAIN DISTRICT OFFICE
5 31COPPER MOUNTAIN COLLEGE 99 193 47 11
193 47 5 99 31 11Copper Mountain Districtwide Total:
Desert
11 8 107DESERT, COLLEGE OF THE 359 702 199 18
702 199 11 8 359 107 18Desert Districtwide Total:
El Camino
57 32 330EL CAMINO COLLEGE 512 1,307 351 25
1,307 351 57 32 512 330 25El Camino Districtwide Total:
Feather River
2 16 25FEATHER RIVER COLLEGE 63 156 45 5
156 45 2 16 63 25 5Feather River Districtwide Total:
Foothill-Deanza
72 18FOOTHILL DISTRICT 212 114 8
56 10 304DE ANZA COLLEGE 450 1,066 229 17
36 5 203FOOTHILL COLLEGE 372 744 107 21
2,022 450 164 33 822 507 46Foothill-Deanza Districtwide Total:
Gavilan
13 6 79GAVILAN COLLEGE 208 438 113 19
438 113 13 6 208 79 19Gavilan Districtwide Total:
Glendale
13 32 233GLENDALE COLLEGE 530 1,147 308 31
1,147 308 13 32 530 233 31Glendale Districtwide Total:
Grossmont-Cuyamaca
20 6GROSSMONT DISTRICT 93 63 4
3 2 82CUYAMACA COLLEGE 343 564 122 12
10 2 224GROSSMONT COLLEGE 571 1,032 208 17
1,689 393 33 10 914 306 33Grossmont-Cuyamaca Districtwide Total:
Hartnell
10 19 86HARTNELL COLLEGE 223 465 120 7
465 120 10 19 223 86 7Hartnell Districtwide Total:
Imperial
19 1 140IMPERIAL VALLEY COLLEGE 210 527 142 15
527 142 19 1 210 140 15Imperial Districtwide Total:
Kern
12 25KERN DISTRICT 75 35 3
31 15 250BAKERSFIELD COLLEGE 287 816 219 14
9 8 55CERRO COSO COMMUNITY COLLEGE 125 284 81 6
5 5 68PORTERVILLE COLLEGE 78 226 64 6
1,401 399 57 53 490 373 29Kern Districtwide Total:
Lake Tahoe
4 2 40LAKE TAHOE COMMUNITY COLLEGE 122 227 53 6
227 53 4 2 122 40 6Lake Tahoe Districtwide Total:
Note: Headcount is unduplicated by district. Primary location for each employee is determined by the location of the maximum FTE (EJ08) Employee-Assignment-FTE excluding any overload assignment(s) where (EJ01), Position 2 = O or A.
Data Element Definitions: California Community Colleges Management Information System Data Element Dictionary
All Districts Reporting
Data Source: CCCCO MIS Database for the reporting period Fall Term 2010 Page 5 of 104
June 30, 2011
California Community Colleges Chancellor's OfficeReport on Staffing for Fall 2010
Employee Category Headcount Distribution by District/Primary Location
Educ. Admin.
Total Headcount
Classified Support
Classified Professional
Classified Admin.
Academic Temporary
Tenured/ Tenure Track
Lassen
7 9 40LASSEN COLLEGE 97 212 53 6
212 53 7 9 97 40 6Lassen Districtwide Total:
Long Beach
27 20 316LONG BEACH CITY COLLEGE 614 1,510 500 33
1,510 500 27 20 614 316 33Long Beach Districtwide Total:
Los Angeles
98 14 2LOS ANGELES DISTRICT 1 279 150 14
17 2 191LOS ANGELES CITY COLLEGE 378 844 242 14
10 3 92LOS ANGELES HARBOR COLLEGE 289 513 109 10
10 1 63LOS ANGELES MISSION COLLEGE 293 508 132 9
17 5 179LOS ANGELES PIERCE COLLEGE 510 968 244 13
13 1 61LOS ANGELES SOUTHWEST COLLEGE 199 381 101 6
16 5 162LOS ANGELES TRADE-TECHNICAL COLLEGE 301 703 208 11
13 4 189LOS ANGELES VALLEY COLLEGE 383 804 203 12
14 3 233EAST LOS ANGELES COLLEGE 564 1,129 299 16
11 2 85WEST LOS ANGELES COLLEGE 295 538 137 8
L.A. I.T.V. 17 21 3 1
6,688 1,828 219 40 3,230 1,257 114Los Angeles Districtwide Total:
Los Rios
44 27 1LOS RIOS DISTRICT 234 155 7
10 4 404AMERICAN RIVER COLLEGE 616 1,404 344 26
9 4 182COSUMNES RIVER COLLEGE 217 594 168 14
9 3 323SACRAMENTO CITY COLLEGE 466 1,106 282 23
6 2 109FOLSOM LAKE COLLEGE 179 409 103 10
3,747 1,052 78 40 1,478 1,019 80Los Rios Districtwide Total:
Marin
16 2 88MARIN, COLLEGE OF 251 572 192 23
572 192 16 2 251 88 23Marin Districtwide Total:
Mendocino-Lake
12 50MENDOCINO COLLEGE 262 416 84 8
416 84 12 262 50 8Mendocino-Lake Districtwide Total:
Merced
2 26 172MERCED COLLEGE 351 820 253 16
820 253 2 26 351 172 16Merced Districtwide Total:
Mira Costa
MIRA COSTA DISTRICT
18 14 166MIRA COSTA COLLEGE 472 924 239 15
924 239 18 14 472 166 15Mira Costa Districtwide Total:
Monterey
17 12 116MONTEREY PENINSULA COLLEGE 272 611 184 10
611 184 17 12 272 116 10Monterey Districtwide Total:
Mt. San Antonio
4 35 386MOUNT SAN ANTONIO COLLEGE 825 1,843 555 38
1,843 555 4 35 825 386 38Mt. San Antonio Districtwide Total:
Note: Headcount is unduplicated by district. Primary location for each employee is determined by the location of the maximum FTE (EJ08) Employee-Assignment-FTE excluding any overload assignment(s) where (EJ01), Position 2 = O or A.
Data Element Definitions: California Community Colleges Management Information System Data Element Dictionary
All Districts Reporting
Data Source: CCCCO MIS Database for the reporting period Fall Term 2010 Page 6 of 104
June 30, 2011

California Community Colleges Chancellor's OfficeReport on Staffing for Fall 2010
Employee Category Headcount Distribution by District/Primary Location
Educ. Admin.
Total Headcount
Classified Support
Classified Professional
Classified Admin.
Academic Temporary
Tenured/ Tenure Track
Mt. San Jacinto
82 10 150MOUNT SAN JACINTO COLLEGE 561 1,043 226 14
1,043 226 82 10 561 150 14Mt. San Jacinto Districtwide Total:
Napa Valley
NAPA VALLEY COLLEGE DISTRICT
5 13 94NAPA VALLEY COLLEGE 279 563 156 16
563 156 5 13 279 94 16Napa Valley Districtwide Total:
North Orange
1 17NORTH ORANGE DISTRICT 96 75 3
12 207CYPRESS COLLEGE 382 830 212 17
13 304FULLERTON COLLEGE 464 1,068 268 19
7 23NORTH ORANGE ADULT DIVISION 290 406 76 10
2,400 631 1 49 1,136 534 49North Orange Districtwide Total:
Ohlone
19 27 122OHLONE COLLEGE 326 669 160 15
669 160 19 27 326 122 15Ohlone Districtwide Total:
Palo Verde
3 40PALO VERDE COLLEGE 81 209 78 7
209 78 3 81 40 7Palo Verde Districtwide Total:
Palomar
37 17 273PALOMAR COLLEGE 848 1,594 397 22
1,594 397 37 17 848 273 22Palomar Districtwide Total:
Pasadena
9 386PASADENA CITY COLLEGE 673 1,471 367 36
1,471 367 9 673 386 36Pasadena Districtwide Total:
Peralta
25 1PERALTA DISTRICT 149 95 28
11 67ALAMEDA, COLLEGE OF 122 261 52 9
21 117LANEY COLLEGE 307 546 90 11
16 77MERRITT COLLEGE 147 297 51 6
14 45VISTA COLLEGE 173 272 34 6
1,525 322 87 749 307 60Peralta Districtwide Total:
Rancho Santiago
27 5RANCHO SANTIAGO DISTRICT 162 117 13
8 1 211SANTA ANA COLLEGE 710 1,293 339 24
SANTA ANA CONTINUING EDUCATION CENTER
2 1 99SANTIAGO CANYON COLLEGE 285 554 154 13
2,009 610 37 7 995 310 50Rancho Santiago Districtwide Total:
Redwoods
56 33 93REDWOODS, COLLEGE OF THE 252 583 127 22
583 127 56 33 252 93 22Redwoods Districtwide Total:
Rio Hondo
3 9 186RIO HONDO COLLEGE 356 830 253 23
830 253 3 9 356 186 23Rio Hondo Districtwide Total:
Note: Headcount is unduplicated by district. Primary location for each employee is determined by the location of the maximum FTE (EJ08) Employee-Assignment-FTE excluding any overload assignment(s) where (EJ01), Position 2 = O or A.
Data Element Definitions: California Community Colleges Management Information System Data Element Dictionary
All Districts Reporting
Data Source: CCCCO MIS Database for the reporting period Fall Term 2010 Page 7 of 104
June 30, 2011

California Community Colleges Chancellor's OfficeReport on Staffing for Fall 2010
Employee Category Headcount Distribution by District/Primary Location
Educ. Admin.
Total Headcount
Classified Support
Classified Professional
Classified Admin.
Academic Temporary
Tenured/ Tenure Track
Riverside
18 23RIVERSIDE DISTRICT 192 138 13
17 11 229RIVERSIDE COMMUNITY COLLEGE 454 999 269 19
5 4 72MORENO 363 537 80 13
4 2 66NORCO 183 334 69 10
2,062 556 44 40 1,000 367 55Riverside Districtwide Total:
San Bernardino
21 24SAN BERNARDINO DISTRICT 115 64 6
8 4 68CRAFTON HILLS COLLEGE 144 319 85 10
19 7 154SAN BERNARDINO VALLEY COLLEGE 370 761 193 18
1,195 342 48 35 514 222 34San Bernardino Districtwide Total:
San Diego
38 2SAN DIEGO DISTRICT 1 577 495 41
11 194SAN DIEGO CITY COLLEGE 632 991 138 16
11 274SAN DIEGO MESA COLLEGE 631 1,096 166 14
12 110SAN DIEGO MIRAMAR COLLEGE REG CNTR 413 627 81 11
1 102SAN DIEGO CET 412 631 103 13
SAN DIEGO ADULT/CONTINUING EDUCATION CEN
3,922 983 73 2,089 682 95San Diego Districtwide Total:
San Francisco
80 2 793SAN FRANCISCO, CITY COLLEGE OF 1,034 2,701 749 43
2,701 749 80 2 1,034 793 43San Francisco Districtwide Total:
San Joaquin Delta
16 38 214SAN JOAQUIN DELTA COLLEGE 285 1,020 455 12
1,020 455 16 38 285 214 12San Joaquin Delta Districtwide Total:
San Jose-Evergreen
14 12SAN JOSE/EVERGREEN DISTRICT 90 61 3
2 7 115EVERGREEN VALLEY COLLEGE 203 477 139 11
5 4 101SAN JOSE CITY COLLEGE 278 525 129 8
1,092 329 21 23 481 216 22San Jose-Evergreen Districtwide Total:
San Luis Obispo
18 11 156CUESTA COLLEGE 397 826 230 14
826 230 18 11 397 156 14San Luis Obispo Districtwide Total:
San Mateo
44 12SAN MATEO DISTRICT 212 154 2
11 1 64CANADA COLLEGE 186 326 57 7
9 1 139SAN MATEO, COLLEGE OF 213 474 101 11
6 2 104SKYLINE COLLEGE 244 439 72 11
1,451 384 70 16 643 307 31San Mateo Districtwide Total:
Santa Barbara
SANTA BARBARA DISTRICT
102 53 213SANTA BARBARA CITY COLLEGE 407 1,065 289 1
SANTA BARBARA CED
1,065 289 102 53 407 213 1Santa Barbara Districtwide Total:
Note: Headcount is unduplicated by district. Primary location for each employee is determined by the location of the maximum FTE (EJ08) Employee-Assignment-FTE excluding any overload assignment(s) where (EJ01), Position 2 = O or A.
Data Element Definitions: California Community Colleges Management Information System Data Element Dictionary
All Districts Reporting
Data Source: CCCCO MIS Database for the reporting period Fall Term 2010 Page 8 of 104
June 30, 2011

California Community Colleges Chancellor's OfficeReport on Staffing for Fall 2010
Employee Category Headcount Distribution by District/Primary Location
Educ. Admin.
Total Headcount
Classified Support
Classified Professional
Classified Admin.
Academic Temporary
Tenured/ Tenure Track
Santa Clarita
7 58 184CANYONS, COLLEGE OF THE 437 939 224 29
939 224 7 58 437 184 29Santa Clarita Districtwide Total:
Santa Monica
53 307SANTA MONICA CITY COLLEGE 980 1,845 461 44
1,845 461 53 980 307 44Santa Monica Districtwide Total:
Sequoias
8 3 157SEQUOIAS, COLLEGE OF THE 334 740 201 37
740 201 8 3 334 157 37Sequoias Districtwide Total:
Shasta-Tehama-Trinity
SHASTA DISTRICT
15 123SHASTA COLLEGE 293 668 210 27
668 210 15 293 123 27Shasta-Tehama-Trinity Districtwide Total:
Sierra
24 215SIERRA COLLEGE 680 1,172 234 19
1,172 234 24 680 215 19Sierra Districtwide Total:
Siskiyous
24 1 49SISKIYOUS, COLLEGE OF THE 156 315 80 5
315 80 24 1 156 49 5Siskiyous Districtwide Total:
Solano
7 11 155SOLANO COMMUNITY COLLEGE 314 655 157 11
655 157 7 11 314 155 11Solano Districtwide Total:
Sonoma
61 7 291SANTA ROSA JUNIOR COLLEGE 1,029 1,822 398 36
1,822 398 61 7 1,029 291 36Sonoma Districtwide Total:
South Orange
5 14SOUTH ORANGE COUNTY 5 102 72 6
8 23 225SADDLEBACK COLLEGE 553 1,107 283 15
2 13 125IRVINE VALLEY COLLEGE 333 660 177 10
1,869 532 15 50 891 350 31South Orange Districtwide Total:
Southwestern
34 224SOUTHWESTERN COLLEGE 685 1,338 372 23
1,338 372 34 685 224 23Southwestern Districtwide Total:
State Center
10 14STATE CENTER DISTRICT 136 102 10
14 7 309FRESNO CITY COLLEGE 642 1,325 327 26
5 9 183REEDLEY 403 806 189 17
2,267 618 29 30 1,045 492 53State Center Districtwide Total:
Ventura
7 3VENTURA COUNTY DISTRICT 82 69 3
4 1 158MOORPARK COLLEGE 350 671 150 8
5 2 88OXNARD COLLEGE 149 356 106 6
8 1 134VENTURA COLLEGE 319 624 152 10
1,733 477 24 7 818 380 27Ventura Districtwide Total:
Note: Headcount is unduplicated by district. Primary location for each employee is determined by the location of the maximum FTE (EJ08) Employee-Assignment-FTE excluding any overload assignment(s) where (EJ01), Position 2 = O or A.
Data Element Definitions: California Community Colleges Management Information System Data Element Dictionary
All Districts Reporting
Data Source: CCCCO MIS Database for the reporting period Fall Term 2010 Page 9 of 104
June 30, 2011

California Community Colleges Chancellor's OfficeReport on Staffing for Fall 2010
Employee Category Headcount Distribution by District/Primary Location
Educ. Admin.
Total Headcount
Classified Support
Classified Professional
Classified Admin.
Academic Temporary
Tenured/ Tenure Track
Victor Valley
VICTOR VALLEY DISTRICT
23 1 130VICTOR VALLEY COMMUNITY COLLEGE 451 803 185 13
803 185 23 1 451 130 13Victor Valley Districtwide Total:
West Hills
4WEST HILLS DISTRICT OFFICE 51 17 30
51 31WEST HILLS COALINGA 32 294 158 22
17 1 28WEST HILLS LEMOORE 38 174 79 11
519 254 72 1 70 59 63West Hills Districtwide Total:
West Kern
14 9 50TAFT COLLEGE 61 282 142 6
282 142 14 9 61 50 6West Kern Districtwide Total:
West Valley-Mission
18 11WEST VALLEY DISTRICT 124 94 1
13 2 140MISSION COLLEGE 233 490 91 11
9 2 164WEST VALLEY COLLEGE 245 524 97 7
1,138 282 40 15 478 304 19West Valley-Mission Districtwide Total:
Yosemite
13 24YOSEMITE DISTRICT 242 198 7
4 10 44COLUMBIA COLLEGE 118 272 91 5
8 16 240MODESTO JUNIOR COLLEGE 356 997 357 20
1,511 646 25 50 474 284 32Yosemite Districtwide Total:
Yuba
7YUBA DISTRICT OFFICE 50 37 6
13 7 100YUBA COLLEGE 176 415 106 13
3 34WOODLAND COLLEGE 81 155 32 5
620 175 13 17 257 134 24Yuba Districtwide Total:
Statewide Total: 2,020 18,068 1,486 2,166 24,264 89,049 41,045
Note: Headcount is unduplicated by district. Primary location for each employee is determined by the location of the maximum FTE (EJ08) Employee-Assignment-FTE excluding any overload assignment(s) where (EJ01), Position 2 = O or A.
Data Element Definitions: California Community Colleges Management Information System Data Element Dictionary
All Districts Reporting
Data Source: CCCCO MIS Database for the reporting period Fall Term 2010 Page 10 of 104
June 30, 2011

California Community Colleges Chancellor's OfficeReport on Staffing for Fall 2010
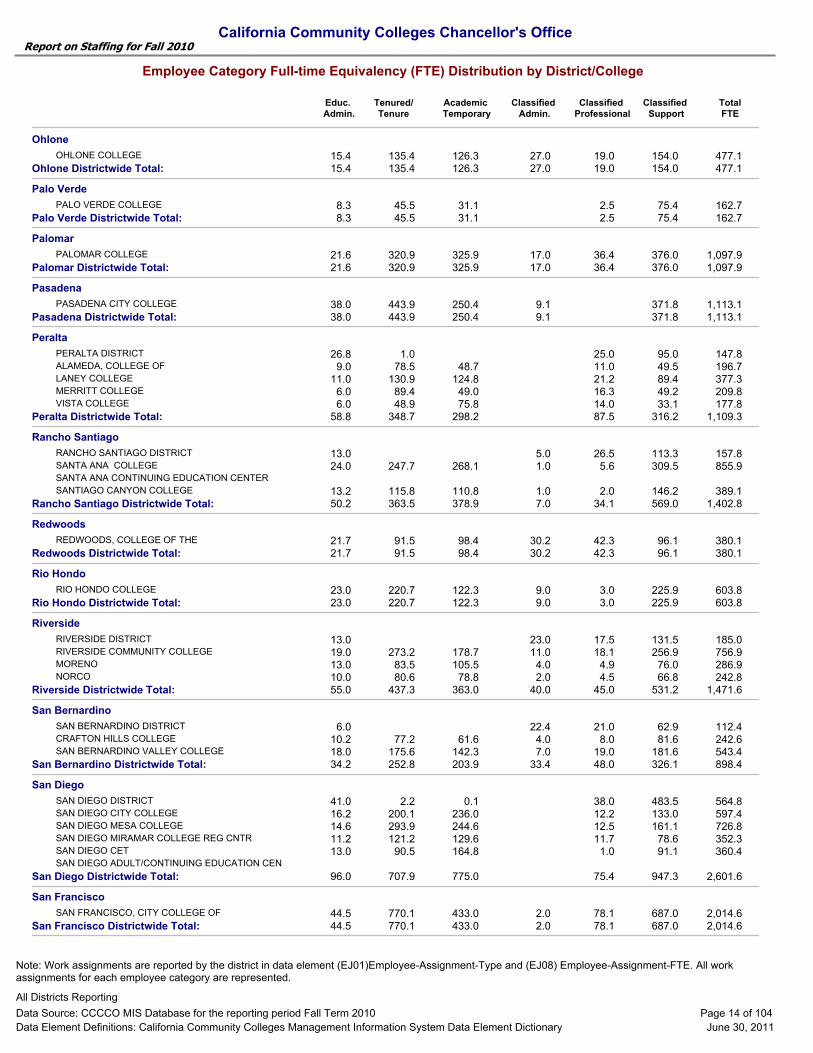
Employee Category Full-time Equivalency (FTE) Distribution by District/College
Educ. Admin.
TotalFTE
Classified Support
Classified Professional
Classified Admin.
Academic Temporary
Tenured/ Tenure
Allan Hancock
ALLAN HANCOCK COLLEGE 156.4 26.5 177.0 4.0 23.2 184.1 571.1 26.5 177.0 156.4 4.0 23.2 184.1 571.1Allan Hancock Districtwide Total:
Antelope Valley
ANTELOPE VALLEY DISTRICT
ANTELOPE VALLEY COLLEGE 172.1 27.0 225.2 36.2 188.7 649.1 27.0 225.2 172.1 36.2 188.7 649.1Antelope Valley Districtwide Total:
Barstow
BARSTOW DISTRICT 10.0 7.0 10.0 42.5 69.5BARSTOW COLLEGE 51.3 44.7 5.5 101.5
10.0 51.7 51.3 10.0 48.0 171.0Barstow Districtwide Total:
Butte
BUTTE COLLEGE 171.8 21.1 192.2 26.0 23.0 254.7 688.9 21.1 192.2 171.8 26.0 23.0 254.7 688.9Butte Districtwide Total:
Cabrillo
CABRILLO COLLEGE 142.0 15.4 204.7 18.8 241.4 622.3 15.4 204.7 142.0 18.8 241.4 622.3Cabrillo Districtwide Total:
Cerritos
CERRITOS COLLEGE 179.3 25.6 335.1 26.2 5.9 311.8 883.8 25.6 335.1 179.3 26.2 5.9 311.8 883.8Cerritos Districtwide Total:
Chabot-Las Positas
CHABOT-LAS POSITAS DISTRICT 2.0 22.6 113.6 138.2LAS POSITAS COLLEGE 106.0 8.0 113.5 5.0 84.5 317.1CHABOT COLLEGE 130.5 12.0 217.5 10.0 1.0 137.1 508.2
22.0 331.0 236.6 37.6 1.0 335.2 963.4Chabot-Las Positas Districtwide Total:
Chaffey
CHAFFEY COLLEGE 231.9 17.2 229.6 17.5 19.7 239.2 755.1 17.2 229.6 231.9 17.5 19.7 239.2 755.1Chaffey Districtwide Total:
Citrus
CITRUS COLLEGE 107.5 30.1 196.1 6.0 33.4 266.9 639.9 30.1 196.1 107.5 6.0 33.4 266.9 639.9Citrus Districtwide Total:
Coast
COAST DISTRICT 5.0 17.0 1.0 86.3 109.3COASTLINE COMMUNITY COLLEGE 109.2 11.0 47.1 22.0 1.0 175.9 366.3GOLDEN WEST COLLEGE 131.5 15.0 157.0 19.0 183.2 505.6ORANGE COAST COLLEGE 189.7 19.8 306.0 26.1 1.0 306.1 848.6
50.8 510.1 430.4 84.1 3.0 751.5 1,829.8Coast Districtwide Total:
Compton
COMPTON COMMUNITY COLLEGE 87.6 14.0 99.2 7.0 14.0 105.3 327.1 14.0 99.2 87.6 7.0 14.0 105.3 327.1Compton Districtwide Total:
Contra Costa
CONTRA COSTA DISTRICT 3.0 21.2 17.0 31.0 72.2CONTRA COSTA COLLEGE 82.0 12.1 99.0 7.0 7.8 68.9 276.7DIABLO VALLEY COLLEGE 205.7 27.8 265.7 10.0 26.6 161.8 697.5LOS MEDANOS COLLEGE 106.5 11.2 119.6 11.0 11.0 85.5 344.8
54.0 484.3 394.2 49.2 62.4 347.1 1,391.2Contra Costa Districtwide Total:
Copper Mountain
COPPER MOUNTAIN DISTRICT OFFICE
COPPER MOUNTAIN COLLEGE 41.0 11.0 31.4 5.0 40.8 129.2 11.0 31.4 41.0 5.0 40.8 129.2Copper Mountain Districtwide Total:
Note: Work assignments are reported by the district in data element (EJ01)Employee-Assignment-Type and (EJ08) Employee-Assignment-FTE. All work assignments for each employee category are represented.
Data Element Definitions: California Community Colleges Management Information System Data Element Dictionary
All Districts Reporting
Data Source: CCCCO MIS Database for the reporting period Fall Term 2010 Page 11 of 104
June 30, 2011

California Community Colleges Chancellor's OfficeReport on Staffing for Fall 2010
Employee Category Full-time Equivalency (FTE) Distribution by District/College
Educ. Admin.
TotalFTE
Classified Support
Classified Professional
Classified Admin.
Academic Temporary
Tenured/ Tenure
Desert
DESERT, COLLEGE OF THE 151.3 18.1 122.5 8.3 11.5 175.9 487.6 18.1 122.5 151.3 8.3 11.5 175.9 487.6Desert Districtwide Total:
El Camino
EL CAMINO COLLEGE 192.6 25.0 348.2 32.0 57.0 346.5 1,001.3 25.0 348.2 192.6 32.0 57.0 346.5 1,001.3El Camino Districtwide Total:
Feather River
FEATHER RIVER COLLEGE 23.4 5.1 25.3 17.7 2.0 45.0 118.5 5.1 25.3 23.4 17.7 2.0 45.0 118.5Feather River Districtwide Total:
Foothill-Deanza
FOOTHILL DISTRICT 8.0 17.8 71.7 112.9 210.4DE ANZA COLLEGE 231.4 16.3 350.4 10.0 53.9 212.7 874.8FOOTHILL COLLEGE 168.8 20.9 236.4 5.0 35.8 100.5 567.3
45.3 586.8 400.1 32.8 161.4 426.0 1,652.4Foothill-Deanza Districtwide Total:
Gavilan
GAVILAN COLLEGE 44.3 20.0 78.1 6.0 13.4 113.2 274.9 20.0 78.1 44.3 6.0 13.4 113.2 274.9Gavilan Districtwide Total:
Glendale
GLENDALE COLLEGE 214.2 31.0 227.2 33.4 13.5 287.8 807.1 31.0 227.2 214.2 33.4 13.5 287.8 807.1Glendale Districtwide Total:
Grossmont-Cuyamaca
GROSSMONT DISTRICT 4.5 5.4 19.0 60.3 89.2CUYAMACA COLLEGE 115.4 12.1 92.4 2.0 3.3 109.8 334.9GROSSMONT COLLEGE 197.8 18.1 253.7 2.0 9.9 187.0 668.5
34.7 346.1 313.2 9.4 32.1 357.1 1,092.5Grossmont-Cuyamaca Districtwide Total:
Hartnell
HARTNELL COLLEGE 85.0 7.0 91.9 18.9 9.5 115.1 327.3 7.0 91.9 85.0 18.9 9.5 115.1 327.3Hartnell Districtwide Total:
Imperial
IMPERIAL VALLEY COLLEGE 104.9 16.0 179.5 1.0 19.8 137.2 458.4 16.0 179.5 104.9 1.0 19.8 137.2 458.4Imperial Districtwide Total:
Kern
KERN DISTRICT 3.0 24.8 11.6 34.5 73.9BAKERSFIELD COLLEGE 115.4 14.0 308.2 15.0 31.6 194.4 678.7CERRO COSO COMMUNITY COLLEGE 50.0 5.5 75.1 8.0 8.4 69.2 216.2PORTERVILLE COLLEGE 27.8 6.0 83.6 5.3 4.7 54.1 181.4
28.5 466.9 193.2 53.0 56.3 352.2 1,150.1Kern Districtwide Total:
Lake Tahoe
LAKE TAHOE COMMUNITY COLLEGE 45.8 6.0 44.6 2.0 3.3 52.1 153.8 6.0 44.6 45.8 2.0 3.3 52.1 153.8Lake Tahoe Districtwide Total:
Lassen
LASSEN COLLEGE 28.1 4.8 48.5 9.6 7.2 50.0 148.1 4.8 48.5 28.1 9.6 7.2 50.0 148.1Lassen Districtwide Total:
Long Beach
LONG BEACH CITY COLLEGE 226.2 32.7 360.7 20.0 27.4 461.5 1,128.5 32.7 360.7 226.2 20.0 27.4 461.5 1,128.5Long Beach Districtwide Total:
Note: Work assignments are reported by the district in data element (EJ01)Employee-Assignment-Type and (EJ08) Employee-Assignment-FTE. All work assignments for each employee category are represented.
Data Element Definitions: California Community Colleges Management Information System Data Element Dictionary
All Districts Reporting
Data Source: CCCCO MIS Database for the reporting period Fall Term 2010 Page 12 of 104
June 30, 2011

California Community Colleges Chancellor's OfficeReport on Staffing for Fall 2010
Employee Category Full-time Equivalency (FTE) Distribution by District/College
Educ. Admin.
TotalFTE
Classified Support
Classified Professional
Classified Admin.
Academic Temporary
Tenured/ Tenure
Los Angeles
LOS ANGELES DISTRICT 0.5 11.0 2.0 14.0 96.9 140.9 265.3LOS ANGELES CITY COLLEGE 166.7 14.0 213.6 2.1 17.3 229.7 643.4LOS ANGELES HARBOR COLLEGE 117.2 10.9 106.5 3.2 10.0 108.6 356.5LOS ANGELES MISSION COLLEGE 124.3 9.7 72.7 1.0 10.3 128.3 346.2LOS ANGELES PIERCE COLLEGE 209.4 13.2 197.3 4.2 17.0 225.8 667.0LOS ANGELES SOUTHWEST COLLEGE 80.5 6.3 68.0 1.0 12.0 97.8 265.6LOS ANGELES TRADE-TECHNICAL COLLEGE 123.9 11.3 191.1 5.2 16.0 201.5 549.0LOS ANGELES VALLEY COLLEGE 168.4 12.5 212.6 4.2 13.2 200.9 611.8EAST LOS ANGELES COLLEGE 239.9 16.3 273.2 3.3 15.2 287.8 835.7WEST LOS ANGELES COLLEGE 112.9 8.5 93.7 2.0 10.4 134.5 362.0L.A. I.T.V. 6.8 1.0 2.0 9.8
114.6 1,430.6 1,350.5 40.3 218.2 1,757.9 4,912.1Los Angeles Districtwide Total:
Los Rios
LOS RIOS DISTRICT 7.0 1.0 27.0 43.7 155.0 233.7AMERICAN RIVER COLLEGE 194.3 26.0 447.0 4.0 10.0 303.0 984.3COSUMNES RIVER COLLEGE 82.4 14.0 208.1 4.0 9.0 157.4 474.9SACRAMENTO CITY COLLEGE 164.6 23.0 359.6 3.0 9.0 264.6 823.9FOLSOM LAKE COLLEGE 57.9 10.0 119.1 2.0 6.0 100.9 296.0
80.0 1,134.9 499.3 40.0 77.7 980.8 2,812.7Los Rios Districtwide Total:
Marin
MARIN, COLLEGE OF 89.0 22.9 88.4 2.0 16.0 178.3 396.6 22.9 88.4 89.0 2.0 16.0 178.3 396.6Marin Districtwide Total:
Mendocino-Lake
MENDOCINO COLLEGE 81.7 8.5 53.2 12.5 83.6 239.6 8.5 53.2 81.7 12.5 83.6 239.6Mendocino-Lake Districtwide Total:
Merced
MERCED COLLEGE 59.1 16.0 97.7 26.0 2.0 227.5 428.3 16.0 97.7 59.1 26.0 2.0 227.5 428.3Merced Districtwide Total:
Mira Costa
MIRA COSTA DISTRICT
MIRA COSTA COLLEGE 168.8 15.5 161.5 14.2 19.6 216.2 595.8 15.5 161.5 168.8 14.2 19.6 216.2 595.8Mira Costa Districtwide Total:
Monterey
MONTEREY PENINSULA COLLEGE 97.1 10.0 126.9 12.2 18.0 157.5 421.7 10.0 126.9 97.1 12.2 18.0 157.5 421.7Monterey Districtwide Total:
Mt. San Antonio
MOUNT SAN ANTONIO COLLEGE 327.9 39.7 441.3 40.4 3.8 507.8 1,360.9 39.7 441.3 327.9 40.4 3.8 507.8 1,360.9Mt. San Antonio Districtwide Total:
Mt. San Jacinto
MOUNT SAN JACINTO COLLEGE 236.0 14.0 233.2 10.9 81.8 219.0 794.9 14.0 233.2 236.0 10.9 81.8 219.0 794.9Mt. San Jacinto Districtwide Total:
Napa Valley
NAPA VALLEY COLLEGE DISTRICT
NAPA VALLEY COLLEGE 88.4 17.1 105.6 13.0 5.0 150.3 379.4 17.1 105.6 88.4 13.0 5.0 150.3 379.4Napa Valley Districtwide Total:
North Orange
NORTH ORANGE DISTRICT 3.0 17.0 1.0 74.5 95.5CYPRESS COLLEGE 149.9 17.2 247.7 11.2 203.5 629.5FULLERTON COLLEGE 170.3 19.2 372.3 13.2 258.9 833.9NORTH ORANGE ADULT DIVISION 110.1 10.0 23.1 7.4 73.5 224.0
49.4 643.1 430.3 48.8 1.0 610.4 1,782.9North Orange Districtwide Total:
Note: Work assignments are reported by the district in data element (EJ01)Employee-Assignment-Type and (EJ08) Employee-Assignment-FTE. All work assignments for each employee category are represented.
Data Element Definitions: California Community Colleges Management Information System Data Element Dictionary
All Districts Reporting
Data Source: CCCCO MIS Database for the reporting period Fall Term 2010 Page 13 of 104
June 30, 2011
California Community Colleges Chancellor's OfficeReport on Staffing for Fall 2010
Employee Category Full-time Equivalency (FTE) Distribution by District/College
Educ. Admin.
TotalFTE
Classified Support
Classified Professional
Classified Admin.
Academic Temporary
Tenured/ Tenure
Ohlone
OHLONE COLLEGE 126.3 15.4 135.4 27.0 19.0 154.0 477.1 15.4 135.4 126.3 27.0 19.0 154.0 477.1Ohlone Districtwide Total:
Palo Verde
PALO VERDE COLLEGE 31.1 8.3 45.5 2.5 75.4 162.7 8.3 45.5 31.1 2.5 75.4 162.7Palo Verde Districtwide Total:
Palomar
PALOMAR COLLEGE 325.9 21.6 320.9 17.0 36.4 376.0 1,097.9 21.6 320.9 325.9 17.0 36.4 376.0 1,097.9Palomar Districtwide Total:
Pasadena
PASADENA CITY COLLEGE 250.4 38.0 443.9 9.1 371.8 1,113.1 38.0 443.9 250.4 9.1 371.8 1,113.1Pasadena Districtwide Total:
Peralta
PERALTA DISTRICT 26.8 1.0 25.0 95.0 147.8ALAMEDA, COLLEGE OF 48.7 9.0 78.5 11.0 49.5 196.7LANEY COLLEGE 124.8 11.0 130.9 21.2 89.4 377.3MERRITT COLLEGE 49.0 6.0 89.4 16.3 49.2 209.8VISTA COLLEGE 75.8 6.0 48.9 14.0 33.1 177.8
58.8 348.7 298.2 87.5 316.2 1,109.3Peralta Districtwide Total:
Rancho Santiago
RANCHO SANTIAGO DISTRICT 13.0 5.0 26.5 113.3 157.8SANTA ANA COLLEGE 268.1 24.0 247.7 1.0 5.6 309.5 855.9SANTA ANA CONTINUING EDUCATION CENTER
SANTIAGO CANYON COLLEGE 110.8 13.2 115.8 1.0 2.0 146.2 389.1 50.2 363.5 378.9 7.0 34.1 569.0 1,402.8Rancho Santiago Districtwide Total:
Redwoods
REDWOODS, COLLEGE OF THE 98.4 21.7 91.5 30.2 42.3 96.1 380.1 21.7 91.5 98.4 30.2 42.3 96.1 380.1Redwoods Districtwide Total:
Rio Hondo
RIO HONDO COLLEGE 122.3 23.0 220.7 9.0 3.0 225.9 603.8 23.0 220.7 122.3 9.0 3.0 225.9 603.8Rio Hondo Districtwide Total:
Riverside
RIVERSIDE DISTRICT 13.0 23.0 17.5 131.5 185.0RIVERSIDE COMMUNITY COLLEGE 178.7 19.0 273.2 11.0 18.1 256.9 756.9MORENO 105.5 13.0 83.5 4.0 4.9 76.0 286.9NORCO 78.8 10.0 80.6 2.0 4.5 66.8 242.8
55.0 437.3 363.0 40.0 45.0 531.2 1,471.6Riverside Districtwide Total:
San Bernardino
SAN BERNARDINO DISTRICT 6.0 22.4 21.0 62.9 112.4CRAFTON HILLS COLLEGE 61.6 10.2 77.2 4.0 8.0 81.6 242.6SAN BERNARDINO VALLEY COLLEGE 142.3 18.0 175.6 7.0 19.0 181.6 543.4
34.2 252.8 203.9 33.4 48.0 326.1 898.4San Bernardino Districtwide Total:
San Diego
SAN DIEGO DISTRICT 0.1 41.0 2.2 38.0 483.5 564.8SAN DIEGO CITY COLLEGE 236.0 16.2 200.1 12.2 133.0 597.4SAN DIEGO MESA COLLEGE 244.6 14.6 293.9 12.5 161.1 726.8SAN DIEGO MIRAMAR COLLEGE REG CNTR 129.6 11.2 121.2 11.7 78.6 352.3SAN DIEGO CET 164.8 13.0 90.5 1.0 91.1 360.4SAN DIEGO ADULT/CONTINUING EDUCATION CEN
96.0 707.9 775.0 75.4 947.3 2,601.6San Diego Districtwide Total:
San Francisco
SAN FRANCISCO, CITY COLLEGE OF 433.0 44.5 770.1 2.0 78.1 687.0 2,014.6 44.5 770.1 433.0 2.0 78.1 687.0 2,014.6San Francisco Districtwide Total:
Note: Work assignments are reported by the district in data element (EJ01)Employee-Assignment-Type and (EJ08) Employee-Assignment-FTE. All work assignments for each employee category are represented.
Data Element Definitions: California Community Colleges Management Information System Data Element Dictionary
All Districts Reporting
Data Source: CCCCO MIS Database for the reporting period Fall Term 2010 Page 14 of 104
June 30, 2011

California Community Colleges Chancellor's OfficeReport on Staffing for Fall 2010
Employee Category Full-time Equivalency (FTE) Distribution by District/College
Educ. Admin.
TotalFTE
Classified Support
Classified Professional
Classified Admin.
Academic Temporary
Tenured/ Tenure
San Joaquin Delta
SAN JOAQUIN DELTA COLLEGE 61.2 12.0 237.0 37.8 15.5 348.5 711.9 12.0 237.0 61.2 37.8 15.5 348.5 711.9San Joaquin Delta Districtwide Total:
San Jose-Evergreen
SAN JOSE/EVERGREEN DISTRICT 3.0 12.0 14.0 60.4 89.4EVERGREEN VALLEY COLLEGE 86.2 11.0 133.1 7.0 2.0 125.7 365.0SAN JOSE CITY COLLEGE 110.8 8.0 99.1 4.0 4.5 119.8 346.2
22.0 232.1 197.0 23.0 20.5 306.0 800.6San Jose-Evergreen Districtwide Total:
San Luis Obispo
CUESTA COLLEGE 169.0 13.5 173.5 10.8 16.2 216.1 598.9 13.5 173.5 169.0 10.8 16.2 216.1 598.9San Luis Obispo Districtwide Total:
San Mateo
SAN MATEO DISTRICT 2.0 12.0 44.4 150.7 209.1CANADA COLLEGE 66.2 7.2 65.1 1.0 11.8 53.0 204.2SAN MATEO, COLLEGE OF 81.1 11.0 141.4 1.0 9.0 93.2 336.7SKYLINE COLLEGE 94.5 11.3 112.4 2.0 6.0 67.1 293.3
31.5 318.9 241.8 16.0 71.2 364.0 1,043.4San Mateo Districtwide Total:
Santa Barbara
SANTA BARBARA DISTRICT
SANTA BARBARA CITY COLLEGE 191.7 0.8 216.5 54.6 96.2 285.3 845.1SANTA BARBARA CED
0.8 216.5 191.7 54.6 96.2 285.3 845.1Santa Barbara Districtwide Total:
Santa Clarita
CANYONS, COLLEGE OF THE 161.5 30.4 206.7 58.3 7.2 226.3 690.5 30.4 206.7 161.5 58.3 7.2 226.3 690.5Santa Clarita Districtwide Total:
Santa Monica
SANTA MONICA CITY COLLEGE 398.0 43.3 327.0 52.8 432.3 1,253.4 43.3 327.0 398.0 52.8 432.3 1,253.4Santa Monica Districtwide Total:
Sequoias
SEQUOIAS, COLLEGE OF THE 131.2 37.7 182.8 3.0 7.0 184.4 546.2 37.7 182.8 131.2 3.0 7.0 184.4 546.2Sequoias Districtwide Total:
Shasta-Tehama-Trinity
SHASTA DISTRICT
SHASTA COLLEGE 122.1 23.4 137.3 15.0 186.5 484.2 23.4 137.3 122.1 15.0 186.5 484.2Shasta-Tehama-Trinity Districtwide Total:
Sierra
SIERRA COLLEGE 259.5 19.0 236.6 23.7 236.9 775.6 19.0 236.6 259.5 23.7 236.9 775.6Sierra Districtwide Total:
Siskiyous
SISKIYOUS, COLLEGE OF THE 48.2 5.0 52.0 1.0 25.3 74.6 206.1 5.0 52.0 48.2 1.0 25.3 74.6 206.1Siskiyous Districtwide Total:
Solano
SOLANO COMMUNITY COLLEGE 123.1 13.0 187.1 14.0 8.0 158.6 503.9 13.0 187.1 123.1 14.0 8.0 158.6 503.9Solano Districtwide Total:
Sonoma
SANTA ROSA JUNIOR COLLEGE 321.8 33.2 317.4 7.2 44.5 362.9 1,087.1 33.2 317.4 321.8 7.2 44.5 362.9 1,087.1Sonoma Districtwide Total:
South Orange
SOUTH ORANGE COUNTY 5.0 7.0 14.0 5.0 69.8 100.8SADDLEBACK COLLEGE 215.9 15.1 221.3 25.4 6.4 261.7 745.8IRVINE VALLEY COLLEGE 114.4 10.5 123.4 12.5 2.0 165.4 428.2
32.6 344.8 335.2 51.9 13.4 496.9 1,274.8South Orange Districtwide Total:
Note: Work assignments are reported by the district in data element (EJ01)Employee-Assignment-Type and (EJ08) Employee-Assignment-FTE. All work assignments for each employee category are represented.
Data Element Definitions: California Community Colleges Management Information System Data Element Dictionary
All Districts Reporting
Data Source: CCCCO MIS Database for the reporting period Fall Term 2010 Page 15 of 104
June 30, 2011

California Community Colleges Chancellor's OfficeReport on Staffing for Fall 2010
Employee Category Full-time Equivalency (FTE) Distribution by District/College
Educ. Admin.
TotalFTE
Classified Support
Classified Professional
Classified Admin.
Academic Temporary
Tenured/ Tenure
Southwestern
SOUTHWESTERN COLLEGE 269.9 23.3 199.4 34.8 349.9 877.2 23.3 199.4 269.9 34.8 349.9 877.2Southwestern Districtwide Total:
State Center
STATE CENTER DISTRICT 9.5 14.0 10.0 101.0 134.4FRESNO CITY COLLEGE 245.6 29.4 354.4 7.2 10.6 296.5 943.7REEDLEY 165.2 17.5 211.8 9.2 4.4 176.9 585.0
56.4 566.2 410.8 30.4 24.9 574.4 1,663.1State Center Districtwide Total:
Ventura
VENTURA COUNTY DISTRICT 3.0 3.0 7.3 68.9 82.2MOORPARK COLLEGE 145.4 8.0 172.4 1.0 4.3 148.4 479.4OXNARD COLLEGE 62.1 6.0 94.9 2.0 3.8 94.7 263.5VENTURA COLLEGE 131.4 10.0 154.4 1.0 8.4 145.2 450.3
27.0 421.7 338.9 7.0 23.7 457.1 1,275.4Ventura Districtwide Total:
Victor Valley
VICTOR VALLEY DISTRICT
VICTOR VALLEY COMMUNITY COLLEGE 195.0 12.0 170.6 1.0 23.0 183.9 585.5 12.0 170.6 195.0 1.0 23.0 183.9 585.5Victor Valley Districtwide Total:
West Hills
WEST HILLS DISTRICT OFFICE 20.5 3.0 16.0 39.4WEST HILLS COALINGA 14.4 21.1 15.9 28.8 101.0 181.2WEST HILLS LEMOORE 15.0 11.1 13.6 1.0 10.5 55.3 106.5
52.7 29.5 29.5 1.0 42.3 172.2 327.1West Hills Districtwide Total:
West Kern
TAFT COLLEGE 26.9 6.5 67.2 9.8 14.0 116.8 241.2 6.5 67.2 26.9 9.8 14.0 116.8 241.2West Kern Districtwide Total:
West Valley-Mission
WEST VALLEY DISTRICT 1.0 11.0 18.0 94.0 124.0MISSION COLLEGE 83.4 11.0 150.7 1.5 12.6 90.0 349.2WEST VALLEY COLLEGE 88.6 7.0 182.0 2.0 9.0 92.4 381.1
19.0 332.7 172.0 14.5 39.6 276.4 854.3West Valley-Mission Districtwide Total:
Yosemite
YOSEMITE DISTRICT 7.0 24.0 14.0 199.4 244.4COLUMBIA COLLEGE 39.6 5.0 51.2 10.0 4.0 89.2 199.0MODESTO JUNIOR COLLEGE 144.8 21.3 282.4 17.2 8.0 355.1 828.7
33.3 333.6 184.3 51.2 26.0 643.7 1,272.1Yosemite Districtwide Total:
Yuba
YUBA DISTRICT OFFICE 6.0 7.0 35.6 48.6YUBA COLLEGE 60.0 13.8 119.4 7.0 8.2 102.5 311.0WOODLAND COLLEGE 26.8 5.0 36.0 3.0 29.6 100.3
24.8 155.3 86.8 17.0 8.2 167.7 459.9Yuba Districtwide Total:
Statewide Total : 2,025.2 20,094.0 15,734.5 1,501.0 2,082.4 22,821.0 64,258.0
Note: Work assignments are reported by the district in data element (EJ01)Employee-Assignment-Type and (EJ08) Employee-Assignment-FTE. All work assignments for each employee category are represented.
Data Element Definitions: California Community Colleges Management Information System Data Element Dictionary
All Districts Reporting
Data Source: CCCCO MIS Database for the reporting period Fall Term 2010 Page 16 of 104
June 30, 2011

California Community Colleges Chancellor's OfficeReport on Staffing for Fall 2010
EEO6 Occupational Activity Headcount Distribution by District/Primary Location
Executive HeadcountResearchServiceSkilledTechnicalClericalProfessionalFaculty
Allan Hancock
603 25 75 7 38 846 67ALLAN HANCOCK COLLEGE 31
Allan Hancock Districtwide Total: 31 603 25 75 67 7 38 846
Antelope Valley
596 36 111 7 38 853 38ANTELOPE VALLEY COLLEGE 27
Antelope Valley Districtwide Total: 27 596 36 111 38 7 38 853
Barstow
7 27 10 72 9BARSTOW DISTRICT 19
142 1 148 5BARSTOW COLLEGE
Barstow Districtwide Total: 19 149 28 14 10 220
Butte
727 23 145 9 69 1,067 55BUTTE COLLEGE 39
Butte Districtwide Total: 39 727 23 145 55 9 69 1,067
Cabrillo
591 107 6 35 885 112CABRILLO COLLEGE 34
Cabrillo Districtwide Total: 34 591 107 112 6 35 885
Cerritos
742 6 174 7 67 1,114 68CERRITOS COLLEGE 50
Cerritos Districtwide Total: 50 742 6 174 68 7 67 1,114
Chabot-Las Positas
30 7 54 139 23CHABOT-LAS POSITAS DISTRICT 25
364 43 8 470 42LAS POSITAS COLLEGE 13
511 1 81 12 683 56CHABOT COLLEGE 22
Chabot-Las Positas Districtwide Total: 60 875 1 154 121 7 74 1,292
Chaffey
827 21 138 7 45 1,133 63CHAFFEY COLLEGE 32
Chaffey Districtwide Total: 32 827 21 138 63 7 45 1,133
Citrus
429 33 116 4 82 789 92CITRUS COLLEGE 33
Citrus Districtwide Total: 33 429 33 116 92 4 82 789
Coast
1 25 2 5 109 54COAST DISTRICT 22
300 1 106 2 14 513 59COASTLINE COMMUNITY COLLEGE 31
446 82 6 33 666 65GOLDEN WEST COLLEGE 34
752 1 122 15 79 1,109 95ORANGE COAST COLLEGE 45
Coast Districtwide Total: 132 1,498 3 335 273 25 131 2,397
Compton
305 14 25 4 27 447 54COMPTON COMMUNITY COLLEGE 18
Compton Districtwide Total: 18 305 14 25 54 4 27 447
Contra Costa
17 18 1 73 12CONTRA COSTA DISTRICT 25
288 8 35 16 389 23CONTRA COSTA COLLEGE 19
753 28 105 1 26 993 42DIABLO VALLEY COLLEGE 38
347 11 35 20 468 32LOS MEDANOS COLLEGE 23
Contra Costa Districtwide Total: 105 1,388 64 193 109 1 63 1,923
Copper Mountain
COPPER MOUNTAIN DISTRICT OFFICE
130 5 33 8 193 6COPPER MOUNTAIN COLLEGE 11
Copper Mountain Districtwide Total: 11 130 5 33 6 8 193
Desert
466 11 90 8 41 702 67DESERT, COLLEGE OF THE 19
Desert Districtwide Total: 19 466 11 90 67 8 41 702
Note: EEO6 is determined from (EB07) Employee-EEO6-Occupational-Activity as reported by the district.
Data Element Definitions: California Community Colleges Management Information System Data Element Dictionary
All Districts Reporting
Data Source: CCCCO MIS Database for the reporting period Fall Term 2010 Page 17 of 104
June 30, 2011

California Community Colleges Chancellor's OfficeReport on Staffing for Fall 2010
EEO6 Occupational Activity Headcount Distribution by District/Primary Location
Executive HeadcountResearchServiceSkilledTechnicalClericalProfessionalFaculty
El Camino
842 57 148 36 84 1,307 83EL CAMINO COLLEGE 57
El Camino Districtwide Total: 57 842 57 148 83 36 84 1,307
Feather River
88 2 25 5 2 156 14FEATHER RIVER COLLEGE 20
Feather River Districtwide Total: 20 88 2 25 14 5 2 156
Foothill-Deanza
72 19 33 38 212 24FOOTHILL DISTRICT 26
754 56 79 39 1,066 111DE ANZA COLLEGE 27
575 36 54 1 744 52FOOTHILL COLLEGE 26
Foothill-Deanza Districtwide Total: 79 1,329 164 152 187 33 78 2,022
Gavilan
287 13 30 3 20 438 64GAVILAN COLLEGE 21
Gavilan Districtwide Total: 21 287 13 30 64 3 20 438
Glendale
763 13 145 8 47 1,147 109GLENDALE COLLEGE 62
Glendale Districtwide Total: 62 763 13 145 109 8 47 1,147
Grossmont-Cuyamaca
20 25 6 17 93 15GROSSMONT DISTRICT 10
425 3 52 4 22 564 44CUYAMACA COLLEGE 14
795 10 97 7 36 1,032 68GROSSMONT COLLEGE 19
Grossmont-Cuyamaca Districtwide Total: 43 1,220 33 174 127 17 75 1,689
Hartnell
309 10 59 3 22 465 36HARTNELL COLLEGE 26
Hartnell Districtwide Total: 26 309 10 59 36 3 22 465
Imperial
350 19 74 3 30 527 35IMPERIAL VALLEY COLLEGE 16
Imperial Districtwide Total: 16 350 19 74 35 3 30 527
Kern
12 18 5 75 12KERN DISTRICT 28
537 31 108 2 64 816 45BAKERSFIELD COLLEGE 29
180 9 48 16 284 17CERRO COSO COMMUNITY COLLEGE 14
146 5 38 1 13 226 12PORTERVILLE COLLEGE 11
Kern Districtwide Total: 82 863 57 212 86 3 98 1,401
Lake Tahoe
162 4 38 6 227 9LAKE TAHOE COMMUNITY COLLEGE 8
Lake Tahoe Districtwide Total: 8 162 4 38 9 6 227
Lassen
137 7 11 6 7 212 33LASSEN COLLEGE 11
Lassen Districtwide Total: 11 137 7 11 33 6 7 212
Long Beach
930 27 244 24 99 1,510 133LONG BEACH CITY COLLEGE 53
Long Beach Districtwide Total: 53 930 27 244 133 24 99 1,510
Note: EEO6 is determined from (EB07) Employee-EEO6-Occupational-Activity as reported by the district.
Data Element Definitions: California Community Colleges Management Information System Data Element Dictionary
All Districts Reporting
Data Source: CCCCO MIS Database for the reporting period Fall Term 2010 Page 18 of 104
June 30, 2011

California Community Colleges Chancellor's OfficeReport on Staffing for Fall 2010
EEO6 Occupational Activity Headcount Distribution by District/Primary Location
Executive HeadcountResearchServiceSkilledTechnicalClericalProfessionalFaculty
Los Angeles
3 98 103 9 279 38LOS ANGELES DISTRICT 28
569 17 86 13 56 844 87LOS ANGELES CITY COLLEGE 16
381 10 39 5 31 513 34LOS ANGELES HARBOR COLLEGE 13
356 10 47 5 27 508 53LOS ANGELES MISSION COLLEGE 10
689 17 93 14 70 968 67LOS ANGELES PIERCE COLLEGE 18
260 13 37 6 30 381 28LOS ANGELES SOUTHWEST COLLEGE 7
463 16 82 14 53 703 59LOS ANGELES TRADE-TECHNICAL COLLEGE 16
572 13 85 12 48 804 58LOS ANGELES VALLEY COLLEGE 16
797 14 113 20 82 1,129 84EAST LOS ANGELES COLLEGE 19
380 11 46 8 39 538 44WEST LOS ANGELES COLLEGE 10
17 2 21 1L.A. I.T.V. 1
Los Angeles Districtwide Total: 154 4,487 219 733 553 97 445 6,688
Los Rios
1 44 53 42 33 234 27LOS RIOS DISTRICT 34
1,020 10 129 2 46 1,404 167AMERICAN RIVER COLLEGE 30
399 9 60 27 594 81COSUMNES RIVER COLLEGE 18
789 9 115 2 47 1,106 118SACRAMENTO CITY COLLEGE 26
288 6 46 21 409 36FOLSOM LAKE COLLEGE 12
Los Rios Districtwide Total: 120 2,497 78 403 429 46 174 3,747
Marin
339 16 89 14 32 572 57MARIN, COLLEGE OF 25
Marin Districtwide Total: 25 339 16 89 57 14 32 572
Mendocino-Lake
312 47 9 12 416 16MENDOCINO COLLEGE 20
Mendocino-Lake Districtwide Total: 20 312 47 16 9 12 416
Merced
523 2 92 14 50 820 97MERCED COLLEGE 42
Merced Districtwide Total: 42 523 2 92 97 14 50 820
Mira Costa
MIRA COSTA DISTRICT
638 18 121 6 33 924 79MIRA COSTA COLLEGE 29
Mira Costa Districtwide Total: 29 638 18 121 79 6 33 924
Monterey
388 17 53 11 30 611 92MONTEREY PENINSULA COLLEGE 20
Monterey Districtwide Total: 20 388 17 53 92 11 30 611
Mt. San Antonio
1,211 4 320 22 105 1,843 108MOUNT SAN ANTONIO COLLEGE 73
Mt. San Antonio Districtwide Total: 73 1,211 4 320 108 22 105 1,843
Mt. San Jacinto
711 82 83 7 41 1,043 95MOUNT SAN JACINTO COLLEGE 24
Mt. San Jacinto Districtwide Total: 24 711 82 83 95 7 41 1,043
Napa Valley
NAPA VALLEY COLLEGE DISTRICT
373 5 64 7 28 563 57NAPA VALLEY COLLEGE 29
Napa Valley Districtwide Total: 29 373 5 64 57 7 28 563
North Orange
1 38 1 16 96 20NORTH ORANGE DISTRICT 20
589 67 13 62 830 70CYPRESS COLLEGE 29
768 94 9 62 1,068 103FULLERTON COLLEGE 32
313 24 3 406 49NORTH ORANGE ADULT DIVISION 17
North Orange Districtwide Total: 98 1,670 1 223 242 23 143 2,400
Ohlone
448 19 57 36 669 67OHLONE COLLEGE 42
Ohlone Districtwide Total: 42 448 19 57 67 36 669
Note: EEO6 is determined from (EB07) Employee-EEO6-Occupational-Activity as reported by the district.
Data Element Definitions: California Community Colleges Management Information System Data Element Dictionary
All Districts Reporting
Data Source: CCCCO MIS Database for the reporting period Fall Term 2010 Page 19 of 104
June 30, 2011

California Community Colleges Chancellor's OfficeReport on Staffing for Fall 2010
EEO6 Occupational Activity Headcount Distribution by District/Primary Location
Executive HeadcountResearchServiceSkilledTechnicalClericalProfessionalFaculty
Palo Verde
121 3 24 16 10 209 28PALO VERDE COLLEGE 7
Palo Verde Districtwide Total: 7 121 3 24 28 16 10 209
Palomar
1,121 37 233 20 46 1,594 103PALOMAR COLLEGE 34
Palomar Districtwide Total: 34 1,121 37 233 103 20 46 1,594
Pasadena
1,059 164 24 71 1,471 108PASADENA CITY COLLEGE 45
Pasadena Districtwide Total: 45 1,059 164 108 24 71 1,471
Peralta
1 25 19 15 16 149 45PERALTA DISTRICT 28
189 11 22 12 261 18ALAMEDA, COLLEGE OF 9
424 21 30 1 21 546 38LANEY COLLEGE 11
224 16 20 10 297 21MERRITT COLLEGE 6
218 14 15 5 272 14VISTA COLLEGE 6
Peralta Districtwide Total: 60 1,056 87 106 136 16 64 1,525
Rancho Santiago
27 55 2 16 162 44RANCHO SANTIAGO DISTRICT 18
921 8 140 11 55 1,293 133SANTA ANA COLLEGE 25
SANTA ANA CONTINUING EDUCATION CENTER
384 2 56 3 28 554 67SANTIAGO CANYON COLLEGE 14
Rancho Santiago Districtwide Total: 57 1,305 37 251 244 16 99 2,009
Redwoods
345 56 43 7 31 8 583 42REDWOODS, COLLEGE OF THE 51
Redwoods Districtwide Total: 51 345 56 43 42 7 31 8 583
Rio Hondo
542 3 150 4 33 830 66RIO HONDO COLLEGE 32
Rio Hondo Districtwide Total: 32 542 3 150 66 4 33 830
Riverside
18 74 8 12 192 44RIVERSIDE DISTRICT 36
683 17 128 14 60 999 67RIVERSIDE COMMUNITY COLLEGE 30
435 5 49 2 19 537 10MORENO 17
249 4 30 4 20 334 15NORCO 12
Riverside Districtwide Total: 95 1,367 44 281 136 28 111 2,062
San Bernardino
21 20 5 17 115 36SAN BERNARDINO DISTRICT 16
212 8 39 3 17 319 28CRAFTON HILLS COLLEGE 12
524 19 78 9 41 761 69SAN BERNARDINO VALLEY COLLEGE 21
San Bernardino Districtwide Total: 49 736 48 137 133 17 75 1,195
San Diego
3 38 127 40 224 577 104SAN DIEGO DISTRICT 41
826 11 93 6 991 39SAN DIEGO CITY COLLEGE 16
905 11 108 1 7 1,096 50SAN DIEGO MESA COLLEGE 14
523 12 39 2 6 627 34SAN DIEGO MIRAMAR COLLEGE REG CNTR 11
514 1 62 2 631 39SAN DIEGO CET 13
SAN DIEGO ADULT/CONTINUING EDUCATION CEN
San Diego Districtwide Total: 95 2,771 73 429 266 43 245 3,922
San Francisco
1,827 80 462 12 156 2,701 119SAN FRANCISCO, CITY COLLEGE OF 45
San Francisco Districtwide Total: 45 1,827 80 462 119 12 156 2,701
San Joaquin Delta
499 16 167 24 117 1,020 147SAN JOAQUIN DELTA COLLEGE 50
San Joaquin Delta Districtwide Total: 50 499 16 167 147 24 117 1,020
Note: EEO6 is determined from (EB07) Employee-EEO6-Occupational-Activity as reported by the district.
Data Element Definitions: California Community Colleges Management Information System Data Element Dictionary
All Districts Reporting
Data Source: CCCCO MIS Database for the reporting period Fall Term 2010 Page 20 of 104
June 30, 2011

California Community Colleges Chancellor's OfficeReport on Staffing for Fall 2010
EEO6 Occupational Activity Headcount Distribution by District/Primary Location
Executive HeadcountResearchServiceSkilledTechnicalClericalProfessionalFaculty
San Jose-Evergreen
14 20 1 7 90 33SAN JOSE/EVERGREEN DISTRICT 15
318 2 55 1 30 477 53EVERGREEN VALLEY COLLEGE 18
379 5 47 9 24 525 49SAN JOSE CITY COLLEGE 12
San Jose-Evergreen Districtwide Total: 45 697 21 122 135 11 61 1,092
San Luis Obispo
553 18 115 17 42 826 64CUESTA COLLEGE 17
San Luis Obispo Districtwide Total: 17 553 18 115 64 17 42 826
San Mateo
44 40 15 73 212 26SAN MATEO DISTRICT 14
250 11 28 326 29CANADA COLLEGE 8
352 9 38 1 474 62SAN MATEO, COLLEGE OF 12
348 6 31 439 41SKYLINE COLLEGE 13
San Mateo Districtwide Total: 47 950 70 137 158 15 74 1,451
Santa Barbara
SANTA BARBARA DISTRICT
620 102 134 6 56 1,065 93SANTA BARBARA CITY COLLEGE 54
SANTA BARBARA CED
Santa Barbara Districtwide Total: 54 620 102 134 93 6 56 1,065
Santa Clarita
621 7 91 15 49 939 75CANYONS, COLLEGE OF THE 81
Santa Clarita Districtwide Total: 81 621 7 91 75 15 49 939
Santa Monica
1,287 191 22 114 1,845 134SANTA MONICA CITY COLLEGE 97
Santa Monica Districtwide Total: 97 1,287 191 134 22 114 1,845
Sequoias
491 8 84 8 37 740 72SEQUOIAS, COLLEGE OF THE 40
Sequoias Districtwide Total: 40 491 8 84 72 8 37 740
Shasta-Tehama-Trinity
SHASTA DISTRICT
416 95 13 55 668 57SHASTA COLLEGE 32
Shasta-Tehama-Trinity Districtwide Total: 32 416 95 57 13 55 668
Sierra
895 114 17 29 1,172 74SIERRA COLLEGE 43
Sierra Districtwide Total: 43 895 114 74 17 29 1,172
Siskiyous
205 24 31 7 7 315 35SISKIYOUS, COLLEGE OF THE 6
Siskiyous Districtwide Total: 6 205 24 31 35 7 7 315
Solano
469 7 69 6 30 655 53SOLANO COMMUNITY COLLEGE 21
Solano Districtwide Total: 21 469 7 69 53 6 30 655
Sonoma
1,320 61 131 19 80 1,822 168SANTA ROSA JUNIOR COLLEGE 43
Sonoma Districtwide Total: 43 1,320 61 131 168 19 80 1,822
South Orange
5 5 41 12 102 19SOUTH ORANGE COUNTY 20
778 8 120 12 71 1,107 80SADDLEBACK COLLEGE 38
458 2 80 9 48 660 40IRVINE VALLEY COLLEGE 23
South Orange Districtwide Total: 81 1,241 15 241 139 21 131 1,869
Southwestern
909 129 15 76 1,338 186SOUTHWESTERN COLLEGE 23
Southwestern Districtwide Total: 23 909 129 186 15 76 1,338
Note: EEO6 is determined from (EB07) Employee-EEO6-Occupational-Activity as reported by the district.
Data Element Definitions: California Community Colleges Management Information System Data Element Dictionary
All Districts Reporting
Data Source: CCCCO MIS Database for the reporting period Fall Term 2010 Page 21 of 104
June 30, 2011

California Community Colleges Chancellor's OfficeReport on Staffing for Fall 2010
EEO6 Occupational Activity Headcount Distribution by District/Primary Location
Executive HeadcountResearchServiceSkilledTechnicalClericalProfessionalFaculty
State Center
10 29 8 48 136 20STATE CENTER DISTRICT 21
951 14 179 44 2 1,325 104FRESNO CITY COLLEGE 31
586 5 99 42 806 51REEDLEY 23
State Center Districtwide Total: 75 1,537 29 307 175 8 134 2 2,267
Ventura
7 18 16 82 35VENTURA COUNTY DISTRICT 6
508 4 54 8 46 671 42MOORPARK COLLEGE 9
237 5 36 2 27 356 41OXNARD COLLEGE 8
453 8 57 6 34 624 55VENTURA COLLEGE 11
Ventura Districtwide Total: 34 1,198 24 165 173 16 123 1,733
Victor Valley
VICTOR VALLEY DISTRICT
581 23 100 5 36 803 44VICTOR VALLEY COMMUNITY COLLEGE 14
Victor Valley Districtwide Total: 14 581 23 100 44 5 36 803
West Hills
4 9 1 51 7WEST HILLS DISTRICT OFFICE 30
63 51 38 7 19 15 294 79WEST HILLS COALINGA 22
66 17 16 6 11 14 174 32WEST HILLS LEMOORE 12
West Hills Districtwide Total: 64 129 72 63 118 13 31 29 519
West Kern
111 14 35 1 27 282 84TAFT COLLEGE 10
West Kern Districtwide Total: 10 111 14 35 84 1 27 282
West Valley-Mission
18 21 12 48 124 13WEST VALLEY DISTRICT 12
373 13 61 3 1 490 26MISSION COLLEGE 13
409 9 68 3 3 524 23WEST VALLEY COLLEGE 9
West Valley-Mission Districtwide Total: 34 782 40 150 62 18 52 1,138
Yosemite
13 100 14 72 242 20YOSEMITE DISTRICT 23
162 4 49 7 14 272 23COLUMBIA COLLEGE 13
596 8 221 6 27 997 107MODESTO JUNIOR COLLEGE 32
Yosemite Districtwide Total: 68 758 25 370 150 27 113 1,511
Yuba
19 3 50 15YUBA DISTRICT OFFICE 13
276 13 56 2 24 415 24YUBA COLLEGE 20
115 12 9 155 11WOODLAND COLLEGE 8
Yuba Districtwide Total: 41 391 13 87 50 2 36 620
Statewide Total: 3,354 59,113 2,166 10,729 7,774 998 4,876 39 89,049
Note: EEO6 is determined from (EB07) Employee-EEO6-Occupational-Activity as reported by the district.
Data Element Definitions: California Community Colleges Management Information System Data Element Dictionary
All Districts Reporting
Data Source: CCCCO MIS Database for the reporting period Fall Term 2010 Page 22 of 104
June 30, 2011

California Community Colleges Chancellor's OfficeReport on Staffing for Fall 2010
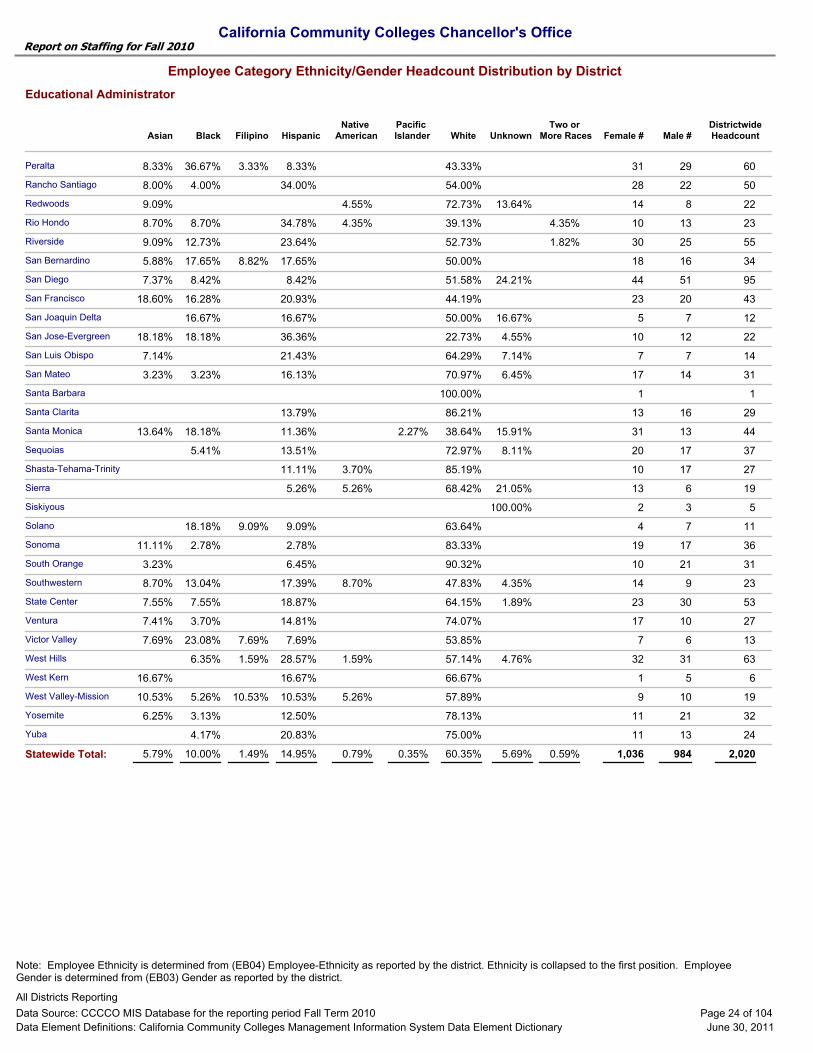
Employee Category Ethnicity/Gender Headcount Distribution by District
Educational Administrator
DistrictwideHeadcountMale #Female #
Two or More RacesUnknownWhite
Pacific Islander
Native AmericanHispanicFilipinoBlackAsian
Allan Hancock 16 11 27 74.07% 3.70% 18.52% 3.70%
Antelope Valley 13 14 27 51.85% 3.70% 7.41% 11.11% 25.93%
Barstow 7 3 10 70.00% 10.00% 20.00%
Butte 9 12 21 80.95% 4.76% 4.76% 4.76% 4.76%
Cabrillo 8 7 15 80.00% 20.00%
Cerritos 8 16 24 75.00% 4.17% 4.17% 12.50% 4.17%
Chabot-Las Positas 13 9 22 50.00% 13.64% 4.55% 4.55% 13.64% 13.64%
Chaffey 9 8 17 76.47% 5.88% 5.88% 11.76%
Citrus 9 21 30 70.00% 3.33% 20.00% 3.33% 3.33%
Coast 32 18 50 78.00% 10.00% 2.00% 6.00% 2.00% 2.00%
Compton 6 8 14 21.43% 7.14% 7.14% 64.29%
Contra Costa 26 29 55 43.64% 7.27% 16.36% 16.36% 16.36%
Copper Mountain 6 5 11 81.82% 9.09% 9.09%
Desert 13 5 18 77.78% 5.56% 16.67%
El Camino 10 15 25 40.00% 12.00% 28.00% 4.00% 16.00%
Feather River 3 2 5 100.00%
Foothill-Deanza 18 28 46 63.04% 2.17% 6.52% 8.70% 4.35% 2.17% 13.04%
Gavilan 9 10 19 73.68% 15.79% 10.53%
Glendale 11 20 31 87.10% 6.45% 3.23% 3.23%
Grossmont-Cuyamaca 13 20 33 69.70% 3.03% 6.06% 6.06% 6.06% 3.03% 6.06%
Hartnell 2 5 7 85.71% 14.29%
Imperial 11 4 15 66.67% 6.67% 26.67%
Kern 12 17 29 58.62% 3.45% 17.24% 10.34% 10.34%
Lake Tahoe 3 3 6 83.33% 16.67%
Lassen 6 6 83.33% 16.67%
Long Beach 16 17 33 57.58% 12.12% 3.03% 18.18% 9.09%
Los Angeles 51 63 114 39.47% 5.26% 4.39% 21.93% 13.16% .88% 14.91%
Los Rios 35 45 80 55.00% 6.25% 15.00% 6.25% 6.25% 11.25%
Marin 12 11 23 69.57% 8.70% 13.04% 8.70%
Mendocino-Lake 2 6 8 87.50% 12.50%
Merced 9 7 16 75.00% 6.25% 18.75%
Mira Costa 9 6 15 73.33% 6.67% 13.33% 6.67%
Monterey 7 3 10 60.00% 10.00% 10.00% 20.00%
Mt. San Antonio 16 22 38 63.16% 2.63% 21.05% 5.26% 7.89%
Mt. San Jacinto 7 7 14 42.86% 7.14% 14.29% 7.14% 7.14% 21.43%
Napa Valley 7 9 16 56.25% 31.25% 12.50%
North Orange 25 24 49 53.06% 6.12% 4.08% 12.24% 18.37% 2.04% 4.08%
Ohlone 7 8 15 73.33% 6.67% 6.67% 13.33%
Palo Verde 3 4 7 57.14% 14.29% 14.29% 14.29%
Palomar 9 13 22 63.64% 9.09% 9.09% 9.09% 4.55% 4.55%
Pasadena 20 16 36 58.33% 16.67% 5.56% 19.44%
Note: Employee Ethnicity is determined from (EB04) Employee-Ethnicity as reported by the district. Ethnicity is collapsed to the first position. Employee Gender is determined from (EB03) Gender as reported by the district.
Data Element Definitions: California Community Colleges Management Information System Data Element Dictionary
All Districts Reporting
Data Source: CCCCO MIS Database for the reporting period Fall Term 2010 Page 23 of 104
June 30, 2011
California Community Colleges Chancellor's OfficeReport on Staffing for Fall 2010
Employee Category Ethnicity/Gender Headcount Distribution by District
Educational Administrator
DistrictwideHeadcountMale #Female #
Two or More RacesUnknownWhite
Pacific Islander
Native AmericanHispanicFilipinoBlackAsian
Peralta 29 31 60 43.33% 8.33% 3.33% 8.33% 36.67%
Rancho Santiago 22 28 50 54.00% 8.00% 34.00% 4.00%
Redwoods 8 14 22 72.73% 9.09% 4.55% 13.64%
Rio Hondo 13 10 23 39.13% 8.70% 34.78% 4.35% 4.35% 8.70%
Riverside 25 30 55 52.73% 9.09% 23.64% 1.82% 12.73%
San Bernardino 16 18 34 50.00% 5.88% 8.82% 17.65% 17.65%
San Diego 51 44 95 51.58% 7.37% 8.42% 24.21% 8.42%
San Francisco 20 23 43 44.19% 18.60% 20.93% 16.28%
San Joaquin Delta 7 5 12 50.00% 16.67% 16.67% 16.67%
San Jose-Evergreen 12 10 22 22.73% 18.18% 36.36% 4.55% 18.18%
San Luis Obispo 7 7 14 64.29% 7.14% 21.43% 7.14%
San Mateo 14 17 31 70.97% 3.23% 16.13% 6.45% 3.23%
Santa Barbara 1 1 100.00%
Santa Clarita 16 13 29 86.21% 13.79%
Santa Monica 13 31 44 38.64% 13.64% 11.36% 15.91% 2.27% 18.18%
Sequoias 17 20 37 72.97% 13.51% 8.11% 5.41%
Shasta-Tehama-Trinity 17 10 27 85.19% 11.11% 3.70%
Sierra 6 13 19 68.42% 5.26% 5.26% 21.05%
Siskiyous 3 2 5 100.00%
Solano 7 4 11 63.64% 9.09% 9.09% 18.18%
Sonoma 17 19 36 83.33% 11.11% 2.78% 2.78%
South Orange 21 10 31 90.32% 3.23% 6.45%
Southwestern 9 14 23 47.83% 8.70% 17.39% 8.70% 4.35% 13.04%
State Center 30 23 53 64.15% 7.55% 18.87% 1.89% 7.55%
Ventura 10 17 27 74.07% 7.41% 14.81% 3.70%
Victor Valley 6 7 13 53.85% 7.69% 7.69% 7.69% 23.08%
West Hills 31 32 63 57.14% 1.59% 28.57% 1.59% 4.76% 6.35%
West Kern 5 1 6 66.67% 16.67% 16.67%
West Valley-Mission 10 9 19 57.89% 10.53% 10.53% 10.53% 5.26% 5.26%
Yosemite 21 11 32 78.13% 6.25% 12.50% 3.13%
Yuba 13 11 24 75.00% 20.83% 4.17%
Statewide Total: 1,036 984 2,020 1.49% 14.95% 0.79% 0.35% 60.35% 5.69% 0.59% 10.00% 5.79%
Note: Employee Ethnicity is determined from (EB04) Employee-Ethnicity as reported by the district. Ethnicity is collapsed to the first position. Employee Gender is determined from (EB03) Gender as reported by the district.
Data Element Definitions: California Community Colleges Management Information System Data Element Dictionary
All Districts Reporting
Data Source: CCCCO MIS Database for the reporting period Fall Term 2010 Page 24 of 104
June 30, 2011

California Community Colleges Chancellor's OfficeReport on Staffing for Fall 2010
Employee Category Ethnicity/Gender Headcount Distribution by District
Tenured/Tenure Track
DistrictwideHeadcountMale #Female #
Two or More RacesUnknownWhite
Pacific Islander
Native AmericanHispanicFilipinoBlackAsian
Allan Hancock 70 82 152 75.66% 3.95% 1.97% 13.16% 1.97% .66% 2.63%
Antelope Valley 93 90 183 77.05% 4.37% 7.65% .55% 3.28% 7.10%
Barstow 22 17 39 76.92% 2.56% 7.69% 5.13% 2.56% 5.13%
Butte 83 92 175 88.57% 4.00% 5.71% 1.14% .57%
Cabrillo 94 114 208 77.88% 3.85% .48% 15.38% .96% 1.44%
Cerritos 125 152 277 66.06% 9.03% 19.13% .72% 5.05%
Chabot-Las Positas 134 150 284 64.08% 8.45% 2.11% 10.21% .70% 9.51% .70% 4.23%
Chaffey 80 122 202 65.84% 6.44% 15.84% .99% 3.96% 6.93%
Citrus 84 84 168 62.50% 9.52% .60% 17.26% 2.38% 1.19% 6.55%
Coast 203 229 432 72.45% 7.87% .23% 11.34% .69% 3.24% .46% 3.70%
Compton 46 38 84 27.38% 7.14% 1.19% 15.48% 1.19% 47.62%
Contra Costa 205 239 444 58.33% 6.53% .90% 11.49% .45% 13.06% .68% 8.56%
Copper Mountain 16 15 31 87.10% 6.45% 3.23% 3.23%
Desert 56 51 107 77.57% 1.87% .93% 10.28% .93% 3.74% 4.67%
El Camino 153 177 330 68.48% 10.30% .91% 11.21% .30% 1.52% 7.27%
Feather River 15 10 25 96.00% 4.00%
Foothill-Deanza 224 283 507 60.55% 14.00% 1.38% 11.64% .79% 5.33% .39% 5.92%
Gavilan 30 49 79 50.63% 5.06% 1.27% 20.25% 21.52% 1.27%
Glendale 106 127 233 74.25% 7.30% 4.29% 8.58% 1.29% .43% 2.15% 1.72%
Grossmont-Cuyamaca 140 166 306 74.51% 5.88% 1.31% 13.40% .98% .33% 3.59%
Hartnell 43 43 86 61.63% 6.98% 1.16% 23.26% 2.33% 4.65%
Imperial 81 59 140 72.14% 1.43% .71% 22.86% .71% 2.14%
Kern 184 189 373 75.60% 2.95% 9.12% .54% 7.77% .27% 3.75%
Lake Tahoe 19 21 40 90.00% 5.00% 2.50% 2.50%
Lassen 20 20 40 95.00% 5.00%
Long Beach 150 166 316 66.14% 10.44% 1.27% 11.39% .95% .32% 9.49%
Los Angeles 591 666 1,257 54.34% 9.31% 1.43% 16.31% .48% 3.98% .48% .24% 13.44%
Los Rios 458 561 1,019 57.90% 7.07% 1.18% 10.70% 1.37% 11.19% 4.22% .49% 5.89%
Marin 41 47 88 79.55% 4.55% 9.09% 6.82%
Mendocino-Lake 27 23 50 92.00% 2.00% 4.00% 2.00%
Merced 89 83 172 73.26% 5.81% 1.16% 12.21% 1.74% .58% 5.23%
Mira Costa 81 85 166 65.66% 7.23% 18.07% 1.20% 1.81% 6.02%
Monterey 62 54 116 79.31% 6.90% 8.62% .86% .86% 3.45%
Mt. San Antonio 187 199 386 65.80% 9.84% 1.30% 12.69% .52% 3.11% 1.04% 5.70%
Mt. San Jacinto 70 80 150 72.00% 5.33% 14.00% 1.33% 2.00% 1.33% 4.00%
Napa Valley 39 55 94 75.53% 1.06% 2.13% 17.02% 2.13% 2.13%
North Orange 243 291 534 42.70% 5.24% .19% 7.30% .37% 40.07% 2.06% .19% 1.87%
Ohlone 50 72 122 64.75% 17.21% 2.46% 9.02% 1.64% 1.64% 3.28%
Palo Verde 25 15 40 42.50% 7.50% 32.50% 10.00% 5.00% 2.50%
Palomar 145 128 273 79.12% 4.76% .37% 10.99% 1.47% 1.10% 2.20%
Pasadena 163 223 386 61.14% .78% 13.99% 1.55% 13.73% 8.81%
Peralta 139 168 307 50.81% 12.05% .65% 11.73% .65% 1.63% .33% 22.15%
Note: Employee Ethnicity is determined from (EB04) Employee-Ethnicity as reported by the district. Ethnicity is collapsed to the first position. Employee Gender is determined from (EB03) Gender as reported by the district.
Data Element Definitions: California Community Colleges Management Information System Data Element Dictionary
All Districts Reporting
Data Source: CCCCO MIS Database for the reporting period Fall Term 2010 Page 25 of 104
June 30, 2011

California Community Colleges Chancellor's OfficeReport on Staffing for Fall 2010
Employee Category Ethnicity/Gender Headcount Distribution by District
Tenured/Tenure Track
DistrictwideHeadcountMale #Female #
Two or More RacesUnknownWhite
Pacific Islander
Native AmericanHispanicFilipinoBlackAsian
Rancho Santiago 130 180 310 65.16% 8.39% .97% 18.39% 2.26% 1.29% 3.55%
Redwoods 55 38 93 82.80% 4.30% 4.30% 1.08% 7.53%
Rio Hondo 90 96 186 55.91% 7.53% 1.08% 29.57% 1.08% .54% .54% 3.76%
Riverside 177 190 367 67.03% 6.81% .54% 16.35% .82% 3.27% 5.18%
San Bernardino 96 126 222 61.26% 6.31% 2.25% 13.51% 1.35% 15.32%
San Diego 307 375 682 58.80% 6.16% .59% 13.34% .59% 12.02% 8.50%
San Francisco 313 480 793 57.63% 16.77% 3.03% 11.10% .50% 3.40% .13% .25% 7.19%
San Joaquin Delta 107 107 214 59.35% 5.61% 2.34% 7.01% 1.87% 18.69% .47% 4.67%
San Jose-Evergreen 92 124 216 46.76% 18.06% 2.31% 20.83% .46% 2.78% 8.80%
San Luis Obispo 74 82 156 85.90% 1.92% 8.33% 1.28% 2.56%
San Mateo 143 164 307 62.54% 11.07% 3.91% 12.05% .33% 3.58% 6.51%
Santa Barbara 104 109 213 82.16% 1.41% 14.08% .47% 1.88%
Santa Clarita 82 102 184 78.26% 5.98% 10.33% 1.09% 1.09% 3.26%
Santa Monica 130 177 307 61.89% 8.14% .98% 12.70% 4.56% 11.73%
Sequoias 72 85 157 64.33% 2.55% .64% 18.47% .64% 8.92% 1.27% 3.18%
Shasta-Tehama-Trinity 68 55 123 87.80% 1.63% 5.69% 2.44% .81% 1.63%
Sierra 85 130 215 80.47% 4.19% 5.12% .47% 6.05% .47% 3.26%
Siskiyous 30 19 49 26.53% 2.04% 2.04% 67.35% 2.04%
Solano 66 89 155 79.35% 3.87% 9.68% 7.10%
Sonoma 121 170 291 84.19% 3.44% .69% 6.53% 1.72% 1.72% 1.72%
South Orange 164 186 350 72.29% 7.71% .29% 10.57% 1.43% 4.29% .29% 3.14%
Southwestern 105 119 224 52.23% 4.46% 2.68% 27.68% .89% 6.25% 1.34% 4.46%
State Center 259 233 492 61.59% 4.47% .20% 17.07% 2.03% 10.57% .41% 3.66%
Ventura 171 209 380 64.74% 5.79% 1.05% 18.68% .79% 3.68% .79% .53% 3.95%
Victor Valley 71 59 130 74.62% 3.08% .77% 12.31% 3.85% 5.38%
West Hills 32 27 59 81.36% 1.69% 10.17% 1.69% 1.69% 3.39%
West Kern 22 28 50 80.00% 2.00% 10.00% 2.00% 2.00% 4.00%
West Valley-Mission 118 186 304 67.43% 15.13% .66% 10.86% .33% .33% .66% 4.61%
Yosemite 140 144 284 72.89% 2.82% 8.45% .70% 11.97% 3.17%
Yuba 58 76 134 76.12% 7.46% .75% 10.45% 1.49% 3.73%
Statewide Total: 9,700 8,368 18,068 1.01% 12.81% 0.92% 0.55% 65.18% 5.56% 0.53% 6.14% 7.30%
Note: Employee Ethnicity is determined from (EB04) Employee-Ethnicity as reported by the district. Ethnicity is collapsed to the first position. Employee Gender is determined from (EB03) Gender as reported by the district.
Data Element Definitions: California Community Colleges Management Information System Data Element Dictionary
All Districts Reporting
Data Source: CCCCO MIS Database for the reporting period Fall Term 2010 Page 26 of 104
June 30, 2011

California Community Colleges Chancellor's OfficeReport on Staffing for Fall 2010
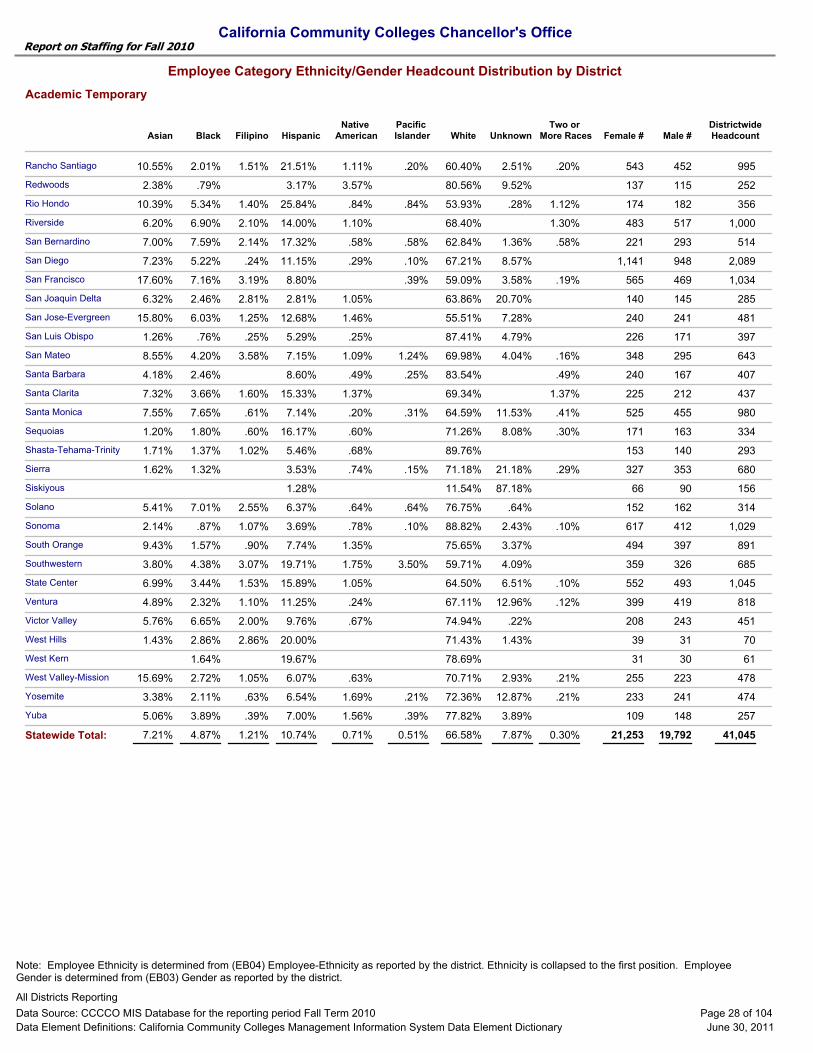
Employee Category Ethnicity/Gender Headcount Distribution by District
Academic Temporary
DistrictwideHeadcountMale #Female #
Two or More RacesUnknownWhite
Pacific Islander
Native AmericanHispanicFilipinoBlackAsian
Allan Hancock 224 227 451 78.27% 1.33% 1.11% 15.52% .89% .89% .22% .22% 1.55%
Antelope Valley 229 184 413 70.22% 4.84% .97% 7.02% 1.45% 7.75% .24% 7.51%
Barstow 65 45 110 72.73% 2.73% 10.91% 2.73% 4.55% 6.36%
Butte 288 264 552 88.04% 1.99% 6.16% .72% 2.17% .91%
Cabrillo 151 232 383 81.72% 2.61% .52% 9.66% .26% 3.92% .78% .52%
Cerritos 227 238 465 60.22% 11.40% .86% 20.43% .65% .65% 5.81%
Chabot-Las Positas 297 294 591 66.33% 9.64% 1.02% 8.12% .34% 10.66% .34% 3.55%
Chaffey 278 347 625 63.68% 7.04% 2.88% 12.64% .48% 4.00% .16% 9.12%
Citrus 130 131 261 60.54% 14.94% .38% 16.86% 1.92% 1.92% 3.45%
Coast 522 544 1,066 74.58% 11.44% .66% 8.35% .38% 2.81% .38% 1.41%
Compton 117 104 221 38.01% 5.88% 2.26% 15.84% .45% 5.43% .45% 31.67%
Contra Costa 463 481 944 60.17% 6.14% 1.69% 5.83% .32% 17.58% .21% 8.05%
Copper Mountain 43 56 99 84.85% 1.01% 7.07% 4.04% 2.02% 1.01%
Desert 180 179 359 74.65% 1.11% .56% 18.11% 1.11% 1.95% .28% 2.23%
El Camino 231 281 512 60.94% 15.82% 1.56% 9.18% .39% 4.10% 8.01%
Feather River 28 35 63 92.06% 1.59% 4.76% 1.59%
Foothill-Deanza 387 435 822 66.67% 14.96% .97% 5.23% .73% 8.64% .36% 2.43%
Gavilan 82 126 208 67.31% 9.62% 12.98% 8.17% 1.92%
Glendale 253 277 530 75.47% 6.60% 1.32% 9.43% .94% .57% 3.02% 2.64%
Grossmont-Cuyamaca 417 497 914 76.37% 4.16% 1.86% 11.82% .77% 1.53% .11% 3.39%
Hartnell 122 101 223 61.43% 8.52% 2.69% 22.87% .45% .90% .45% 2.69%
Imperial 118 92 210 35.71% 1.90% .95% 48.10% .95% 9.05% 3.33%
Kern 232 258 490 77.76% 1.02% 10.82% .82% 6.94% .20% 2.45%
Lake Tahoe 45 77 122 90.98% 2.46% 3.28% 2.46% .82%
Lassen 54 43 97 85.57% 11.34% 2.06% 1.03%
Long Beach 263 351 614 69.38% 9.45% 1.30% 13.68% .65% .65% 4.89%
Los Angeles 1,738 1,492 3,230 51.64% 9.47% 1.08% 12.45% .31% 13.25% .12% .15% 11.52%
Los Rios 730 748 1,478 69.08% 6.83% 1.01% 7.24% .54% 8.12% 2.17% .47% 4.53%
Marin 104 147 251 84.86% 5.18% 4.78% 1.59% 1.59% 1.99%
Mendocino-Lake 116 146 262 88.93% 2.29% 3.82% 1.53% .76% 1.15% 1.15% .38%
Merced 178 173 351 73.50% 5.13% .85% 10.26% 1.42% 5.41% .85% 2.56%
Mira Costa 181 291 472 73.52% 4.03% 9.32% 1.06% 8.47% .64% .21% 2.75%
Monterey 115 157 272 79.78% 5.88% 1.47% 6.99% .74% 1.10% 1.47% .74% 1.84%
Mt. San Antonio 397 428 825 58.67% 13.45% 2.18% 14.42% .85% 4.48% .85% 5.09%
Mt. San Jacinto 284 277 561 69.52% 4.46% .53% 10.52% 1.07% 8.38% .36% .18% 4.99%
Napa Valley 139 140 279 81.36% 3.94% 1.08% 7.89% .36% 2.15% .36% 2.87%
North Orange 533 603 1,136 24.82% 5.55% .79% 6.78% 59.68% 1.23% .09% 1.06%
Ohlone 150 176 326 63.19% 16.26% 2.45% 8.90% .92% 4.29% .31% .31% 3.37%
Palo Verde 40 41 81 66.67% 2.47% 13.58% 14.81% 1.23% 1.23%
Palomar 429 419 848 77.36% 3.42% 1.65% 12.38% 1.30% 1.30% .71% 1.89%
Pasadena 335 338 673 64.93% .74% .74% 13.67% .74% 10.70% 8.47%
Peralta 344 405 749 52.87% 11.35% 1.87% 5.74% .40% 9.61% .27% 17.89%
Note: Employee Ethnicity is determined from (EB04) Employee-Ethnicity as reported by the district. Ethnicity is collapsed to the first position. Employee Gender is determined from (EB03) Gender as reported by the district.
Data Element Definitions: California Community Colleges Management Information System Data Element Dictionary
All Districts Reporting
Data Source: CCCCO MIS Database for the reporting period Fall Term 2010 Page 27 of 104
June 30, 2011
California Community Colleges Chancellor's OfficeReport on Staffing for Fall 2010
Employee Category Ethnicity/Gender Headcount Distribution by District
Academic Temporary
DistrictwideHeadcountMale #Female #
Two or More RacesUnknownWhite
Pacific Islander
Native AmericanHispanicFilipinoBlackAsian
Rancho Santiago 452 543 995 60.40% 10.55% 1.51% 21.51% 1.11% 2.51% .20% .20% 2.01%
Redwoods 115 137 252 80.56% 2.38% 3.17% 3.57% 9.52% .79%
Rio Hondo 182 174 356 53.93% 10.39% 1.40% 25.84% .84% .28% 1.12% .84% 5.34%
Riverside 517 483 1,000 68.40% 6.20% 2.10% 14.00% 1.10% 1.30% 6.90%
San Bernardino 293 221 514 62.84% 7.00% 2.14% 17.32% .58% 1.36% .58% .58% 7.59%
San Diego 948 1,141 2,089 67.21% 7.23% .24% 11.15% .29% 8.57% .10% 5.22%
San Francisco 469 565 1,034 59.09% 17.60% 3.19% 8.80% 3.58% .19% .39% 7.16%
San Joaquin Delta 145 140 285 63.86% 6.32% 2.81% 2.81% 1.05% 20.70% 2.46%
San Jose-Evergreen 241 240 481 55.51% 15.80% 1.25% 12.68% 1.46% 7.28% 6.03%
San Luis Obispo 171 226 397 87.41% 1.26% .25% 5.29% .25% 4.79% .76%
San Mateo 295 348 643 69.98% 8.55% 3.58% 7.15% 1.09% 4.04% .16% 1.24% 4.20%
Santa Barbara 167 240 407 83.54% 4.18% 8.60% .49% .49% .25% 2.46%
Santa Clarita 212 225 437 69.34% 7.32% 1.60% 15.33% 1.37% 1.37% 3.66%
Santa Monica 455 525 980 64.59% 7.55% .61% 7.14% .20% 11.53% .41% .31% 7.65%
Sequoias 163 171 334 71.26% 1.20% .60% 16.17% .60% 8.08% .30% 1.80%
Shasta-Tehama-Trinity 140 153 293 89.76% 1.71% 1.02% 5.46% .68% 1.37%
Sierra 353 327 680 71.18% 1.62% 3.53% .74% 21.18% .29% .15% 1.32%
Siskiyous 90 66 156 11.54% 1.28% 87.18%
Solano 162 152 314 76.75% 5.41% 2.55% 6.37% .64% .64% .64% 7.01%
Sonoma 412 617 1,029 88.82% 2.14% 1.07% 3.69% .78% 2.43% .10% .10% .87%
South Orange 397 494 891 75.65% 9.43% .90% 7.74% 1.35% 3.37% 1.57%
Southwestern 326 359 685 59.71% 3.80% 3.07% 19.71% 1.75% 4.09% 3.50% 4.38%
State Center 493 552 1,045 64.50% 6.99% 1.53% 15.89% 1.05% 6.51% .10% 3.44%
Ventura 419 399 818 67.11% 4.89% 1.10% 11.25% .24% 12.96% .12% 2.32%
Victor Valley 243 208 451 74.94% 5.76% 2.00% 9.76% .67% .22% 6.65%
West Hills 31 39 70 71.43% 1.43% 2.86% 20.00% 1.43% 2.86%
West Kern 30 31 61 78.69% 19.67% 1.64%
West Valley-Mission 223 255 478 70.71% 15.69% 1.05% 6.07% .63% 2.93% .21% 2.72%
Yosemite 241 233 474 72.36% 3.38% .63% 6.54% 1.69% 12.87% .21% .21% 2.11%
Yuba 148 109 257 77.82% 5.06% .39% 7.00% 1.56% 3.89% .39% 3.89%
Statewide Total: 21,253 19,792 41,045 1.21% 10.74% 0.71% 0.51% 66.58% 7.87% 0.30% 4.87% 7.21%
Note: Employee Ethnicity is determined from (EB04) Employee-Ethnicity as reported by the district. Ethnicity is collapsed to the first position. Employee Gender is determined from (EB03) Gender as reported by the district.
Data Element Definitions: California Community Colleges Management Information System Data Element Dictionary
All Districts Reporting
Data Source: CCCCO MIS Database for the reporting period Fall Term 2010 Page 28 of 104
June 30, 2011

California Community Colleges Chancellor's OfficeReport on Staffing for Fall 2010
Employee Category Ethnicity/Gender Headcount Distribution by District
Classified Administrator
DistrictwideHeadcountMale #Female #
Two or More RacesUnknownWhite
Pacific Islander
Native AmericanHispanicFilipinoBlackAsian
Allan Hancock 4 4 75.00% 25.00%
Antelope Valley
Barstow 1 9 10 60.00% 20.00% 10.00% 10.00%
Butte 12 14 26 96.15% 3.85%
Cabrillo 7 12 19 73.68% 5.26% 15.79% 5.26%
Cerritos 11 15 26 65.38% 3.85% 30.77%
Chabot-Las Positas 15 23 38 57.89% 7.89% 7.89% 7.89% 2.63% 13.16% 2.63%
Chaffey 6 11 17 58.82% 5.88% 5.88% 23.53% 5.88%
Citrus 3 3 6 83.33% 16.67%
Coast 38 45 83 74.70% 6.02% 1.20% 9.64% 3.61% 4.82%
Compton 5 2 7 14.29% 14.29% 28.57% 42.86%
Contra Costa 26 24 50 58.00% 8.00% 4.00% 10.00% 8.00% 12.00%
Copper Mountain
Desert 6 2 8 75.00% 25.00%
El Camino 20 12 32 65.63% 3.13% 18.75% 12.50%
Feather River 6 10 16 100.00%
Foothill-Deanza 16 17 33 57.58% 9.09% 3.03% 15.15% 3.03% 12.12%
Gavilan 2 4 6 66.67% 33.33%
Glendale 17 15 32 62.50% 9.38% 6.25% 15.63% 6.25%
Grossmont-Cuyamaca 7 3 10 80.00% 20.00%
Hartnell 10 9 19 52.63% 5.26% 36.84% 5.26%
Imperial 1 1 100.00%
Kern 22 31 53 71.70% 1.89% 1.89% 9.43% 1.89% 11.32% 1.89%
Lake Tahoe 2 2 50.00% 50.00%
Lassen 5 4 9 100.00%
Long Beach 11 9 20 60.00% 20.00% 5.00% 5.00% 10.00%
Los Angeles 30 10 40 50.00% 10.00% 7.50% 12.50% 15.00% 5.00%
Los Rios 23 17 40 62.50% 5.00% 2.50% 7.50% 5.00% 2.50% 15.00%
Marin 1 1 2 50.00% 50.00%
Mendocino-Lake 5 7 12 83.33% 16.67%
Merced 10 16 26 73.08% 3.85% 11.54% 11.54%
Mira Costa 4 10 14 64.29% 7.14% 14.29% 7.14% 7.14%
Monterey 5 7 12 58.33% 8.33% 8.33% 8.33% 8.33% 8.33%
Mt. San Antonio 16 19 35 54.29% 22.86% 2.86% 8.57% 11.43%
Mt. San Jacinto 1 9 10 50.00% 10.00% 20.00% 10.00% 10.00%
Napa Valley 4 9 13 100.00%
North Orange 22 27 49 48.98% 12.24% 6.12% 22.45% 2.04% 8.16%
Ohlone 16 11 27 62.96% 14.81% 11.11% 3.70% 7.41%
Palo Verde
Palomar 10 7 17 64.71% 29.41% 5.88%
Pasadena 3 6 9 44.44% 11.11% 11.11% 33.33%
Peralta
Note: Employee Ethnicity is determined from (EB04) Employee-Ethnicity as reported by the district. Ethnicity is collapsed to the first position. Employee Gender is determined from (EB03) Gender as reported by the district.
Data Element Definitions: California Community Colleges Management Information System Data Element Dictionary
All Districts Reporting
Data Source: CCCCO MIS Database for the reporting period Fall Term 2010 Page 29 of 104
June 30, 2011

California Community Colleges Chancellor's OfficeReport on Staffing for Fall 2010
Employee Category Ethnicity/Gender Headcount Distribution by District
Classified Administrator
DistrictwideHeadcountMale #Female #
Two or More RacesUnknownWhite
Pacific Islander
Native AmericanHispanicFilipinoBlackAsian
Rancho Santiago 4 3 7 42.86% 14.29% 28.57% 14.29%
Redwoods 13 20 33 81.82% 6.06% 3.03% 3.03% 3.03% 3.03%
Rio Hondo 7 2 9 55.56% 44.44%
Riverside 26 14 40 62.50% 5.00% 2.50% 27.50% 2.50%
San Bernardino 25 10 35 71.43% 2.86% 14.29% 2.86% 8.57%
San Diego
San Francisco 2 2 100.00%
San Joaquin Delta 12 26 38 44.74% 2.63% 5.26% 10.53% 31.58% 5.26%
San Jose-Evergreen 13 10 23 39.13% 17.39% 8.70% 21.74% 4.35% 4.35% 4.35%
San Luis Obispo 7 4 11 72.73% 18.18% 9.09%
San Mateo 8 8 16 81.25% 6.25% 6.25% 6.25%
Santa Barbara 27 26 53 75.47% 1.89% 18.87% 1.89% 1.89%
Santa Clarita 28 30 58 82.76% 3.45% 8.62% 1.72% 3.45%
Santa Monica 36 17 53 54.72% 9.43% 1.89% 15.09% 1.89% 1.89% 15.09%
Sequoias 2 1 3 33.33% 66.67%
Shasta-Tehama-Trinity 4 11 15 93.33% 6.67%
Sierra 12 12 24 87.50% 4.17% 8.33%
Siskiyous 1 1 100.00%
Solano 6 5 11 72.73% 9.09% 18.18%
Sonoma 3 4 7 71.43% 14.29% 14.29%
South Orange 20 30 50 86.00% 2.00% 2.00% 8.00% 2.00%
Southwestern 18 16 34 41.18% 14.71% 29.41% 2.94% 11.76%
State Center 16 14 30 66.67% 6.67% 13.33% 3.33% 10.00%
Ventura 3 4 7 57.14% 14.29% 28.57%
Victor Valley 1 1 100.00%
West Hills 1 1 100.00%
West Kern 7 2 9 77.78% 11.11% 11.11%
West Valley-Mission 7 8 15 53.33% 13.33% 6.67% 20.00% 6.67%
Yosemite 13 37 50 60.00% 2.00% 20.00% 10.00% 8.00%
Yuba 10 7 17 64.71% 11.76% 17.65% 5.88%
Statewide Total: 757 729 1,486 2.15% 13.73% 0.74% 0.34% 65.95% 5.05% 0.34% 6.12% 5.59%
Note: Employee Ethnicity is determined from (EB04) Employee-Ethnicity as reported by the district. Ethnicity is collapsed to the first position. Employee Gender is determined from (EB03) Gender as reported by the district.
Data Element Definitions: California Community Colleges Management Information System Data Element Dictionary
All Districts Reporting
Data Source: CCCCO MIS Database for the reporting period Fall Term 2010 Page 30 of 104
June 30, 2011

California Community Colleges Chancellor's OfficeReport on Staffing for Fall 2010
Employee Category Ethnicity/Gender Headcount Distribution by District
Classified Professional
DistrictwideHeadcountMale #Female #
Two or More RacesUnknownWhite
Pacific Islander
Native AmericanHispanicFilipinoBlackAsian
Allan Hancock 5 20 25 84.00% 12.00% 4.00%
Antelope Valley 17 19 36 75.00% 2.78% 5.56% 5.56% 11.11%
Barstow
Butte 14 9 23 78.26% 13.04% 8.70%
Cabrillo
Cerritos 6 6 16.67% 16.67% 66.67%
Chabot-Las Positas 1 1 100.00%
Chaffey 6 15 21 57.14% 4.76% 23.81% 4.76% 9.52%
Citrus 9 24 33 54.55% 15.15% 3.03% 24.24% 3.03%
Coast 3 3 33.33% 33.33% 33.33%
Compton 14 14 28.57% 71.43%
Contra Costa 23 41 64 51.56% 7.81% 9.38% 15.63% 4.69% 10.94%
Copper Mountain 2 3 5 80.00% 20.00%
Desert 7 4 11 45.45% 9.09% 9.09% 27.27% 9.09%
El Camino 11 46 57 29.82% 12.28% 1.75% 29.82% 1.75% 1.75% 22.81%
Feather River 1 1 2 100.00%
Foothill-Deanza 69 95 164 53.05% 22.56% 1.22% 9.76% .61% 7.32% 1.22% 4.27%
Gavilan 5 8 13 46.15% 7.69% 23.08% 23.08%
Glendale 1 12 13 76.92% 15.38% 7.69%
Grossmont-Cuyamaca 11 22 33 75.76% 3.03% 6.06% 3.03% 12.12%
Hartnell 1 9 10 20.00% 70.00% 10.00%
Imperial 9 10 19 31.58% 15.79% 36.84% 10.53% 5.26%
Kern 19 38 57 57.89% 8.77% 21.05% 1.75% 7.02% 3.51%
Lake Tahoe 3 1 4 75.00% 25.00%
Lassen 3 4 7 100.00%
Long Beach 16 11 27 51.85% 22.22% 14.81% 11.11%
Los Angeles 87 132 219 26.48% 19.63% 9.59% 12.79% 1.37% 13.24% .46% 16.44%
Los Rios 36 42 78 58.97% 19.23% 2.56% 5.13% 1.28% 3.85% 5.13% 3.85%
Marin 4 12 16 68.75% 12.50% 12.50% 6.25%
Mendocino-Lake
Merced 2 2 50.00% 50.00%
Mira Costa 4 14 18 83.33% 5.56% 11.11%
Monterey 3 14 17 52.94% 11.76% 5.88% 29.41%
Mt. San Antonio 4 4 25.00% 50.00% 25.00%
Mt. San Jacinto 30 52 82 67.07% 3.66% 1.22% 17.07% 1.22% 2.44% 7.32%
Napa Valley 5 5 80.00% 20.00%
North Orange 1 1 100.00%
Ohlone 2 17 19 36.84% 36.84% 10.53% 10.53% 5.26%
Palo Verde 3 3 66.67% 33.33%
Palomar 11 26 37 72.97% 5.41% 2.70% 13.51% 5.41%
Pasadena
Peralta 23 64 87 17.24% 21.84% 6.90% 6.90% 10.34% 36.78%
Note: Employee Ethnicity is determined from (EB04) Employee-Ethnicity as reported by the district. Ethnicity is collapsed to the first position. Employee Gender is determined from (EB03) Gender as reported by the district.
Data Element Definitions: California Community Colleges Management Information System Data Element Dictionary
All Districts Reporting
Data Source: CCCCO MIS Database for the reporting period Fall Term 2010 Page 31 of 104
June 30, 2011

California Community Colleges Chancellor's OfficeReport on Staffing for Fall 2010
Employee Category Ethnicity/Gender Headcount Distribution by District
Classified Professional
DistrictwideHeadcountMale #Female #
Two or More RacesUnknownWhite
Pacific Islander
Native AmericanHispanicFilipinoBlackAsian
Rancho Santiago 9 28 37 35.14% 18.92% 10.81% 29.73% 5.41%
Redwoods 18 38 56 75.00% 10.71% 5.36% 5.36% 1.79% 1.79%
Rio Hondo 1 2 3 33.33% 33.33% 33.33%
Riverside 15 29 44 61.36% 4.55% 27.27% 2.27% 4.55%
San Bernardino 9 39 48 39.58% 6.25% 6.25% 27.08% 2.08% 4.17% 14.58%
San Diego 25 48 73 43.84% 8.22% 5.48% 13.70% 10.96% 17.81%
San Francisco 23 57 80 30.00% 31.25% 21.25% 6.25% 3.75% 7.50%
San Joaquin Delta 8 8 16 68.75% 6.25% 6.25% 12.50% 6.25%
San Jose-Evergreen 10 11 21 47.62% 23.81% 19.05% 4.76% 4.76%
San Luis Obispo 8 10 18 72.22% 22.22% 5.56%
San Mateo 30 40 70 58.57% 17.14% 7.14% 12.86% 2.86% 1.43%
Santa Barbara 27 75 102 64.71% 4.90% 25.49% .98% .98% 2.94%
Santa Clarita 1 6 7 85.71% 14.29%
Santa Monica
Sequoias 2 6 8 62.50% 12.50% 12.50% 12.50%
Shasta-Tehama-Trinity
Sierra
Siskiyous 9 15 24 16.67% 83.33%
Solano 3 4 7 42.86% 14.29% 14.29% 14.29% 14.29%
Sonoma 22 39 61 91.80% 1.64% 1.64% 3.28% 1.64%
South Orange 6 9 15 93.33% 6.67%
Southwestern
State Center 15 14 29 55.17% 10.34% 13.79% 3.45% 13.79% 3.45%
Ventura 9 15 24 75.00% 12.50% 8.33% 4.17%
Victor Valley 14 9 23 65.22% 4.35% 21.74% 8.70%
West Hills 11 61 72 11.11% 2.78% 1.39% 81.94% 2.78%
West Kern 3 11 14 78.57% 21.43%
West Valley-Mission 16 24 40 65.00% 17.50% 2.50% 10.00% 2.50% 2.50%
Yosemite 7 18 25 64.00% 12.00% 8.00% 8.00% 8.00%
Yuba 13 13 53.85% 23.08% 23.08%
Statewide Total: 1,429 737 2,166 3.88% 17.22% 0.83% 0.51% 51.06% 5.86% 0.37% 8.26% 12.00%
Note: Employee Ethnicity is determined from (EB04) Employee-Ethnicity as reported by the district. Ethnicity is collapsed to the first position. Employee Gender is determined from (EB03) Gender as reported by the district.
Data Element Definitions: California Community Colleges Management Information System Data Element Dictionary
All Districts Reporting
Data Source: CCCCO MIS Database for the reporting period Fall Term 2010 Page 32 of 104
June 30, 2011

California Community Colleges Chancellor's OfficeReport on Staffing for Fall 2010
Employee Category Ethnicity/Gender Headcount Distribution by District
Classified Support
DistrictwideHeadcountMale #Female #
Two or More RacesUnknownWhite
Pacific Islander
Native AmericanHispanicFilipinoBlackAsian
Allan Hancock 68 119 187 61.50% 2.14% 1.07% 30.48% 1.07% 3.74%
Antelope Valley 65 129 194 61.34% 2.06% 2.06% 14.95% .52% 5.67% .52% 12.89%
Barstow 18 33 51 49.02% 7.84% 29.41% 3.92% 1.96% 1.96% 5.88%
Butte 118 152 270 80.74% 5.19% 1.11% 8.52% 3.33% .37% .74%
Cabrillo 77 183 260 64.23% 1.15% 3.46% 25.38% 1.54% 1.92% 2.31%
Cerritos 119 197 316 42.09% 8.23% .32% 39.87% .63% 1.27% 7.59%
Chabot-Las Positas 130 226 356 45.51% 7.87% 6.46% 17.70% .84% 7.02% 1.40% .84% 12.36%
Chaffey 87 164 251 39.84% 7.97% 1.59% 35.86% 1.59% 3.19% .40% 9.56%
Citrus 124 167 291 54.30% 3.78% 1.72% 29.21% 1.03% 6.19% .34% 3.44%
Coast 292 471 763 48.49% 18.48% 1.97% 22.28% .26% 4.98% 1.31% 2.23%
Compton 48 59 107 3.74% 2.80% .93% 17.76% 9.35% 65.42%
Contra Costa 118 248 366 48.09% 7.92% 3.55% 16.94% .82% 7.10% .55% 15.03%
Copper Mountain 12 35 47 74.47% 4.26% 2.13% 2.13% 2.13% 2.13% 12.77%
Desert 73 126 199 53.77% 1.51% 2.01% 35.18% 1.01% 1.01% 5.53%
El Camino 160 191 351 34.76% 10.83% 3.99% 24.22% 1.71% .28% 2.85% 21.37%
Feather River 15 30 45 86.67% 2.22% 6.67% 4.44%
Foothill-Deanza 196 254 450 40.89% 17.78% 4.22% 22.44% .67% 6.89% .67% 1.56% 4.89%
Gavilan 29 84 113 33.63% 1.77% .88% 55.75% 5.31% 2.65%
Glendale 108 200 308 60.06% 3.57% 4.87% 24.03% .65% .32% 1.30% 5.19%
Grossmont-Cuyamaca 151 242 393 61.32% 5.60% 3.31% 19.59% 2.54% .51% .76% 6.36%
Hartnell 45 75 120 17.50% 6.67% 5.00% 62.50% 1.67% .83% 5.83%
Imperial 58 84 142 16.90% 72.54% 9.15% .70% .70%
Kern 112 287 399 52.13% 1.00% 2.51% 31.08% 1.75% 6.02% 5.51%
Lake Tahoe 19 34 53 79.25% 3.77% 3.77% 13.21%
Lassen 15 38 53 84.91% 5.66% 7.55% 1.89%
Long Beach 210 290 500 44.40% 11.40% 4.40% 22.60% 1.40% .80% 1.20% 13.80%
Los Angeles 909 919 1,828 25.05% 9.30% 4.49% 29.65% .16% 9.96% .49% .11% 20.79%
Los Rios 404 648 1,052 53.04% 9.98% 1.90% 14.35% 1.14% 6.84% 3.80% .38% 8.56%
Marin 80 112 192 69.27% 10.94% 3.13% 6.77% 2.08% .52% 7.29%
Mendocino-Lake 24 60 84 80.95% 1.19% 15.48% 1.19% 1.19%
Merced 102 151 253 49.80% 9.49% 1.19% 32.41% 2.77% .79% .40% 3.16%
Mira Costa 89 150 239 61.09% 8.37% 1.26% 19.25% 2.09% 2.51% .42% 5.02%
Monterey 72 112 184 56.52% 6.52% 2.17% 19.02% 1.09% 1.09% 3.26% 10.33%
Mt. San Antonio 240 315 555 36.04% 8.65% 3.96% 34.59% 1.44% 9.01% .54% 5.77%
Mt. San Jacinto 69 157 226 52.21% 3.10% 1.77% 31.42% 2.65% .88% 7.96%
Napa Valley 57 99 156 58.97% 3.85% 4.49% 20.51% 2.56% 2.56% 1.28% 5.77%
North Orange 263 368 631 31.70% 8.24% 1.27% 23.77% .48% 28.37% 1.74% .63% 3.80%
Ohlone 64 96 160 41.88% 21.88% 5.00% 15.63% 5.63% 1.25% 8.75%
Palo Verde 18 60 78 37.18% 50.00% 1.28% 5.13% 6.41%
Palomar 154 243 397 61.21% 3.78% 2.27% 26.45% 1.51% 1.26% .25% .25% 3.02%
Pasadena 157 210 367 42.23% 2.45% 28.88% 1.36% 8.17% 16.89%
Peralta 141 181 322 19.57% 19.25% 5.28% 12.73% .31% 10.25% 32.61%
Note: Employee Ethnicity is determined from (EB04) Employee-Ethnicity as reported by the district. Ethnicity is collapsed to the first position. Employee Gender is determined from (EB03) Gender as reported by the district.
Data Element Definitions: California Community Colleges Management Information System Data Element Dictionary
All Districts Reporting
Data Source: CCCCO MIS Database for the reporting period Fall Term 2010 Page 33 of 104
June 30, 2011

California Community Colleges Chancellor's OfficeReport on Staffing for Fall 2010
Employee Category Ethnicity/Gender Headcount Distribution by District
Classified Support
DistrictwideHeadcountMale #Female #
Two or More RacesUnknownWhite
Pacific Islander
Native AmericanHispanicFilipinoBlackAsian
Rancho Santiago 222 388 610 34.59% 15.41% 1.97% 43.28% .98% .16% .16% 3.44%
Redwoods 53 74 127 83.46% 3.94% .79% 6.30% 3.94% .79% .79%
Rio Hondo 81 172 253 20.55% 11.86% 65.61% .40% .40% .40% .79%
Riverside 226 330 556 44.96% 2.70% 1.26% 35.61% 1.08% 1.80% .72% 11.87%
San Bernardino 127 215 342 42.40% 5.26% .88% 34.21% 1.46% .29% 15.50%
San Diego 438 545 983 37.74% 14.45% 3.36% 20.24% .51% 10.27% .41% 13.02%
San Francisco 311 438 749 20.16% 37.65% 9.35% 16.82% .13% 3.47% .13% 1.07% 11.21%
San Joaquin Delta 133 322 455 39.34% 9.45% 4.62% 7.03% 1.10% 30.55% .66% 7.25%
San Jose-Evergreen 117 212 329 24.92% 20.97% 4.86% 40.12% .61% 3.04% .61% 4.86%
San Luis Obispo 85 145 230 74.78% 3.04% 1.30% 13.04% .87% 5.22% .87% .43% .43%
San Mateo 166 218 384 44.27% 15.36% 5.73% 21.61% .26% 5.47% .26% 3.13% 3.91%
Santa Barbara 113 176 289 56.06% 3.81% 35.64% .69% 1.04% .35% 2.42%
Santa Clarita 97 127 224 56.70% 4.02% 2.23% 29.46% 2.23% 1.34% .45% 3.57%
Santa Monica 218 243 461 35.57% 7.16% 2.60% 22.56% .22% 5.86% .65% 25.38%
Sequoias 59 142 201 53.23% 1.99% 1.99% 32.84% 1.99% 5.97% .50% 1.49%
Shasta-Tehama-Trinity 81 129 210 86.19% 3.81% 3.81% 3.33% .95% .95% .95%
Sierra 96 138 234 70.94% 3.42% 1.28% 7.69% 1.71% 14.10% .85%
Siskiyous 25 55 80 3.75% 2.50% 93.75%
Solano 51 106 157 57.32% 8.28% 7.64% 9.55% .64% 2.55% 2.55% 11.46%
Sonoma 156 242 398 71.86% 2.01% .50% 12.31% 1.51% 2.76% .25% .75% 8.04%
South Orange 234 298 532 57.89% 9.77% 1.50% 20.68% 1.13% 5.64% 3.38%
Southwestern 151 221 372 29.30% 8.87% 2.96% 46.77% .54% 5.91% 1.34% 4.30%
State Center 228 390 618 49.35% 5.66% 1.13% 29.45% 1.13% 5.34% .49% .32% 7.12%
Ventura 187 290 477 53.04% 3.56% 2.73% 31.45% 1.47% 3.56% .42% 3.77%
Victor Valley 59 126 185 54.59% 3.78% .54% 28.65% 2.16% 1.08% 9.19%
West Hills 53 201 254 30.71% 1.18% .79% 61.42% 1.18% .79% .39% 3.54%
West Kern 38 104 142 80.28% .70% 16.90% .70% 1.41%
West Valley-Mission 114 168 282 47.87% 17.73% 6.74% 21.99% 1.42% .35% 3.90%
Yosemite 211 435 646 55.26% 3.56% .62% 19.50% .46% 16.56% .46% .46% 3.10%
Yuba 59 116 175 64.57% 5.71% 1.14% 20.57% 1.14% 1.71% 1.14% 4.00%
Statewide Total: 14,765 9,499 24,264 2.84% 25.57% 0.98% 0.72% 45.61% 6.05% 0.53% 8.72% 8.98%
Note: Employee Ethnicity is determined from (EB04) Employee-Ethnicity as reported by the district. Ethnicity is collapsed to the first position. Employee Gender is determined from (EB03) Gender as reported by the district.
Data Element Definitions: California Community Colleges Management Information System Data Element Dictionary
All Districts Reporting
Data Source: CCCCO MIS Database for the reporting period Fall Term 2010 Page 34 of 104
June 30, 2011

California Community Colleges Chancellor's OfficeReport on Staffing for Fall 2010
Employee Category Age Headcount Distribution by District
Educational Administrator
<=34 Avg Age
Headcount65+60-6455-5950-5445-4940-4435-39 Unknown
7.4% 25.9% 55.4 3.7% 33.3% 11.1% 27Allan Hancock 18.5%
18.5% 57.2 14.8% 29.6% 7.4% 18.5% 27Antelope Valley 11.1%
40.0% 55.0 10.0% 20.0% 10.0% 20.0% 10Barstow
14.3% 33.3% 52.5 9.5% 23.8% 21Butte 19.0%
6.7% 26.7% 55.6 6.7% 20.0% 26.7% 15Cabrillo 13.3%
4.2% 25.0% 52.1 4.2% 20.8% 8.3% 8.3% 20.8% 24Cerritos 8.3%
18.2% 9.1% 54.5 4.5% 40.9% 4.5% 18.2% 22Chabot-Las Positas 4.5%
5.9% 23.5% 54.5 11.8% 11.8% 5.9% 17.6% 17Chaffey 23.5%
10.0% 26.7% 53.1 3.3% 23.3% 3.3% 6.7% 13.3% 30Citrus 13.3%
10.0% 26.0% 53.6 10.0% 16.0% 2.0% 4.0% 14.0% 50Coast 18.0%
42.9% 55.1 35.7% 14.3% 7.1% 14Compton
9.1% 21.8% 53.7 7.3% 20.0% 9.1% 20.0% 55Contra Costa 12.7%
9.1% 45.5% 52.0 18.2% 9.1% 9.1% 11Copper Mountain 9.1%
16.7% 55.4 5.6% 22.2% 5.6% 33.3% 18Desert 16.7%
4.0% 40.0% 56.2 8.0% 24.0% 4.0% 8.0% 25El Camino 12.0%
20.0% 52.2 40.0% 20.0% 5Feather River 20.0%
13.0% 28.3% 53.7 6.5% 19.6% 2.2% 4.3% 23.9% 46Foothill-Deanza 2.2%
15.8% 15.8% 55.3 10.5% 26.3% 5.3% 26.3% 19Gavilan
9.7% 16.1% 53.6 9.7% 25.8% 3.2% 6.5% 12.9% 31Glendale 16.1%
9.1% 24.2% 52.0 3.0% 12.1% 6.1% 21.2% 33Grossmont-Cuyamaca 24.2%
55.4 28.6% 28.6% 14.3% 14.3% 7Hartnell 14.3%
6.7% 33.3% 55.7 33.3% 6.7% 20.0% 15Imperial
10.3% 20.7% 53.1 13.8% 10.3% 3.4% 6.9% 31.0% 29Kern 3.4%
16.7% 33.3% 53.3 16.7% 16.7% 6Lake Tahoe 16.7%
66.7% 58.0 16.7% 16.7% 6Lassen
24.2% 9.1% 51.4 12.1% 15.2% 6.1% 3.0% 18.2% 33Long Beach 12.1%
14.0% 20.2% 52.0 11.4% 15.8% 5.3% 9.6% 8.8% 114Los Angeles 14.9%
6.3% 23.8% 54.2 2.5% 33.8% 5.0% 1.3% 13.8% 80Los Rios 13.8%
8.7% 13.0% 57.1 26.1% 26.1% 8.7% 13.0% 23Marin 4.3%
12.5% 12.5% 53.5 37.5% 12.5% 8Mendocino-Lake 25.0%
18.8% 51.9 18.8% 6.3% 6.3% 31.3% 16Merced 18.8%
Note: Employee age is calculated from data element (EB02) Employee-Birth-Date as reported by the district.
Data Element Definitions: California Community Colleges Management Information System Data Element Dictionary
All Districts Reporting
Data Source: CCCCO MIS Database for the reporting period Fall Term 2010 Page 35 of 104
June 30, 2011

California Community Colleges Chancellor's OfficeReport on Staffing for Fall 2010
Employee Category Age Headcount Distribution by District
Educational Administrator
<=34 Avg Age
Headcount65+60-6455-5950-5445-4940-4435-39 Unknown
6.7% 6.7% 54.4 6.7% 46.7% 6.7% 6.7% 6.7% 15Mira Costa 13.3%
50.0% 57.5 10.0% 20.0% 10.0% 10Monterey 10.0%
7.9% 23.7% 50.5 5.3% 10.5% 5.3% 13.2% 21.1% 38Mt. San Antonio 13.2%
14.3% 14.3% 51.9 28.6% 14.3% 21.4% 14Mt. San Jacinto 7.1%
6.3% 31.3% 51.9 6.3% 6.3% 31.3% 16Napa Valley 18.8%
6.1% 24.5% 52.5 2.0% 28.6% 2.0% 14.3% 16.3% 49North Orange 6.1%
6.7% 13.3% 54.9 40.0% 6.7% 33.3% 15Ohlone
28.6% 42.9% 56.0 28.6% 7Palo Verde
4.5% 31.8% 57.0 4.5% 36.4% 13.6% 22Palomar 9.1%
2.8% 33.3% 56.7 13.9% 25.0% 8.3% 13.9% 36Pasadena 2.8%
8.3% 11.7% 53.0 8.3% 25.0% 3.3% 6.7% 20.0% 60Peralta 16.7%
12.0% 28.0% 53.9 8.0% 20.0% 4.0% 12.0% 50Rancho Santiago 16.0%
13.6% 18.2% 50.1 4.5% 18.2% 9.1% 9.1% 13.6% 22Redwoods 13.6%
4.3% 21.7% 52.6 8.7% 17.4% 13.0% 4.3% 21.7% 23Rio Hondo 8.7%
3.6% 18.2% 53.7 10.9% 21.8% 5.5% 9.1% 20.0% 55Riverside 1.8% 9.1%
17.6% 23.5% 51.4 5.9% 8.8% 8.8% 20.6% 34San Bernardino 14.7%
5.3% 28.4% 54.5 5.3% 22.1% 4.2% 18.9% 95San Diego 15.8%
14.0% 23.3% 54.5 16.3% 18.6% 2.3% 4.7% 14.0% 43San Francisco 7.0%
25.0% 53.8 25.0% 16.7% 12San Joaquin Delta 33.3%
4.5% 18.2% 52.8 18.2% 4.5% 18.2% 22.7% 22San Jose-Evergreen 13.6%
14.3% 35.7% 55.4 7.1% 21.4% 7.1% 14San Luis Obispo 14.3%
3.2% 32.3% 56.5 12.9% 22.6% 3.2% 31San Mateo 25.8%
47.0 1Santa Barbara 100.0%
13.8% 17.2% 52.0 3.4% 24.1% 6.9% 3.4% 24.1% 29Santa Clarita 6.9%
15.9% 22.7% 50.5 4.5% 15.9% 4.5% 13.6% 13.6% 44Santa Monica 9.1%
16.2% 18.9% 49.9 2.7% 8.1% 5.4% 8.1% 29.7% 37Sequoias 10.8%
11.1% 18.5% 52.9 29.6% 3.7% 14.8% 27Shasta-Tehama-Trinity 22.2%
10.5% 5.3% 52.4 5.3% 15.8% 5.3% 42.1% 19Sierra 15.8%
20.0% 52.4 20.0% 20.0% 5Siskiyous 40.0%
9.1% 9.1% 52.9 18.2% 45.5% 11Solano 18.2%
2.8% 16.7% 56.2 11.1% 33.3% 2.8% 19.4% 36Sonoma 13.9%
Note: Employee age is calculated from data element (EB02) Employee-Birth-Date as reported by the district.
Data Element Definitions: California Community Colleges Management Information System Data Element Dictionary
All Districts Reporting
Data Source: CCCCO MIS Database for the reporting period Fall Term 2010 Page 36 of 104
June 30, 2011

California Community Colleges Chancellor's OfficeReport on Staffing for Fall 2010
Employee Category Age Headcount Distribution by District
Educational Administrator
<=34 Avg Age
Headcount65+60-6455-5950-5445-4940-4435-39 Unknown
6.5% 25.8% 56.7 22.6% 16.1% 3.2% 3.2% 6.5% 31South Orange 16.1%
13.0% 26.1% 54.3 4.3% 26.1% 4.3% 13.0% 23Southwestern 13.0%
15.1% 18.9% 53.9 5.7% 32.1% 7.5% 9.4% 53State Center 11.3%
11.1% 29.6% 54.4 3.7% 22.2% 25.9% 27Ventura 7.4%
15.4% 23.1% 55.4 15.4% 23.1% 7.7% 13Victor Valley 15.4%
11.1% 12.7% 49.9 6.3% 14.3% 9.5% 11.1% 23.8% 63West Hills 11.1%
33.3% 33.3% 47.2 16.7% 6West Kern 16.7%
5.3% 47.4% 52.1 5.3% 5.3% 10.5% 26.3% 19West Valley-Mission
9.4% 21.9% 54.6 6.3% 21.9% 3.1% 25.0% 32Yosemite 12.5%
12.5% 20.8% 50.3 20.8% 16.7% 16.7% 24Yuba 12.5%
Statewide Total: 2.9% 5.9% 9.5% 12.5% 22.8% 21.3% 7.4% 17.6% 2,020 0.0% 53.5
Note: Employee age is calculated from data element (EB02) Employee-Birth-Date as reported by the district.
Data Element Definitions: California Community Colleges Management Information System Data Element Dictionary
All Districts Reporting
Data Source: CCCCO MIS Database for the reporting period Fall Term 2010 Page 37 of 104
June 30, 2011

California Community Colleges Chancellor's OfficeReport on Staffing for Fall 2010
Employee Category Age Headcount Distribution by District
Tenured/Tenure Track
<=34 Avg Age
Headcount65+60-6455-5950-5445-4940-4435-39 Unknown
12.5% 19.1% 49.9 4.6% 15.1% 9.2% 9.2% 15.1% 152Allan Hancock 15.1%
12.0% 16.9% 51.5 9.8% 15.3% 6.0% 9.8% 15.8% 183Antelope Valley 14.2%
12.8% 17.9% 52.7 5.1% 25.6% 5.1% 5.1% 15.4% 39Barstow 12.8%
12.0% 22.9% 50.9 4.6% 16.0% 6.3% 9.1% 15.4% 175Butte 13.7%
11.1% 28.8% 52.2 3.8% 16.3% 1.4% 9.1% 15.9% 208Cabrillo 13.5%
12.6% 18.8% 52.6 9.4% 20.6% 4.0% 9.0% 13.4% 277Cerritos 12.3%
12.3% 20.8% 49.5 3.5% 16.9% 9.5% 12.7% 12.3% 284Chabot-Las Positas 12.0%
16.8% 17.3% 48.6 3.0% 10.4% 6.4% 13.4% 18.8% 202Chaffey 13.9%
13.7% 21.4% 50.4 6.5% 14.9% 6.5% 13.1% 12.5% 168Citrus 11.3%
9.0% 22.2% 52.0 10.0% 15.3% 5.1% 11.3% 12.7% 432Coast 14.4%
8.3% 16.7% 57.0 23.8% 23.8% 4.8% 15.5% 84Compton 7.1%
10.8% 18.5% 51.6 9.0% 16.2% 6.5% 8.6% 16.0% 444Contra Costa 0.9% 13.5%
3.2% 22.6% 56.1 9.7% 29.0% 9.7% 22.6% 31Copper Mountain 3.2%
12.1% 25.2% 51.7 12.1% 12.1% 7.5% 9.3% 9.3% 107Desert 12.1%
10.0% 19.7% 52.2 10.9% 17.3% 5.5% 11.2% 15.5% 330El Camino 10.0%
12.0% 4.0% 49.8 8.0% 24.0% 12.0% 8.0% 12.0% 25Feather River 20.0%
11.8% 18.3% 51.2 9.3% 15.4% 6.5% 10.8% 13.8% 507Foothill-Deanza 14.0%
15.2% 11.4% 49.7 6.3% 12.7% 8.9% 6.3% 25.3% 79Gavilan 13.9%
12.9% 18.5% 51.8 8.2% 17.2% 3.9% 9.4% 16.7% 233Glendale 13.3%
17.0% 19.3% 50.3 4.6% 14.1% 4.6% 9.5% 16.7% 306Grossmont-Cuyamaca 14.4%
11.6% 22.1% 51.4 2.3% 16.3% 3.5% 7.0% 19.8% 86Hartnell 17.4%
12.1% 17.1% 51.2 5.7% 15.0% 7.1% 4.3% 18.6% 140Imperial 20.0%
12.9% 22.8% 50.3 5.9% 10.2% 6.4% 8.0% 16.6% 373Kern 17.2%
20.0% 25.0% 48.8 2.5% 10.0% 5.0% 32.5% 40Lake Tahoe 5.0%
15.0% 20.0% 50.6 22.5% 7.5% 7.5% 20.0% 40Lassen 7.5%
15.2% 18.4% 52.0 9.5% 15.8% 2.5% 9.5% 14.2% 316Long Beach 14.9%
10.3% 18.9% 53.8 14.3% 19.8% 6.0% 6.8% 14.2% 1,257Los Angeles 9.7%
15.4% 14.4% 49.7 5.1% 14.0% 5.3% 11.8% 17.3% 1,019Los Rios 16.7%
4.5% 25.0% 56.8 18.2% 22.7% 3.4% 2.3% 15.9% 88Marin 8.0%
12.0% 20.0% 49.1 2.0% 18.0% 12.0% 12.0% 12.0% 50Mendocino-Lake 12.0%
16.9% 16.3% 48.4 4.7% 13.4% 12.2% 12.2% 15.1% 172Merced 9.3%
Note: Employee age is calculated from data element (EB02) Employee-Birth-Date as reported by the district.
Data Element Definitions: California Community Colleges Management Information System Data Element Dictionary
All Districts Reporting
Data Source: CCCCO MIS Database for the reporting period Fall Term 2010 Page 38 of 104
June 30, 2011

California Community Colleges Chancellor's OfficeReport on Staffing for Fall 2010
Employee Category Age Headcount Distribution by District
Tenured/Tenure Track
<=34 Avg Age
Headcount65+60-6455-5950-5445-4940-4435-39 Unknown
15.1% 20.5% 48.1 3.0% 8.4% 8.4% 14.5% 11.4% 166Mira Costa 18.7%
9.5% 20.7% 52.4 9.5% 17.2% 4.3% 8.6% 13.8% 116Monterey 16.4%
18.4% 15.5% 48.1 2.6% 11.1% 7.5% 13.5% 15.8% 386Mt. San Antonio 15.5%
9.3% 21.3% 49.3 3.3% 12.7% 11.3% 9.3% 13.3% 150Mt. San Jacinto 19.3%
10.6% 21.3% 49.6 3.2% 13.8% 6.4% 17.0% 18.1% 94Napa Valley 9.6%
14.6% 18.2% 51.8 9.4% 15.5% 2.8% 10.7% 15.9% 534North Orange 12.9%
17.2% 22.1% 50.6 4.9% 13.9% 4.1% 10.7% 16.4% 122Ohlone 10.7%
17.5% 20.0% 50.1 2.5% 17.5% 7.5% 10.0% 17.5% 40Palo Verde 7.5%
11.0% 17.6% 52.1 8.1% 18.3% 4.8% 7.7% 19.0% 273Palomar 13.6%
10.1% 15.8% 52.5 13.5% 15.3% 5.7% 8.8% 15.8% 386Pasadena 15.0%
10.7% 19.2% 53.5 11.4% 22.1% 2.6% 8.8% 14.0% 307Peralta 11.1%
11.6% 17.7% 51.6 9.7% 14.5% 5.2% 10.3% 17.4% 310Rancho Santiago 13.5%
9.7% 21.5% 50.8 5.4% 14.0% 7.5% 8.6% 18.3% 93Redwoods 15.1%
14.5% 18.3% 50.6 8.6% 12.9% 7.5% 9.1% 15.1% 186Rio Hondo 14.0%
16.3% 13.1% 49.1 6.5% 12.5% 7.1% 12.8% 15.3% 367Riverside 16.3%
12.2% 19.8% 51.2 8.1% 14.0% 4.5% 9.5% 17.6% 222San Bernardino 14.4%
8.8% 17.4% 53.6 15.5% 17.4% 3.4% 10.1% 14.1% 682San Diego 13.2%
9.7% 18.7% 53.3 11.5% 21.2% 4.4% 7.9% 14.9% 793San Francisco 11.7%
14.0% 21.5% 51.8 7.0% 15.4% 3.7% 5.6% 17.8% 214San Joaquin Delta 15.0%
12.0% 21.3% 52.8 9.3% 19.0% 3.7% 6.5% 13.4% 216San Jose-Evergreen 14.8%
20.5% 21.8% 49.8 3.2% 9.0% 2.6% 8.3% 16.7% 156San Luis Obispo 17.9%
9.4% 20.2% 52.5 10.7% 17.9% 4.9% 8.1% 12.4% 307San Mateo 16.3%
10.8% 16.9% 51.5 8.0% 16.9% 5.2% 10.8% 18.8% 213Santa Barbara 12.7%
16.8% 19.6% 49.7 7.6% 8.7% 4.9% 12.0% 15.2% 184Santa Clarita 15.2%
9.8% 19.5% 53.5 12.7% 18.2% 4.6% 5.2% 16.3% 307Santa Monica 13.7%
13.4% 25.5% 49.9 3.8% 11.5% 6.4% 11.5% 16.6% 157Sequoias 11.5%
11.4% 22.0% 52.2 5.7% 18.7% 3.3% 7.3% 13.0% 123Shasta-Tehama-Trinity 18.7%
9.8% 17.2% 50.0 4.7% 15.8% 5.1% 15.3% 13.5% 215Sierra 18.6%
12.2% 20.4% 48.2 2.0% 6.1% 10.2% 6.1% 18.4% 49Siskiyous 24.5%
11.0% 20.0% 51.3 5.8% 17.4% 5.2% 10.3% 16.8% 155Solano 13.5%
7.2% 22.3% 52.9 8.6% 20.6% 5.8% 7.2% 15.8% 291Sonoma 12.4%
Note: Employee age is calculated from data element (EB02) Employee-Birth-Date as reported by the district.
Data Element Definitions: California Community Colleges Management Information System Data Element Dictionary
All Districts Reporting
Data Source: CCCCO MIS Database for the reporting period Fall Term 2010 Page 39 of 104
June 30, 2011

California Community Colleges Chancellor's OfficeReport on Staffing for Fall 2010
Employee Category Age Headcount Distribution by District
Tenured/Tenure Track
<=34 Avg Age
Headcount65+60-6455-5950-5445-4940-4435-39 Unknown
9.4% 16.0% 51.7 10.6% 19.4% 8.9% 9.1% 14.3% 350South Orange 12.3%
14.7% 17.4% 50.9 7.6% 12.1% 6.3% 6.3% 21.9% 224Southwestern 13.8%
12.6% 18.9% 50.4 5.5% 12.6% 5.1% 12.0% 19.1% 492State Center 14.2%
9.2% 18.9% 51.6 7.6% 18.7% 7.9% 8.7% 16.6% 380Ventura 12.4%
12.3% 22.3% 52.4 3.8% 20.8% 2.3% 8.5% 19.2% 130Victor Valley 10.8%
18.6% 8.5% 47.2 6.8% 13.6% 10.2% 22.0% 10.2% 59West Hills 10.2%
14.0% 14.0% 47.1 4.0% 12.0% 22.0% 6.0% 16.0% 50West Kern 12.0%
15.1% 19.1% 51.3 7.6% 12.8% 2.6% 9.5% 17.8% 304West Valley-Mission 15.5%
13.4% 20.8% 50.5 4.6% 12.0% 4.2% 9.5% 18.3% 284Yosemite 17.3%
13.4% 23.1% 49.9 3.7% 14.2% 9.0% 9.7% 11.9% 134Yuba 14.9%
Statewide Total: 5.6% 9.6% 12.2% 13.7% 18.9% 15.9% 8.4% 15.7% 18,068 0.0% 51.5
Note: Employee age is calculated from data element (EB02) Employee-Birth-Date as reported by the district.
Data Element Definitions: California Community Colleges Management Information System Data Element Dictionary
All Districts Reporting
Data Source: CCCCO MIS Database for the reporting period Fall Term 2010 Page 40 of 104
June 30, 2011

California Community Colleges Chancellor's OfficeReport on Staffing for Fall 2010
Employee Category Age Headcount Distribution by District
Academic Temporary
<=34 Avg Age
Headcount65+60-6455-5950-5445-4940-4435-39 Unknown
8.9% 15.5% 51.7 16.6% 12.2% 12.6% 6.9% 14.4% 451Allan Hancock 12.9%
12.6% 17.9% 50.7 13.3% 9.2% 10.9% 7.7% 16.7% 413Antelope Valley 11.6%
11.8% 14.5% 51.4 17.3% 9.1% 9.1% 10.9% 11.8% 110Barstow 15.5%
10.7% 17.4% 50.2 10.3% 11.6% 11.4% 10.1% 15.4% 552Butte 13.0%
10.7% 19.1% 52.0 11.7% 15.9% 7.8% 8.4% 13.8% 383Cabrillo 12.5%
13.8% 12.5% 47.5 8.4% 11.0% 17.2% 13.8% 12.7% 465Cerritos 10.8%
11.2% 15.9% 52.2 15.2% 14.2% 8.3% 8.0% 14.6% 591Chabot-Las Positas 12.7%
12.0% 14.7% 47.3 9.3% 8.2% 21.4% 10.1% 13.1% 625Chaffey 11.2%
9.6% 9.6% 47.2 11.9% 10.0% 22.2% 13.0% 10.3% 261Citrus 13.4%
9.6% 12.2% 49.2 13.9% 13.4% 18.0% 11.4% 11.3% 1,066Coast 10.2%
8.1% 11.8% 47.9 10.4% 11.3% 21.3% 10.0% 14.0% 221Compton 13.1%
10.9% 15.9% 51.4 14.3% 15.4% 11.7% 9.0% 12.3% 944Contra Costa 10.6%
8.1% 18.2% 52.0 16.2% 13.1% 11.1% 6.1% 17.2% 99Copper Mountain 10.1%
8.1% 12.5% 52.5 17.0% 15.3% 10.3% 8.1% 16.4% 359Desert 12.3%
10.5% 16.8% 50.8 12.9% 12.3% 10.2% 11.9% 11.3% 512El Camino 14.1%
6.3% 11.1% 44.6 7.9% 14.3% 33.3% 9.5% 4.8% 63Feather River 12.7%
11.8% 14.4% 51.3 14.2% 13.3% 11.7% 7.4% 13.9% 822Foothill-Deanza 13.4%
11.1% 14.9% 49.7 11.5% 14.9% 14.4% 10.6% 11.5% 208Gavilan 11.1%
10.9% 14.9% 50.9 14.5% 11.5% 11.5% 10.4% 14.9% 530Glendale 11.3%
11.5% 15.4% 49.3 9.0% 13.7% 14.0% 12.6% 13.3% 914Grossmont-Cuyamaca 10.5%
12.1% 20.2% 50.4 10.8% 11.7% 11.7% 9.0% 13.9% 223Hartnell 0.4% 10.3%
11.4% 14.3% 48.6 6.2% 13.8% 10.0% 17.1% 11.4% 210Imperial 15.7%
10.4% 14.7% 49.9 12.4% 11.0% 13.9% 10.4% 15.9% 490Kern 11.2%
15.6% 9.8% 47.5 6.6% 9.8% 10.7% 14.8% 13.9% 122Lake Tahoe 18.9%
12.4% 11.3% 50.9 14.4% 16.5% 11.3% 13.4% 13.4% 97Lassen 7.2%
11.4% 12.9% 49.8 13.5% 10.1% 13.5% 11.7% 13.7% 614Long Beach 13.2%
11.5% 11.9% 51.8 19.1% 12.8% 12.6% 10.0% 11.6% 3,230Los Angeles 10.5%
12.3% 12.4% 50.4 12.8% 14.3% 11.8% 11.0% 13.4% 1,478Los Rios 12.0%
7.2% 16.3% 53.4 19.1% 17.9% 10.8% 6.4% 12.0% 251Marin 10.4%
5.3% 19.5% 51.6 14.1% 15.6% 13.4% 8.4% 16.4% 262Mendocino-Lake 7.3%
9.7% 11.7% 50.1 13.7% 11.7% 14.8% 10.0% 16.2% 351Merced 12.3%
Note: Employee age is calculated from data element (EB02) Employee-Birth-Date as reported by the district.
Data Element Definitions: California Community Colleges Management Information System Data Element Dictionary
All Districts Reporting
Data Source: CCCCO MIS Database for the reporting period Fall Term 2010 Page 41 of 104
June 30, 2011

California Community Colleges Chancellor's OfficeReport on Staffing for Fall 2010
Employee Category Age Headcount Distribution by District
Academic Temporary
<=34 Avg Age
Headcount65+60-6455-5950-5445-4940-4435-39 Unknown
11.0% 12.5% 48.3 10.0% 11.7% 17.2% 14.4% 13.3% 472Mira Costa 10.0%
7.7% 15.1% 51.1 16.2% 11.4% 12.1% 11.8% 14.7% 272Monterey 11.0%
12.2% 12.1% 48.2 9.1% 13.3% 18.7% 10.8% 11.5% 825Mt. San Antonio 12.2%
12.3% 13.7% 48.1 10.2% 10.3% 17.8% 12.1% 11.8% 561Mt. San Jacinto 11.8%
7.9% 15.4% 51.7 16.5% 14.7% 12.9% 9.0% 10.4% 279Napa Valley 13.3%
11.9% 13.6% 49.3 10.9% 12.5% 14.4% 12.5% 14.4% 1,136North Orange 9.7%
13.8% 11.7% 49.4 10.1% 14.1% 12.6% 10.4% 13.8% 326Ohlone 13.5%
8.6% 14.8% 53.7 24.7% 12.3% 8.6% 7.4% 9.9% 81Palo Verde 13.6%
9.6% 13.1% 49.9 12.1% 12.3% 13.6% 11.1% 14.3% 848Palomar 14.0%
12.8% 16.5% 50.6 14.0% 11.1% 13.2% 9.7% 13.4% 673Pasadena 9.4%
10.1% 14.0% 51.7 16.8% 17.4% 13.6% 8.3% 9.7% 749Peralta 10.0%
12.0% 12.9% 49.2 12.8% 12.3% 15.5% 12.4% 10.9% 995Rancho Santiago 11.5%
11.5% 17.5% 49.9 9.9% 16.7% 14.7% 9.9% 8.3% 252Redwoods 11.5%
10.7% 9.0% 49.7 15.7% 11.5% 16.0% 12.1% 13.8% 356Rio Hondo 11.2%
12.1% 13.8% 47.9 8.5% 9.8% 16.0% 13.1% 13.5% 1,000Riverside 13.2%
11.5% 14.4% 48.3 9.3% 10.5% 17.1% 11.1% 14.4% 514San Bernardino 11.7%
10.3% 13.5% 49.9 13.0% 13.0% 15.2% 10.3% 12.8% 2,089San Diego 11.9%
8.9% 13.8% 54.5 21.7% 17.6% 5.7% 8.8% 12.7% 1,034San Francisco 10.8%
10.2% 13.7% 51.6 16.8% 17.2% 12.6% 10.2% 10.5% 285San Joaquin Delta 8.8%
10.8% 11.4% 51.8 17.0% 17.5% 10.6% 10.8% 10.6% 481San Jose-Evergreen 0.2% 11.0%
10.8% 16.4% 51.2 13.1% 15.6% 10.3% 9.6% 11.8% 397San Luis Obispo 12.3%
10.7% 13.4% 51.6 17.6% 13.1% 11.5% 10.1% 12.4% 643San Mateo 11.2%
8.4% 14.7% 51.2 14.0% 14.5% 12.0% 9.6% 15.7% 407Santa Barbara 11.1%
13.3% 13.0% 46.1 4.1% 8.2% 16.5% 15.8% 14.0% 437Santa Clarita 15.1%
10.3% 14.0% 50.8 14.0% 14.4% 12.0% 11.6% 11.9% 980Santa Monica 11.7%
9.9% 14.1% 47.1 9.6% 10.2% 24.9% 9.0% 10.5% 334Sequoias 12.0%
10.6% 14.7% 51.7 13.0% 16.0% 9.6% 6.8% 17.4% 293Shasta-Tehama-Trinity 11.9%
10.4% 13.2% 50.2 10.4% 16.9% 13.2% 9.3% 14.0% 680Sierra 12.5%
14.1% 11.5% 48.5 6.4% 14.7% 14.1% 9.6% 16.0% 156Siskiyous 13.5%
8.3% 13.4% 51.1 15.6% 14.3% 12.7% 9.6% 13.1% 314Solano 13.1%
8.9% 17.6% 54.1 17.7% 18.4% 5.7% 5.8% 13.7% 1,029Sonoma 12.1%
Note: Employee age is calculated from data element (EB02) Employee-Birth-Date as reported by the district.
Data Element Definitions: California Community Colleges Management Information System Data Element Dictionary
All Districts Reporting
Data Source: CCCCO MIS Database for the reporting period Fall Term 2010 Page 42 of 104
June 30, 2011

California Community Colleges Chancellor's OfficeReport on Staffing for Fall 2010
Employee Category Age Headcount Distribution by District
Academic Temporary
<=34 Avg Age
Headcount65+60-6455-5950-5445-4940-4435-39 Unknown
12.0% 14.8% 50.2 14.3% 12.0% 14.6% 10.4% 11.2% 891South Orange 10.7%
10.8% 12.8% 47.5 8.5% 10.2% 17.8% 13.6% 13.1% 685Southwestern 13.1%
9.0% 13.4% 49.2 12.2% 13.0% 17.2% 11.2% 12.9% 1,045State Center 11.1%
9.2% 18.0% 53.4 16.9% 17.0% 7.8% 6.6% 12.2% 818Ventura 12.3%
10.9% 15.5% 49.3 13.1% 9.3% 15.5% 11.1% 14.0% 451Victor Valley 10.6%
12.9% 8.6% 47.7 4.3% 15.7% 12.9% 15.7% 14.3% 70West Hills 15.7%
11.5% 14.8% 46.9 11.5% 1.6% 21.3% 11.5% 14.8% 61West Kern 13.1%
10.3% 15.3% 51.7 15.7% 13.0% 8.6% 12.1% 14.2% 478West Valley-Mission 10.9%
9.3% 16.5% 50.7 11.8% 15.6% 13.1% 9.5% 13.7% 474Yosemite 10.5%
10.1% 12.8% 52.4 17.1% 19.5% 11.7% 7.8% 8.9% 257Yuba 12.1%
Statewide Total: 13.4% 10.4% 10.8% 11.6% 14.1% 13.3% 13.5% 12.9% 41,045 0.0% 50.4
Note: Employee age is calculated from data element (EB02) Employee-Birth-Date as reported by the district.
Data Element Definitions: California Community Colleges Management Information System Data Element Dictionary
All Districts Reporting
Data Source: CCCCO MIS Database for the reporting period Fall Term 2010 Page 43 of 104
June 30, 2011

California Community Colleges Chancellor's OfficeReport on Staffing for Fall 2010
Employee Category Age Headcount Distribution by District
Classified Administrator
<=34 Avg Age
Headcount65+60-6455-5950-5445-4940-4435-39 Unknown
25.0% 50.8 50.0% 4Allan Hancock 25.0%
20.0% 10.0% 46.6 20.0% 40.0% 10Barstow 10.0%
19.2% 19.2% 49.3 7.7% 3.8% 7.7% 3.8% 19.2% 26Butte 19.2%
15.8% 21.1% 50.0 5.3% 5.3% 5.3% 5.3% 21.1% 19Cabrillo 21.1%
19.2% 15.4% 47.3 3.8% 15.4% 19.2% 26Cerritos 26.9%
7.9% 15.8% 51.8 21.1% 2.6% 5.3% 28.9% 38Chabot-Las Positas 18.4%
11.8% 11.8% 44.0 11.8% 23.5% 5.9% 17Chaffey 35.3%
16.7% 55.3 16.7% 66.7% 6Citrus
18.1% 15.7% 49.0 1.2% 12.0% 6.0% 7.2% 24.1% 83Coast 15.7%
14.3% 45.1 14.3% 42.9% 14.3% 7Compton 14.3%
8.0% 26.0% 52.7 6.0% 14.0% 2.0% 6.0% 24.0% 50Contra Costa 14.0%
25.0% 54.5 12.5% 37.5% 8Desert 25.0%
12.5% 25.0% 53.1 9.4% 6.3% 28.1% 32El Camino 18.8%
12.5% 31.3% 52.1 6.3% 25.0% 6.3% 12.5% 6.3% 16Feather River
9.1% 24.2% 53.3 6.1% 15.2% 3.0% 24.2% 33Foothill-Deanza 18.2%
16.7% 51.5 16.7% 16.7% 50.0% 6Gavilan
6.3% 18.8% 49.1 6.3% 6.3% 25.0% 28.1% 32Glendale 9.4%
20.0% 30.0% 49.1 10.0% 10.0% 10.0% 20.0% 10Grossmont-Cuyamaca
5.3% 26.3% 51.4 5.3% 10.5% 10.5% 21.1% 19Hartnell 21.1%
100.0% 44.0 1Imperial
3.8% 13.2% 49.7 5.7% 13.2% 9.4% 13.2% 26.4% 53Kern 15.1%
49.5 50.0% 2Lake Tahoe 50.0%
33.3% 11.1% 47.3 9Lassen 55.6%
25.0% 5.0% 45.8 10.0% 15.0% 40.0% 20Long Beach 5.0%
10.0% 25.0% 55.9 20.0% 15.0% 2.5% 20.0% 40Los Angeles 7.5%
7.5% 32.5% 52.4 5.0% 15.0% 10.0% 10.0% 40Los Rios 20.0%
100.0% 56.5 2Marin
16.7% 41.7% 51.4 16.7% 8.3% 12Mendocino-Lake 16.7%
11.5% 26.9% 49.8 7.7% 7.7% 7.7% 23.1% 26Merced 15.4%
7.1% 50.9 7.1% 14.3% 7.1% 14.3% 35.7% 14Mira Costa 14.3%
25.0% 25.0% 54.1 8.3% 25.0% 8.3% 12Monterey 8.3%
Note: Employee age is calculated from data element (EB02) Employee-Birth-Date as reported by the district.
Data Element Definitions: California Community Colleges Management Information System Data Element Dictionary
All Districts Reporting
Data Source: CCCCO MIS Database for the reporting period Fall Term 2010 Page 44 of 104
June 30, 2011

California Community Colleges Chancellor's OfficeReport on Staffing for Fall 2010
Employee Category Age Headcount Distribution by District
Classified Administrator
<=34 Avg Age
Headcount65+60-6455-5950-5445-4940-4435-39 Unknown
5.7% 20.0% 47.8 8.6% 11.4% 14.3% 17.1% 35Mt. San Antonio 22.9%
10.0% 10.0% 43.9 20.0% 10.0% 20.0% 10Mt. San Jacinto 30.0%
15.4% 51.1 7.7% 15.4% 38.5% 13Napa Valley 23.1%
18.4% 16.3% 48.5 14.3% 8.2% 8.2% 14.3% 49North Orange 20.4%
11.1% 22.2% 50.4 7.4% 14.8% 7.4% 11.1% 14.8% 27Ohlone 11.1%
35.3% 54.8 5.9% 11.8% 5.9% 35.3% 17Palomar 5.9%
22.2% 55.2 44.4% 11.1% 22.2% 9Pasadena
14.3% 54.0 14.3% 28.6% 14.3% 7Rancho Santiago 28.6%
6.1% 21.2% 47.4 3.0% 9.1% 21.2% 12.1% 18.2% 33Redwoods 9.1%
11.1% 22.2% 50.8 22.2% 22.2% 9Rio Hondo 22.2%
15.0% 20.0% 51.0 7.5% 12.5% 7.5% 7.5% 17.5% 40Riverside 12.5%
14.3% 14.3% 49.4 8.6% 14.3% 14.3% 8.6% 14.3% 35San Bernardino 11.4%
50.0% 55.0 50.0% 2San Francisco
13.2% 15.8% 49.6 15.8% 7.9% 5.3% 21.1% 38San Joaquin Delta 21.1%
8.7% 4.3% 48.9 4.3% 21.7% 8.7% 17.4% 21.7% 23San Jose-Evergreen 13.0%
36.4% 53.5 18.2% 9.1% 11San Luis Obispo 36.4%
6.3% 31.3% 52.6 18.8% 6.3% 12.5% 16San Mateo 25.0%
13.2% 30.2% 52.5 3.8% 15.1% 3.8% 1.9% 17.0% 53Santa Barbara 15.1%
12.1% 13.8% 46.2 1.7% 10.3% 13.8% 19.0% 12.1% 58Santa Clarita 17.2%
18.9% 9.4% 48.6 1.9% 9.4% 3.8% 5.7% 20.8% 53Santa Monica 30.2%
33.3% 55.7 66.7% 3Sequoias
6.7% 26.7% 51.1 13.3% 6.7% 20.0% 15Shasta-Tehama-Trinity 26.7%
8.3% 20.8% 49.4 8.3% 25.0% 24Sierra 37.5%
100.0% 55.0 1Siskiyous
45.5% 52.6 9.1% 9.1% 9.1% 11Solano 27.3%
14.3% 52.7 14.3% 14.3% 14.3% 14.3% 7Sonoma 28.6%
10.0% 16.0% 50.3 6.0% 16.0% 10.0% 8.0% 20.0% 50South Orange 14.0%
11.8% 23.5% 50.6 5.9% 11.8% 2.9% 14.7% 17.6% 34Southwestern 11.8%
23.3% 10.0% 51.0 3.3% 16.7% 3.3% 3.3% 36.7% 30State Center 3.3%
14.3% 28.6% 52.6 14.3% 28.6% 7Ventura 14.3%
53.0 100.0% 1Victor Valley
Note: Employee age is calculated from data element (EB02) Employee-Birth-Date as reported by the district.
Data Element Definitions: California Community Colleges Management Information System Data Element Dictionary
All Districts Reporting
Data Source: CCCCO MIS Database for the reporting period Fall Term 2010 Page 45 of 104
June 30, 2011

California Community Colleges Chancellor's OfficeReport on Staffing for Fall 2010
Employee Category Age Headcount Distribution by District
Classified Administrator
<=34 Avg Age
Headcount65+60-6455-5950-5445-4940-4435-39 Unknown
34.0 100.0% 1West Hills
33.3% 42.7 11.1% 22.2% 22.2% 9West Kern 11.1%
6.7% 20.0% 51.0 13.3% 13.3% 6.7% 20.0% 20.0% 15West Valley-Mission
20.0% 16.0% 50.0 6.0% 12.0% 6.0% 8.0% 18.0% 50Yosemite 14.0%
5.9% 5.9% 47.9 5.9% 11.8% 5.9% 29.4% 17Yuba 35.3%
Statewide Total: 6.1% 8.7% 11.9% 16.8% 19.4% 11.8% 4.4% 20.9% 1,486 0.0% 50.2
Note: Employee age is calculated from data element (EB02) Employee-Birth-Date as reported by the district.
Data Element Definitions: California Community Colleges Management Information System Data Element Dictionary
All Districts Reporting
Data Source: CCCCO MIS Database for the reporting period Fall Term 2010 Page 46 of 104
June 30, 2011

California Community Colleges Chancellor's OfficeReport on Staffing for Fall 2010
Employee Category Age Headcount Distribution by District
Classified Professional
<=34 Avg Age
Headcount65+60-6455-5950-5445-4940-4435-39 Unknown
24.0% 20.0% 44.4 4.0% 16.0% 16.0% 12.0% 25Allan Hancock 8.0%
13.9% 11.1% 46.7 2.8% 13.9% 13.9% 16.7% 22.2% 36Antelope Valley 5.6%
17.4% 17.4% 47.0 17.4% 13.0% 17.4% 8.7% 23Butte 8.7%
16.7% 35.0 50.0% 16.7% 16.7% 6Cerritos
100.0% 43.0 1Chabot-Las Positas
14.3% 9.5% 45.8 14.3% 9.5% 28.6% 14.3% 21Chaffey 9.5%
9.1% 21.2% 46.5 3.0% 15.2% 24.2% 12.1% 15.2% 33Citrus
33.3% 41.3 33.3% 33.3% 3Coast
28.6% 42.9 7.1% 35.7% 14.3% 7.1% 14Compton 7.1%
12.5% 12.5% 48.5 3.1% 12.5% 14.1% 6.3% 17.2% 64Contra Costa 21.9%
20.0% 42.2 40.0% 20.0% 5Copper Mountain 20.0%
27.3% 49.0 18.2% 9.1% 36.4% 11Desert 9.1%
26.3% 10.5% 46.0 5.3% 12.3% 14.0% 17.5% 7.0% 57El Camino 7.0%
31.5 100.0% 2Feather River
16.5% 11.0% 47.7 1.8% 12.8% 11.6% 10.4% 20.1% 164Foothill-Deanza 15.9%
23.1% 23.1% 51.6 23.1% 7.7% 13Gavilan 23.1%
15.4% 49.4 15.4% 7.7% 15.4% 23.1% 13Glendale 23.1%
12.1% 6.1% 49.7 9.1% 15.2% 9.1% 9.1% 18.2% 33Grossmont-Cuyamaca 21.2%
20.0% 48.8 30.0% 10.0% 10.0% 10.0% 10Hartnell 20.0%
26.3% 10.5% 47.6 10.5% 5.3% 10.5% 15.8% 19Imperial 21.1%
19.3% 12.3% 46.0 5.3% 8.8% 14.0% 17.5% 12.3% 57Kern 10.5%
25.0% 50.0% 53.5 25.0% 4Lake Tahoe
28.6% 53.1 14.3% 14.3% 42.9% 7Lassen
25.9% 18.5% 47.6 7.4% 7.4% 7.4% 18.5% 27Long Beach 14.8%
16.0% 18.7% 48.1 3.2% 10.5% 10.5% 10.5% 16.9% 219Los Angeles 13.7%
19.2% 9.0% 46.7 5.1% 5.1% 15.4% 7.7% 21.8% 78Los Rios 16.7%
12.5% 25.0% 51.0 12.5% 6.3% 25.0% 16Marin 18.8%
50.0% 43.0 2Merced 50.0%
16.7% 11.1% 45.4 5.6% 16.7% 11.1% 16.7% 18Mira Costa 22.2%
17.6% 11.8% 42.9 5.9% 23.5% 17.6% 5.9% 17Monterey 17.6%
50.0% 25.0% 41.0 25.0% 4Mt. San Antonio
Note: Employee age is calculated from data element (EB02) Employee-Birth-Date as reported by the district.
Data Element Definitions: California Community Colleges Management Information System Data Element Dictionary
All Districts Reporting
Data Source: CCCCO MIS Database for the reporting period Fall Term 2010 Page 47 of 104
June 30, 2011

California Community Colleges Chancellor's OfficeReport on Staffing for Fall 2010
Employee Category Age Headcount Distribution by District
Classified Professional
<=34 Avg Age
Headcount65+60-6455-5950-5445-4940-4435-39 Unknown
15.9% 11.0% 45.9 8.5% 13.4% 13.4% 20.7% 82Mt. San Jacinto 17.1%
40.0% 52.0 20.0% 20.0% 5Napa Valley 20.0%
100.0% 57.0 1North Orange
26.3% 45.1 15.8% 21.1% 15.8% 19Ohlone 21.1%
33.3% 57.0 33.3% 33.3% 3Palo Verde
5.4% 16.2% 48.2 2.7% 16.2% 18.9% 10.8% 13.5% 37Palomar 16.2%
12.6% 14.9% 47.7 3.4% 16.1% 14.9% 12.6% 12.6% 87Peralta 12.6%
10.8% 10.8% 46.5 2.7% 13.5% 16.2% 16.2% 16.2% 37Rancho Santiago 13.5%
10.7% 19.6% 47.2 8.9% 5.4% 21.4% 5.4% 16.1% 56Redwoods 12.5%
66.7% 53.3 3Rio Hondo 33.3%
18.2% 6.8% 45.5 2.3% 6.8% 11.4% 18.2% 13.6% 44Riverside 22.7%
16.7% 12.5% 44.2 4.2% 25.0% 8.3% 12.5% 48San Bernardino 20.8%
17.8% 28.8% 49.7 1.4% 11.0% 9.6% 5.5% 11.0% 73San Diego 15.1%
13.8% 15.0% 48.5 5.0% 15.0% 15.0% 6.3% 15.0% 80San Francisco 15.0%
39.3 6.3% 37.5% 18.8% 12.5% 16San Joaquin Delta 25.0%
9.5% 14.3% 54.8 14.3% 23.8% 4.8% 23.8% 21San Jose-Evergreen 9.5%
11.1% 22.2% 48.3 5.6% 11.1% 11.1% 33.3% 18San Luis Obispo 5.6%
12.9% 17.1% 47.6 2.9% 11.4% 15.7% 8.6% 15.7% 70San Mateo 15.7%
13.7% 16.7% 47.4 3.9% 13.7% 17.6% 11.8% 15.7% 102Santa Barbara 6.9%
43.3 14.3% 28.6% 28.6% 7Santa Clarita 28.6%
12.5% 48.0 12.5% 12.5% 25.0% 12.5% 12.5% 8Sequoias 12.5%
8.3% 16.7% 44.9 8.3% 20.8% 12.5% 12.5% 24Siskiyous 20.8%
28.6% 14.3% 44.3 14.3% 14.3% 14.3% 7Solano 14.3%
6.6% 27.9% 53.7 14.8% 9.8% 4.9% 4.9% 16.4% 61Sonoma 14.8%
20.0% 48.7 6.7% 13.3% 13.3% 33.3% 15South Orange 13.3%
6.9% 20.7% 50.8 10.3% 6.9% 6.9% 13.8% 24.1% 29State Center 10.3%
4.2% 16.7% 49.8 8.3% 12.5% 33.3% 24Ventura 25.0%
17.4% 8.7% 47.9 4.3% 4.3% 8.7% 8.7% 26.1% 23Victor Valley 21.7%
11.1% 4.2% 38.0 1.4% 1.4% 45.8% 13.9% 8.3% 72West Hills 13.9%
14.3% 14.3% 47.4 14.3% 7.1% 21.4% 28.6% 14West Kern
17.5% 17.5% 50.2 2.5% 15.0% 5.0% 10.0% 15.0% 40West Valley-Mission 17.5%
Note: Employee age is calculated from data element (EB02) Employee-Birth-Date as reported by the district.
Data Element Definitions: California Community Colleges Management Information System Data Element Dictionary
All Districts Reporting
Data Source: CCCCO MIS Database for the reporting period Fall Term 2010 Page 48 of 104
June 30, 2011

California Community Colleges Chancellor's OfficeReport on Staffing for Fall 2010
Employee Category Age Headcount Distribution by District
Classified Professional
<=34 Avg Age
Headcount65+60-6455-5950-5445-4940-4435-39 Unknown
12.0% 24.0% 49.2 8.0% 16.0% 16.0% 4.0% 25Yosemite 20.0%
7.7% 7.7% 42.6 7.7% 30.8% 7.7% 13Yuba 38.5%
Statewide Total: 14.7% 11.0% 14.4% 14.6% 15.1% 10.5% 3.5% 16.2% 2,166 0.0% 47.3
Note: Employee age is calculated from data element (EB02) Employee-Birth-Date as reported by the district.
Data Element Definitions: California Community Colleges Management Information System Data Element Dictionary
All Districts Reporting
Data Source: CCCCO MIS Database for the reporting period Fall Term 2010 Page 49 of 104
June 30, 2011

California Community Colleges Chancellor's OfficeReport on Staffing for Fall 2010
Employee Category Age Headcount Distribution by District
Classified Support
<=34 Avg Age
Headcount65+60-6455-5950-5445-4940-4435-39 Unknown
10.2% 18.2% 47.9 3.7% 9.1% 15.0% 7.0% 18.7% 187Allan Hancock 18.2%
10.3% 13.9% 46.3 2.1% 9.8% 20.1% 9.3% 18.0% 194Antelope Valley 16.5%
15.7% 19.6% 41.8 2.0% 33.3% 9.8% 9.8% 51Barstow 9.8%
9.3% 19.3% 46.8 3.0% 10.7% 18.5% 11.9% 15.6% 270Butte 11.9%
11.2% 18.5% 49.1 2.3% 15.8% 11.5% 9.2% 15.8% 260Cabrillo 15.8%
10.4% 17.1% 47.3 4.7% 11.1% 18.7% 10.8% 13.6% 316Cerritos 13.6%
12.1% 16.6% 47.6 5.1% 9.0% 14.9% 10.1% 16.9% 356Chabot-Las Positas 15.4%
8.8% 13.1% 44.1 1.6% 8.0% 28.3% 10.4% 16.7% 251Chaffey 13.1%
9.3% 17.5% 48.5 6.9% 10.7% 16.5% 8.6% 16.8% 291Citrus 13.7%
14.4% 13.0% 47.2 4.8% 9.6% 14.9% 11.3% 16.5% 763Coast 15.5%
15.9% 15.0% 49.4 6.5% 12.1% 5.6% 11.2% 13.1% 107Compton 20.6%
10.7% 16.1% 48.0 4.6% 11.2% 15.8% 9.3% 17.8% 366Contra Costa 14.5%
10.6% 14.9% 45.1 4.3% 23.4% 4.3% 25.5% 47Copper Mountain 17.0%
12.1% 14.1% 49.7 10.1% 10.1% 12.6% 5.0% 21.6% 199Desert 14.6%
11.1% 16.0% 49.3 6.3% 10.0% 12.5% 7.1% 21.4% 351El Camino 15.7%
6.7% 26.7% 45.8 6.7% 24.4% 13.3% 15.6% 45Feather River 6.7%
9.3% 19.3% 49.2 5.3% 12.2% 12.2% 8.7% 16.9% 450Foothill-Deanza 16.0%
10.6% 15.9% 46.5 6.2% 5.3% 21.2% 9.7% 19.5% 113Gavilan 11.5%
12.0% 15.6% 47.2 4.5% 9.4% 18.5% 9.7% 15.9% 308Glendale 14.3%
13.2% 20.1% 47.8 3.1% 10.7% 14.5% 10.7% 16.0% 393Grossmont-Cuyamaca 11.7%
11.7% 12.5% 45.0 1.7% 10.0% 22.5% 10.8% 15.8% 120Hartnell 15.0%
21.1% 8.5% 42.2 0.7% 3.5% 27.5% 12.0% 14.8% 142Imperial 12.0%
8.8% 15.5% 47.5 4.3% 11.0% 17.5% 10.0% 19.0% 399Kern 13.8%
7.5% 18.9% 47.6 9.4% 13.2% 13.2% 24.5% 53Lake Tahoe 13.2%
11.3% 18.9% 50.0 17.0% 5.7% 9.4% 20.8% 53Lassen 17.0%
12.2% 14.8% 45.4 2.6% 8.6% 20.8% 13.0% 13.4% 500Long Beach 14.6%
14.2% 13.2% 46.7 4.7% 9.2% 16.7% 11.7% 15.0% 1,828Los Angeles 15.2%
14.3% 14.4% 46.5 3.8% 10.7% 18.1% 9.9% 13.9% 1,052Los Rios 15.0%
7.8% 11.5% 50.9 10.4% 17.2% 10.9% 8.9% 18.8% 192Marin 14.6%
11.9% 23.8% 49.4 6.0% 6.0% 13.1% 6.0% 22.6% 84Mendocino-Lake 10.7%
11.1% 11.5% 45.6 2.4% 8.3% 20.9% 10.7% 19.4% 253Merced 15.8%
Note: Employee age is calculated from data element (EB02) Employee-Birth-Date as reported by the district.
Data Element Definitions: California Community Colleges Management Information System Data Element Dictionary
All Districts Reporting
Data Source: CCCCO MIS Database for the reporting period Fall Term 2010 Page 50 of 104
June 30, 2011

California Community Colleges Chancellor's OfficeReport on Staffing for Fall 2010
Employee Category Age Headcount Distribution by District
Classified Support
<=34 Avg Age
Headcount65+60-6455-5950-5445-4940-4435-39 Unknown
8.8% 17.2% 47.1 3.8% 7.5% 16.3% 13.0% 19.2% 239Mira Costa 14.2%
7.1% 21.7% 48.6 8.7% 8.2% 19.6% 7.1% 15.8% 184Monterey 12.0%
12.8% 12.4% 45.7 4.1% 7.7% 21.1% 12.4% 16.2% 555Mt. San Antonio 13.2%
13.7% 10.2% 44.3 1.3% 5.3% 23.5% 8.0% 15.9% 226Mt. San Jacinto 22.1%
12.8% 12.8% 46.0 3.8% 7.1% 18.6% 10.3% 16.7% 156Napa Valley 17.9%
11.4% 17.0% 46.7 3.2% 7.4% 17.1% 12.0% 15.7% 631North Orange 16.2%
8.1% 13.1% 44.3 2.5% 8.8% 28.8% 11.9% 14.4% 160Ohlone 12.5%
11.5% 12.8% 41.4 9.0% 34.6% 11.5% 9.0% 78Palo Verde 11.5%
9.8% 15.9% 48.2 4.5% 14.4% 15.9% 11.6% 15.1% 397Palomar 12.8%
11.2% 16.9% 48.9 6.8% 12.3% 11.7% 10.6% 14.2% 367Pasadena 16.3%
11.5% 15.5% 47.6 5.6% 10.2% 14.0% 14.6% 15.8% 322Peralta 12.7%
11.5% 14.3% 46.4 4.9% 8.9% 18.9% 13.1% 14.8% 610Rancho Santiago 13.8%
7.1% 18.9% 48.1 3.9% 15.0% 22.0% 5.5% 15.0% 127Redwoods 12.6%
7.9% 15.0% 45.8 2.4% 8.3% 20.2% 14.6% 19.4% 253Rio Hondo 12.3%
11.7% 13.1% 44.7 3.1% 7.9% 25.4% 10.6% 16.5% 556Riverside 11.7%
12.9% 11.1% 44.7 4.1% 5.8% 25.4% 9.4% 19.0% 342San Bernardino 12.3%
10.4% 16.7% 47.4 5.8% 10.0% 18.6% 9.9% 16.1% 983San Diego 12.6%
10.7% 20.2% 50.6 7.5% 12.0% 8.5% 7.9% 18.0% 749San Francisco 15.2%
7.9% 13.8% 48.3 11.9% 7.3% 20.9% 9.2% 14.9% 455San Joaquin Delta 0.2% 13.8%
15.2% 14.6% 47.5 3.6% 9.4% 12.5% 11.9% 18.2% 329San Jose-Evergreen 14.6%
8.7% 17.4% 46.8 1.3% 14.3% 23.0% 5.7% 16.5% 230San Luis Obispo 13.0%
10.9% 17.4% 46.9 2.6% 8.3% 18.2% 8.9% 19.0% 384San Mateo 14.6%
11.8% 14.5% 47.3 4.8% 11.4% 17.0% 10.7% 14.9% 289Santa Barbara 14.9%
11.2% 14.7% 46.2 3.1% 6.3% 17.0% 11.6% 20.1% 224Santa Clarita 16.1%
11.9% 15.4% 48.1 7.2% 10.4% 17.8% 8.0% 16.7% 461Santa Monica 12.6%
8.0% 17.9% 47.3 6.5% 12.9% 23.4% 7.0% 11.4% 201Sequoias 12.9%
9.5% 21.9% 49.4 3.8% 11.9% 13.3% 4.3% 19.0% 210Shasta-Tehama-Trinity 16.2%
13.7% 20.5% 48.7 2.1% 8.5% 10.7% 4.7% 19.2% 234Sierra 20.5%
7.5% 25.0% 50.5 2.5% 12.5% 8.8% 5.0% 21.3% 80Siskiyous 17.5%
7.0% 19.1% 49.6 1.3% 15.9% 10.8% 7.0% 22.9% 157Solano 15.9%
10.6% 19.3% 49.9 4.5% 14.1% 10.3% 7.8% 18.1% 398Sonoma 15.3%
Note: Employee age is calculated from data element (EB02) Employee-Birth-Date as reported by the district.
Data Element Definitions: California Community Colleges Management Information System Data Element Dictionary
All Districts Reporting
Data Source: CCCCO MIS Database for the reporting period Fall Term 2010 Page 51 of 104
June 30, 2011

California Community Colleges Chancellor's OfficeReport on Staffing for Fall 2010
Employee Category Age Headcount Distribution by District
Classified Support
<=34 Avg Age
Headcount65+60-6455-5950-5445-4940-4435-39 Unknown
9.0% 17.1% 48.7 5.6% 13.0% 16.4% 7.7% 16.7% 532South Orange 14.5%
11.8% 13.2% 45.1 2.7% 6.7% 21.8% 12.1% 17.2% 372Southwestern 14.5%
10.0% 13.3% 46.0 3.6% 10.7% 20.7% 11.8% 15.7% 618State Center 14.2%
10.1% 18.9% 48.7 2.7% 12.6% 13.0% 9.2% 18.2% 477Ventura 15.3%
13.5% 14.6% 48.1 2.2% 8.1% 10.8% 8.1% 25.4% 185Victor Valley 17.3%
13.4% 5.9% 37.3 1.2% 3.1% 46.5% 10.6% 7.9% 254West Hills 11.4%
14.8% 10.6% 43.7 2.8% 7.0% 26.1% 12.0% 15.5% 142West Kern 11.3%
7.8% 18.8% 49.3 6.0% 11.0% 12.8% 11.0% 18.1% 282West Valley-Mission 14.5%
11.8% 14.1% 44.1 2.5% 8.0% 25.7% 9.9% 14.7% 646Yosemite 13.3%
10.3% 19.4% 47.3 0.6% 6.9% 13.1% 10.9% 18.3% 175Yuba 20.6%
Statewide Total: 17.8% 10.1% 11.4% 14.5% 15.5% 9.8% 4.4% 16.5% 24,264 0.0% 47.1
Note: Employee age is calculated from data element (EB02) Employee-Birth-Date as reported by the district.
Data Element Definitions: California Community Colleges Management Information System Data Element Dictionary
All Districts Reporting
Data Source: CCCCO MIS Database for the reporting period Fall Term 2010 Page 52 of 104
June 30, 2011

California Community Colleges Chancellor's OfficeReport on Staffing for Fall 2010
Employee Category Employee Status Headcount Distribution by District
Educational Administrator
Continuing
# % # # % # % # %
DistrictwideHeadcount
Retired AnnuitantReclassified PromotedNew Hire
11.11% 18 6 27 66.67% 3 22.22%Allan Hancock
3.70% 26 27 96.30% 1Antelope Valley
10 10 100.00%Barstow
4.76% 4.76% 16 3 21 76.19% 1 14.29% 1Butte
15 15 100.00%Cabrillo
4.17% 23 24 95.83% 1Cerritos
9.09% 20 22 90.91% 2Chabot-Las Positas
47.06% 9 17 52.94% 8Chaffey
29 1 30 96.67% 3.33%Citrus
8.00% 44 2 50 88.00% 4 4.00%Coast
14 14 100.00%Compton
55 55 100.00%Contra Costa
18.18% 8 1 11 72.73% 2 9.09%Copper Mountain
22.22% 14 18 77.78% 4Desert
4.00% 24 25 96.00% 1El Camino
20.00% 4 5 80.00% 1Feather River
6.52% 41 2 46 89.13% 3 4.35%Foothill-Deanza
19 19 100.00%Gavilan
31 31 100.00%Glendale
33 33 100.00%Grossmont-Cuyamaca
14.29% 6 7 85.71% 1Hartnell
13.33% 11 2 15 73.33% 2 13.33%Imperial
10.34% 3.45% 24 1 29 82.76% 3 3.45% 1Kern
50.00% 2 1 6 33.33% 3 16.67%Lake Tahoe
6 6 100.00%Lassen
3.03% 3.03% 31 33 93.94% 1 1Long Beach
108 6 114 94.74% 5.26%Los Angeles
6.25% 69 6 80 86.25% 5 7.50%Los Rios
13.04% 19 1 23 82.61% 3 4.35%Marin
8 8 100.00%Mendocino-Lake
16 16 100.00%Merced
15 15 100.00%Mira Costa
10.00% 9 10 90.00% 1Monterey
5.26% 35 1 38 92.11% 2 2.63%Mt. San Antonio
7.14% 13 14 92.86% 1Mt. San Jacinto
12.50% 14 16 87.50% 2Napa Valley
4.08% 45 2 49 91.84% 2 4.08%North Orange
26.67% 11 15 73.33% 4Ohlone
Note: Employee Status is determined from (EB09) Employee-Employment-Status as reported by the district.
Data Element Definitions: California Community Colleges Management Information System Data Element Dictionary
All Districts Reporting
Data Source: CCCCO MIS Database for the reporting period Fall Term 2010 Page 53 of 104
June 30, 2011

California Community Colleges Chancellor's OfficeReport on Staffing for Fall 2010
Employee Category Employee Status Headcount Distribution by District
Educational Administrator
Continuing
# % # # % # % # %
DistrictwideHeadcount
Retired AnnuitantReclassified PromotedNew Hire
14.29% 6 7 85.71% 1Palo Verde
22 22 100.00%Palomar
2.78% 35 36 97.22% 1Pasadena
1.67% 59 60 98.33% 1Peralta
2.00% 22.00% 38 50 76.00% 1 11Rancho Santiago
4.55% 17 4 22 77.27% 1 18.18%Redwoods
23 23 100.00%Rio Hondo
10.91% 18.18% 38 1 55 69.09% 6 1.82% 10Riverside
44.12% 18 1 34 52.94% 15 2.94%San Bernardino
8.42% 3.16% 84 95 88.42% 8 3San Diego
43 43 100.00%San Francisco
12 12 100.00%San Joaquin Delta
13.64% 19 22 86.36% 3San Jose-Evergreen
14.29% 12 14 85.71% 2San Luis Obispo
9.68% 28 31 90.32% 3San Mateo
1 1 100.00%Santa Barbara
6.90% 3.45% 25 1 29 86.21% 2 3.45% 1Santa Clarita
44 44 100.00%Santa Monica
2.70% 36 37 97.30% 1Sequoias
7.41% 25 27 92.59% 2Shasta-Tehama-Trinity
5.26% 16 2 19 84.21% 1 10.53%Sierra
40.00% 3 5 60.00% 2Siskiyous
27.27% 7 1 11 63.64% 3 9.09%Solano
5.56% 2.78% 33 36 91.67% 2 1Sonoma
12.90% 27 31 87.10% 4South Orange
21.74% 12 6 23 52.17% 5 26.09%Southwestern
7.55% 49 53 92.45% 4State Center
3.70% 26 27 96.30% 1Ventura
7.69% 12 13 92.31% 1Victor Valley
11.11% 55 1 63 87.30% 1.59% 7West Hills
16.67% 5 6 83.33% 1West Kern
10.53% 17 19 89.47% 2West Valley-Mission
3.13% 43.75% 17 32 53.13% 1 14Yosemite
24 24 100.00%Yuba
2,020Statewide Total: 88.27% 6.04% 2.57% 3.02% .10%
Note: Employee Status is determined from (EB09) Employee-Employment-Status as reported by the district.
Data Element Definitions: California Community Colleges Management Information System Data Element Dictionary
All Districts Reporting
Data Source: CCCCO MIS Database for the reporting period Fall Term 2010 Page 54 of 104
June 30, 2011

California Community Colleges Chancellor's OfficeReport on Staffing for Fall 2010
Employee Category Employee Status Headcount Distribution by District
Tenured/Tenure Track
Continuing
# % # # % # % # %
DistrictwideHeadcount
Retired AnnuitantReclassified PromotedNew Hire
16.45% 127 152 83.55% 25Allan Hancock
183 183 100.00%Antelope Valley
39 39 100.00%Barstow
4.57% 167 175 95.43% 8Butte
207 1 208 99.52% 0.48%Cabrillo
0.36% 276 277 99.64% 1Cerritos
5.63% 268 284 94.37% 16Chabot-Las Positas
1.98% 1.49% 195 202 96.53% 4 3Chaffey
1.79% 159 6 168 94.64% 3 3.57%Citrus
0.23% 430 1 432 99.54% 0.23% 1Coast
4.76% 80 84 95.24% 4Compton
1.13% 0.23% 438 444 98.65% 5 1Contra Costa
31 31 100.00%Copper Mountain
0.93% 106 107 99.07% 1Desert
5.76% 310 1 330 93.94% 19 0.30%El Camino
25 25 100.00%Feather River
507 507 100.00%Foothill-Deanza
1.27% 78 79 98.73% 1Gavilan
0.43% 232 233 99.57% 1Glendale
306 306 100.00%Grossmont-Cuyamaca
1.16% 85 86 98.84% 1Hartnell
3.57% 135 140 96.43% 5Imperial
5.36% 353 373 94.64% 20Kern
40 40 100.00%Lake Tahoe
10.00% 36 40 90.00% 4Lassen
0.32% 315 316 99.68% 1Long Beach
0.16% 0.16% 1,252 1 1,257 99.60% 2 0.08% 2Los Angeles
2.06% 998 1,019 97.94% 21Los Rios
3.41% 85 88 96.59% 3Marin
6.00% 47 50 94.00% 3Mendocino-Lake
2.91% 1.16% 165 172 95.93% 5 2Merced
1.81% 163 166 98.19% 3Mira Costa
5.17% 110 116 94.83% 6Monterey
4.15% 367 3 386 95.08% 16 0.78%Mt. San Antonio
1.33% 148 150 98.67% 2Mt. San Jacinto
94 94 100.00%Napa Valley
2.81% 515 4 534 96.44% 15 0.75%North Orange
122 122 100.00%Ohlone
Note: Employee Status is determined from (EB09) Employee-Employment-Status as reported by the district.
Data Element Definitions: California Community Colleges Management Information System Data Element Dictionary
All Districts Reporting
Data Source: CCCCO MIS Database for the reporting period Fall Term 2010 Page 55 of 104
June 30, 2011
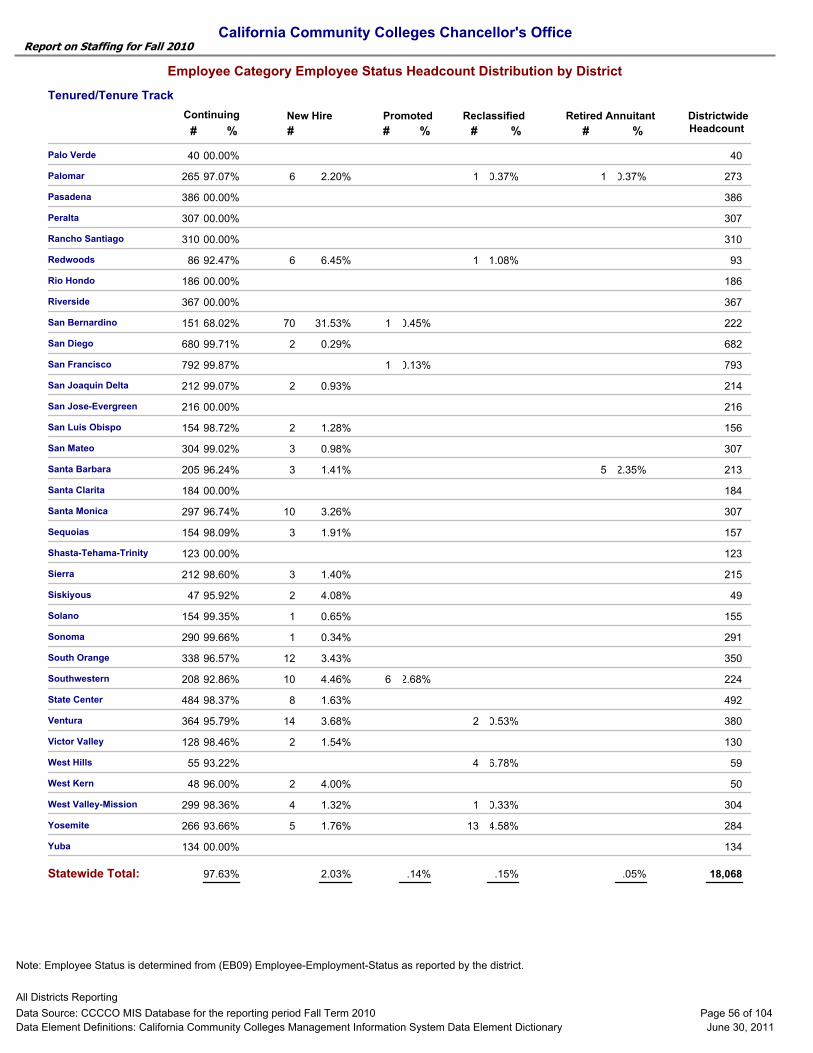
California Community Colleges Chancellor's OfficeReport on Staffing for Fall 2010
Employee Category Employee Status Headcount Distribution by District
Tenured/Tenure Track
Continuing
# % # # % # % # %
DistrictwideHeadcount
Retired AnnuitantReclassified PromotedNew Hire
40 40 100.00%Palo Verde
2.20% 0.37% 0.37% 265 273 97.07% 6 1 1Palomar
386 386 100.00%Pasadena
307 307 100.00%Peralta
310 310 100.00%Rancho Santiago
6.45% 1.08% 86 93 92.47% 6 1Redwoods
186 186 100.00%Rio Hondo
367 367 100.00%Riverside
31.53% 151 1 222 68.02% 70 0.45%San Bernardino
0.29% 680 682 99.71% 2San Diego
792 1 793 99.87% 0.13%San Francisco
0.93% 212 214 99.07% 2San Joaquin Delta
216 216 100.00%San Jose-Evergreen
1.28% 154 156 98.72% 2San Luis Obispo
0.98% 304 307 99.02% 3San Mateo
1.41% 2.35% 205 213 96.24% 3 5Santa Barbara
184 184 100.00%Santa Clarita
3.26% 297 307 96.74% 10Santa Monica
1.91% 154 157 98.09% 3Sequoias
123 123 100.00%Shasta-Tehama-Trinity
1.40% 212 215 98.60% 3Sierra
4.08% 47 49 95.92% 2Siskiyous
0.65% 154 155 99.35% 1Solano
0.34% 290 291 99.66% 1Sonoma
3.43% 338 350 96.57% 12South Orange
4.46% 208 6 224 92.86% 10 2.68%Southwestern
1.63% 484 492 98.37% 8State Center
3.68% 0.53% 364 380 95.79% 14 2Ventura
1.54% 128 130 98.46% 2Victor Valley
6.78% 55 59 93.22% 4West Hills
4.00% 48 50 96.00% 2West Kern
1.32% 0.33% 299 304 98.36% 4 1West Valley-Mission
1.76% 4.58% 266 284 93.66% 5 13Yosemite
134 134 100.00%Yuba
18,068Statewide Total: 97.63% 2.03% .14% .15% .05%
Note: Employee Status is determined from (EB09) Employee-Employment-Status as reported by the district.
Data Element Definitions: California Community Colleges Management Information System Data Element Dictionary
All Districts Reporting
Data Source: CCCCO MIS Database for the reporting period Fall Term 2010 Page 56 of 104
June 30, 2011

California Community Colleges Chancellor's OfficeReport on Staffing for Fall 2010
Employee Category Employee Status Headcount Distribution by District
Academic Temporary
Continuing
# % # # % # % # %
DistrictwideHeadcount
Retired AnnuitantReclassified PromotedNew Hire
20.18% 360 451 79.82% 91Allan Hancock
8.47% 1.69% 371 413 89.83% 35 7Antelope Valley
110 110 100.00%Barstow
11.23% 0.18% 489 552 88.59% 62 1Butte
4.18% 367 383 95.82% 16Cabrillo
13.33% 2.15% 393 465 84.52% 62 10Cerritos
5.75% 557 591 94.25% 34Chabot-Las Positas
0.16% 0.16% 623 625 99.68% 1 1Chaffey
11.11% 232 261 88.89% 29Citrus
4.41% 0.56% 1,013 1,066 95.03% 47 6Coast
20.81% 2.26% 170 221 76.92% 46 5Compton
7.63% 0.11% 871 944 92.27% 72 1Contra Costa
16.16% 1.01% 82 99 82.83% 16 1Copper Mountain
13.93% 309 359 86.07% 50Desert
4.69% 1.37% 481 512 93.95% 24 7El Camino
1.59% 62 63 98.41% 1Feather River
822 822 100.00%Foothill-Deanza
13.94% 179 208 86.06% 29Gavilan
7.92% 488 530 92.08% 42Glendale
914 914 100.00%Grossmont-Cuyamaca
11.66% 197 223 88.34% 26Hartnell
10.48% 188 210 89.52% 22Imperial
490 490 100.00%Kern
122 122 100.00%Lake Tahoe
7.22% 1.03% 89 97 91.75% 7 1Lassen
6.35% 2.93% 557 614 90.72% 39 18Long Beach
10.50% 0.50% 2,875 3,230 89.01% 339 16Los Angeles
13.94% 6.83% 1,171 1,478 79.23% 206 101Los Rios
7.97% 2.39% 225 251 89.64% 20 6Marin
12.21% 230 262 87.79% 32Mendocino-Lake
6.27% 0.28% 328 351 93.45% 22 1Merced
98.94% 5 472 1.06% 467Mira Costa
6.25% 255 272 93.75% 17Monterey
3.64% 795 825 96.36% 30Mt. San Antonio
7.84% 517 561 92.16% 44Mt. San Jacinto
8.96% 9.68% 227 279 81.36% 25 27Napa Valley
3.87% 1,092 1,136 96.13% 44North Orange
13.50% 282 326 86.50% 44Ohlone
Note: Employee Status is determined from (EB09) Employee-Employment-Status as reported by the district.
Data Element Definitions: California Community Colleges Management Information System Data Element Dictionary
All Districts Reporting
Data Source: CCCCO MIS Database for the reporting period Fall Term 2010 Page 57 of 104
June 30, 2011
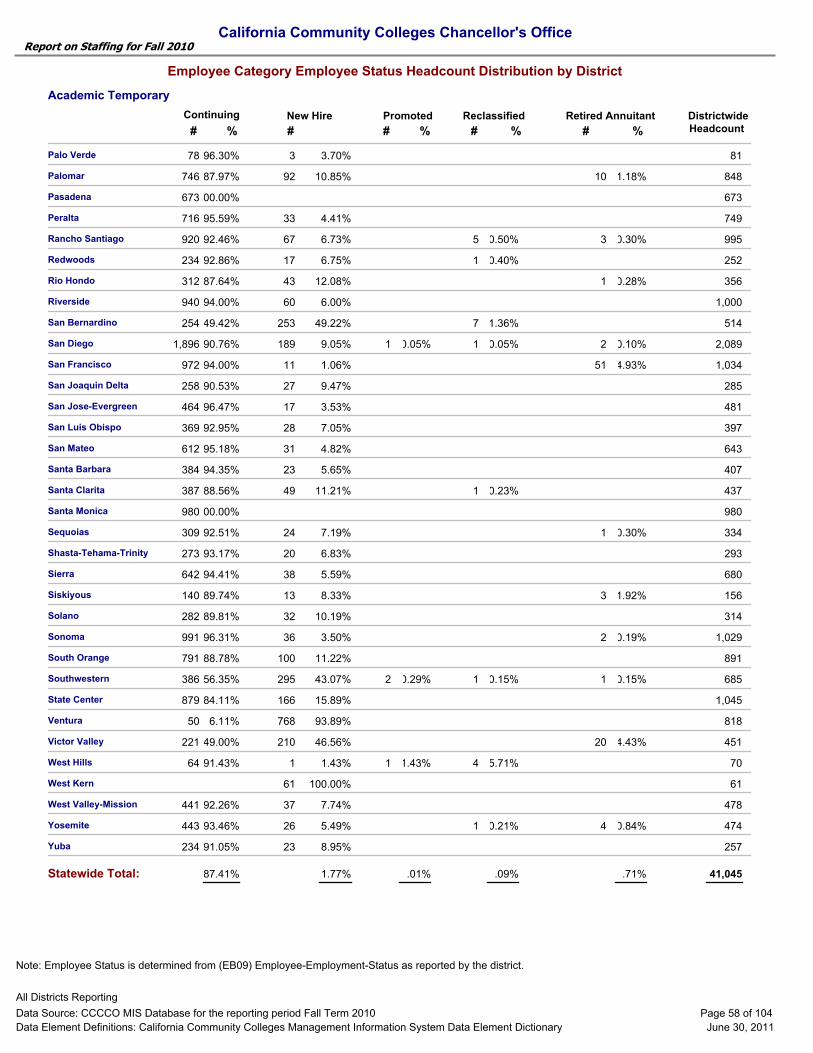
California Community Colleges Chancellor's OfficeReport on Staffing for Fall 2010
Employee Category Employee Status Headcount Distribution by District
Academic Temporary
Continuing
# % # # % # % # %
DistrictwideHeadcount
Retired AnnuitantReclassified PromotedNew Hire
3.70% 78 81 96.30% 3Palo Verde
10.85% 1.18% 746 848 87.97% 92 10Palomar
673 673 100.00%Pasadena
4.41% 716 749 95.59% 33Peralta
6.73% 0.50% 0.30% 920 995 92.46% 67 5 3Rancho Santiago
6.75% 0.40% 234 252 92.86% 17 1Redwoods
12.08% 0.28% 312 356 87.64% 43 1Rio Hondo
6.00% 940 1,000 94.00% 60Riverside
49.22% 1.36% 254 514 49.42% 253 7San Bernardino
9.05% 0.05% 0.10% 1,896 1 2,089 90.76% 189 0.05% 1 2San Diego
1.06% 4.93% 972 1,034 94.00% 11 51San Francisco
9.47% 258 285 90.53% 27San Joaquin Delta
3.53% 464 481 96.47% 17San Jose-Evergreen
7.05% 369 397 92.95% 28San Luis Obispo
4.82% 612 643 95.18% 31San Mateo
5.65% 384 407 94.35% 23Santa Barbara
11.21% 0.23% 387 437 88.56% 49 1Santa Clarita
980 980 100.00%Santa Monica
7.19% 0.30% 309 334 92.51% 24 1Sequoias
6.83% 273 293 93.17% 20Shasta-Tehama-Trinity
5.59% 642 680 94.41% 38Sierra
8.33% 1.92% 140 156 89.74% 13 3Siskiyous
10.19% 282 314 89.81% 32Solano
3.50% 0.19% 991 1,029 96.31% 36 2Sonoma
11.22% 791 891 88.78% 100South Orange
43.07% 0.15% 0.15% 386 2 685 56.35% 295 0.29% 1 1Southwestern
15.89% 879 1,045 84.11% 166State Center
93.89% 50 818 6.11% 768Ventura
46.56% 4.43% 221 451 49.00% 210 20Victor Valley
1.43% 5.71% 64 1 70 91.43% 1 1.43% 4West Hills
100.00% 61 61West Kern
7.74% 441 478 92.26% 37West Valley-Mission
5.49% 0.21% 0.84% 443 474 93.46% 26 1 4Yosemite
8.95% 234 257 91.05% 23Yuba
41,045Statewide Total: 87.41% 11.77% .01% .09% .71%
Note: Employee Status is determined from (EB09) Employee-Employment-Status as reported by the district.
Data Element Definitions: California Community Colleges Management Information System Data Element Dictionary
All Districts Reporting
Data Source: CCCCO MIS Database for the reporting period Fall Term 2010 Page 58 of 104
June 30, 2011

California Community Colleges Chancellor's OfficeReport on Staffing for Fall 2010
Employee Category Employee Status Headcount Distribution by District
Classified Administrator
Continuing
# % # # % # % # %
DistrictwideHeadcount
Retired AnnuitantReclassified PromotedNew Hire
4 4 100.00%Allan Hancock
Antelope Valley
10 10 100.00%Barstow
15.38% 15.38% 16 2 26 61.54% 4 7.69% 4Butte
15.79% 16 19 84.21% 3Cabrillo
3.85% 25 26 96.15% 1Cerritos
7.89% 35 38 92.11% 3Chabot-Las Positas
23.53% 12 1 17 70.59% 5.88% 4Chaffey
16.67% 5 6 83.33% 1Citrus
83 83 100.00%Coast
7 7 100.00%Compton
2.00% 49 50 98.00% 1Contra Costa
Copper Mountain
12.50% 7 8 87.50% 1Desert
12.50% 28 32 87.50% 4El Camino
18.75% 13 16 81.25% 3Feather River
31 2 33 93.94% 6.06%Foothill-Deanza
16.67% 5 6 83.33% 1Gavilan
32 32 100.00%Glendale
10 10 100.00%Grossmont-Cuyamaca
18 1 19 94.74% 5.26%Hartnell
100.00% 1 1Imperial
7.55% 1.89% 48 53 90.57% 4 1Kern
50.00% 1 2 50.00% 1Lake Tahoe
11.11% 11.11% 7 9 77.78% 1 1Lassen
20 20 100.00%Long Beach
35 5 40 87.50% 12.50%Los Angeles
40 40 100.00%Los Rios
50.00% 1 2 1 50.00%Marin
8.33% 11 12 91.67% 1Mendocino-Lake
7.69% 24 26 92.31% 2Merced
7.14% 57.14% 5 14 35.71% 1 8Mira Costa
12 12 100.00%Monterey
17.14% 2.86% 28 35 80.00% 6 1Mt. San Antonio
10 10 100.00%Mt. San Jacinto
13 13 100.00%Napa Valley
48 1 49 97.96% 2.04%North Orange
14.81% 3.70% 22 27 81.48% 4 1Ohlone
Note: Employee Status is determined from (EB09) Employee-Employment-Status as reported by the district.
Data Element Definitions: California Community Colleges Management Information System Data Element Dictionary
All Districts Reporting
Data Source: CCCCO MIS Database for the reporting period Fall Term 2010 Page 59 of 104
June 30, 2011

California Community Colleges Chancellor's OfficeReport on Staffing for Fall 2010
Employee Category Employee Status Headcount Distribution by District
Classified Administrator
Continuing
# % # # % # % # %
DistrictwideHeadcount
Retired AnnuitantReclassified PromotedNew Hire
Palo Verde
5.88% 16 17 94.12% 1Palomar
9 9 100.00%Pasadena
Peralta
28.57% 5 7 71.43% 2Rancho Santiago
3.03% 9.09% 29 33 87.88% 1 3Redwoods
11.11% 8 9 88.89% 1Rio Hondo
5.00% 7.50% 35 40 87.50% 2 3Riverside
65.71% 11 1 35 31.43% 23 2.86%San Bernardino
San Diego
2 2 100.00%San Francisco
10.53% 34 38 89.47% 4San Joaquin Delta
13.04% 8.70% 16 2 23 69.57% 3 8.70% 2San Jose-Evergreen
11 11 100.00%San Luis Obispo
16 16 100.00%San Mateo
9.43% 46 2 53 86.79% 5 3.77%Santa Barbara
10.34% 17.24% 41 1 58 70.69% 6 1.72% 10Santa Clarita
50 3 53 94.34% 5.66%Santa Monica
3 3 100.00%Sequoias
6.67% 13 1 15 86.67% 1 6.67%Shasta-Tehama-Trinity
4.17% 4.17% 22 24 91.67% 1 1Sierra
1 1 100.00%Siskiyous
18.18% 9 11 81.82% 2Solano
7 7 100.00%Sonoma
50 50 100.00%South Orange
32.35% 2.94% 19 3 34 55.88% 11 8.82% 1Southwestern
10.00% 26 1 30 86.67% 3 3.33%State Center
7 7 100.00%Ventura
1 1 100.00%Victor Valley
1 1 100.00%West Hills
9 9 100.00%West Kern
13.33% 6.67% 12 15 80.00% 2 1West Valley-Mission
60.00% 17 3 50 34.00% 6.00% 30Yosemite
5.88% 16 17 94.12% 1Yuba
1,486Statewide Total: 85.60% 7.47% 2.02% 4.91%
Note: Employee Status is determined from (EB09) Employee-Employment-Status as reported by the district.
Data Element Definitions: California Community Colleges Management Information System Data Element Dictionary
All Districts Reporting
Data Source: CCCCO MIS Database for the reporting period Fall Term 2010 Page 60 of 104
June 30, 2011

California Community Colleges Chancellor's OfficeReport on Staffing for Fall 2010
Employee Category Employee Status Headcount Distribution by District
Classified Professional
Continuing
# % # # % # % # %
DistrictwideHeadcount
Retired AnnuitantReclassified PromotedNew Hire
28.00% 17 1 25 68.00% 7 4.00%Allan Hancock
36 36 100.00%Antelope Valley
Barstow
8.70% 21 23 91.30% 2Butte
Cabrillo
50.00% 2 1 6 33.33% 3 16.67%Cerritos
1 1 100.00%Chabot-Las Positas
4.76% 4.76% 19 21 90.48% 1 1Chaffey
6.06% 29 2 33 87.88% 2 6.06%Citrus
3 3 100.00%Coast
14 14 100.00%Compton
64 64 100.00%Contra Costa
5 5 100.00%Copper Mountain
9.09% 10 11 90.91% 1Desert
3.51% 55 57 96.49% 2El Camino
2 2 100.00%Feather River
1.22% 160 2 164 97.56% 2 1.22%Foothill-Deanza
13 13 100.00%Gavilan
13 13 100.00%Glendale
33 33 100.00%Grossmont-Cuyamaca
10.00% 9 10 90.00% 1Hartnell
10.53% 15.79% 13 1 19 68.42% 2 5.26% 3Imperial
5.26% 54 57 94.74% 3Kern
4 4 100.00%Lake Tahoe
14.29% 5 1 7 71.43% 14.29% 1Lassen
3.70% 26 27 96.30% 1Long Beach
197 22 219 89.95% 10.05%Los Angeles
2.56% 75 1 78 96.15% 2 1.28%Los Rios
25.00% 12 16 75.00% 4Marin
Mendocino-Lake
2 2 100.00%Merced
18 18 100.00%Mira Costa
11.76% 14 1 17 82.35% 2 5.88%Monterey
25.00% 3 4 75.00% 1Mt. San Antonio
29.27% 58 82 70.73% 24Mt. San Jacinto
5 5 100.00%Napa Valley
1 1 100.00%North Orange
15.79% 16 19 84.21% 3Ohlone
Note: Employee Status is determined from (EB09) Employee-Employment-Status as reported by the district.
Data Element Definitions: California Community Colleges Management Information System Data Element Dictionary
All Districts Reporting
Data Source: CCCCO MIS Database for the reporting period Fall Term 2010 Page 61 of 104
June 30, 2011

California Community Colleges Chancellor's OfficeReport on Staffing for Fall 2010
Employee Category Employee Status Headcount Distribution by District
Classified Professional
Continuing
# % # # % # % # %
DistrictwideHeadcount
Retired AnnuitantReclassified PromotedNew Hire
33.33% 2 3 66.67% 1Palo Verde
5.41% 35 37 94.59% 2Palomar
Pasadena
1.15% 86 87 98.85% 1Peralta
5.41% 2.70% 33 1 37 89.19% 2 2.70% 1Rancho Santiago
3.57% 21.43% 40 2 56 71.43% 2 3.57% 12Redwoods
3 3 100.00%Rio Hondo
9.09% 20.45% 30 1 44 68.18% 4 2.27% 9Riverside
60.42% 15 4 48 31.25% 29 8.33%San Bernardino
8.22% 67 73 91.78% 6San Diego
80 80 100.00%San Francisco
16 16 100.00%San Joaquin Delta
4.76% 20 21 95.24% 1San Jose-Evergreen
17 1 18 94.44% 5.56%San Luis Obispo
1.43% 69 70 98.57% 1San Mateo
4.90% 2.94% 94 102 92.16% 5 3Santa Barbara
28.57% 5 7 71.43% 2Santa Clarita
Santa Monica
8 8 100.00%Sequoias
Shasta-Tehama-Trinity
Sierra
23 1 24 95.83% 4.17%Siskiyous
5 2 7 71.43% 28.57%Solano
3.28% 59 61 96.72% 2Sonoma
6.67% 14 15 93.33% 1South Orange
Southwestern
13.79% 25 29 86.21% 4State Center
4.17% 4.17% 22 24 91.67% 1 1Ventura
4.35% 22 23 95.65% 1Victor Valley
8.33% 4.17% 63 72 87.50% 6 3West Hills
14.29% 12 14 85.71% 2West Kern
12.50% 32.50% 22 40 55.00% 5 13West Valley-Mission
24.00% 19 25 76.00% 6Yosemite
13 13 100.00%Yuba
2,166Statewide Total: 89.01% 4.57% 2.03% 4.11% .28%
Note: Employee Status is determined from (EB09) Employee-Employment-Status as reported by the district.
Data Element Definitions: California Community Colleges Management Information System Data Element Dictionary
All Districts Reporting
Data Source: CCCCO MIS Database for the reporting period Fall Term 2010 Page 62 of 104
June 30, 2011

California Community Colleges Chancellor's OfficeReport on Staffing for Fall 2010
Employee Category Employee Status Headcount Distribution by District
Classified Support
Continuing
# % # # % # % # %
DistrictwideHeadcount
Retired AnnuitantReclassified PromotedNew Hire
10.16% 139 29 187 74.33% 19 15.51%Allan Hancock
6.70% 181 194 93.30% 13Antelope Valley
1.96% 50 51 98.04% 1Barstow
14.07% 11.48% 201 270 74.44% 38 31Butte
0.77% 256 2 260 98.46% 2 0.77%Cabrillo
3.80% 303 1 316 95.89% 12 0.32%Cerritos
3.65% 0.84% 339 1 356 95.22% 13 0.28% 3Chabot-Las Positas
3.98% 21.51% 185 2 251 73.71% 10 0.80% 54Chaffey
3.44% 279 2 291 95.88% 10 0.69%Citrus
0.13% 0.79% 756 763 99.08% 1 6Coast
3.74% 103 107 96.26% 4Compton
1.37% 2.73% 350 1 366 95.63% 5 0.27% 10Contra Costa
4.26% 45 47 95.74% 2Copper Mountain
7.04% 1.51% 180 2 199 90.45% 14 1.01% 3Desert
2.56% 342 351 97.44% 9El Camino
2.22% 4.44% 40 2 45 88.89% 1 4.44% 2Feather River
0.89% 438 8 450 97.33% 4 1.78%Foothill-Deanza
0.88% 112 113 99.12% 1Gavilan
0.32% 307 308 99.68% 1Glendale
393 393 100.00%Grossmont-Cuyamaca
4.17% 1.67% 112 1 120 93.33% 5 0.83% 2Hartnell
1.41% 2.11% 134 3 142 94.37% 2 2.11% 3Imperial
3.01% 0.50% 381 4 399 95.49% 12 1.00% 2Kern
5.66% 49 1 53 92.45% 3 1.89%Lake Tahoe
7.55% 5.66% 46 53 86.79% 4 3Lassen
3.60% 0.20% 481 500 96.20% 18 1Long Beach
1,730 98 1,828 94.64% 5.36%Los Angeles
3.71% 991 22 1,052 94.20% 39 2.09%Los Rios
4.69% 183 192 95.31% 9Marin
83 1 84 98.81% 1.19%Mendocino-Lake
1.19% 0.40% 247 2 253 97.63% 3 0.79% 1Merced
3.35% 2.93% 224 239 93.72% 8 7Mira Costa
16.85% 152 1 184 82.61% 31 0.54%Monterey
35.68% 350 7 555 63.06% 198 1.26%Mt. San Antonio
7.52% 6.64% 193 1 226 85.40% 17 0.44% 15Mt. San Jacinto
3.21% 151 156 96.79% 5Napa Valley
0.79% 621 5 631 98.42% 5 0.79%North Orange
5.00% 6.88% 136 5 160 85.00% 8 3.13% 11Ohlone
Note: Employee Status is determined from (EB09) Employee-Employment-Status as reported by the district.
Data Element Definitions: California Community Colleges Management Information System Data Element Dictionary
All Districts Reporting
Data Source: CCCCO MIS Database for the reporting period Fall Term 2010 Page 63 of 104
June 30, 2011

California Community Colleges Chancellor's OfficeReport on Staffing for Fall 2010
Employee Category Employee Status Headcount Distribution by District
Classified Support
Continuing
# % # # % # % # %
DistrictwideHeadcount
Retired AnnuitantReclassified PromotedNew Hire
6.41% 2.56% 71 78 91.03% 5 2Palo Verde
3.02% 384 1 397 96.73% 12 0.25%Palomar
1.09% 363 367 98.91% 4Pasadena
2.48% 314 322 97.52% 8Peralta
1.31% 4.43% 574 1 610 94.10% 8 0.16% 27Rancho Santiago
6.30% 34.65% 74 1 127 58.27% 8 0.79% 44Redwoods
0.79% 0.40% 249 1 253 98.42% 2 0.40% 1Rio Hondo
9.35% 10.97% 439 4 556 78.96% 52 0.72% 61Riverside
60.53% 124 11 342 36.26% 207 3.22%San Bernardino
6.51% 0.81% 909 2 983 92.47% 64 0.20% 8San Diego
0.67% 744 749 99.33% 5San Francisco
1.32% 449 455 98.68% 6San Joaquin Delta
2.74% 14.29% 270 3 329 82.07% 9 0.91% 47San Jose-Evergreen
11.30% 200 4 230 86.96% 26 1.74%San Luis Obispo
1.56% 378 384 98.44% 6San Mateo
3.46% 1.38% 1.38% 271 289 93.77% 10 4 4Santa Barbara
1.79% 22.32% 170 224 75.89% 4 50Santa Clarita
0.43% 445 14 461 96.53% 3.04% 2Santa Monica
2.99% 1.99% 187 4 201 93.03% 6 1.99% 4Sequoias
9.05% 182 9 210 86.67% 19 4.29%Shasta-Tehama-Trinity
5.13% 0.43% 221 234 94.44% 12 1Sierra
5.00% 71 5 80 88.75% 4 6.25%Siskiyous
4.46% 0.64% 148 1 157 94.27% 7 0.64% 1Solano
1.76% 0.25% 390 398 97.99% 7 1Sonoma
5.08% 505 532 94.92% 27South Orange
36.56% 0.81% 216 17 372 58.06% 136 4.57% 3Southwestern
6.63% 572 5 618 92.56% 41 0.81%State Center
4.40% 4.82% 426 7 477 89.31% 21 1.47% 23Ventura
2.16% 180 1 185 97.30% 4 0.54%Victor Valley
12.99% 7.09% 196 7 254 77.17% 33 2.76% 18West Hills
2.82% 138 142 97.18% 4West Kern
3.55% 7.80% 242 8 282 85.82% 10 2.84% 22West Valley-Mission
6.04% 57.59% 230 5 646 35.60% 39 0.77% 372Yosemite
3.43% 169 175 96.57% 6Yuba
24,264Statewide Total: 89.70% 5.51% 1.29% 3.46% .04%
Note: Employee Status is determined from (EB09) Employee-Employment-Status as reported by the district.
Data Element Definitions: California Community Colleges Management Information System Data Element Dictionary
All Districts Reporting
Data Source: CCCCO MIS Database for the reporting period Fall Term 2010 Page 64 of 104
June 30, 2011

California Community Colleges Chancellor's OfficeReport on Staffing for Fall 2010
Employee Category Salary Distribution by District
Educational Administrator
Less than 25,000 HeadcountUnknown
Greater than
80,001
70,001 to 80,000
60,001 to 70,000
50,001 to 60,000
40,001 to 50,000
25,000 to 40,000 Avg Salary
3.7% 3.7% 27 $110,697 92.6%Allan Hancock
27 $104,480 18.5% 81.5%Antelope Valley
20.0% 10 $107,131 80.0%Barstow
4.8% 21 $127,713 95.2%Butte
13.3% 15 $130,069 86.7%Cabrillo
4.2% 24 $127,666 95.8%Cerritos
22 $148,636 100.0%Chabot-Las Positas
17 $157,966 100.0%Chaffey
3.3% 30 $143,462 96.7%Citrus
4.0% 50 $140,567 96.0%Coast
7.1% 14 $117,661 92.9%Compton
55 $137,415 3.6% 96.4%Contra Costa
9.1% 9.1% 11 $102,626 9.1% 72.7%Copper Mountain
18 $134,583 100.0%Desert
25 $139,425 100.0%El Camino
20.0% 20.0% 5 $86,892 20.0% 40.0%Feather River
46 $131,421 8.7% 91.3%Foothill-Deanza
5.3% 5.3% 19 $82,514 36.8% 52.6%Gavilan
3.2% 31 $123,198 3.2% 3.2% 90.3%Glendale
3.0% 3.0% 3.0% 33 $118,744 3.0% 87.9%Grossmont-Cuyamaca
14.3% 7 $126,067 85.7%Hartnell
15 $139,832 100.0%Imperial
3.4% 29 $127,344 96.6%Kern
6 $118,680 100.0%Lake Tahoe
16.7% 16.7% 6 $88,293 16.7% 50.0%Lassen
33 $132,351 3.0% 97.0%Long Beach
.9% 114 $133,974 99.1%Los Angeles
80 $132,519 1.3% 98.8%Los Rios
4.3% 23 $109,585 95.7%Marin
12.5% 8 $114,177 87.5%Mendocino-Lake
6.3% 16 $126,048 6.3% 87.5%Merced
15 $184,938 100.0%Mira Costa
10 $140,266 100.0%Monterey
38 $136,821 100.0%Mt. San Antonio
14 $130,407 7.1% 92.9%Mt. San Jacinto
12.5% 16 $105,898 12.5% 75.0%Napa Valley
49 $130,338 2.0% 98.0%North Orange
15 $151,492 100.0%Ohlone
Note: Any salary reported as 888888 or 0 is set to unknown. Unknown salary and headcount is excluded form the average annual salary calculation. Average Annual Salary = (Sum of annual salaries)/Total Headcount
Data Element Definitions: California Community Colleges Management Information System Data Element Dictionary
All Districts Reporting
Data Source: CCCCO MIS Database for the reporting period Fall Term 2010 Page 65 of 104
June 30, 2011

California Community Colleges Chancellor's OfficeReport on Staffing for Fall 2010
Employee Category Salary Distribution by District
Educational Administrator
Less than 25,000 HeadcountUnknown
Greater than
80,001
70,001 to 80,000
60,001 to 70,000
50,001 to 60,000
40,001 to 50,000
25,000 to 40,000 Avg Salary
7 $126,201 100.0%Palo Verde
4.5% 22 $139,017 95.5%Palomar
36 $143,404 100.0%Pasadena
1.7% 60 $118,562 1.7% 96.7%Peralta
2.0% 4.0% 50 $129,799 2.0% 4.0% 88.0%Rancho Santiago
4.5% 22 $105,829 4.5% 22.7% 13.6% 54.5%Redwoods
23 $147,202 100.0%Rio Hondo
55 $136,775 100.0%Riverside
34 $123,708 100.0%San Bernardino
95 $132,646 1.1% 98.9%San Diego
43 $140,932 100.0%San Francisco
12 $136,956 100.0%San Joaquin Delta
22 $134,863 100.0%San Jose-Evergreen
7.1% 14 $115,797 7.1% 85.7%San Luis Obispo
31 $148,581 100.0%San Mateo
100.0% 1 $52,362Santa Barbara
3.4% 3.4% 29 $126,487 93.1%Santa Clarita
44 $137,258 2.3% 97.7%Santa Monica
10.8% 5.4% 37 $110,935 83.8%Sequoias
7.4% 7.4% 27 $91,926 11.1% 3.7% 70.4%Shasta-Tehama-Trinity
19 $132,005 100.0%Sierra
20.0% 5 $116,410 80.0%Siskiyous
11 $125,343 100.0%Solano
2.8% 36 $111,407 5.6% 5.6% 2.8% 83.3%Sonoma
31 $170,334 100.0%South Orange
4.3% 23 $117,802 4.3% 91.3%Southwestern
53 $136,646 3.8% 96.2%State Center
27 $143,129 100.0%Ventura
7.7% 13 $126,572 7.7% 84.6%Victor Valley
12.7% 12.7% 1.6% 63 $99,124 4.8% 3.2% 7.9% 57.1%West Hills
6 $133,712 100.0%West Kern
5.3% 19 $132,903 94.7%West Valley-Mission
32 $140,747 100.0%Yosemite
24 $125,053 100.0%Yuba
STATEWIDE TOTAL: 2,020 $129,440 1.34% 0.45% 0.25% 1.14% 1.98% 92.87% 0.74% 1.24%
Note: Any salary reported as 888888 or 0 is set to unknown. Unknown salary and headcount is excluded form the average annual salary calculation. Average Annual Salary = (Sum of annual salaries)/Total Headcount
Data Element Definitions: California Community Colleges Management Information System Data Element Dictionary
All Districts Reporting
Data Source: CCCCO MIS Database for the reporting period Fall Term 2010 Page 66 of 104
June 30, 2011

California Community Colleges Chancellor's OfficeReport on Staffing for Fall 2010
Employee Category Salary Distribution by District
Tenured/Tenure Track
Less than 25,000 HeadcountUnknown
Greater than
80,001
70,001 to 80,000
60,001 to 70,000
50,001 to 60,000
40,001 to 50,000
25,000 to 40,000 Avg Salary
25.7% 11.2% 2.6% 152 $74,041 2.0% .7% 3.9% 14.5% 39.5%Allan Hancock
33.9% 2.2% 183 $82,198 .5% 12.0% 51.4%Antelope Valley
23.1% 10.3% 39 $81,341 10.3% 56.4%Barstow
20.0% 2.9% 175 $86,187 .6% 8.6% 68.0%Butte
31.7% 6.3% .5% 208 $81,573 1.0% 4.8% 55.8%Cabrillo
15.9% .4% .4% 277 $89,040 .7% .4% 2.5% 79.8%Cerritos
12.0% 1.4% 284 $88,843 .7% 6.3% 79.6%Chabot-Las Positas
10.9% 202 $91,626 1.5% 87.6%Chaffey
19.6% 6.0% 168 $85,532 6.0% 68.5%Citrus
8.8% .5% 432 $96,690 .2% 1.9% 88.7%Coast
16.7% 2.4% 84 $81,924 3.6% 13.1% 64.3%Compton
15.1% 3.6% 444 $86,111 .2% .9% .7% 9.0% 70.5%Contra Costa
22.6% 3.2% 31 $81,089 19.4% 54.8%Copper Mountain
19.6% 107 $89,679 .9% 6.5% 72.9%Desert
17.3% 1.8% 330 $87,400 .9% .9% 4.8% 74.2%El Camino
32.0% 4.0% 25 $78,530 4.0% 12.0% 48.0%Feather River
7.5% 1.8% .6% 507 $75,629 15.4% 1.2% 5.7% 67.9%Foothill-Deanza
22.8% 1.3% 79 $85,092 1.3% 12.7% 62.0%Gavilan
19.7% 2.6% 2.6% 233 $84,761 .4% 9.0% 65.7%Glendale
24.2% 6.9% .7% 306 $79,005 .7% .7% 14.4% 52.6%Grossmont-Cuyamaca
29.1% 2.3% 86 $81,997 1.2% 7.0% 60.5%Hartnell
22.9% 11.4% 140 $77,462 .7% 2.1% 15.7% 47.1%Imperial
15.0% 1.6% 373 $87,473 .5% 11.5% 71.3%Kern
52.5% 15.0% 40 $71,955 17.5% 15.0%Lake Tahoe
50.0% 12.5% 2.5% 40 $72,189 2.5% 2.5% 7.5% 22.5%Lassen
15.8% .3% 316 $87,587 .6% 4.1% 79.1%Long Beach
13.0% 3.7% 1.4% 1,257 $86,951 .5% 3.7% 8.7% 69.0%Los Angeles
21.5% 7.5% .2% 1,019 $80,070 .3% .3% .9% 14.8% 54.6%Los Rios
5.7% 2.3% 88 $99,904 1.1% 90.9%Marin
14.0% 8.0% 50 $79,771 4.0% 32.0% 42.0%Mendocino-Lake
22.7% 2.9% 172 $82,469 15.7% 58.7%Merced
1.8% 166 $118,036 1.2% 97.0%Mira Costa
18.1% .9% 116 $82,621 5.2% .9% 12.1% 62.9%Monterey
16.1% 386 $93,232 .3% 2.8% 80.8%Mt. San Antonio
15.3% 13.3% 150 $84,003 2.0% 14.0% 55.3%Mt. San Jacinto
33.0% 4.3% 94 $79,342 12.8% 50.0%Napa Valley
3.0% .7% 534 $104,582 .2% .4% 1.7% 94.0%North Orange
1.6% .8% 122 $98,901 97.5%Ohlone
Note: Any salary reported as 888888 or 0 is set to unknown. Unknown salary and headcount is excluded form the average annual salary calculation. Average Annual Salary = (Sum of annual salaries)/Total Headcount
Data Element Definitions: California Community Colleges Management Information System Data Element Dictionary
All Districts Reporting
Data Source: CCCCO MIS Database for the reporting period Fall Term 2010 Page 67 of 104
June 30, 2011

California Community Colleges Chancellor's OfficeReport on Staffing for Fall 2010
Employee Category Salary Distribution by District
Tenured/Tenure Track
Less than 25,000 HeadcountUnknown
Greater than
80,001
70,001 to 80,000
60,001 to 70,000
50,001 to 60,000
40,001 to 50,000
25,000 to 40,000 Avg Salary
30.0% 7.5% 40 $76,593 25.0% 37.5%Palo Verde
4.8% .4% 273 $94,500 .4% 3.3% 91.2%Palomar
19.9% .5% 386 $87,296 1.0% 6.2% 72.3%Pasadena
29.0% 5.2% .7% 307 $79,798 .7% 2.0% 16.0% 46.6%Peralta
8.7% .3% 310 $92,021 5.8% 85.2%Rancho Santiago
11.8% 5.4% 93 $92,471 3.2% 14.0% 65.6%Redwoods
10.8% 186 $87,896 .5% 2.2% 86.6%Rio Hondo
8.4% .3% 367 $92,508 1.6% 3.0% 86.6%Riverside
27.0% 3.2% 222 $80,665 1.8% 16.2% 51.8%San Bernardino
15.2% 15.8% 13.3% 682 $68,935 .3% .6% 3.2% 20.2% 31.2%San Diego
15.9% 2.3% 793 $83,710 .1% 16.3% 65.4%San Francisco
17.8% 214 $90,578 5.1% 77.1%San Joaquin Delta
14.8% 216 $87,178 1.9% 1.4% 5.6% 76.4%San Jose-Evergreen
37.8% 5.1% 156 $76,317 .6% .6% 1.3% 15.4% 39.1%San Luis Obispo
14.0% .7% 2.6% 307 $84,321 .7% 5.9% 76.2%San Mateo
23.9% 2.3% .5% 213 $82,835 .9% 6.6% 65.7%Santa Barbara
11.4% .5% 184 $90,757 3.8% 84.2%Santa Clarita
5.2% .3% 307 $97,999 1.6% .7% 3.3% 88.9%Santa Monica
21.0% 157 $86,536 1.3% 6.4% 71.3%Sequoias
23.6% 4.1% 123 $80,777 .8% 8.1% 63.4%Shasta-Tehama-Trinity
20.5% 8.4% .5% 215 $75,219 21.4% 49.3%Sierra
26.5% 16.3% 49 $74,075 6.1% 18.4% 32.7%Siskiyous
41.3% 2.6% 155 $78,753 .6% 11.0% 44.5%Solano
17.9% 1.4% 291 $85,026 .3% .7% 7.9% 71.8%Sonoma
22.9% .6% 350 $92,406 10.9% 65.7%South Orange
10.7% 20.5% 7.6% 224 $60,105 .4% .9% 21.4% 25.4% 12.9%Southwestern
10.4% 1.0% 492 $92,422 .2% 3.7% 84.8%State Center
16.3% 5.5% .3% 380 $85,790 8.2% 69.7%Ventura
6.9% .8% .8% 130 $91,636 3.8% 87.7%Victor Valley
13.6% 1.7% 59 $91,142 3.4% 5.1% 76.3%West Hills
22.0% 50 $87,298 10.0% 68.0%West Kern
31.6% .3% 304 $84,028 1.0% 5.9% 61.2%West Valley-Mission
19.0% 1.4% 284 $83,833 7.7% 6.0% 65.8%Yosemite
21.6% 1.5% 134 $88,044 1.5% 11.2% 64.2%Yuba
STATEWIDE TOTAL: 18,068 $85,861 0.60% 0.89% 1.06% 9.03% 16.70% 67.76% 0.51% 3.44%
Note: Any salary reported as 888888 or 0 is set to unknown. Unknown salary and headcount is excluded form the average annual salary calculation. Average Annual Salary = (Sum of annual salaries)/Total Headcount
Data Element Definitions: California Community Colleges Management Information System Data Element Dictionary
All Districts Reporting
Data Source: CCCCO MIS Database for the reporting period Fall Term 2010 Page 68 of 104
June 30, 2011

California Community Colleges Chancellor's OfficeReport on Staffing for Fall 2010
Employee Category Salary Distribution by District
Classified Administrator
Less than 25,000 HeadcountUnknown
Greater than
80,001
70,001 to 80,000
60,001 to 70,000
50,001 to 60,000
40,001 to 50,000
25,000 to 40,000 Avg Salary
4 $88,303 100.0%Allan Hancock
20.0% 10.0% 10 $65,785 30.0% 40.0%Barstow
15.4% 26 $95,804 3.8% 7.7% 73.1%Butte
10.5% 19 $97,075 5.3% 10.5% 73.7%Cabrillo
11.5% 26 $101,683 88.5%Cerritos
2.6% 38 $125,425 2.6% 94.7%Chabot-Las Positas
17 $113,920 5.9% 94.1%Chaffey
6 $106,557 16.7% 83.3%Citrus
18.1% 1.2% 1.2% 83 $99,886 6.0% 73.5%Coast
28.6% 14.3% 7 $79,165 57.1%Compton
4.0% 50 $117,135 96.0%Contra Costa
12.5% 8 $100,691 87.5%Desert
32 $107,810 100.0%El Camino
12.5% 37.5% 6.3% 16 $62,474 6.3% 6.3% 18.8% 12.5%Feather River
33 $118,844 100.0%Foothill-Deanza
6 $93,626 100.0%Gavilan
25.0% 32 $99,060 9.4% 65.6%Glendale
10 $106,182 100.0%Grossmont-Cuyamaca
15.8% 19 $104,657 5.3% 78.9%Hartnell
1 $85,140 100.0%Imperial
26.4% 7.5% 53 $90,297 1.9% 7.5% 56.6%Kern
50.0% 2 $77,214 50.0%Lake Tahoe
33.3% 22.2% 9 $59,229 11.1% 33.3%Lassen
20 $109,147 100.0%Long Beach
40 $135,179 100.0%Los Angeles
2.5% 40 $128,123 97.5%Los Rios
2 $123,722 100.0%Marin
8.3% 8.3% 12 $92,713 8.3% 75.0%Mendocino-Lake
11.5% 11.5% 26 $78,720 11.5% 30.8% 34.6%Merced
14 $131,153 100.0%Mira Costa
8.3% 8.3% 12 $81,496 8.3% 8.3% 16.7% 50.0%Monterey
2.9% 35 $111,939 97.1%Mt. San Antonio
10.0% 10 $110,585 90.0%Mt. San Jacinto
23.1% 13 $90,867 7.7% 69.2%Napa Valley
16.3% 2.0% 49 $100,473 2.0% 79.6%North Orange
3.7% 3.7% 27 $107,736 92.6%Ohlone
17 $108,077 100.0%Palomar
9 $112,209 100.0%Pasadena
Note: Any salary reported as 888888 or 0 is set to unknown. Unknown salary and headcount is excluded form the average annual salary calculation. Average Annual Salary = (Sum of annual salaries)/Total Headcount
Data Element Definitions: California Community Colleges Management Information System Data Element Dictionary
All Districts Reporting
Data Source: CCCCO MIS Database for the reporting period Fall Term 2010 Page 69 of 104
June 30, 2011

California Community Colleges Chancellor's OfficeReport on Staffing for Fall 2010
Employee Category Salary Distribution by District
Classified Administrator
Less than 25,000 HeadcountUnknown
Greater than
80,001
70,001 to 80,000
60,001 to 70,000
50,001 to 60,000
40,001 to 50,000
25,000 to 40,000 Avg Salary
7 $145,454 100.0%Rancho Santiago
18.2% 15.2% 9.1% 33 $58,247 9.1% 27.3% 15.2% 6.1%Redwoods
9 $118,329 100.0%Rio Hondo
2.5% 40 $113,495 97.5%Riverside
5.7% 8.6% 35 $61,743 34.3% 14.3% 37.1%San Bernardino
2 $122,935 100.0%San Francisco
26.3% 2.6% 38 $101,866 5.3% 65.8%San Joaquin Delta
4.3% 23 $112,932 4.3% 91.3%San Jose-Evergreen
18.2% 18.2% 11 $87,149 9.1% 54.5%San Luis Obispo
16 $160,250 100.0%San Mateo
15.1% 53 $100,598 22.6% 62.3%Santa Barbara
22.4% 3.4% 58 $86,317 1.7% 5.2% 8.6% 58.6%Santa Clarita
26.4% 5.7% 53 $82,393 20.8% 47.2%Santa Monica
33.3% 3 $83,277 33.3% 33.3%Sequoias
13.3% 33.3% 15 $69,429 26.7% 26.7%Shasta-Tehama-Trinity
12.5% 24 $95,493 8.3% 79.2%Sierra
1 $140,000 100.0%Siskiyous
9.1% 11 $97,988 90.9%Solano
14.3% 28.6% 7 $77,430 14.3% 42.9%Sonoma
8.0% 2.0% 50 $114,904 2.0% 88.0%South Orange
8.8% 34 $88,425 2.9% 23.5% 64.7%Southwestern
26.7% 3.3% 30 $94,809 3.3% 6.7% 60.0%State Center
7 $146,625 100.0%Ventura
1 $182,148 100.0%Victor Valley
100.0% 1 $27,888West Hills
22.2% 9 $77,075 22.2% 55.6%West Kern
6.7% 15 $115,583 93.3%West Valley-Mission
10.0% 12.0% 2.0% 50 $78,431 4.0% 20.0% 52.0%Yosemite
29.4% 17 $88,145 5.9% 64.7%Yuba
STATEWIDE TOTAL: 1,486 $100,399 1.01% 1.01% 1.75% 7.40% 10.83% 73.62% 0.34% 4.04%
Note: Any salary reported as 888888 or 0 is set to unknown. Unknown salary and headcount is excluded form the average annual salary calculation. Average Annual Salary = (Sum of annual salaries)/Total Headcount
Data Element Definitions: California Community Colleges Management Information System Data Element Dictionary
All Districts Reporting
Data Source: CCCCO MIS Database for the reporting period Fall Term 2010 Page 70 of 104
June 30, 2011

California Community Colleges Chancellor's OfficeReport on Staffing for Fall 2010
Employee Category Salary Distribution by District
Classified Professional
Less than 25,000 HeadcountUnknown
Greater than
80,001
70,001 to 80,000
60,001 to 70,000
50,001 to 60,000
40,001 to 50,000
25,000 to 40,000 Avg Salary
40.0% 16.0% 25 $45,009 16.0% 20.0% 8.0%Allan Hancock
19.4% 22.2% 2.8% 36 $75,810 11.1% 2.8% 41.7%Antelope Valley
13.0% 34.8% 23 $71,446 4.3% 17.4% 30.4%Butte
16.7% 33.3% 6 $42,723 16.7% 33.3%Cerritos
1 $81,782 100.0%Chabot-Las Positas
9.5% 4.8% 21 $62,425 4.8% 57.1% 9.5% 14.3%Chaffey
15.2% 27.3% 3.0% 33 $64,601 9.1% 3.0% 21.2% 21.2%Citrus
3 $84,583 100.0%Coast
92.9% 14 $55,598 7.1%Compton
14.1% 29.7% 1.6% 64 $68,929 1.6% 6.3% 23.4% 23.4%Contra Costa
20.0% 5 $66,816 60.0% 20.0%Copper Mountain
27.3% 11 $95,704 72.7%Desert
1.8% 28.1% 1.8% 57 $63,143 7.0% 50.9% 10.5%El Camino
100.0% 2 $53,985Feather River
23.2% 1.2% 164 $82,186 6.1% .6% 14.6% 54.3%Foothill-Deanza
23.1% 7.7% 13 $72,664 7.7% 30.8% 30.8%Gavilan
23.1% 13 $67,451 76.9%Glendale
24.2% 15.2% 6.1% 33 $62,903 18.2% 24.2% 12.1%Grossmont-Cuyamaca
10.0% 40.0% 10.0% 10 $55,569 20.0% 20.0%Hartnell
10.5% 15.8% 19 $82,517 10.5% 63.2%Imperial
43.9% 22.8% 57 $68,886 1.8% 21.1% 10.5%Kern
25.0% 25.0% 4 $48,896 50.0%Lake Tahoe
28.6% 7 $66,836 14.3% 28.6% 28.6%Lassen
29.6% 14.8% 27 $73,278 3.7% 18.5% 33.3%Long Beach
11.0% 7.8% 219 $85,101 1.4% 17.4% 62.6%Los Angeles
7.7% 15.4% 78 $79,278 5.1% 17.9% 53.8%Los Rios
37.5% 12.5% 16 $70,199 6.3% 25.0% 18.8%Marin
2 $44,322 100.0%Merced
11.1% 11.1% 5.6% 18 $80,381 11.1% 61.1%Mira Costa
11.8% 17.6% 17 $44,861 64.7% 5.9%Monterey
50.0% 25.0% 4 $70,829 25.0%Mt. San Antonio
7.3% 11.0% 22.0% 82 $55,524 11.0% 15.9% 17.1% 15.9%Mt. San Jacinto
40.0% 40.0% 5 $65,986 20.0%Napa Valley
1 $102,603 100.0%North Orange
21.1% 10.5% 5.3% 19 $72,033 5.3% 21.1% 36.8%Ohlone
33.3% 3 $87,022 66.7%Palo Verde
18.9% 5.4% 5.4% 37 $68,981 10.8% 35.1% 24.3%Palomar
17.2% 33.3% 87 $60,981 17.2% 26.4% 5.7%Peralta
Note: Any salary reported as 888888 or 0 is set to unknown. Unknown salary and headcount is excluded form the average annual salary calculation. Average Annual Salary = (Sum of annual salaries)/Total Headcount
Data Element Definitions: California Community Colleges Management Information System Data Element Dictionary
All Districts Reporting
Data Source: CCCCO MIS Database for the reporting period Fall Term 2010 Page 71 of 104
June 30, 2011

California Community Colleges Chancellor's OfficeReport on Staffing for Fall 2010
Employee Category Salary Distribution by District
Classified Professional
Less than 25,000 HeadcountUnknown
Greater than
80,001
70,001 to 80,000
60,001 to 70,000
50,001 to 60,000
40,001 to 50,000
25,000 to 40,000 Avg Salary
16.2% 2.7% 37 $72,314 2.7% 5.4% 10.8% 18.9% 43.2%Rancho Santiago
7.1% 39.3% 56 $34,825 19.6% 7.1% 25.0% 1.8%Redwoods
3 $79,056 33.3% 66.7%Rio Hondo
22.7% 15.9% 9.1% 44 $71,529 4.5% 15.9% 31.8%Riverside
10.4% 16.7% 4.2% 48 $54,563 6.3% 41.7% 12.5% 8.3%San Bernardino
32.9% 5.5% 1.4% 73 $76,466 1.4% 23.3% 35.6%San Diego
43.8% 11.3% 80 $74,961 1.3% 5.0% 1.3% 16.3% 21.3%San Francisco
18.8% 12.5% 16 $68,602 6.3% 6.3% 43.8% 12.5%San Joaquin Delta
52.4% 21 $76,028 19.0% 14.3% 14.3%San Jose-Evergreen
11.1% 11.1% 5.6% 18 $79,814 11.1% 61.1%San Luis Obispo
15.7% 1.4% 70 $82,416 18.6% 64.3%San Mateo
13.7% 8.8% 2.0% 102 $71,937 33.3% 2.9% 14.7% 24.5%Santa Barbara
7 $86,823 14.3% 85.7%Santa Clarita
12.5% 8 $55,681 25.0% 12.5% 12.5% 37.5%Sequoias
16.7% 16.7% 25.0% 24 $54,022 4.2% 8.3% 29.2%Siskiyous
14.3% 28.6% 7 $73,038 14.3% 42.9%Solano
14.8% 6.6% 11.5% 61 $42,166 42.6% 4.9% 9.8% 9.8%Sonoma
6.7% 6.7% 15 $79,453 6.7% 33.3% 46.7%South Orange
27.6% 29 $76,243 20.7% 24.1% 27.6%State Center
16.7% 8.3% 24 $98,631 4.2% 70.8%Ventura
26.1% 17.4% 23 $86,578 4.3% 52.2%Victor Valley
16.7% 27.8% 72 $27,417 50.0% 5.6%West Hills
7.1% 21.4% 14 $70,900 7.1% 28.6% 35.7%West Kern
17.5% 5.0% 40 $87,049 17.5% 60.0%West Valley-Mission
8.0% 24.0% 25 $77,157 20.0% 8.0% 40.0%Yosemite
15.4% 13 $24,555 69.2% 15.4%Yuba
STATEWIDE TOTAL: 2,166 $69,366 5.45% 5.08% 7.16% 17.31% 16.20% 31.86% 3.42% 13.53%
Note: Any salary reported as 888888 or 0 is set to unknown. Unknown salary and headcount is excluded form the average annual salary calculation. Average Annual Salary = (Sum of annual salaries)/Total Headcount
Data Element Definitions: California Community Colleges Management Information System Data Element Dictionary
All Districts Reporting
Data Source: CCCCO MIS Database for the reporting period Fall Term 2010 Page 72 of 104
June 30, 2011
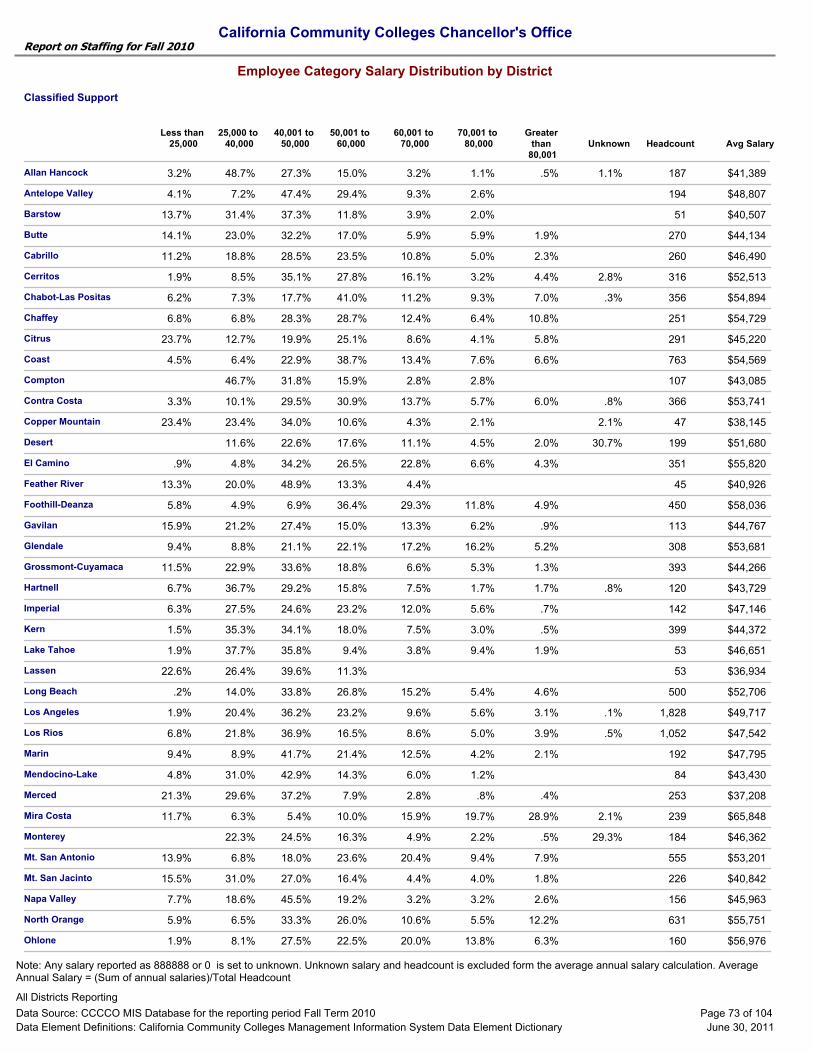
California Community Colleges Chancellor's OfficeReport on Staffing for Fall 2010
Employee Category Salary Distribution by District
Classified Support
Less than 25,000 HeadcountUnknown
Greater than
80,001
70,001 to 80,000
60,001 to 70,000
50,001 to 60,000
40,001 to 50,000
25,000 to 40,000 Avg Salary
1.1% 15.0% 48.7% 187 $41,389 3.2% 1.1% 27.3% 3.2% .5%Allan Hancock
2.6% 29.4% 7.2% 194 $48,807 4.1% 47.4% 9.3%Antelope Valley
2.0% 11.8% 31.4% 51 $40,507 13.7% 37.3% 3.9%Barstow
5.9% 17.0% 23.0% 270 $44,134 14.1% 32.2% 5.9% 1.9%Butte
5.0% 23.5% 18.8% 260 $46,490 11.2% 28.5% 10.8% 2.3%Cabrillo
3.2% 27.8% 8.5% 316 $52,513 1.9% 2.8% 35.1% 16.1% 4.4%Cerritos
9.3% 41.0% 7.3% 356 $54,894 6.2% .3% 17.7% 11.2% 7.0%Chabot-Las Positas
6.4% 28.7% 6.8% 251 $54,729 6.8% 28.3% 12.4% 10.8%Chaffey
4.1% 25.1% 12.7% 291 $45,220 23.7% 19.9% 8.6% 5.8%Citrus
7.6% 38.7% 6.4% 763 $54,569 4.5% 22.9% 13.4% 6.6%Coast
2.8% 15.9% 46.7% 107 $43,085 31.8% 2.8%Compton
5.7% 30.9% 10.1% 366 $53,741 3.3% .8% 29.5% 13.7% 6.0%Contra Costa
2.1% 10.6% 23.4% 47 $38,145 23.4% 2.1% 34.0% 4.3%Copper Mountain
4.5% 17.6% 11.6% 199 $51,680 30.7% 22.6% 11.1% 2.0%Desert
6.6% 26.5% 4.8% 351 $55,820 .9% 34.2% 22.8% 4.3%El Camino
13.3% 20.0% 45 $40,926 13.3% 48.9% 4.4%Feather River
11.8% 36.4% 4.9% 450 $58,036 5.8% 6.9% 29.3% 4.9%Foothill-Deanza
6.2% 15.0% 21.2% 113 $44,767 15.9% 27.4% 13.3% .9%Gavilan
16.2% 22.1% 8.8% 308 $53,681 9.4% 21.1% 17.2% 5.2%Glendale
5.3% 18.8% 22.9% 393 $44,266 11.5% 33.6% 6.6% 1.3%Grossmont-Cuyamaca
1.7% 15.8% 36.7% 120 $43,729 6.7% .8% 29.2% 7.5% 1.7%Hartnell
5.6% 23.2% 27.5% 142 $47,146 6.3% 24.6% 12.0% .7%Imperial
3.0% 18.0% 35.3% 399 $44,372 1.5% 34.1% 7.5% .5%Kern
9.4% 9.4% 37.7% 53 $46,651 1.9% 35.8% 3.8% 1.9%Lake Tahoe
11.3% 26.4% 53 $36,934 22.6% 39.6%Lassen
5.4% 26.8% 14.0% 500 $52,706 .2% 33.8% 15.2% 4.6%Long Beach
5.6% 23.2% 20.4% 1,828 $49,717 1.9% .1% 36.2% 9.6% 3.1%Los Angeles
5.0% 16.5% 21.8% 1,052 $47,542 6.8% .5% 36.9% 8.6% 3.9%Los Rios
4.2% 21.4% 8.9% 192 $47,795 9.4% 41.7% 12.5% 2.1%Marin
1.2% 14.3% 31.0% 84 $43,430 4.8% 42.9% 6.0%Mendocino-Lake
.8% 7.9% 29.6% 253 $37,208 21.3% 37.2% 2.8% .4%Merced
19.7% 10.0% 6.3% 239 $65,848 11.7% 2.1% 5.4% 15.9% 28.9%Mira Costa
2.2% 16.3% 22.3% 184 $46,362 29.3% 24.5% 4.9% .5%Monterey
9.4% 23.6% 6.8% 555 $53,201 13.9% 18.0% 20.4% 7.9%Mt. San Antonio
4.0% 16.4% 31.0% 226 $40,842 15.5% 27.0% 4.4% 1.8%Mt. San Jacinto
3.2% 19.2% 18.6% 156 $45,963 7.7% 45.5% 3.2% 2.6%Napa Valley
5.5% 26.0% 6.5% 631 $55,751 5.9% 33.3% 10.6% 12.2%North Orange
13.8% 22.5% 8.1% 160 $56,976 1.9% 27.5% 20.0% 6.3%Ohlone
Note: Any salary reported as 888888 or 0 is set to unknown. Unknown salary and headcount is excluded form the average annual salary calculation. Average Annual Salary = (Sum of annual salaries)/Total Headcount
Data Element Definitions: California Community Colleges Management Information System Data Element Dictionary
All Districts Reporting
Data Source: CCCCO MIS Database for the reporting period Fall Term 2010 Page 73 of 104
June 30, 2011

California Community Colleges Chancellor's OfficeReport on Staffing for Fall 2010
Employee Category Salary Distribution by District
Classified Support
Less than 25,000 HeadcountUnknown
Greater than
80,001
70,001 to 80,000
60,001 to 70,000
50,001 to 60,000
40,001 to 50,000
25,000 to 40,000 Avg Salary
3.8% 7.7% 19.2% 78 $52,844 25.6% 25.6% 11.5% 6.4%Palo Verde
5.5% 33.8% 9.1% 397 $54,656 7.1% 17.4% 20.7% 6.5%Palomar
8.4% 26.2% 6.5% 367 $55,555 .3% 38.4% 12.0% 8.2%Pasadena
4.0% 14.3% 26.7% 322 $46,740 3.1% 38.8% 10.9% 2.2%Peralta
3.9% 29.5% 11.6% 610 $50,262 11.6% 1.5% 23.4% 12.5% 5.9%Rancho Santiago
.8% 9.4% 37.0% 127 $37,129 11.8% 18.1% 20.5% 1.6% .8%Redwoods
2.4% 20.6% 13.0% 253 $43,949 16.2% .4% 39.5% 5.1% 2.8%Rio Hondo
5.4% 36.2% 8.1% 556 $51,685 7.2% 23.9% 16.0% 3.2%Riverside
1.5% 14.9% 36.5% 342 $40,219 12.6% 29.8% 4.4% .3%San Bernardino
6.4% 20.9% 15.0% 983 $49,180 7.3% 36.4% 9.7% 4.4%San Diego
8.9% 26.2% 3.7% 749 $58,238 .3% 21.6% 21.9% 11.6% 5.7%San Francisco
.9% 16.3% 18.2% 455 $43,933 8.6% 24.2% 25.3% 5.3% 1.3%San Joaquin Delta
9.7% 26.7% 4.6% 329 $55,307 .9% 15.2% 29.8% 7.9% 5.2%San Jose-Evergreen
.9% 18.7% 27.0% 230 $43,829 5.2% 43.0% 5.2%San Luis Obispo
10.4% 28.1% 4.2% 384 $66,231 3.4% 20.1% 20.8% 13.0%San Mateo
4.5% 29.4% 18.0% 289 $51,124 3.1% .3% 25.3% 18.0% 1.4%Santa Barbara
7.6% 28.6% 6.7% 224 $57,121 1.8% 20.1% 29.5% 5.8%Santa Clarita
3.5% 23.2% 14.8% 461 $48,242 7.8% 2.6% 34.7% 11.1% 2.4%Santa Monica
4.5% 11.4% 27.4% 201 $39,486 21.4% 30.8% 3.5% 1.0%Sequoias
11.9% 38.1% 210 $36,557 17.6% 6.7% 22.4% 3.3%Shasta-Tehama-Trinity
8.1% 44.4% 7.3% 234 $52,483 1.7% .4% 27.8% 10.3%Sierra
8.8% 62.5% 80 $32,191 20.0% 8.8%Siskiyous
5.7% 17.2% 18.5% 157 $48,888 9.6% 31.2% 15.3% 2.5%Solano
4.5% 25.4% 9.5% 398 $48,702 13.1% 2.0% 31.4% 9.0% 5.0%Sonoma
6.0% 30.3% 5.1% 532 $56,583 25.9% 27.4% 5.3%South Orange
3.8% 23.7% 21.2% 372 $46,704 9.7% 29.0% 10.5% 2.2%Southwestern
3.7% 18.8% 10.7% 618 $51,796 .3% 19.1% 32.2% 13.8% 1.5%State Center
9.9% 34.2% 5.0% 477 $53,983 9.6% 18.0% 18.7% 4.6%Ventura
4.9% 29.2% 6.5% 185 $53,014 3.8% 35.1% 18.9% 1.6%Victor Valley
1.2% 9.1% 26.0% 254 $28,178 50.0% 10.2% 1.6% 2.0%West Hills
.7% 8.5% 16.2% 142 $35,623 33.8% 36.6% 4.2%West Kern
7.8% 35.5% 6.7% 282 $53,977 1.8% 33.7% 11.0% 3.5%West Valley-Mission
1.1% 11.1% 17.2% 646 $44,465 2.8% 31.3% 31.6% 4.3% .6%Yosemite
1.7% 17.1% 18.3% 175 $44,472 10.3% 42.9% 9.7%Yuba
STATEWIDE TOTAL: 24,264 $49,931 7.04% 15.20% 29.15% 11.74% 5.58% 4.14% 3.61% 23.54%
Note: Any salary reported as 888888 or 0 is set to unknown. Unknown salary and headcount is excluded form the average annual salary calculation. Average Annual Salary = (Sum of annual salaries)/Total Headcount
Data Element Definitions: California Community Colleges Management Information System Data Element Dictionary
All Districts Reporting
Data Source: CCCCO MIS Database for the reporting period Fall Term 2010 Page 74 of 104
June 30, 2011

California Community Colleges Chancellor's OfficeReport on Staffing for Fall 2010
Employee Category Hourly Rate Distribution by District
Academic Temporary - Instruction, Support
$40.00 to $44.99
$45.00 to $49.99
$50.00 to $54.99
$55.00 to $59.99
$60.00 to $64.99
$65.00 Plus
AverageRate
Less than
$39.99
Total FTE
$ Amount Unknown
$51.53 3.0 .7 3.8 .2Allan Hancock 8.5 .7
$55.00 .5Antelope Valley .5
Barstow
$42.48 2.4 1.3 .1 .3 .1Butte 4.3
$102.00 4.3Cabrillo 4.9 .6
$42.56Cerritos 7.5 2.0 5.5
$59.15 5.0 1.8 1.2Chabot-Las Positas 8.6 .5
$58.41 .6 .1Chaffey 19.1 18.5
$41.98 .1 .6Citrus 5.6 1.0 3.9
Coast 1.0 1.0
$48.57 1.2 2.5 .8Compton 7.2 2.7
Contra Costa 3.4 3.4
$46.40 2.3Copper Mountain 4.4 1.0 1.1
$42.48 1.5 1.5Desert 14.0 5.0 6.0
$49.37 7.1 5.4El Camino 15.4 2.9
Feather River
$49.66 1.7 .6 .7 .2 .3Foothill-Deanza 3.9 .0 .4
Gavilan
Glendale
$45.26 1.7 1.6 3.2 3.5 .3Grossmont-Cuyamaca 12.4 2.2
Hartnell 1.0 1.0
Imperial 11.0 11.0
Kern
Lake Tahoe
Lassen
$54.99 8.7 3.0 .5Long Beach 12.4 .2
$52.72 49.6 25.5 11.0 2.0 1.9Los Angeles 95.7 .3 5.4
$45.52 .8 2.3 3.9 4.1 .5Los Rios 16.9 5.2
$114.20 .5Marin .5
$50.10 .2 .7 1.3Mendocino-Lake 2.8 .7
$38.71 .0 1.6Merced 2.0 .4
Mira Costa 3.0 3.0
$48.42 .2 1.8 1.2Monterey 8.7 4.0 1.5
Mt. San Antonio 1.0 1.0
Mt. San Jacinto
Napa Valley 3.2 3.2
$44.91 3.0 .1North Orange 5.6 .5 2.0
$62.32 4.1 .3Ohlone 5.5 1.2
$48.09 1.6 1.0Palo Verde 2.6
$58.62 9.1 1.8Palomar 11.9 .4 .6
Note: Any hourly rate reported as 888888 or < $1.00 is set to unknown. Unknown hourly rate and FTE is excluded form the average hourly rate calculation. Credit/Non-credit assignment rates are included. Average Hourly Rate = (Sum(Rate * SumFTE))/SumFTE
Data Element Definitions: California Community Colleges Management Information System Data Element Dictionary
All Districts Reporting
Data Source: CCCCO MIS Database for the reporting period Fall Term 2010 Page 75 of 104
June 30, 2011

California Community Colleges Chancellor's OfficeReport on Staffing for Fall 2010
Employee Category Hourly Rate Distribution by District
Academic Temporary - Instruction, Support
$40.00 to $44.99
$45.00 to $49.99
$50.00 to $54.99
$55.00 to $59.99
$60.00 to $64.99
$65.00 Plus
AverageRate
Less than
$39.99
Total FTE
$ Amount Unknown
Pasadena 5.3 5.3
$77.16 25.5 .8Peralta 30.7 4.4
$44.88 .1 2.2 7.3 2.4Rancho Santiago 11.9
Redwoods
$58.03 3.0 .9Rio Hondo 4.3 .4
$71.64 9.1Riverside 22.4 13.3
$42.20San Bernardino 10.9 .0 10.9
$47.02 .5 13.1 16.4 .8 .7San Diego 46.9 .2 15.3
$55.20 25.3 10.8 7.6 3.2San Francisco 57.8 .4 10.5
San Joaquin Delta
San Jose-Evergreen 5.0 5.0
$54.17 1.9 1.7 .7 .1San Luis Obispo 5.6 1.2
$57.78 9.6 6.1 1.3 2.2 .1San Mateo 22.9 .3 3.4
$51.00 1.0 .3 .7Santa Barbara 4.4 2.5
Santa Clarita
$63.63 45.4Santa Monica 46.2 .8
$47.88 11.5Sequoias 12.5 1.0
$47.05 4.0 8.0Shasta-Tehama-Trinity 18.0 6.0
$44.70Sierra 1.1 1.1
Siskiyous
Solano
$43.47 .2 .0 1.6 .4Sonoma 6.4 .9 3.2
$4.08South Orange 5.0 5.0
Southwestern 2.0 2.0
$44.12 .5 1.8 10.7 1.5State Center 53.0 18.3 20.2
$11.55 .4Ventura 9.4 9.0
$55.00 4.4Victor Valley 4.4
West Hills 4.2 4.2
West Kern
West Valley-Mission
Yosemite 2.6 2.6
Yuba
$51.59 697.6Statewide Total: .69% 3.58% 16.68% 15.30% 13.37% 31.60% 18.79%
Note: Any hourly rate reported as 888888 or < $1.00 is set to unknown. Unknown hourly rate and FTE is excluded form the average hourly rate calculation. Credit/Non-credit assignment rates are included. Average Hourly Rate = (Sum(Rate * SumFTE))/SumFTE
Data Element Definitions: California Community Colleges Management Information System Data Element Dictionary
All Districts Reporting
Data Source: CCCCO MIS Database for the reporting period Fall Term 2010 Page 76 of 104
June 30, 2011

California Community Colleges Chancellor's OfficeReport on Staffing for Fall 2010
Employee Category Hourly Rate Distribution by District
Tenured/Tenure Track - Overload Instruction, Credit & Non-Credit
$40.00 to $44.99
$45.00 to $49.99
$50.00 to $54.99
$55.00 to $59.99
$60.00 to $64.99
$65.00 Plus
AverageRate
Less than
$39.99
Total FTE
$ Amount Unknown
$52.60 9.0 6.5 2.4 .8Allan Hancock 20.9 2.2
$76.86 43.6Antelope Valley 43.6
$37.92 12.4Barstow 12.4
$59.87 17.3 1.6 .2Butte 19.1
$79.49 14.1Cabrillo 14.1
$53.10 17.9 12.8 9.6 4.2 1.6Cerritos 52.2 6.1
$82.24 30.9 .8Chabot-Las Positas 31.7
$70.03 26.7Chaffey 26.7
$71.29 25.7Citrus 25.9 .2
$71.88 79.5Coast 79.5
$62.05 13.9 .6 1.0Compton 15.6 .1
$88.12 49.2 .0Contra Costa 49.2
Copper Mountain
$57.17 9.3 3.9 2.2Desert 15.5
$60.18 21.5El Camino 21.5
Feather River
$109.59 71.7 .1 .1 .1Foothill-Deanza .1 72.5 .4
Gavilan
Glendale
$69.85 44.6 2.3 1.0 .3Grossmont-Cuyamaca 48.9 .7
$63.11 4.6Hartnell 4.6
$53.21 45.1 .6Imperial 1.7 48.5 1.2
$60.00 51.0Kern 51.0
$45.64 3.9Lake Tahoe 4.8 .8
$34.52 9.8Lassen 9.8
$49.97 8.0 23.3 12.9 1.8 .2Long Beach 53.6 7.3
$71.81 207.5Los Angeles 207.5
$78.76 117.4 3.9 2.0Los Rios 124.3 1.1
$154.98 6.0 .0Marin 6.1
$59.79 4.7 .1Mendocino-Lake 4.8
$46.16 .5 7.0 .1 .0Merced 11.9 4.3
Mira Costa
$65.20 14.0 .7 .4Monterey 15.3 .2
$74.22 50.1Mt. San Antonio 50.1
$30.00 49.4Mt. San Jacinto 49.4
$62.79 10.7Napa Valley 10.7
$55.55 69.9 24.0 13.9 .7North Orange .7 109.2
$71.06 14.1Ohlone 14.1
$25.00Palo Verde 1.8 1.8
$69.03 45.7 1.7 .4Palomar .2 47.9
Note: Any hourly rate reported as 888888 or < $1.00 is set to unknown. Unknown hourly rate and FTE is excluded form the average hourly rate calculation. Credit/Non-credit assignment rates are included. Average Hourly Rate = (Sum(Rate * SumFTE))/SumFTE
Data Element Definitions: California Community Colleges Management Information System Data Element Dictionary
All Districts Reporting
Data Source: CCCCO MIS Database for the reporting period Fall Term 2010 Page 77 of 104
June 30, 2011

California Community Colleges Chancellor's OfficeReport on Staffing for Fall 2010
Employee Category Hourly Rate Distribution by District
Tenured/Tenure Track - Overload Instruction, Credit & Non-Credit
$40.00 to $44.99
$45.00 to $49.99
$50.00 to $54.99
$55.00 to $59.99
$60.00 to $64.99
$65.00 Plus
AverageRate
Less than
$39.99
Total FTE
$ Amount Unknown
$72.55 54.6Pasadena 11.6 71.2 4.9
$68.73 32.6Peralta 32.6
$58.27 45.1 7.1 1.7Rancho Santiago 54.0
Redwoods
$93.17 34.5Rio Hondo .2 34.7
$69.63 72.8Riverside 72.8
$53.06 22.0 5.1 7.9San Bernardino 34.9
$69.40 74.9San Diego 74.9
$85.91 8.6 2.0San Francisco 10.6
$71.31 22.1 .4San Joaquin Delta 22.5
$90.43 25.6 1.9 .6San Jose-Evergreen 28.1
$79.14 18.7 .2San Luis Obispo 18.9
$69.84 17.1 .5 .3 .6 .2San Mateo 1.2 20.4 .5
Santa Barbara
$67.47 23.6Santa Clarita 23.6
$67.62 16.5Santa Monica 16.5
$56.23 29.2 5.2Sequoias 34.5
$56.11 12.0 3.4Shasta-Tehama-Trinity 15.4
$69.03 32.5 1.9 1.3Sierra 36.8 1.1
$58.72 2.9 .1Siskiyous 3.0
$66.68 36.0 .5Solano .4 36.9
$93.23 27.4 .2Sonoma 27.6
$68.86 .5South Orange .5
$62.93 15.3 .7 .3Southwestern 16.2
$51.74 26.3 18.4 13.4 .4State Center 65.1 6.6
$70.33 38.8 1.0 1.3 .7 .9Ventura 17.8 61.2 .7
$54.46 43.1Victor Valley 44.7 1.6
$5.40West Hills .9 .9
$59.28 13.0West Kern 13.0
$69.77 17.9 4.0 .1 .4West Valley-Mission 22.3
$70.36 41.6 .0Yosemite 41.6
$88.62 26.0Yuba 26.0
$68.33 2,336.0Statewide Total: 1.56% 2.68% .96% 1.50% 3.66% 5.73% 83.70% .21%
Note: Any hourly rate reported as 888888 or < $1.00 is set to unknown. Unknown hourly rate and FTE is excluded form the average hourly rate calculation. Credit/Non-credit assignment rates are included. Average Hourly Rate = (Sum(Rate * SumFTE))/SumFTE
Data Element Definitions: California Community Colleges Management Information System Data Element Dictionary
All Districts Reporting
Data Source: CCCCO MIS Database for the reporting period Fall Term 2010 Page 78 of 104
June 30, 2011
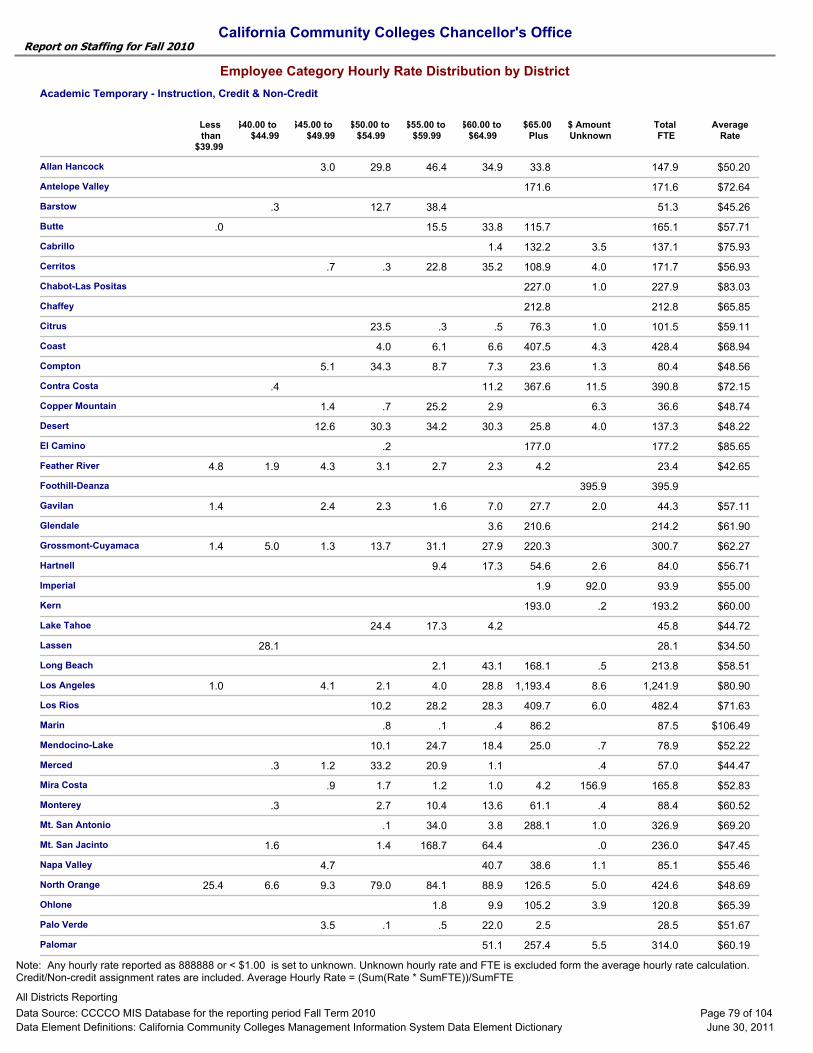
California Community Colleges Chancellor's OfficeReport on Staffing for Fall 2010
Employee Category Hourly Rate Distribution by District
Academic Temporary - Instruction, Credit & Non-Credit
$40.00 to $44.99
$45.00 to $49.99
$50.00 to $54.99
$55.00 to $59.99
$60.00 to $64.99
$65.00 Plus
AverageRate
Less than
$39.99
Total FTE
$ Amount Unknown
$50.20 33.8 34.9 46.4 3.0Allan Hancock 147.9 29.8
$72.64 171.6Antelope Valley 171.6
$45.26 38.4 .3Barstow 51.3 12.7
$57.71 115.7 33.8 15.5Butte .0 165.1
$75.93 132.2 1.4Cabrillo 137.1 3.5
$56.93 108.9 35.2 22.8 .7Cerritos 171.7 4.0 .3
$83.03 227.0Chabot-Las Positas 227.9 1.0
$65.85 212.8Chaffey 212.8
$59.11 76.3 .5 .3Citrus 101.5 1.0 23.5
$68.94 407.5 6.6 6.1Coast 428.4 4.3 4.0
$48.56 23.6 7.3 8.7 5.1Compton 80.4 1.3 34.3
$72.15 367.6 11.2 .4Contra Costa 390.8 11.5
$48.74 2.9 25.2 1.4Copper Mountain 36.6 6.3 .7
$48.22 25.8 30.3 34.2 12.6Desert 137.3 4.0 30.3
$85.65 177.0El Camino 177.2 .2
$42.65 4.2 2.3 2.7 4.3 1.9Feather River 4.8 23.4 3.1
Foothill-Deanza 395.9 395.9
$57.11 27.7 7.0 1.6 2.4Gavilan 1.4 44.3 2.0 2.3
$61.90 210.6 3.6Glendale 214.2
$62.27 220.3 27.9 31.1 1.3 5.0Grossmont-Cuyamaca 1.4 300.7 13.7
$56.71 54.6 17.3 9.4Hartnell 84.0 2.6
$55.00 1.9Imperial 93.9 92.0
$60.00 193.0Kern 193.2 .2
$44.72 4.2 17.3Lake Tahoe 45.8 24.4
$34.50 28.1Lassen 28.1
$58.51 168.1 43.1 2.1Long Beach 213.8 .5
$80.90 1,193.4 28.8 4.0 4.1Los Angeles 1.0 1,241.9 8.6 2.1
$71.63 409.7 28.3 28.2Los Rios 482.4 6.0 10.2
$106.49 86.2 .4 .1Marin 87.5 .8
$52.22 25.0 18.4 24.7Mendocino-Lake 78.9 .7 10.1
$44.47 1.1 20.9 1.2 .3Merced 57.0 .4 33.2
$52.83 4.2 1.0 1.2 .9Mira Costa 165.8 156.9 1.7
$60.52 61.1 13.6 10.4 .3Monterey 88.4 .4 2.7
$69.20 288.1 3.8 34.0Mt. San Antonio 326.9 1.0 .1
$47.45 64.4 168.7 1.6Mt. San Jacinto 236.0 .0 1.4
$55.46 38.6 40.7 4.7Napa Valley 85.1 1.1
$48.69 126.5 88.9 84.1 9.3 6.6North Orange 25.4 424.6 5.0 79.0
$65.39 105.2 9.9 1.8Ohlone 120.8 3.9
$51.67 2.5 22.0 .5 3.5Palo Verde 28.5 .1
$60.19 257.4 51.1Palomar 314.0 5.5
Note: Any hourly rate reported as 888888 or < $1.00 is set to unknown. Unknown hourly rate and FTE is excluded form the average hourly rate calculation. Credit/Non-credit assignment rates are included. Average Hourly Rate = (Sum(Rate * SumFTE))/SumFTE
Data Element Definitions: California Community Colleges Management Information System Data Element Dictionary
All Districts Reporting
Data Source: CCCCO MIS Database for the reporting period Fall Term 2010 Page 79 of 104
June 30, 2011

California Community Colleges Chancellor's OfficeReport on Staffing for Fall 2010
Statewide Full-time Equivalency (FTE) Summary by Taxonomy of Programs (TOP) Code
Academic Temporary - Instruction, Credit & Non-Credit
$40.00 to $44.99
$45.00 to $49.99
$50.00 to $54.99
$55.00 to $59.99
$60.00 to $64.99
$65.00 Plus
AverageRate
Less than
$39.99
Total FTE
$ Amount Unknown
$61.78 175.1 43.0 9.1 3.3 4.2Pasadena 1.1 245.1 5.8 3.4
$75.86 250.5 13.8 1.6Peralta 267.6 1.4 .3
$49.41 105.6 65.4 18.6Rancho Santiago 366.2 .3 176.2
$68.00 85.5 9.3 .1Redwoods 98.4 3.4
$75.30 105.5 6.1 1.8 2.9 .3Rio Hondo .2 118.0 1.2
$67.52 326.4 8.7Riverside 340.6 5.5
$53.53 118.7 49.7 24.1San Bernardino 192.5
$61.20 597.9 61.1 20.2 17.0 3.7San Diego 6.6 728.1 3.7 18.0
$95.83 371.2 4.0San Francisco 375.1
$66.34 53.6 4.9 2.8San Joaquin Delta 61.2
$152.90 2.6San Jose-Evergreen 191.9 189.4
$64.42 125.1 18.8 7.9 1.9 .2San Luis Obispo 4.3 163.3 5.1
$88.09 192.8 6.1 2.8 3.2 3.4San Mateo 5.7 216.3 2.3
$79.75 178.0 1.2 1.2 2.0 1.0Santa Barbara 186.3 2.9
$57.42 115.1 41.4 3.1Santa Clarita 161.5 1.9
$90.32 326.6Santa Monica 351.9 25.3
$50.16 55.7 57.9Sequoias 118.7 2.1 3.0
$52.88 31.9 49.0 18.0Shasta-Tehama-Trinity 104.1 3.9 1.3
$57.07 135.1 62.3 32.0 9.1 .5Sierra 258.4 19.4
$50.47 5.1 14.9 27.3 1.0Siskiyous 48.2
$64.76 112.6 6.9 .7Solano 1.0 123.1 2.0
$73.97 260.1 15.8 3.5 6.4 4.0Sonoma 6.5 309.3 .8 12.2
$67.01 318.4South Orange 318.4
$60.60 185.3 35.1 13.3Southwestern .3 267.9 32.1 1.9
$48.34 57.1 75.7 118.6 26.8State Center 357.8 12.5 67.1
$76.32 203.8 2.3 5.6 1.5 2.0Ventura 98.2 319.1 3.7 1.9
$54.30 180.7Victor Valley 190.6 1.0 8.9
$5.40West Hills .5 25.3 24.8
$57.02 20.7 6.2West Kern 26.9
West Valley-Mission 172.0 172.0
$61.53 138.0 23.3 17.0Yosemite 181.7 3.3
$68.39 68.6 9.3 3.5Yuba 86.8 5.4
$66.54 14,985.5Statewide Total: 1.06% .45% .86% 4.29% 6.92% 8.83% 69.44% 8.16%
Note: Work assignments are reported by the district in data element (EJ01) Employee-Assignment-Type, (EJ03) Employee-Assignment-Account-Code and (EJ08) Employee-Assignment-FTE. All work assignments for each employee category are represented.
Data Element Definitions: California Community Colleges Management Information System Data Element Dictionary
All Districts Reporting
Data Source: CCCCO MIS Database for the reporting period Fall Term 2010 Page 80 of 104
June 30, 2011

California Community Colleges Chancellor's OfficeReport on Staffing for Fall 2010
Statewide Full-time Equivalency (FTE) Summary by Taxonomy of Programs (TOP) Code
Educational Administrator
Tenured / Tenure Track
Academic Temporary
Classified Administrator
Classified Professional
Classified Support
TOP CodeTotal
010100 Agriculture Technology and Sciences, Gen
1.1 13.0 7.5 1.0 21.2 43.8
010200 Animal Science 18.9 6.1 .1 3.4 28.4
010210 Veterinary Technician (Licensed)
13.0 10.2 3.9 27.2
010220 Artificial Inseminator (Licensed)
1.0 1.0
010230 Dairy Science .6 .3 .8
010240 Equine Science .6 1.3 1.0 2.9
010300 Plant Science 13.7 6.5 .2 .6 21.0
010310 Agricultural Pest Control Adviser and Op
.3 .0 .3
010400 Viticulture, Enology, and Wine Business
3.9 4.1 1.0 9.0
010900 Horticulture 27.8 16.1 16.2 60.1
010910 Landscape Design and Maintenance
9.6 5.9 1.4 16.9
010920 Floriculture / Floristry 2.8 7.2 10.0
010930 Nursery Technology .3 1.1 1.4
010940 Turfgrass Technology .3 .6 1.0
011200 Agriculture Business, Sales and Service
9.1 4.5 2.3 16.0
011400 Forestry 4.1 .9 5.0
011500 Natural Resources 11.0 10.4 .3 21.8
011510 Parks and Outdoor Recreation
2.4 2.5 4.9
011520 Wildlife and Fisheries .3 .3 .6
011600 Agricultural Power Equipment Technology
11.3 3.7 6.2 21.2
Note: Work assignments are reported by the district in data element (EJ01) Employee-Assignment-Type, (EJ03) Employee-Assignment-Account-Code and (EJ08) Employee-Assignment-FTE. All work assignments for each employee category are represented.
Data Element Definitions: California Community Colleges Management Information System Data Element Dictionary
All Districts Reporting
Data Source: CCCCO MIS Database for the reporting period Fall Term 2010 Page 81 of 104
June 30, 2011

California Community Colleges Chancellor's OfficeReport on Staffing for Fall 2010
Statewide Full-time Equivalency (FTE) Summary by Taxonomy of Programs (TOP) Code
Educational Administrator
Tenured / Tenure Track
Academic Temporary
Classified Administrator
Classified Professional
Classified Support
TOP CodeTotal
019900 Other Agriculture and Natural Resources
.6 .3 .2 1.1
020100 Architecture and Architectural Technolog
45.5 52.1 1.5 99.2
020110 Landscape Architecture (Transfer)
.3 .3
029900 Other Architecture and Environmental Des
.4 .2 .6
030100 Environmental Science 8.4 10.7 19.1
030200 Environmental Studies .2 16.4 11.4 1.1 2.9 32.0
030300 Environmental Technology
3.7 6.3 .2 1.0 11.2
039900 Environmental Sciences and Technologies,
1.5 1.5
040100 Biology, General 2.0 579.4 371.7 4.2 147.4 1,104.7
040200 Botany, General 8.1 3.2 11.3
040300 MicroBiology 68.1 41.5 4.9 114.5
040700 Zoology, General 10.5 3.0 1.0 14.6
040800 Natural History 3.7 3.4 7.1
041000 Anatomy and Physiology
183.1 146.3 .2 4.7 334.4
043000 Biotechnology and Biomedical Technology
10.5 10.8 2.7 24.1
049900 Other Biological Sciences
2.0 1.0 2.7 5.7
050100 Business and Commerce, General
1.1 127.7 84.7 2.0 .6 28.3 244.3
050200 Accounting 1.4 231.3 201.8 1.2 .5 1.7 438.0
050210 Tax Studies 2.9 6.1 9.0
050400 Banking and Finance 9.7 10.6 20.2
Note: Work assignments are reported by the district in data element (EJ01) Employee-Assignment-Type, (EJ03) Employee-Assignment-Account-Code and (EJ08) Employee-Assignment-FTE. All work assignments for each employee category are represented.
Data Element Definitions: California Community Colleges Management Information System Data Element Dictionary
All Districts Reporting
Data Source: CCCCO MIS Database for the reporting period Fall Term 2010 Page 82 of 104
June 30, 2011

California Community Colleges Chancellor's OfficeReport on Staffing for Fall 2010
Statewide Full-time Equivalency (FTE) Summary by Taxonomy of Programs (TOP) Code
Educational Administrator
Tenured / Tenure Track
Academic Temporary
Classified Administrator
Classified Professional
Classified Support
TOP CodeTotal
050500 Business Administration 97.7 39.5 .2 13.6 151.0
050600 Business Management .5 96.4 90.1 3.4 1.1 16.8 208.3
050630 Management Development and
5.4 13.0 .2 .2 18.9
050640 Small Business and Entrepreneurship
6.7 9.9 .2 16.8
050650 Retail Store Operations and Management
.4 .4 .2 1.0
050800 International Business and Trade
7.2 5.0 12.2
050900 Marketing and Distribution
.4 19.1 19.8 .2 .1 39.6
050910 Advertising 2.0 1.5 3.5
050920 Purchasing .2 .2
050940 Sales and Salesmanship
2.4 2.0 .1 4.5
050960 Display .2 .5 .7
050970 E-Commerce (Business emphasis)
.3 1.8 2.1
051000 Logistics and Materials Transportation
.8 5.1 5.9
051100 Real Estate 23.5 57.6 .1 81.2
051110 Escrow .4 1.0 1.4
051200 Insurance .7 2.4 3.1
051400 Office Technology/Office
.2 171.3 208.7 .3 4.7 40.8 426.0
051410 Legal Office Technology .1 1.7 1.9
051420 Medical Office Technology
2.8 13.1 .6 16.4
051430 Court Reporting 3.0 14.2 .4 17.7
Note: Work assignments are reported by the district in data element (EJ01) Employee-Assignment-Type, (EJ03) Employee-Assignment-Account-Code and (EJ08) Employee-Assignment-FTE. All work assignments for each employee category are represented.
Data Element Definitions: California Community Colleges Management Information System Data Element Dictionary
All Districts Reporting
Data Source: CCCCO MIS Database for the reporting period Fall Term 2010 Page 83 of 104
June 30, 2011

California Community Colleges Chancellor's OfficeReport on Staffing for Fall 2010
Statewide Full-time Equivalency (FTE) Summary by Taxonomy of Programs (TOP) Code
Educational Administrator
Tenured / Tenure Track
Academic Temporary
Classified Administrator
Classified Professional
Classified Support
TOP CodeTotal
051440 Office Management .6 .2 .8
051600 Labor and Industrial Relations
1.1 5.0 6.1
051800 Customer Service 1.1 .2 .1 1.3
059900 Other Business and Management
2.1 3.0 2.9 8.0
060100 Media and Communications,
.8 18.9 18.0 3.6 41.2
060200 Journalism 47.1 33.3 .2 .2 80.8
060400 Radio and Television 20.4 22.5 .5 1.0 12.5 56.9
060410 Radio 2.9 1.8 1.0 1.5 7.2
060420 Television (including combined TV/Film/V
20.4 17.6 1.3 3.9 43.2
060430 Broadcast Journalism 1.4 2.0 3.4
060600 Public Relations .2 1.0 .2 1.4
060700 Technical Communication
3.0 2.3 .3 5.6
061000 Mass Communications .2 6.7 3.3 .3 10.5
061200 Film Studies 12.2 18.9 1.0 32.0
061210 Film History and Criticism
13.3 12.9 26.2
061220 Film Production 9.4 19.5 3.1 32.0
061400 Digital Media 26.2 33.4 .3 4.7 64.5
061410 Multimedia 12.3 16.0 .2 .7 29.1
061420 Electronic Game Design 2.9 3.0 5.9
061430 Website Design and Development
17.8 14.7 1.3 33.8
Note: Work assignments are reported by the district in data element (EJ01) Employee-Assignment-Type, (EJ03) Employee-Assignment-Account-Code and (EJ08) Employee-Assignment-FTE. All work assignments for each employee category are represented.
Data Element Definitions: California Community Colleges Management Information System Data Element Dictionary
All Districts Reporting
Data Source: CCCCO MIS Database for the reporting period Fall Term 2010 Page 84 of 104
June 30, 2011

California Community Colleges Chancellor's OfficeReport on Staffing for Fall 2010
Statewide Full-time Equivalency (FTE) Summary by Taxonomy of Programs (TOP) Code
Educational Administrator
Tenured / Tenure Track
Academic Temporary
Classified Administrator
Classified Professional
Classified Support
TOP CodeTotal
061440 Animation 14.6 16.3 .3 31.2
061450 Desktop Publishing 3.1 4.2 7.4
061460 Computer Graphics and Digital Imagery
25.2 26.2 2.4 53.8
069900 Other Media and Communications
3.3 4.2 .1 7.6
070100 Information Technology, General
.8 229.5 103.0 1.4 4.3 54.9 394.1
070200 Computer Information Systems
106.7 54.9 1.8 27.5 190.9
070210 Software Applications 44.4 51.3 .1 2.0 6.6 104.3
070600 Computer Science (Transfer)
23.3 7.5 .2 1.9 32.9
070700 Computer Software Development
10.1 4.9 15.0
070710 Computer Programming .3 75.1 35.9 .5 111.8
070720 Database Design and Administration
5.0 4.2 9.2
070730 Computer Systems Analysis
3.4 2.2 1.0 6.6
070800 Computer Infrastructure and Support
15.3 9.3 2.9 27.5
070810 Computer Networking 35.4 20.9 .4 .1 .8 57.6
070820 Computer Support 7.8 2.4 4.3 14.5
070900 World Wide Web Administration
6.5 2.4 1.4 10.3
070910 E-Commerce (Technology emphasis)
.7 .6 1.2 2.6
079900 Other Information Technology
8.7 12.6 3.1 24.3
080100 Education, General 1.7 71.3 23.6 1.1 23.7 121.4
080200 Educational Aide (Teacher Assistant)
.6 3.5 2.5 .1 6.7
Note: Work assignments are reported by the district in data element (EJ01) Employee-Assignment-Type, (EJ03) Employee-Assignment-Account-Code and (EJ08) Employee-Assignment-FTE. All work assignments for each employee category are represented.
Data Element Definitions: California Community Colleges Management Information System Data Element Dictionary
All Districts Reporting
Data Source: CCCCO MIS Database for the reporting period Fall Term 2010 Page 85 of 104
June 30, 2011

California Community Colleges Chancellor's OfficeReport on Staffing for Fall 2010
Statewide Full-time Equivalency (FTE) Summary by Taxonomy of Programs (TOP) Code
Educational Administrator
Tenured / Tenure Track
Academic Temporary
Classified Administrator
Classified Professional
Classified Support
TOP CodeTotal
080900 Special Education .5 22.2 9.4 .2 .1 9.3 41.8
083500 Physical Education 3.5 584.7 426.3 3.0 6.0 103.5 1,127.1
083510 Physical Fitness and Body Movement
.5 61.9 69.5 .6 2.9 135.4
083520 Fitness Trainer 7.1 5.5 1.5 14.1
083550 Intercollegiate Athletics .5 130.7 158.0 .5 10.6 28.4 328.6
083560 Coaching 7.1 2.3 .1 .2 9.7
083570 Aquatics and Lifesaving 1.4 1.9 .2 3.6
083580 Adapted Physical Education
16.4 9.8 .1 26.3
083600 Recreation 2.3 1.9 .9 5.0
083610 Recreation Assistant .7 2.6 3.3
083700 Health Education .4 147.8 142.4 1.5 .6 3.8 296.5
083900 Industrial Arts (Transfer) .1 .1
085000 Sign Language 38.4 82.0 .3 1.7 122.5
085010 Sign Language Interpreting
12.2 20.2 2.0 34.3
086000 Educational Technology .3 1.7 .8 .1 .5 3.3
089900 Other Education 2.6 3.2 .2 7.5 13.5
090100 Engineering, General (requires Calculus)
1.0 93.2 25.5 1.0 26.6 147.4
092400 Engineering Technology, General
9.6 12.6 22.2
093400 Electronics and Electric Technology
.3 58.8 45.8 .0 14.8 119.7
093410 Computer Electronics 5.7 2.2 1.3 9.2
Note: Work assignments are reported by the district in data element (EJ01) Employee-Assignment-Type, (EJ03) Employee-Assignment-Account-Code and (EJ08) Employee-Assignment-FTE. All work assignments for each employee category are represented.
Data Element Definitions: California Community Colleges Management Information System Data Element Dictionary
All Districts Reporting
Data Source: CCCCO MIS Database for the reporting period Fall Term 2010 Page 86 of 104
June 30, 2011

California Community Colleges Chancellor's OfficeReport on Staffing for Fall 2010
Statewide Full-time Equivalency (FTE) Summary by Taxonomy of Programs (TOP) Code
Educational Administrator
Tenured / Tenure Track
Academic Temporary
Classified Administrator
Classified Professional
Classified Support
TOP CodeTotal
093420 Industrial Electronics 4.5 4.1 8.6
093430 Telecommunications Technology
13.8 3.3 8.0 25.0
093440 Electrical Systems and Power Transmissio
5.0 5.7 10.6
093460 Biomedical Instrumentation
.6 .6
093470 Electron Microscopy 2.1 .3 1.0 3.4
093480 Laser and Optical Technology
.7 .3 1.1
093500 Electro-Mechanical Technology
1.0 1.2 2.2
093510 Appliance Repair 1.3 .6 1.9
093600 Printing and Lithography 14.6 10.1 3.6 28.3
094500 Industrial Systems Technology and Mainte
5.1 3.6 2.5 11.2
094600 Environmental Control Technology
1.0 30.2 26.2 7.3 64.7
094610 Energy Systems Technology
2.7 3.6 6.2
094700 Diesel Technology .0 16.0 8.2 3.2 27.4
094720 Heavy Equipment Maintenance
4.1 1.0 .3 5.4
094740 Railroad and Light Rail Operations
.2 .1 .3
094750 Truck and Bus Driving .1 .1
094800 Automotive Technology 1.0 215.0 96.7 1.5 32.8 347.0
094830 Motorcycle, Outboard and Small Engine Re
.8 2.2 3.0
094840 Alternative Fuels and Advanced Transport
.9 2.0 2.8
094900 Automotive Collision Repair
27.7 16.1 4.5 48.2
Note: Work assignments are reported by the district in data element (EJ01) Employee-Assignment-Type, (EJ03) Employee-Assignment-Account-Code and (EJ08) Employee-Assignment-FTE. All work assignments for each employee category are represented.
Data Element Definitions: California Community Colleges Management Information System Data Element Dictionary
All Districts Reporting
Data Source: CCCCO MIS Database for the reporting period Fall Term 2010 Page 87 of 104
June 30, 2011

California Community Colleges Chancellor's OfficeReport on Staffing for Fall 2010
Statewide Full-time Equivalency (FTE) Summary by Taxonomy of Programs (TOP) Code
Educational Administrator
Tenured / Tenure Track
Academic Temporary
Classified Administrator
Classified Professional
Classified Support
TOP CodeTotal
094910 Upholstery Repair - Automotive
2.9 .4 3.3
095000 Aeronautical and Aviation Technology
29.4 7.7 6.6 43.8
095010 Aviation Airframe Mechanics
5.1 3.2 2.0 10.2
095020 Aviation Powerplant Mechanics
9.8 .6 .1 10.5
095040 Aircraft Electronics (Avionics)
.3 .4 .6
095050 Aircraft Fabrication 1.1 2.7 1.0 4.8
095200 Construction Crafts Technology
29.6 26.6 5.6 61.7
095210 Carpentry 11.7 7.9 19.6
095220 Electrical 9.6 30.9 1.4 41.8
095230 Plumbing, Pipefitting and Steamfitting
2.1 27.9 30.0
095240 Glazing .3 .3
095250 Mill and Cabinet Work 9.7 12.6 1.3 23.6
095260 Masonry, Tile, Cement, Lath and Plaster
.9 .6 1.5
095290 Roofing 1.0 1.0
095300 Drafting Technology 66.4 52.2 .5 5.8 124.9
095310 Architectural Drafting 3.8 4.5 .2 8.4
095330 Electrical, Electronic, and Electro-Mech
.4 .4
095340 Mechanical Drafting 1.5 3.1 4.6
095360 Technical Illustration .7 .7
095400 Chemical Technology .6 1.4 .2 2.1
Note: Work assignments are reported by the district in data element (EJ01) Employee-Assignment-Type, (EJ03) Employee-Assignment-Account-Code and (EJ08) Employee-Assignment-FTE. All work assignments for each employee category are represented.
Data Element Definitions: California Community Colleges Management Information System Data Element Dictionary
All Districts Reporting
Data Source: CCCCO MIS Database for the reporting period Fall Term 2010 Page 88 of 104
June 30, 2011

California Community Colleges Chancellor's OfficeReport on Staffing for Fall 2010
Statewide Full-time Equivalency (FTE) Summary by Taxonomy of Programs (TOP) Code
Educational Administrator
Tenured / Tenure Track
Academic Temporary
Classified Administrator
Classified Professional
Classified Support
TOP CodeTotal
095420 Plastics and Composites
1.2 .5 1.6
095500 Laboratory Science Technology
1.0 1.5 .5 3.0
095600 Manufacturing and Industrial Technology
24.7 23.8 .9 1.0 6.4 56.8
095630 Machining and Machine Tools
.0 24.5 19.6 .6 9.5 54.2
095640 Sheet Metal and Structural Metal
1.6 16.3 .1 18.0
095650 Welding Technology 65.1 47.7 .5 12.7 126.0
095670 Industrial and Occupational Safety and
.5 .4 .9
095680 Industrial Quality Control .3 .3
095700 Civil and Construction Management Techno
7.8 15.6 .2 .5 24.1
095720 Construction Inspection 2.1 10.1 .4 12.6
095730 Surveying 2.4 4.6 7.1
095800 Water and Wastewater Technology
2.2 21.6 1.0 24.9
095900 Marine Technology 3.0 1.4 .5 4.9
099900 Other Engineering and Related Industrial
5.2 5.6 3.0 .4 .5 14.8
100100 Fine Arts, General 2.0 96.2 90.4 1.0 2.4 24.4 216.5
100200 Art .2 309.3 250.9 .3 81.9 642.6
100210 Painting and Drawing 78.0 127.8 .6 206.4
100220 Sculpture 17.4 12.1 1.9 31.5
100230 Ceramics 36.1 35.3 3.0 74.5
100400 Music .8 347.8 366.1 2.8 36.2 753.6
Note: Work assignments are reported by the district in data element (EJ01) Employee-Assignment-Type, (EJ03) Employee-Assignment-Account-Code and (EJ08) Employee-Assignment-FTE. All work assignments for each employee category are represented.
Data Element Definitions: California Community Colleges Management Information System Data Element Dictionary
All Districts Reporting
Data Source: CCCCO MIS Database for the reporting period Fall Term 2010 Page 89 of 104
June 30, 2011
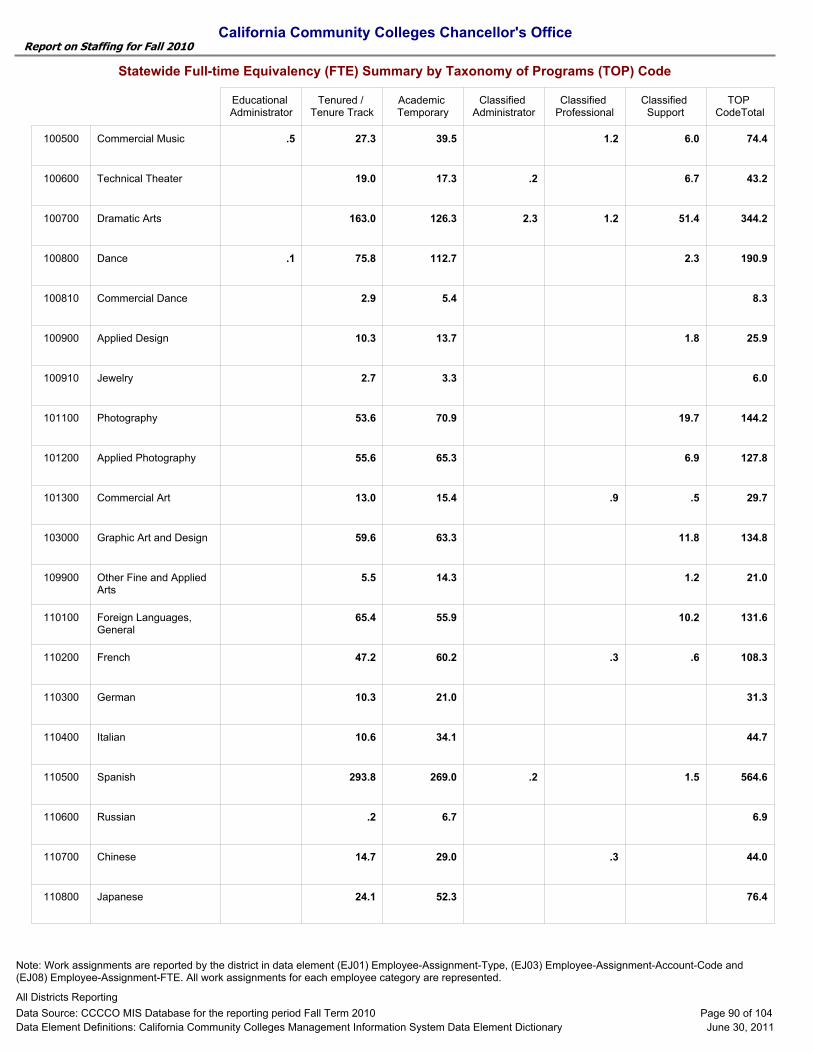
California Community Colleges Chancellor's OfficeReport on Staffing for Fall 2010
Statewide Full-time Equivalency (FTE) Summary by Taxonomy of Programs (TOP) Code
Educational Administrator
Tenured / Tenure Track
Academic Temporary
Classified Administrator
Classified Professional
Classified Support
TOP CodeTotal
100500 Commercial Music .5 27.3 39.5 1.2 6.0 74.4
100600 Technical Theater 19.0 17.3 .2 6.7 43.2
100700 Dramatic Arts 163.0 126.3 2.3 1.2 51.4 344.2
100800 Dance .1 75.8 112.7 2.3 190.9
100810 Commercial Dance 2.9 5.4 8.3
100900 Applied Design 10.3 13.7 1.8 25.9
100910 Jewelry 2.7 3.3 6.0
101100 Photography 53.6 70.9 19.7 144.2
101200 Applied Photography 55.6 65.3 6.9 127.8
101300 Commercial Art 13.0 15.4 .9 .5 29.7
103000 Graphic Art and Design 59.6 63.3 11.8 134.8
109900 Other Fine and Applied Arts
5.5 14.3 1.2 21.0
110100 Foreign Languages, General
65.4 55.9 10.2 131.6
110200 French 47.2 60.2 .3 .6 108.3
110300 German 10.3 21.0 31.3
110400 Italian 10.6 34.1 44.7
110500 Spanish 293.8 269.0 .2 1.5 564.6
110600 Russian .2 6.7 6.9
110700 Chinese 14.7 29.0 .3 44.0
110800 Japanese 24.1 52.3 76.4
Note: Work assignments are reported by the district in data element (EJ01) Employee-Assignment-Type, (EJ03) Employee-Assignment-Account-Code and (EJ08) Employee-Assignment-FTE. All work assignments for each employee category are represented.
Data Element Definitions: California Community Colleges Management Information System Data Element Dictionary
All Districts Reporting
Data Source: CCCCO MIS Database for the reporting period Fall Term 2010 Page 90 of 104
June 30, 2011

California Community Colleges Chancellor's OfficeReport on Staffing for Fall 2010
Statewide Full-time Equivalency (FTE) Summary by Taxonomy of Programs (TOP) Code
Educational Administrator
Tenured / Tenure Track
Academic Temporary
Classified Administrator
Classified Professional
Classified Support
TOP CodeTotal
110900 Latin .0 2.3 2.3
111100 Hebrew and Semitic 1.3 1.3
111200 Arabic 2.9 10.2 13.1
111700 Asian, South Asian, and Pacific Islands
2.8 2.8
111710 Filipino (Tagalog) .7 1.2 1.9
111720 Vietnamese 1.6 5.1 6.7
111730 Korean 2.1 2.1
111900 Portuguese .3 2.2 2.5
119900 Other Foreign Languages
2.1 7.2 .5 9.7
120100 Health Occupations, General
6.0 86.6 28.1 .1 1.5 36.8 159.1
120200 Hospital and Health Care Administration
.1 .1
120500 Medical Laboratory Technology
2.1 1.0 2.6 .9 6.7
120510 Phlebotomy 2.9 9.6 12.5
120600 Physicians Assistant 3.5 2.8 6.2
120800 Medical Assisting 15.3 24.4 2.2 41.9
120810 Clinical Medical Assisting
3.1 8.0 11.1
120820 Administrative Medical Assisting
3.2 5.4 .6 9.1
120830 Health Facility Unit Coordinator
.8 .8
120900 Hospital Central Service Technician
1.0 1.0
121000 Respiratory Care/Therapy
38.9 35.1 74.0
Note: Work assignments are reported by the district in data element (EJ01) Employee-Assignment-Type, (EJ03) Employee-Assignment-Account-Code and (EJ08) Employee-Assignment-FTE. All work assignments for each employee category are represented.
Data Element Definitions: California Community Colleges Management Information System Data Element Dictionary
All Districts Reporting
Data Source: CCCCO MIS Database for the reporting period Fall Term 2010 Page 91 of 104
June 30, 2011

California Community Colleges Chancellor's OfficeReport on Staffing for Fall 2010
Statewide Full-time Equivalency (FTE) Summary by Taxonomy of Programs (TOP) Code
Educational Administrator
Tenured / Tenure Track
Academic Temporary
Classified Administrator
Classified Professional
Classified Support
TOP CodeTotal
121100 Polysomnography .2 .5 .7
121200 Electro-Neurodiagnostic Technology
.7 .7
121300 Cardiovascular Technician
7.5 2.6 10.1
121400 Orthopedic Assistant .8 .8
121500 Electrocardiography .3 .9 1.2
121700 Surgical Technician 4.6 2.7 7.3
121800 Occupational Therapy Technology
6.1 2.2 .5 8.8
122000 Speech/Language Pathology and
6.1 4.0 10.2
122100 Pharmacy Technology 8.5 13.0 1.1 22.6
122200 Physical Therapist Assistant
5.5 4.1 .3 9.8
122300 Health Information Technology
12.1 12.0 24.2
122310 Health Information Coding
.7 1.0 1.7
122500 Radiologic Technology 50.1 23.6 .9 74.6
122600 Radiation Therapy Technician
2.8 1.9 4.7
122700 Diagnostic Medical Sonography
3.3 2.9 6.2
122800 Athletic Training and Sports Medicine
3.2 1.7 4.6 9.4
123000 Nursing 5.0 84.5 93.2 .5 14.5 197.6
123010 Registered Nursing 2.6 551.6 329.7 1.8 3.5 22.7 911.9
123020 Licensed Vocational Nursing
112.8 80.9 6.0 199.7
123030 Certified Nurse Assistant
.5 15.4 38.1 54.0
Note: Work assignments are reported by the district in data element (EJ01) Employee-Assignment-Type, (EJ03) Employee-Assignment-Account-Code and (EJ08) Employee-Assignment-FTE. All work assignments for each employee category are represented.
Data Element Definitions: California Community Colleges Management Information System Data Element Dictionary
All Districts Reporting
Data Source: CCCCO MIS Database for the reporting period Fall Term 2010 Page 92 of 104
June 30, 2011

California Community Colleges Chancellor's OfficeReport on Staffing for Fall 2010
Statewide Full-time Equivalency (FTE) Summary by Taxonomy of Programs (TOP) Code
Educational Administrator
Tenured / Tenure Track
Academic Temporary
Classified Administrator
Classified Professional
Classified Support
TOP CodeTotal
123080 Home Health Aide 2.5 4.6 7.1
123900 Psychiatric Technician 43.2 13.6 .6 57.4
124000 Dental Occupations 1.0 10.5 7.1 3.7 22.3
124010 Dental Assistant 29.7 29.2 1.2 60.1
124020 Dental Hygienist 1.9 38.2 58.0 11.5 109.6
124030 Dental Laboratory Technician
4.8 1.6 .3 6.8
125000 Emergency Medical Services
1.0 39.1 91.0 .0 .3 131.4
125100 Paramedic 20.6 24.7 45.3
125500 Mortuary Science 6.5 .3 6.8
126000 Health Professions, Transfer Core Curric
1.0 28.3 7.6 1.2 38.1
126100 Community Health Care Worker
.5 1.0 1.5
126200 Massage Therapy 1.1 .2 1.3
129900 Other Health Occupations
4.9 11.0 1.0 2.8 19.7
130100 Family and Consumer Sciences, General
2.0 63.7 18.8 1.0 1.6 13.5 100.6
130110 Consumer Services .2 .4 .6
130200 Interior Design and Merchandising
25.3 35.9 1.0 62.1
130300 Fashion 21.8 35.9 1.7 59.4
130310 Fashion Design 10.0 22.9 .4 33.3
130320 Fashion Merchandising 3.5 5.5 .5 9.4
130330 Fashion Production 3.9 5.0 8.9
Note: Work assignments are reported by the district in data element (EJ01) Employee-Assignment-Type, (EJ03) Employee-Assignment-Account-Code and (EJ08) Employee-Assignment-FTE. All work assignments for each employee category are represented.
Data Element Definitions: California Community Colleges Management Information System Data Element Dictionary
All Districts Reporting
Data Source: CCCCO MIS Database for the reporting period Fall Term 2010 Page 93 of 104
June 30, 2011

California Community Colleges Chancellor's OfficeReport on Staffing for Fall 2010
Statewide Full-time Equivalency (FTE) Summary by Taxonomy of Programs (TOP) Code
Educational Administrator
Tenured / Tenure Track
Academic Temporary
Classified Administrator
Classified Professional
Classified Support
TOP CodeTotal
130500 Child Development/Early Care
1.3 268.8 237.2 7.8 6.5 131.0 652.6
130520 Children with Special Needs
.2 2.6 4.5 7.3
130540 Preshool Age Children .8 10.4 8.8 .1 20.1
130550 The School Age Child 1.2 2.0 .2 3.4
130560 Parenting and Family Education
.1 2.4 8.0 10.5
130570 Foster and Kinship Care .1 .6 2.0 .1 .8 .2 3.9
130580 Child Development Administration and Man
9.3 8.0 .2 17.6
130590 Infants and Toddlers 8.0 19.2 .5 .2 27.9
130600 Nutrition, Foods, and Culinary Arts
64.6 76.1 .3 4.2 145.2
130620 Dietetic Services and Management
4.6 3.1 7.7
130630 Culinary Arts 70.5 42.5 1.3 6.1 15.3 135.7
130660 Dietetic Technology 2.1 1.1 3.2
130700 Hospitality 9.5 7.3 .2 .1 17.1
130710 Restaurant and Food Services and Managem
9.7 8.6 .2 18.5
130720 Lodging Management 1.3 3.9 5.2
130730 Resort and Club Management
.4 .4
130800 Family Studies 1.2 3.6 4.8
130900 Gerontology 2.2 23.0 25.3
139900 Other Family and Consumer Sciences
1.0 .9 1.9
140100 Law, General .4 12.3 4.8 17.5
Note: Work assignments are reported by the district in data element (EJ01) Employee-Assignment-Type, (EJ03) Employee-Assignment-Account-Code and (EJ08) Employee-Assignment-FTE. All work assignments for each employee category are represented.
Data Element Definitions: California Community Colleges Management Information System Data Element Dictionary
All Districts Reporting
Data Source: CCCCO MIS Database for the reporting period Fall Term 2010 Page 94 of 104
June 30, 2011

California Community Colleges Chancellor's OfficeReport on Staffing for Fall 2010
Statewide Full-time Equivalency (FTE) Summary by Taxonomy of Programs (TOP) Code
Educational Administrator
Tenured / Tenure Track
Academic Temporary
Classified Administrator
Classified Professional
Classified Support
TOP CodeTotal
140200 Paralegal .4 25.6 42.6 68.6
149900 Other Law .4 .3 .7
150100 English 1.9 1,682.8 1,577.2 3.8 99.9 3,365.6
150110 Linguistics 7.6 9.0 .2 16.8
150200 Language Arts 6.8 3.3 2.4 12.5
150300 Comparative Literature 31.3 5.7 1.2 38.2
150400 Classics 16.5 13.5 30.0
150600 Speech Communication 1.5 361.5 350.0 .8 1.4 2.9 718.1
150700 Creative Writing .2 24.7 9.0 .2 34.2
150900 Philosophy .8 177.6 164.0 .1 342.6
151000 Religious Studies .4 16.6 20.1 37.1
152000 Reading 198.5 152.1 .3 1.0 10.6 362.5
159900 Other Humanities 34.3 35.7 1.5 71.5
160100 Library Science, General
27.9 14.4 .9 43.3
160200 Library Technician (Aide)
4.6 2.6 .2 5.7 13.0
169900 Other Library Science 1.0 .9 2.0
170100 Mathematics, General 2.4 1,784.3 1,281.5 2.3 68.8 3,139.3
170200 Mathematics Skills 66.5 105.2 2.6 174.3
179900 Other Mathematics 1.3 2.4 .1 3.8
190100 Physical Sciences, General
.2 79.7 40.3 1.0 3.7 50.2 175.1
Note: Work assignments are reported by the district in data element (EJ01) Employee-Assignment-Type, (EJ03) Employee-Assignment-Account-Code and (EJ08) Employee-Assignment-FTE. All work assignments for each employee category are represented.
Data Element Definitions: California Community Colleges Management Information System Data Element Dictionary
All Districts Reporting
Data Source: CCCCO MIS Database for the reporting period Fall Term 2010 Page 95 of 104
June 30, 2011

California Community Colleges Chancellor's OfficeReport on Staffing for Fall 2010
Statewide Full-time Equivalency (FTE) Summary by Taxonomy of Programs (TOP) Code
Educational Administrator
Tenured / Tenure Track
Academic Temporary
Classified Administrator
Classified Professional
Classified Support
TOP CodeTotal
190200 Physics, General 183.8 86.0 .4 16.6 286.8
190500 Chemistry, General 3.0 448.7 297.7 1.7 63.4 814.5
191100 Astronomy .2 88.1 52.0 .2 1.9 142.3
191400 Geology 1.0 86.0 47.9 2.0 3.6 140.5
191900 Oceangraphy 21.9 19.1 41.1
192000 Ocean Technology .1 .1
193000 Earth Science .2 18.9 11.6 2.0 32.7
199900 Other Physical Sciences .9 .9
200100 Psychology, General 1.8 399.7 348.5 4.2 754.3
200300 Behavioral Science 1.0 1.2 2.2
209900 Other Psychology 2.4 1.2 .3 3.9
210200 Public Administration .2 .2
210210 Public Works 1.0 1.6 2.6
210400 Human Services 21.0 31.0 .9 .2 1.5 54.6
210440 Alcohol and Controlled Substances
17.4 34.1 .1 51.5
210450 Disability Services 1.0 1.0
210500 Administration of Justice 4.6 140.9 207.4 .7 1.0 18.9 373.5
210510 Corrections 7.8 13.9 21.7
210520 Probation and Parole .2 1.9 .0 2.1
210530 Industrial and Transportation Security
.4 .2 .6
Note: Work assignments are reported by the district in data element (EJ01) Employee-Assignment-Type, (EJ03) Employee-Assignment-Account-Code and (EJ08) Employee-Assignment-FTE. All work assignments for each employee category are represented.
Data Element Definitions: California Community Colleges Management Information System Data Element Dictionary
All Districts Reporting
Data Source: CCCCO MIS Database for the reporting period Fall Term 2010 Page 96 of 104
June 30, 2011

California Community Colleges Chancellor's OfficeReport on Staffing for Fall 2010
Statewide Full-time Equivalency (FTE) Summary by Taxonomy of Programs (TOP) Code
Educational Administrator
Tenured / Tenure Track
Academic Temporary
Classified Administrator
Classified Professional
Classified Support
TOP CodeTotal
210540 Forensics, Evidence, and Investigation
.6 3.6 4.2
210550 Police Academy 1.5 4.4 18.4 .1 4.4 28.8
213300 Fire Technology .1 39.5 110.6 1.1 .4 7.0 158.8
213310 Wildland Fire Technology
.7 3.8 4.5
213350 Fire Academy 12.9 29.2 2.2 44.4
214000 Legal and Community Interpretation
1.0 1.0 2.0
219900 Other Public and Protective Services
.7 2.1 .3 3.0
220100 Social Sciences, General
1.0 123.3 56.5 7.4 188.2
220110 Women's Studies 6.0 4.9 .1 11.0
220120 American Studies 6.0 4.4 10.4
220200 Anthropology 141.9 151.0 2.7 295.7
220220 Archaeology 4.3 2.1 6.3
220300 Ethnic Studies 71.0 60.3 .4 131.8
220400 Economics 141.4 121.5 .6 263.4
220500 History .6 374.1 336.3 1.7 .8 713.5
220600 Geography 1.2 99.2 80.7 .1 181.1
220610 Geographic Information Systems
4.6 9.0 13.7
220700 Political Science .5 211.9 160.3 .6 .8 374.0
220710 Student Government .6 2.1 .8 .3 3.7
220800 Sociology 1.0 196.5 166.6 1.4 .5 2.3 368.2
Note: Work assignments are reported by the district in data element (EJ01) Employee-Assignment-Type, (EJ03) Employee-Assignment-Account-Code and (EJ08) Employee-Assignment-FTE. All work assignments for each employee category are represented.
Data Element Definitions: California Community Colleges Management Information System Data Element Dictionary
All Districts Reporting
Data Source: CCCCO MIS Database for the reporting period Fall Term 2010 Page 97 of 104
June 30, 2011

California Community Colleges Chancellor's OfficeReport on Staffing for Fall 2010
Statewide Full-time Equivalency (FTE) Summary by Taxonomy of Programs (TOP) Code
Educational Administrator
Tenured / Tenure Track
Academic Temporary
Classified Administrator
Classified Professional
Classified Support
TOP CodeTotal
221000 International Studies 5.7 18.0 23.8
229900 Other Social Sciences 2.3 4.5 .4 7.2
300500 Custodial Services 1.4 1.4
300700 Cosmetology and Barbering
.2 103.7 60.5 .3 16.0 180.7
300900 Travel Services and Tourism
.4 3.8 4.2
302000 Aviation and Airport Management and Serv
1.5 1.6 3.1
302010 Aviation and Airport Management
1.1 1.1
302020 Piloting 6.5 5.7 12.1
302030 Air Traffic Control .8 .4 1.2
302040 Flight Attendant 1.2 2.7 3.9
309900 Other Commercial Services
3.0 2.0 5.0
490100 Liberal Arts and Sciences, General
4.7 4.0 12.9 21.6
490110 Transfer Studies .5 .5
490120 Liberal Studies .2 .2
490200 Biological and Physical Sciences (and Ma
1.0 .2 1.0 2.2
490300 Humanities 17.5 5.9 3.0 12.5 38.9
490310 Humanities and Fine Arts
1.0 1.2 1.1 1.0 4.3
490330 Humanities and Social Sciences
1.0 .6 .2 1.8
493000 General Studies 6.0 74.0 39.9 3.4 4.9 86.2 214.3
493009 Supervised Tutoring 1.0 22.7 29.3 2.1 30.6 85.8
Note: Work assignments are reported by the district in data element (EJ01) Employee-Assignment-Type, (EJ03) Employee-Assignment-Account-Code and (EJ08) Employee-Assignment-FTE. All work assignments for each employee category are represented.
Data Element Definitions: California Community Colleges Management Information System Data Element Dictionary
All Districts Reporting
Data Source: CCCCO MIS Database for the reporting period Fall Term 2010 Page 98 of 104
June 30, 2011

California Community Colleges Chancellor's OfficeReport on Staffing for Fall 2010
Statewide Full-time Equivalency (FTE) Summary by Taxonomy of Programs (TOP) Code
Educational Administrator
Tenured / Tenure Track
Academic Temporary
Classified Administrator
Classified Professional
Classified Support
TOP CodeTotal
493010 Career Guidance and Orientation
1.5 132.0 64.0 .3 4.5 15.3 217.7
493011 Interpersonal Skills 7.1 4.2 11.3
493012 Job Seeking/Changing Skills
16.7 19.5 .4 1.3 37.9
493013 Academic Guidance .5 92.1 41.5 .0 .8 1.6 136.4
493014 Study Skills .2 9.7 13.9 23.8
493030 Learning Skills, Handicapped
.4 46.7 31.1 .0 1.7 11.1 91.0
493031 Living Skills, Handicapped
.3 27.4 14.6 4.2 24.8 71.3
493032 Learning Skills, Learning Disabled
35.6 14.1 4.0 53.7
493033 Learning Skills, Speech Impaired
.5 .2 .7
493060 Elementary Education (Grades 1-8)
11.2 36.0 5.6 52.8
493062 Secondary Education (Grades 9-12) and G.
21.1 95.5 9.6 126.2
493072 Leadership Skills Development
.2 29.5 11.6 1.7 .1 10.7 53.9
493084 English as a Second Language - Writing
202.5 229.0 3.1 434.6
493085 English as a Second Language - Reading
52.7 60.1 .5 113.2
493086 English as a Second Language - Listening
66.8 88.7 .3 155.8
493087 English as a Second Language - Integrate
.1 269.3 535.1 .4 9.9 814.8
493090 Citizenship / ESL Civics 4.3 9.7 .0 14.0
493100 Vocational ESL 7.4 6.7 .8 1.0 15.8
493200 General Work Experience
14.9 18.8 .4 .6 34.7
499900 Other Interdisciplinary Studies
1.7 48.3 43.5 .4 6.2 94.7 194.8
StatewideTotal 90.8 17,176.9 15,117.2 54.3 130.6 2,115.6 34,685.4
Note: Work assignments are reported by the district in data element (EJ01) Employee-Assignment-Type, (EJ03) Employee-Assignment-Account-Code and (EJ08) Employee-Assignment-FTE. All work assignments for each employee category are represented.
Data Element Definitions: California Community Colleges Management Information System Data Element Dictionary
All Districts Reporting
Data Source: CCCCO MIS Database for the reporting period Fall Term 2010 Page 99 of 104
June 30, 2011

California Community Colleges Chancellor's OfficeReport on Staffing for Fall 2010
Statewide Full-time Equivalency (FTE) Summary by Administrative and Support Activitiy (ASA) Code
Educational Administrator
Tenured / Tenure Track
Academic Temporary
Classified Administrator
Classified Professional
Classified Support
ASA Code Total
34.0 42.3 1.9 44.9 10.3 370.5 503.9
6000 Instructional Administration and Instructional
49.0 21.8 15.6 2.6 2.2 105.2 196.4
6010 Academic Administration 716.0 360.3 37.6 49.9 118.3 1,792.9 3,075.0
6020 Course and Curriculum Development
15.9 66.1 29.2 9.8 12.0 73.0 206.0
6030 Academic/Faculty Senate 2.0 76.9 1.6 1.6 1.0 24.5 107.6
6090 Other Instructional Administration and
6.0 55.7 11.8 2.0 3.5 100.1 179.1
6100 Instructional Support Services
10.6 24.5 9.1 7.7 27.5 444.7 524.0
6110 Learning Center 17.4 41.8 10.1 11.0 16.5 366.0 462.8
6120 Library 23.2 309.5 67.8 4.0 20.5 552.8 977.9
6130 Media 2.9 38.8 14.0 20.8 331.1 407.6
6140 Museums and Galleries 2.5 2.0 2.4 12.1 19.0
6150 Academic Information Systems and Technology
4.8 5.2 20.8 11.4 196.2 238.3
6190 Other Instructional Support Services
8.2 29.3 3.9 .5 26.9 182.1 250.9
6200 Admissions and Records 36.3 8.7 .6 62.0 62.8 1,250.6 1,420.9
6300 Student Counseling and Guidance
23.3 490.8 90.3 .1 12.5 191.1 808.1
6310 Counseling and Guidance 29.8 621.1 93.8 4.9 31.1 245.3 1,026.1
6320 Matriculation and Student Assessment
14.1 41.9 17.4 4.3 30.2 208.1 315.8
6330 Transfer Programs 2.0 59.1 25.2 3.0 8.4 58.9 156.5
6340 Career Guidance 3.7 5.0 2.8 .5 4.3 31.6 48.0
6390 Other Student Counseling and Guidance
4.4 17.4 20.5 5.0 4.1 29.3 80.7
Note: Work assignments are reported by the district in data element (EJ01) Employee-Assignment-Type, (EJ03) Employee-Assignment-Account-Code and (EJ08) Employee-Assignment-FTE. All work assignments for each employee category are represented.
Data Element Definitions: California Community Colleges Management Information System Data Element Dictionary
All Districts Reporting
Data Source: CCCCO MIS Database for the reporting period Fall Term 2010 Page 100 of 104
June 30, 2011

California Community Colleges Chancellor's OfficeReport on Staffing for Fall 2010
Statewide Full-time Equivalency (FTE) Summary by Administrative and Support Activitiy (ASA) Code
Educational Administrator
Tenured / Tenure Track
Academic Temporary
Classified Administrator
Classified Professional
Classified Support
ASA Code Total
6400 Other Student Services 17.6 12.4 4.7 3.0 15.0 92.2 144.8
6420 Disabled Students Programs and Services
30.2 132.1 30.2 6.5 66.6 519.9 785.5
6430 Extended Opportunities Programs and Services
38.3 157.0 18.1 7.4 27.2 262.0 510.1
6440 Health Services 20.2 52.9 35.2 8.0 28.6 142.8 287.8
6450 Student Personnel Administration
94.7 8.1 5.2 7.5 20.1 199.7 335.3
6460 Financial Aid Administration 24.2 4.6 5.2 48.6 88.9 775.2 946.5
6470 Job Placement Services 9.6 6.6 9.8 2.2 23.3 122.5 174.0
6480 Veterans Services 3.7 1.1 1.5 3.0 31.9 41.2
6490 Miscellaneous Student Services
46.1 45.5 21.9 35.8 45.9 345.5 540.7
6500 Operation and Maintenance of Plant
5.1 20.0 4.2 171.1 200.5
6510 Building Maintenance and Repairs
4.4 1.0 57.7 16.0 1,154.7 1,233.8
6530 Custodial Services 1.4 26.5 1.0 1,909.8 1,938.7
6550 Grounds Maintenance and Repairs
.4 10.6 .9 567.4 579.3
6570 Utilities 30.0 30.0
6590 Other Operation and Maintenance of Plant
4.0 15.9 14.0 137.7 171.6
6600 Planning, Policymaking, and Coordination
300.3 15.4 3.0 90.3 97.0 479.4 985.4
6700 General Institutional Support Services
9.5 1.5 .4 13.0 11.2 70.0 105.6
6710 Community Relations 21.4 1.2 81.2 39.1 215.7 358.6
6720 Fiscal Operations 32.6 1.7 1.5 144.8 207.3 999.3 1,387.1
6730 Human Resources Management
49.6 12.1 73.1 106.8 418.3 659.8
Note: Work assignments are reported by the district in data element (EJ01) Employee-Assignment-Type, (EJ03) Employee-Assignment-Account-Code and (EJ08) Employee-Assignment-FTE. All work assignments for each employee category are represented.
Data Element Definitions: California Community Colleges Management Information System Data Element Dictionary
All Districts Reporting
Data Source: CCCCO MIS Database for the reporting period Fall Term 2010 Page 101 of 104
June 30, 2011
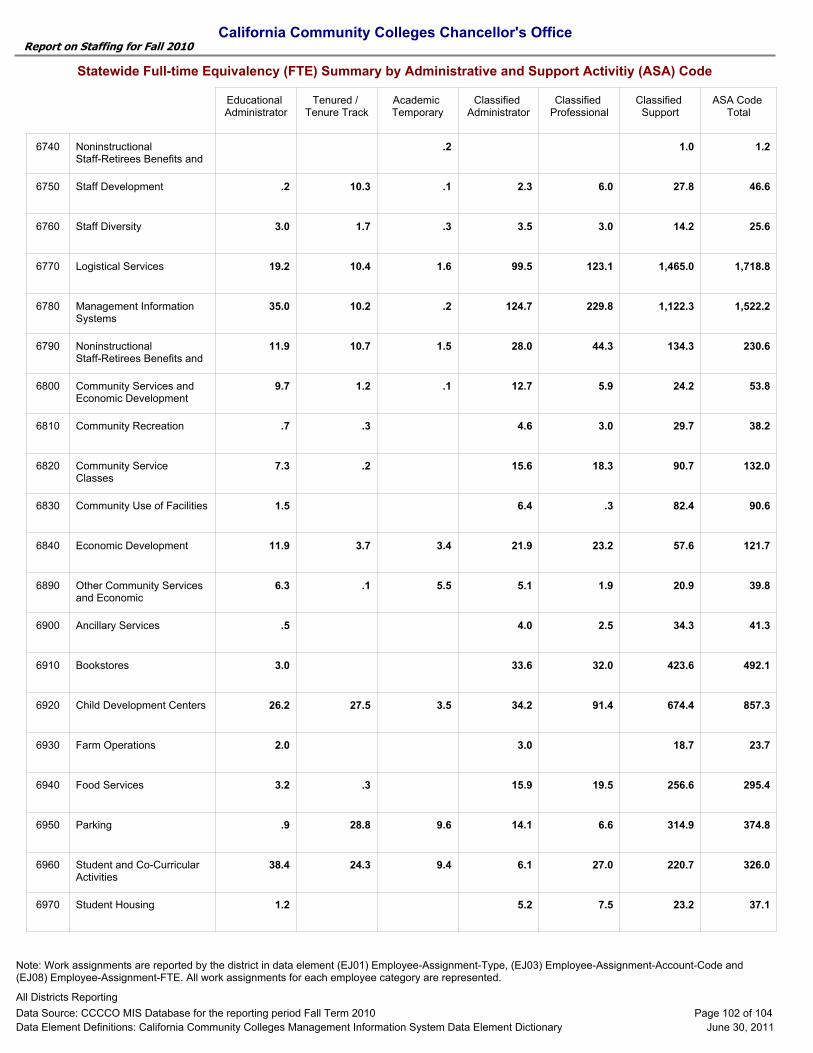
California Community Colleges Chancellor's OfficeReport on Staffing for Fall 2010
Statewide Full-time Equivalency (FTE) Summary by Administrative and Support Activitiy (ASA) Code
Educational Administrator
Tenured / Tenure Track
Academic Temporary
Classified Administrator
Classified Professional
Classified Support
ASA Code Total
6740 Noninstructional Staff-Retirees Benefits and
.2 1.0 1.2
6750 Staff Development .2 10.3 .1 2.3 6.0 27.8 46.6
6760 Staff Diversity 3.0 1.7 .3 3.5 3.0 14.2 25.6
6770 Logistical Services 19.2 10.4 1.6 99.5 123.1 1,465.0 1,718.8
6780 Management Information Systems
35.0 10.2 .2 124.7 229.8 1,122.3 1,522.2
6790 Noninstructional Staff-Retirees Benefits and
11.9 10.7 1.5 28.0 44.3 134.3 230.6
6800 Community Services and Economic Development
9.7 1.2 .1 12.7 5.9 24.2 53.8
6810 Community Recreation .7 .3 4.6 3.0 29.7 38.2
6820 Community Service Classes
7.3 .2 15.6 18.3 90.7 132.0
6830 Community Use of Facilities 1.5 6.4 .3 82.4 90.6
6840 Economic Development 11.9 3.7 3.4 21.9 23.2 57.6 121.7
6890 Other Community Services and Economic
6.3 .1 5.5 5.1 1.9 20.9 39.8
6900 Ancillary Services .5 4.0 2.5 34.3 41.3
6910 Bookstores 3.0 33.6 32.0 423.6 492.1
6920 Child Development Centers 26.2 27.5 3.5 34.2 91.4 674.4 857.3
6930 Farm Operations 2.0 3.0 18.7 23.7
6940 Food Services 3.2 .3 15.9 19.5 256.6 295.4
6950 Parking .9 28.8 9.6 14.1 6.6 314.9 374.8
6960 Student and Co-Curricular Activities
38.4 24.3 9.4 6.1 27.0 220.7 326.0
6970 Student Housing 1.2 5.2 7.5 23.2 37.1
Note: Work assignments are reported by the district in data element (EJ01) Employee-Assignment-Type, (EJ03) Employee-Assignment-Account-Code and (EJ08) Employee-Assignment-FTE. All work assignments for each employee category are represented.
Data Element Definitions: California Community Colleges Management Information System Data Element Dictionary
All Districts Reporting
Data Source: CCCCO MIS Database for the reporting period Fall Term 2010 Page 102 of 104
June 30, 2011

California Community Colleges Chancellor's OfficeReport on Staffing for Fall 2010
Statewide Full-time Equivalency (FTE) Summary by Administrative and Support Activitiy (ASA) Code
Educational Administrator
Tenured / Tenure Track
Academic Temporary
Classified Administrator
Classified Professional
Classified Support
ASA Code Total
6990 Other Ancillary Services 5.1 3.4 .4 10.2 7.9 104.3 131.3
7000 Auxiliary Operations 2.3 .5 3.3 3.5 13.9 23.4
7010 Contract Education 10.2 7.8 7.1 23.8 11.4 106.4 166.6
7090 Other Auxiliary Operations 6.0 4.0 .1 36.9 13.3 165.8 226.0
7100 Physical Property and Related Acquisitions
12.0 28.7 27.8 67.3 135.8
Statewide Total 1,934.4 2,917.0 617.3 1,446.7 1,951.8 20,705.4 29,572.6
Note: Work assignments are reported by the district in data element (EJ01) Employee-Assignment-Type, (EJ03) Employee-Assignment-Account-Code and (EJ08) Employee-Assignment-FTE. All work assignments for each employee category are represented.
Data Element Definitions: California Community Colleges Management Information System Data Element Dictionary
All Districts Reporting
Data Source: CCCCO MIS Database for the reporting period Fall Term 2010 Page 103 of 104
June 30, 2011

California Community Colleges Chancellor's OfficeReport on Staffing for Fall 2010
Appendix: Employee Category Specifications The data elements used in the employee category specifications are from the California Community Colleges Management Information System Data Element Dictionary. The EB elements are from the Employee Demographic data elements and the EJ elements are from the Employee Assignment data elements.
Employee Category EB07
(EEO6) EB08
(Classification
EJ01 (Assignment
Type)
EJ08 (FTE)
Educational Administrator 1 A
Tenured/Tenure Track 2 C,R Begins with
A,C,N,I
Academic Temporary 2 T Begins with
A,C,N,I
Classified Administrator 1 P
4,5,6,7,8 P Begins with
A
The sum of the FTE for the “A” assignment is greater than sum of the FTE for other assignment types
Classified Professional 3 P
Classified Support 4,5,6,7,8 P Begins with
S or I
The sum of the FTE for the “S” or “I” assignment is greater than sum of the FTE for other assignment types
Data Element Definitions: California Community Colleges Management Information System Data Element Dictionary
All Districts Reporting
Data Source: CCCCO MIS Database for the reporting period Fall Term 2010 Page 104 of 104
June 30, 2011