california air resources board california environmental ... · pdf file5/18/2014 1 california...
TRANSCRIPT

5/18/2014
1
California Air Resources Board
California Environmental Protection Agency
Coastal Hearing Room
Monday, May 19, 2014
1
2014 LCFS Advisory Panel
Welcome and Introductions
2

5/18/2014
2
Today’s Schedule
Welcome
Introductions
Purpose of Advisory Panel
Review of Today’s Schedule
Bagley-Keene Overview
Review of Panel Charter
LCFS Basics
Program Status, Progress Towards Targets
Fuel Availability and Compliance Schedule
3
Today’s Schedule (cont.)
Advances in Life Cycle Analysis
Economic Analysis
Environmental Analysis
Harmonization
Additional Topics (if necessary)
Public Comments
Closing Remarks
4

5/18/2014
3
Today’s Schedule
Welcome
Introductions
Purpose of Advisory Panel
Review of Today’s Schedule
Bagley-Keene Overview
Review of Panel Charter
LCFS Basics
Program Status, Progress Towards Targets
Fuel Availability and Compliance Schedule
5
Bagley-Keene Public Meetings
The work of the Advisory Panel must be
conducted in public
Your work is to discuss, deliberate, and
recommend regarding 13 topics
Do that work in public if a quorum involved
6 6

5/18/2014
4
Email distribution
If email likely to reach a quorum, avoid
working on the 13 topics
To distribute something that is likely to reach
a quorum, ask ARB to distribute and post
7
Your Emails May be Public Records
Correspondence between Panel members
about Panel business
Correspondence from others commenting on
the work of the Panel
8

5/18/2014
5
Today’s Schedule
Welcome
Introductions
Purpose of Advisory Panel
Review of Today’s Schedule
Bagley-Keene Overview
Review of Panel Charter
LCFS Basics
Program Status, Progress Towards Targets
Fuel Availability and Compliance Schedule
9
Review of Panel Charter
Advisory Panel is a regulatory requirement
Executive Officer to conduct two reviews
Required to convene an Advisory Panel
Reviews will address a broad range of topics
May include recommended amendments
Reviews to the Board by January 1, 2012, and
January 1, 2015
10
5/18/2014
6
Review of Panel Charter
Scope of Review
Generally higher level
Not duplicate effort of workgroups
Between scheduled meetings, work performed by less than 20 Panel members may be submitted for posting
11
Review of Panel Charter
Panel Composition
Government Agencies
Fuels Industry
Academia
Environmental Groups
Others
12

5/18/2014
7
Review of Panel Charter
Role of Chair and Co-Chair
Ensure discussion remains focused
Clarify points of discussion as needed
Disseminate meeting summaries
Provide Panel report to the Board
13
Review of Panel Charter
Role of Panel Members
Attend each meeting and prepare in advance
Stay focused on the specific review areas
Comment constructively, specifically, and in good
faith
Provide ARB staff with research and documentation
as needed
Conduct activities in compliance with the
requirements of Bagley-Keene
14

5/18/2014
8
Review of Panel Charter
Code of Conduct
Place name card on end to be
recognized to make a comment
No substitutes for Panel members’
absence from a scheduled meeting
Treat Panel members and discussions
with professional courtesy and
disclosure etiquette
15
Public Comments
Identification cards are available
Form queue next to podium
16

5/18/2014
9
Today’s Schedule
Welcome
Introductions
Purpose of Advisory Panel
Review of Today’s Schedule
Bagley-Keene Overview
Review of Panel Charter
LCFS Basics
Program Status, Progress Towards Targets
Fuel Availability and Compliance Schedule
17
LCFS Key Objectives
Reduce greenhouse gas emissions
(~15 MMT in-state in 2020)
Reduce carbon intensity of transportation
fuel pool by 10% by 2020
Help achieve AB 32 objective of reducing
GHG emissions to 1990 levels by 2020
Transform and diversify fuel pool
Reduce petroleum dependency
18

5/18/2014
10
Basic LCFS Requirements
Sets annual carbon intensity standards for
gasoline, diesel, and the fuels that replace
them
Carbon intensity (CI) is the measure of GHG
emissions associated with producing and
consuming a fuel (gCO2e/MJ)
LCFS is fuel-neutral and market-based
CI based on complete life cycle analysis
19
Fuel Lifecycle – CARBOB
73 g/MJ
Vehicle
CARBOB
99 g/MJ
Transportation
11
g/MJ
Oil Well
1
g/MJ
13 g/MJ
Refinery
1 g/MJ
Distribution
20

5/18/2014
11
Fuel Life Cycle – Corn Ethanol
Corn Ethanol
73-121 g/MJ
Vehicles
Emissions
are Offset
Corn Field
36
g/MJ
2
g/MJ
Transportation
30
g/MJ
Co-products
3
g/MJ
Blend with
CARBOB
Bio-Refinery
14-62
g/MJ
- 12 g/MJ
Transportation
Land Use
Change
21
Regulated Parties of the LCFS
Providers in California of most petroleum and biofuels
are “regulated parties” under the LCFS
Providers of clean fuels that already meet 2020 target
are exempt but can “opt in” to program and earn credits
Electricity
Hydrogen
Natural gas & biogas
Generated credits can be bought and sold by regulated
parties
22

5/18/2014
12
LCFS Accounting System Straightforward
Fuels above standard generate deficits
Fuels below standard generate credits
23
Carbon Intensities of Some Fuels
Gasoline 99 gCO2e/MJ
Diesel 98 gCO2e/MJ
Corn Ethanol 73 – 121 gCO2e/MJ
Sugarcane Ethanol 58 – 73 gCO2e/MJ
Biodiesel 4 – 83 gCO2e/MJ
Methane -15 – 83 gCO2e/MJ
Electricity 31 – 37 gCO2e/MJ
24

5/18/2014
13
Today’s Schedule
Welcome
Introductions
Purpose of Advisory Panel
Review of Today’s Schedule
Bagley-Keene Overview
Review of Panel Charter
LCFS Basics
Program Status, Progress Towards Targets
Fuel Availability and Compliance Schedule
25
LCFS Update • Continuous activities
− Approving fuel pathways
− Registering biofuel production facilities
− Calculating crude oil carbon intensities
− Making changes to LCFS Reporting Tool
• Specific activities
− Conducting environmental and economic analyses
− Updating indirect land use change values
• Lawsuits
26

5/18/2014
14
Lawsuits
• Federal: 9th Circuit Court of Appeals
− Left LCFS in place
− Ethanol and crude oil provisions not facially
discriminatory
− Remanded the case to the district court for additional
determinations
• State: 5th District Court of Appeal
− Left LCFS in place
− Found issues with CEQA and APA
− ARB will propose for adoption an alternative diesel fuel
regulation and re-adoption of the LCFS in fall 2014
27
2014 LCFS Proposed Amendments
Had planned to propose amendments to Board
in October 2013 and again in 2014
Per Board’s direction on many amendments
For clarity and enhancement of the regulation
To be responsive to stakeholder feedback
28

5/18/2014
15
2014 LCFS Proposed Amendments (cont.) Staff to propose revisions already identified and
workshopped last year
Cost containment mechanism
Revised indirect land use (iLUC) values
Electricity credits for mass transit and electric forklifts
Low-energy-use refineries provision
Innovative technologies for crude oil production
Additional fuel pathways (~140)
Miscellaneous revisions for clarity and enhancement
Staff sees this as an opportunity to strengthen LCFS,
given three years of implementation
29
Additional Concepts Under Discussion
Refinery-specific crude oil incremental deficit
accounting
Fuel pathways and producer facility registration
GHG emissions reductions at refineries as
additional compliance pathway
Scoping Plan Update: Continue to reduce CIs to
help meet ongoing emission reduction targets
30

5/18/2014
16
2014 LCFS Timeline
March 2014: Initial public workshop to discuss LCFS framework
for 2014 and Indirect Land Use Analysis
April 4th, 2014: Workshop to discuss Fuel Pathways, Producer
Facility Registration, and Cost Containment
April 18th, 2014: Workshop to discuss Refinery and Crude Oil
Provisions and Reporting and Enforcement Provisions
Other workshops will follow, both topic-specific and general
LCFS overview
Board update in the summer
Board hearing in the fall
31
Progress Towards Targets
.
0
200000
400000
600000
800000
1000000
1200000
Q1 2011 Q2 Q3 Q4 Q1 2012 Q2 Q3 Q4 Q1 2013 Q2 Q3 Q4
Fig. 1. Total Credits and Deficits (All Fuels) Reported, Q1 2011 -- Q4 2013
Credits
Deficits
32

5/18/2014
17
Progress Towards Targets
33
0%
10%
20%
30%
40%
50%
60%
70%
80%
90%
100%
Q1 - Q4 2011 Q2 2011 - Q12012
Q3 2011 - Q22012
Q4 2011 - Q32012
Q1 - Q4 2012 Q2 2012 - Q12013
Q3 2012 - Q22013
Q4 2012 - Q32013
Q1 - Q4 2013
Fig 3. Credit Pecentage by Fuel Q1 2011 - Q4 2013
ETH(CI>90)
ETH(85<CI<90)
ETH(80<CI<85)
ETH(75<CI<80)
ETH(70<CI<75)
ETH(CI<70)
Natural Gas
Biodiesel
Renewable Diesel
Other
Larger portion of low CI ethanol
Continued contribution of alternative fuel (e.g., natural gas)
Non-ethanol fuels make up over 35 percent credits
Today’s Schedule
Welcome
Introductions
Purpose of Advisory Panel
Review of Today’s Schedule
Bagley-Keene Overview
Review of Panel Charter
LCFS Basics
Program Status, Progress Towards Targets
Fuel Availability and Compliance Schedule
34

5/18/2014
18
Fuel Availability
Present staff’s general methodology
Initiate discussion on each fuel
Growth potential/opportunities
Hurdles/barriers
ARB staff role today is to participate in
discussion
35
Fuel Availability - Methodology
Investigate:
Statewide, national, and global capacity of
fuel
Past and current production of fuel by
feedstock
Growth patterns for each feedstock and
fuel
Nascent fuels
Current fuels with limited growth potential
36

5/18/2014
19
Biodiesel
Soy – plentiful, revised ILUC?
Canola – limited growth potential
Waste grease/used cooking oil – limited
Corn oil – high growth potential, challenges
Tallow – limited growth potential
Other 37
Renewable Diesel
Global capacity = 800 to 900 MGY
Domestic capacity = 140+110 = 250 MGY
High growth potential
Feedstocks
Infrastructure to/in California
Labeling issue
38

5/18/2014
20
CNG/LNG
Fossil – plentiful
Renewable – high growth potential
Price is right
Challenges
Vehicle deployment – how many by when?
Biomethane access to pipelines
39
Ethanol
Corn/sorghum
Sugarcane
Cellulosic Domestic
Brazilian
Other Molasses
Crop-based feedstocks
40

5/18/2014
21
Electricity and Hydrogen
Used Advanced Clean Cars estimates
Hydrogen – very little by 2020
Electricity – may exceed ACC expectations
High gasoline prices
Customer preference
41
Renewable Gasoline
First plant due to produce in 2015
Nameplate capacity is 10 MGY
Plans to build additional plants
42

5/18/2014
22
Fuel Availability - Discussion
Diesel standard
Availability of low-CI alternatives bright
Infrastructure and vehicles may limit
volumes
Gasoline standard
Lower-CI ethanol becoming available
Alt-fuel LDVs are essential
More challenging than diesel standard
43
Compliance Schedule
LCFS CI reduction standards frozen at
1.0% for 2014 and 2015
Opportunity to deposit additional
credits in the “bank”
Post-2015 compliance curves based on
fuel availability and banked credits
Compliance curves will include some
market push
44

5/18/2014
23
Today’s Schedule (cont.)
Advances in Life Cycle Analysis
Economic Analysis
Environmental Analysis
Harmonization
Additional Topics (if necessary)
Public Comments
Closing Remarks
45
Advances in Life Cycle Analysis
The main advance in life cycle analysis we
are contemplating is to update CA-GREET
Two primary advantages
Updated life cycle inventory data
Ability to build a greater variety of fuel pathways
We are basing this update on Argonne
National Lab’s GREET 2013
46

5/18/2014
24
Advances in Life Cycle Analysis
An advance in the LCFS (if not LCA) is the
nascent fuel diversification underway
In the first few years, most pathways were for
corn and sorghum ethanol.
We’re now seeing
Renewable diesel (13 pathways)
Biodiesel (9 pathways)
Biomethane (15 pathways; others in our ‘pipeline’)
Molasses (4 pathways)
Cellulosic ethanol (in the pipeline)
47
Advances in Life Cycle Analysis
We’re also seeing starch ethanol producers
switching to lower-CI process energy
sources
Biomethane
Anaerobic digestion
Landfill gas
Wood waste (municipal solid and green waste)
They are also beginning to convert some of
the cellulose in the kernel to ethanol
48

5/18/2014
25
Today’s Agenda (cont.)
Advances in Life Cycle Analysis
Economic Analysis
Environmental Analysis
Harmonization
Additional Topics (if necessary)
Public Comments
Closing Remarks
49
LCFS Economic Analysis
Updated economic analysis comprised of
two sections:
Supply Analysis
Models market response to LCFS to forecast
low-CI fuel supplies
Estimates cost to produce those fuels
Economic Impacts Analysis
Quantifies and analyzes the costs and/or
cost-savings of the LCFS
Uses a macro-economic model
50

5/18/2014
26
Supply Analysis
Model simulates California transportation fuel market’s response to the incentive structure of the LCFS Transportation energy demand: How many MJ do we
need each year to propel the California vehicle fleet?
Supply of low-CI fuels: How much of any given low-CI fuel can be produced in a given year?
Cost of Production: How much do these fuels cost to produce?
Cost of production and maximum feasible volume producible within a given year will form foundation of supply curves
51
Transportation Energy Demand
Data sources
California Energy Commission’s Integrated
Energy Policy Report
California Bureau of Equalization’s Historic
Gasoline and Diesel Sales
U.S. Energy Information Agency’s Annual
Energy Outlook
52

5/18/2014
27
Supply of Low-CI Fuels
Project supply of low-CI fuels available each year
Build cost curves that reflect cost to produce and supply low-CI fuels to California
Infer demand for low-CI fuels based on the LCFS compliance schedule
Use model to:
Simulate market response to increased demand for low-CI fuels and resultant increases produced and supplied
Methodology accounts for LCFS incentives that spur innovation and decrease the costs over time
53
Cost of Production
The components of production costs:
Experience curves in model simulate
downward pressures on costs of production
over time (learning by doing, economies of
scale, etc.)
o Capital costs
o Feedstock costs
o Enzymes and chemicals
o O&M
o Utilities
o Co-production credit
o Storage, transportation,
and distribution
o Taxes and incentives
o Fuel dispensing and
infrastructure
54
5/18/2014
28
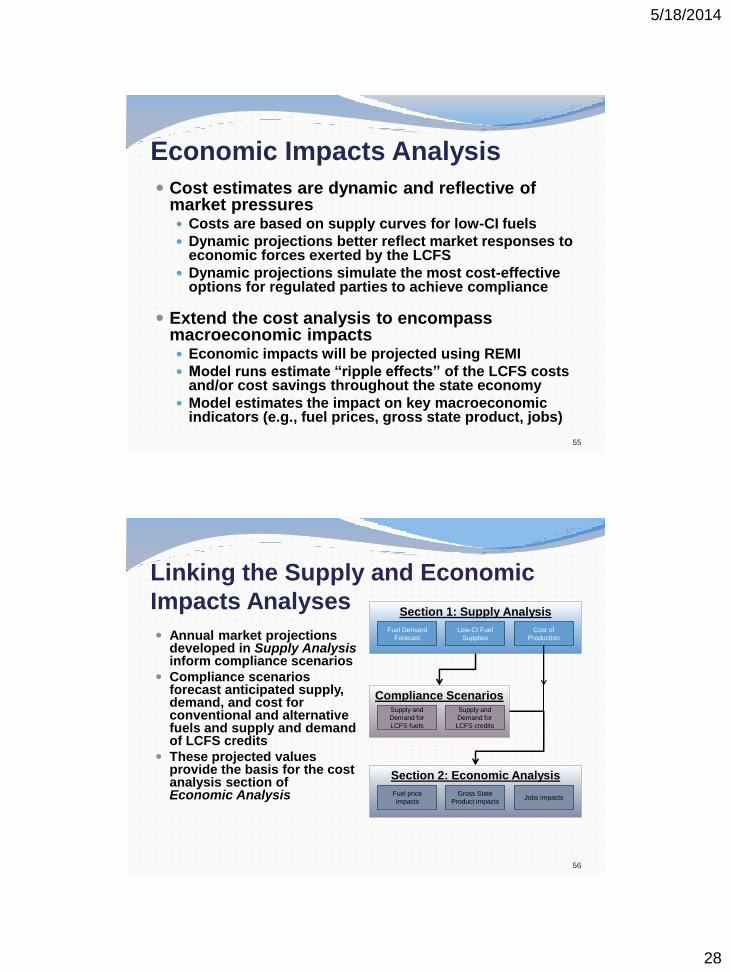
Economic Impacts Analysis
Cost estimates are dynamic and reflective of market pressures Costs are based on supply curves for low-CI fuels
Dynamic projections better reflect market responses to economic forces exerted by the LCFS
Dynamic projections simulate the most cost-effective options for regulated parties to achieve compliance
Extend the cost analysis to encompass macroeconomic impacts Economic impacts will be projected using REMI
Model runs estimate “ripple effects” of the LCFS costs and/or cost savings throughout the state economy
Model estimates the impact on key macroeconomic indicators (e.g., fuel prices, gross state product, jobs)
55
Linking the Supply and Economic
Impacts Analyses
Annual market projections developed in Supply Analysis inform compliance scenarios
Compliance scenarios forecast anticipated supply, demand, and cost for conventional and alternative fuels and supply and demand of LCFS credits
These projected values provide the basis for the cost analysis section of Economic Analysis
Section 1: Supply Analysis
Fuel Demand
Forecast
Low-CI Fuel
Supplies
Cost of
Production
Compliance Scenarios
Supply and
Demand for
LCFS fuels
Supply and
Demand for
LCFS credits
Section 2: Economic Analysis
(REMI)
Fuel price
impacts
Gross State
Product impacts Jobs impacts
56

5/18/2014
29
Macroeconomic Model
REMI is a Computable General Equilibrium
(CGE) model of the California economy
LCFS is modeled as a disruption to various
market equilibria in place throughout the
economy
REMI provides estimates of how economy
will react to the LCFS and models any
resultant changes (e.g., fuel prices, gross
state product, and jobs)
57
Today’s Schedule (cont.)
Advances in Life Cycle Analysis
Economic Analysis
Environmental Analysis
Harmonization
Additional Topics (if necessary)
Public Comments
Closing Remarks
58

5/18/2014
30
Summary of the
2009 Environmental Analysis
Significant GHG reductions due to production
and use of lower CI fuels
Potential reductions due to changes in
vehicle fleet composition
Estimate reduction of 16 MMTCO2e from fuel
combustion
Estimate reduction of 23 MMTCO2e from full
fuel life cycle
59
Summary of the
2009 Environmental Analysis
Estimated 2020 Biofuel Production Facilities
6 corn ethanol facilities
18 cellulosic ethanol facilities
6 biodiesel facilities
No change in emissions from petroleum
refineries, power plants, or existing corn
ethanol facilities over baseline emissions
60

5/18/2014
31
Summary of the
2009 Environmental Analysis
Criteria pollutant emissions related to truck
trips associated with delivery of feedstock
and finished fuel
Emissions offset by using newer trucks as
prescribed by other State and federal
regulations (such as LEV and CAFÉ
standards)
Health risk analysis performed to assess
localized impacts
61
Environmental Analysis for Re-Adoption
• Estimate of 2020 biofuel production facilities
in California will be reassessed
• CEQA review will include:
Methods of Compliance
Beneficial Impacts & Adverse Impacts
Mitigation Measures & Alternatives
• CEQA Checklist used to identify and evaluate
potential impacts to the environmental
62

5/18/2014
32
Today’s Schedule (cont.)
Advances in Life Cycle Analysis
Economic Analysis
Environmental Analysis
Harmonization
Additional Topics (if necessary)
Public Comments
Closing Remarks
63
Pacific Coast Collaborative (PCC)
Signed by California, Oregon, Washington, and
British Columbia
Oregon and Washington will adopt low-carbon
fuels standards
California and British Columbia will maintain
their existing standards
Over time, build an integrated West Coast market
for low-carbon fuels
64

5/18/2014
33
PCC Activities
Shared LCFS Reporting Tool with British
Columbia and Oregon
Scheduled routine conference calls with
Washington staff
Period conference calls with all PCC members
Have met a couple of times to discuss LCFS
programs
65
Today’s Schedule (cont.)
Advances in Life Cycle Analysis
Economic Analysis
Environmental Analysis
Harmonization
Additional Topics (if necessary)
Public Comments
Closing Remarks
66

5/18/2014
34
Today’s Schedule (cont.)
Advances in Life Cycle Analysis
Economic Analysis
Environmental Analysis
Harmonization
Additional Topics (if necessary)
Public Comments
Closing Remarks
67
Today’s Schedule (cont.)
Advances in Life Cycle Analysis
Economic Analysis
Environmental Analysis
Harmonization
Additional Topics (if necessary)
Public Comments
Closing Remarks
68

5/18/2014
35
http://www.arb.ca.gov/fuels/lcfs/lcfs.htm
69