calculation of evapotranspiration using color-infrared ... · pdf filecalculation of...
TRANSCRIPT
Calculation of Evapotranspiration
Using Color-Infrared Photography
GEOLOGICAL SURVEY PROFESSIONAL PAPER 655-0
Work done in cooperation with the National Aeronautics and Space Administration

Calculation of Evapotranspiration
Using Color-Infrared Photography
By JOHN EDWIN JONES
GILA RIVER PHREATOPHYTE PROJECT
GEOLOGICAL SURVEY PROFESSIONAL PAPER 655-0
Work done in cooperation with the National Aeronautics and Space Administration
UNITED STATES GOVERNMENT PRINTING OFFICE, WASHINGTON : 1977
UNITED STATES DEPARTMENT OF THE INTERIOR
CECIL D. ANDRUS, Secretary
GEOLOGICAL SURVEY
V. E. McKelvey, Director
First printing 1977
Second printing 1978
Library of Congress Cataloging in Publication Data
Jones, John Edwin, 1940-Calculation of evapotranspiration using color-infrared photography.
(Gila River phreatophyte project) (Geological Survey Professional Paper 655-O)Bibliography: p. O44-O45.Supt. of Docs. No.: I 19.16:655-01. Evapotranspiration-Measurement. 2. Evapotranspiration-Remote sensing. 3. Photography, Infrared. 4. Aerial
photography in botany. I. United States. National Aeronautics and Space Administration. II. Title. III. Series.IV. Series: United States Geological Survey Professional Paper 655-O.
QE75.P9 no. 655-O [QK873] 557.3'08s [551.5'72'028] 76-608355
For sale by the Superintendent of Documents, U.S. Government Printing OfficeWashington, D.C. 20402
Stock Number 024-001-02985-5
CONTENTS
PageSymbols ________________._______________ IVGlossary of terms _ ___ __ ___ __ _ __ __ _ ___ ___ VAbstract _________________________.______ OlIntroduction _____________________________ 1
Purpose and scope of the investigation ___ _ ___ ___ 1Location and extent of the study areas ____ _ _ ___ 2Acknowledgments ______________________ 2Aerial photography _____________________ 2Vegetation ____________________________ 3
Color-infrared photography as a tool for vegetation analysis _ 4Color-infrared film ______ _____________ 4Leaf and canopy reflectance _ _ __ __ __ _ _ ___ 5Visual analysis_________________________ 6
Data collection ____________________________ 7Photographic data collection__________________ 7Hydrologic data collection___________________ 10Vegetation data collection________________ 10
Identification and measurement of vegetation parameters __ 10Evapotranspiration _____________________ 10Depth to water-soil moisture ________ ______ 18Vegetation ______________________________ 19
Signature discrimination _______ ______ 19Time-independent signature ____ ______ 21Time-dependent signature__________________ 24
Identification and measurement of vegetation parameters Continued
Vegetation ContinuedSignature discrimination Continued
Spatial computer analysis_______ O26 Volume of canopy foliage ___ __ 28 Foliar cover ______________________ 31
Techniques for analysis of color-infrared photography ____ 33 Cost of photographic analysis _____________ 35Basic photographic concepts 35
Spectral sensitivity ___ _________ _______ 35Film density versus exposure ______________ 35
Base plus fog density ____ __ 35 Gamma ____________________ 35
Data standardization and sources of variability ______ 35 Analytic optical density._______________ 36 Film-type correction __________________ 36Flight-altitude correction ___ __ 38 Filter correction ___________ _______ 38Solar angle correction__________________ 40Standard correction____ __ 40Statistical analysis of variables __________ 42
Summary ____________________________ 42References cited __________________________ 44
ILLUSTRATIONS
FIGURE 1. Map of study area ______________ _________ _________ _________ _________________ O32. Graph showing spectral sensitivity versus wavelength for the three dye layers of color-infrared film ____ 43. Diagram showing color formation on color-infrared film and its relation to plant reflectance _____ 54. Graph showing analytic optical density versus log exposure for three dye layers of color-infrared film _ _____ 65. Graph showing average leaf reflectance and absorption as a function of wavelength_____________ 76. Photographs showing vegetation in the Gila River flood plain _______________________________- 8
7-23. Graphs showing:7. Transmittance versus wavelength for the densitometer filters used in film analysis ___________ 98. General percentages of irradiance for different earth-surface characteristics __ ___ _ _ _ 119. Remote sensing and water-budget values of evapotranspiration versus time, Gila River Phreatophyte Project
area _______________________________________________________ 1310. Regression relations between measured remote sensing and water-budget values of evapotranspiration,
reaches 1 and 2, 1968, Gila River Phreatophyte Project ________________________ 1411. Monthly consumptive-use coefficients for areas of indicated percent of foliar cover of phreatophytes, and
average monthly consumptive-use factor _________ ______________________ 1512. Monthly consumptive-use coefficient versus relative near-infrared irradiance ____________ 1613. Consumptive use of water and modified relative near-infrared irradiance versus time for grain sorghum
during 1968 growing season __________________________-__________ 1714. Regression relation between consumptive use of water and modified relative near-infrared irradiance for grain
sorghum during the 1968 growing season ________________________________ 1715. Depth to water versus relative near-infrared irradiance, reach 2 of the Gila River Phreatophyte Project _ 1816. Relative near-infrared irradiance, relative red irradiance, evaporation, and water in the capillary zone for a
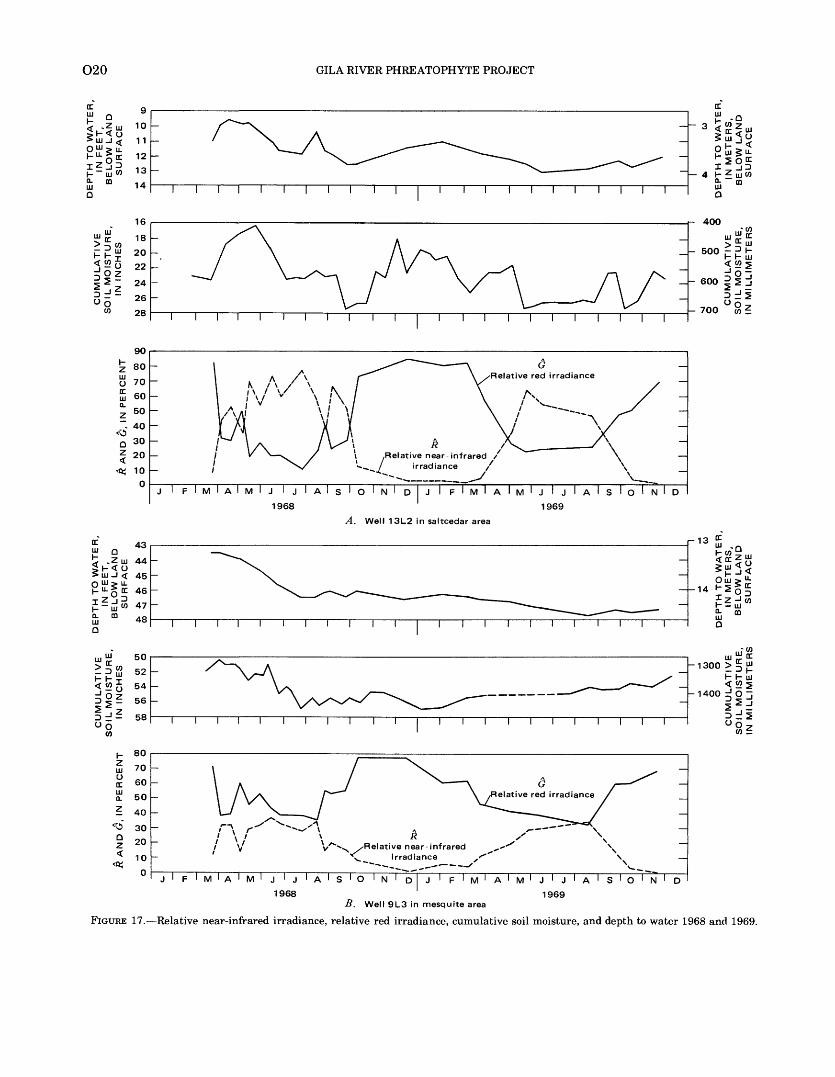
dense 40-acre (16-ha) saltcedar site, 1968 _____________-___________________ 1917. Relative near-infrared irradiance, relative red irradiance, cumulative soil moisture, and depth to water, 1968
and 1969 ________________________________________________________ 2018. Regression relations between relative near-infrared irradiance and relative red irradiance among vegetation
types in and adjacent to the Gila River Phreatophyte Project, 1968 and 1969 ________________ 22ill
IV CONTENTS
FIGURES 7-23. Graphs showing Continued Pase19. Regression relations between relative near-infrared irradiance and relative red irradiance among vege tation
types in and adjacent to the Cibecue Ridge area, summer 1971 _____________________ .-- O2320. Relative near-infrared irradiance versus relative red irradiance for five vegetation types in and adjacent to the
Gila River Phreatophyte Project, summer 1968 and 1969 _______________________________ 2421. Relative near-infrared irradiance, relative red irradiance, and model curves, reach 2 of the Gila River
Phreatophyte Project, 1968 and 1969 ________________________________________ 2522. Regression relation between relative near-infrared irradiance determined from film and from a time-
dependent model equation, reach 2 of the Gila River Phreatophyte Project, 1968-69 ________ 2623. Relative near-infrared irradiance and relative red irradiance versus time for five vegetation types in and
adjacent to the Gila River Phreatophyte Project area, 1968 and 1969 _______________________ 2724. Diagram showing computer printout codes used in spatial analysis of relative near-infrared, relative red, and relative
green irradiance ___________________________________________________ 2825. Color-infrared mosiac showing spatial computer analysis by spectral signature for 3.67-acre (1.49-ha) plots in reach 2,
Gila River Phreatophyte Project, June 27, 1968 ______________________________________ 29 26-33. Graphs showing:
26. Volume of canopy foliage versus relative near-infrared irradiance for photographic flights during 1968, reach2, Gila River Phreatophyte Project _____________________________________________ 30
27. Relative near-infrared irradiance versus time for three saltcedar volumes of canopy foliage classes, reach 2,Gila River Phreatophyte Project ___________________________________________ 31
28. Relative near-infrared irradiance versus time for three mesquite volumes of canopy foliage classes, reach 2,Gila River Phreatophyte Project ___________________________________________ 32
29. Foliar cover versus relative near-infrared irradiance for 50 3.67-acre (1.49-ha) plots, subreach 2b, Gila RiverPhreatophyte Project ________________________________________________ 33
30. Adjusted and unadjusted relative near-infrared irradiance, subreach 2b of the Gila River Phreatophyte Proj ect, 1967-71_________________________________________________________ 34
31. Major versus the two minor optical densities for the three dye layers of film type 8443 ______ _____ 3732. Filter transmittance versus wavelength for the standard filter pack used in aerial photography in the study
areas ______________________________________________________________________ 3933. Relative near-infrared irradiance and relative red irradiance versus time of day for bare ground and dense
saltcedar ____________________________________________________________ 41
TABLES
TABLE 1. Time-independent analysis using color-infrared film for vegetation in the Gila River Phreatophyte Project and adjoin ing areas _____________________________________________________________ O21
2. Time-independent analysis using color-infrared film for vegetation in the Cibecue Ridge area and adjacent areas __ 233. Atmospheric transmittance at different flight altitudes for the peak wavelengths of dye-layer sensitivity of color-
infrared film___________________________________________________________ 384. Atmospheric transmittance for the peak sensitivity of dye layers of color-infrared film at summer and winter solst : ce _ 405. Statistical index of variables in equations used in this report _________________________________ 43
SYMBOLS
A Altitude correction factor(A) Matrix A(A'1 ) The inversion of matrix AAOD Analytic optical densitya Subscript data from an evergreen species of saltcedar
(Tamarix aphylla)at Subscript analytic transmittance B Integral optical density blue color B Relative green irradiance, in percent C Analytic optical density cyan dye layer d Calendar-year day, January 1, 6 = 1; December 31, 6=365 or
366 (leap year)c Subscript cyan dye layer CI Foliar cover, in percent D0 Base plus fog density
D Calendar-year day for the end of dormancy, determined by the low relative near-infrared irradiance
D' Calendar-year day for the end of dormancy, determined by the high relative red irradiance
E Exposure, defined as E=(I) (t)6 Evaporation from bare groundE(y) Energy in ergs/cm2.END Equivalent neutral densityET Evapotranspiration, measurement based on water or energy ^ budget data
ET Evapotranspiration, estimated by relative near-infrared ir radiance
exp Exponential function of, as in exp (r) for e?F Filter correction factorf" F test (statistical test)
CONTENTS V
f Monthly consumptive-use factor, defined asf=-
G G G'
H
H'
A/t A/I! AA2 7;IOD Jk k'
L
L'
In M m m
N
N'
nODodPP'
Pq R £R'
r r SD
100Integral optical density green colorRelative red irradiance, in percentValue of the model curve for relative red irradianceAmplitude of the sine waves, for relative near-infrared ir
radianceAmplitude of the sine wave, for relative red irradianceDifference in altitudeCamera altitudeGround surface elevationIlluminationModified relative near-infrared irradiance, in percentIntegral optical densityBridge correction factorMonthly empirical consumptive-use coefficientMonthly empirical consumptive-use coefficient, defined as
being independent of soil evaporationDuration, in days for the period of plant vigor, determined by
the change in relative near-infrared irradianceDuration, in days, for the period of plant vigor, determined by
the change in relative red irradianceNatural logarithmAnalytic optical density magenta dye layerSubscript magenta dye layerSubscript month
Function of time, defined as AT=|(C D) Yl
Function of time, defined as N' = \(C-D') (
Number of samplesOptical densitySubscript optical densityMean relative near-infrared irradiance during dormancyMean relative red irradiance during dormancyPercent of daylight hours in the monthSubscript bridge reading for any photographic missionIntegral optical density red colorRelative near-infrared irradiance, in percentValue of the model curve for relative near-infrared irradianceCoefficient of correlationSubscript re achStandard deviation
s Subscript standard bridge reading (June 27, 1968, photog raphy)
sec Secant (of)sin Sine (of)Sv .x Standard error of estimate; the standard deviation of residuals
from a regression lineS(A) Spectral sensitivity, defined as S(\)=1/B(X)T TransmittanceT' Atmospheric transmittance of radiation at a particular
wavelength, through the total atmosphere or between th^ ground surface elevation and the camera altitude
f" Transpirationt Mean monthly temperature, in degrees Fahrenheit1 Timet' Student t testu Monthly evapotranspiration, in inchesv Subscript This subscript indicates that the relative ir
radiance data (R, G, or £) was from a nonstandard flight altitude or filter combination and that the data are corrected to standard values by the equation
W Depth to water (table) level, in feetY Analytic optical density yellow dye layery Subscript yellow dye layery Subscript yearZ The Fisher Z transformationZ' The maximum and minimum values for Z
mined by the t' distributionZr The Fisher Z transformation of a functionZr~ l The inverse of the Fisher Z transformation of a functionAim Micrometersp Value of the null hypothesis2 Summation7 Extinction optical thickness<b Solar angle/ Function (of)[ ] Matrix notationy Gamma1 Subscript reach 12 Subscript reach 2 2a Subscript subreach 2a 2b Subscript subreach 2b 8443 Film type 8443 2443 Film type 2443
or Zp as deter-
GLOSSARY OF TERMS
Aerosol scattering coefficient. A coefficient of particulate scatteringin the atmosphere; particle size may approximate or exceed themean wavelength of light.
Analytic optical density. The optical density of the individual filmlayers of a multidye layer film.
Base plus fog density. Film density resulting from film base opticaldensity and chemical fog; the optical density resulting from anychange in exposure is greater than gross fog density.
Densitometer. A device used to measure the optical density of thedye deposit in a photographic image.
Equivalent neutral density. The visual density of dye layer that amultidye layer film would have if it were converted to a neutralgray by superimposing the minimum necessary amounts of dye inthe other dye layers.
Evapotranspiration. Water withdrawn from soil by evaporation andplant transpiration.
Exposure. The product of the illumination of a unit area of sensitive
material and the duration of time through which this illuminatior acts, in ergs/cm2 .
Extinction optical thickness. The mean value of the sum of the Rayleigh scattering coefficient, aerosol scattering coefficient, anc1 the ozone absorption coefficient.
Foliar cover. The amount of ground covered or shaded by a vertical projection of plant foliage; usually expressed in percent.
Gamma. Slope of the linear portion of the characteristic curve.Ground scene. Earth surface characteristics perceived both spa
tially and spectrally.Ground-truth data. Data obtained independent of a remote sensing
system that describes the object or phenomenon sensed by the sys tem.
Integral optical density. The total optical density of a multidye layer film.
Irradiance. A measure of radiant power per unit area that flow? across or into a surface. The specific definition of the term as used
VI CONTENTS
in this paper is denned as the energy recorded on the film. Addi tional clarification of this term is presented in the section "Purpose and Scope of the Investigation."
Light. The visible portion of the spectrum, located approximately between 0.40 and 0.70 micrometers.
Optical density. The negative logarithm to the base 10 of the trans- mittance. Optical density in a multidye layer film can be described in two ways, analytic optical density and integral optical density.
Ozone absorption coefficient. The coefficient of ozone absorption in the atmosphere.
Phreatophytes. A plant that habitually obtains its water supply from the zone of saturation (water table).
Radiance. The radiant flux per unit solid angle per unit of projected area of the source.
Rayleigh scattering coefficient. A coefficient of gaseous scattering in the atmosphere; the gaseous molecules (primarily nitrogen and oxygen) are smaller than the mean wavelength of light.
Reflectance. The ratio of the reflected to the incident radiation.Sensitivity. The reciprocal of exposure (ergs/cm2 ) to produce an
equivalent neutral density, usually of 1.0.Spectral signature. The spectral signature is traditional'7 defined as
the reflectance characteristics (curve of percent reflectance) that have been determined for an object. But, because of the nature of this study, the spectral signature will be defined in this report as the relationships between the relative irradiances (ft,Cr, and^) for a particular object. These relationsips are variable w^th time and changing conditions.
Step tablet. A strip of film or a glass plate whose optical density diminishes in incremental steps of density used to calibrate film density.
Transmittance. The ratio of the transmitted to the incident radia tion.
GILA RIVER PHREATOPHYTE PROJECT
CALCULATION OF EVAPOTRANSPIRATION USING COLOR-INFRARED PHOTOGRAPHY
By JOHN EDWIN JONES
ABSTRACT
In the 5-year period 1967-71, 38 color-infrared photographic missions were flown over the Gila River Phreatophyte Project in southeastern Arizona. Data from these missions were analyzed to determine the possibility of identifying and measuring vegetative parameters and their associated hydrologic variables by spectral analysis of the photography. During the summer of 1971, additional data from six color-infrared photographic missions flown over the Cibecue Ridge Watershed Study in central Arizona were used to test the validity of some of the techniques developed in this study.
The photographic missions were flown at altitudes between 1,500 and 60,000 feet (460 and 18,000 meters) above land surface during many different climatic conditions using a variety of cameras, films, and filter combinations.
A transmittance densitometer was used to obtain density readings in each of three primary colors of the positive transparencies. The irradiance (defined in this report as energy recorded on the film) sensed from the dye concentration in each of these primary colors was determined and related to the total energy sensed by the film, achieving three parameters of relative irradiance (near-infrared, red, and green) which were functionally related to spectral regions indicative of plant activity. These parameters were then corrected to a "standard photo flight" by adjusting the densitometric data for flight altitude, filter combination, film type, and a standard correc tion based on the spectral signature of a bridge located on the project.
Calculations of evapotranspiration based on remote sensing from 13 photographic missions flown during 1968 were related to water- budget measurements for a 1,700-acre (690-hectare) area cleared of vegetation and a 2,200-acre (890-hectare) phreatophyte-covered area of the Gila River flood plain.
The coefficients of correlation between the water-budget mea surements and the remote sensing calculations were 0.88 for the cleared area and 0.86 for the phreatophyte-covered area. Evapo transpiration calculated from seven photographic missions flown during 1968 over a spatially homogeneous grain sorghum field gave a coefficient of correlation of 0.93 when related to evapotranspiration computed by the Blaney-Criddle equation.
Spatial variability of vegetation on the flood plain was defined by the discrimination between eight different plant communities in cluding both deciduous and perennial species. A spectral evaluation of near-infrared versus red irradiance of these plant communities showed that for each community the standard error of the irradiance terms was less than 10 percent. Determining variations in the depth to ground water spectrally was not practical, although estimates of depths to water of less than 30 feet (9 meters) had a relatively small standard error of 5.4 feet (1.6 meters). Moisture content of the soil could not be determined spectrally either, but plants under stress from moisture deficiencies were detectable.
Temporal changes in vegetation were evaluated by computer meps showing the distribution of spectral signatures of the Gila River flood plain for each photographic mission flown. A mathematical model of the change of spectral signature with change in season for the flcod plain gave a coefficient of correlation of 0.98 between modeled and observed densitometric data. When an increase in volume of canopy for both mesquite and saltcedar was noted in the field, there was a corresponding increase of near-infrared irradiance, but the mea surement errors of both irradiance and canopy volume were very large. The pooled standard deviations of irradiance for all cancpy classes of mesquite and saltcedar were 7 percent and 14 percent, respectively. The pooled standard deviations of the 1968 irradiarce data for the largest canopy classes were 13 percent for mesquite and 12 percent for saltcedar. Foliar cover versus irradiance had a hi<rh coefficient of correlation, 0.85.
During this study it was determined that a color-infrared photo graphic mission and a computer analysis of the photographic data for the Gila River Phreatophyte Project area cost about a tenth of the amount of conventional species classification and canopy- measurement techniques.
A short discussion of the derived spectral equations and a table of 24 statistical parameters describing the spectral and hydrologic var iables is included.
INTRODUCTION
This report is the result of the study of color-infrared photography as a quantitative vegetative and hy drologic monitor in the Gila River Phreatophyte Proj ect area and the Cibecue Ridge area. The study is a part of the comprehensive Gila River Phreatophyte Project, which was undertaken by the U.S. Geological Survey to evaluate evapotranspiration from an analysis of all the significant components that compose the hydrologic system. The work was done under the general supervision of R. C. Culler, project chief.
PURPOSE AND SCOPE OF THE INVESTIGATION
The purpose of this investigation was to develop and evaluate color-infrared photographic methods and techniques as a remote sensing tool for the identifica tion and spacial measurement of vegetation cover, its condition, and temporal variability, and to functionally relate these measurements to quantitative estimates of hydrologic parameters, such as evapotranspiraticn,
Oi
O2 GILA RIVER PHREATOPHYTE PROJECT
depth to ground water, and soil moisture. Near- infrared photographic sensing involves the detection of the spectral radiance that is reflected from the photo graphed surface and is particularly well adapted to hy- drologic analysis. The sensitivity of two of the three dye layers of the film corresponds to ranges in wavelengths that can be used to measure plant status, and the photographic format lends itself to a visual evaluation of ground-truth data.
At this point clarification concerning the terminol ogy used in the paper is in order. The photographic data used was in general standardized to a specific flight altitude (8,500 feet or 2600 meters) above land surface using a "standard filter pack." The analysis in the paper was, therefore, based on the effect that ir- radiance had on the film as a result of radiance from a ground scene and atmospheric "stray light" being col lected and focused through the filters and lenses upon the film. This "at a distance" and "filtered" approach required the unconventional use of the word irradiance as a descriptor for the ground scene throughout the report to distinguish this data from data which are standardized to actual "ground-scene radiance" at sur face elevation. The term "irradiance" as used in this report is, therefore, defined as the energy recorded on the film. It includes the reflected solar energy, modified by the atmosphere, and stray light that reaches the film, exposes the film, and is processed as the energy recorded on the film. A more general definition of the term is given in the section "Glossary."
The author feels that the nature of the data in this report is such that if presented as "radiance" the reader might try to compare the results in this paper directly with other data which are actual "radiance," and this would yield spurious relationships.
LOCATION AND EXTENT OF THE STUDY AREAS
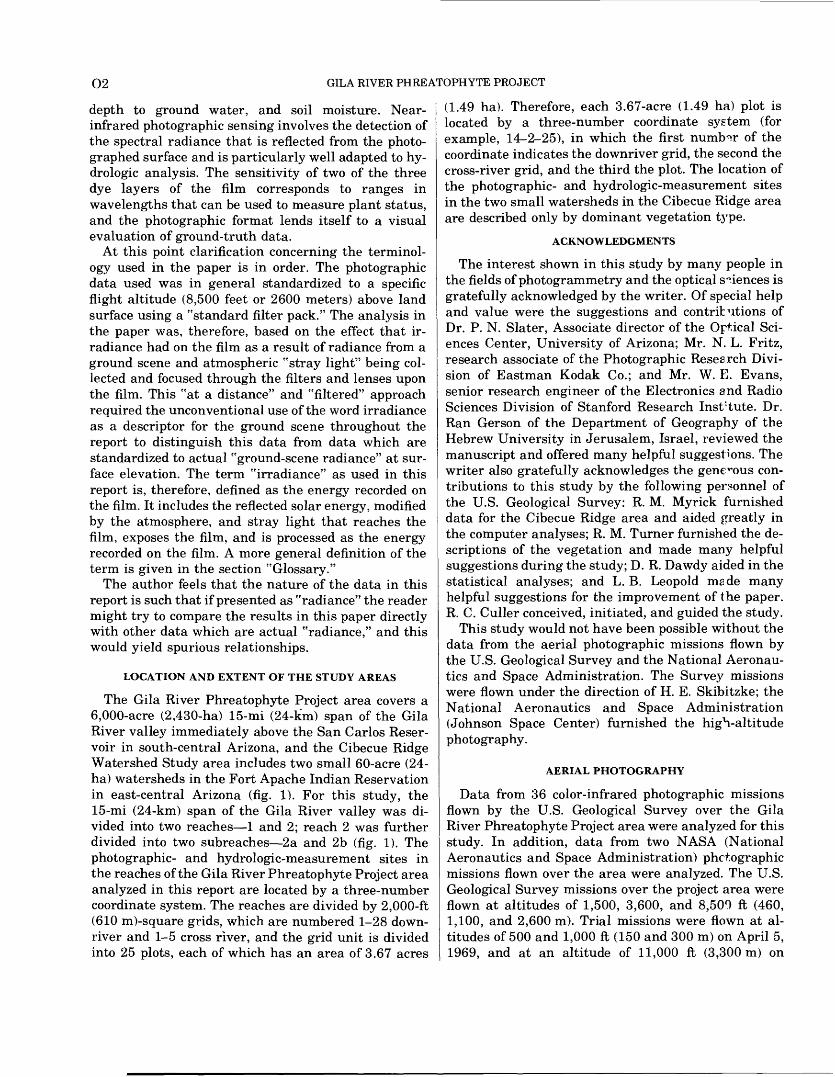
The Gila River Phreatophyte Project area covers a 6,000-acre (2,430-ha) 15-mi (24-km) span of the Gila River valley immediately above the San Carlos Reser voir in south-central Arizona, and the Cibecue Ridge Watershed Study area includes two small 60-acre (24- ha) watersheds in the Fort Apache Indian Reservation in east-central Arizona (fig. 1). For this study, the 15-mi (24-km) span of the Gila River valley was di vided into two reaches 1 and 2; reach 2 was further divided into two subreaches 2a and 2b (fig. 1). The photographic- and hydrologic-measurement sites in the reaches of the Gila River Phreatophyte Project area analyzed in this report are located by a three-number coordinate system. The reaches are divided by 2,000-ft (610 m)-square grids, which are numbered 1-28 down river and 1-5 cross river, and the grid unit is divided into 25 plots, each of which has an area of 3.67 acres
(1.49 ha). Therefore, each 3.67-acre (1.49 ha) plot is located by a three-number coordinate system (for example, 14-2-25), in which the first number of the coordinate indicates the downriver grid, the second the cross-river grid, and the third the plot. The location of the photographic- and hydrologic-measurement sites in the two small watersheds in the Cibecue Ridge area are described only by dominant vegetation type.
ACKNOWLEDGMENTS
The interest shown in this study by many people in the fields of photogrammetry and the optical sciences is gratefully acknowledged by the writer. Of special help and value were the suggestions and contributions of Dr. P. N. Slater, Associate director of the Optical Sci ences Center, University of Arizona; Mr. N. L. Fritz, research associate of the Photographic Research Divi sion of Eastman Kodak Co.; and Mr. W. E. Evans, senior research engineer of the Electronics and Radio Sciences Division of Stanford Research Inst'tute. Dr. Ran Gerson of the Department of Geography of the Hebrew University in Jerusalem, Israel, reviewed the manuscript and offered many helpful suggestions. The writer also gratefully acknowledges the generous con tributions to this study by the following personnel of the U.S. Geological Survey: R. M. Myrick furnished data for the Cibecue Ridge area and aided greatly in the computer analyses; R. M. Turner furnished the de scriptions of the vegetation and made many helpful suggestions during the study; D. R. Dawdy aided in the statistical analyses; and L. B. Leopold made many helpful suggestions for the improvement of the paper. R. C. Culler conceived, initiated, and guided the study.
This study would not have been possible without the data from the aerial photographic missions flown by the U.S. Geological Survey and the National Aeronau tics and Space Administration. The Survey missions were flown under the direction of H. E. Skibitzke; the National Aeronautics and Space Administration (Johnson Space Center) furnished the high-altitude photography.
AERIAL PHOTOGRAPHY
Data from 36 color-infrared photographic missions flown by the U.S. Geological Survey over the Gila River Phreatophyte Project area were analyzed for this study. In addition, data from two NASA (National Aeronautics and Space Administration) photographic missions flown over the area were analyzed. The U.S. Geological Survey missions over the project area were flown at altitudes of 1,500, 3,600, and 8,500 ft (460, 1,100, and 2,600 m). Trial missions were flown at al titudes of 500 and 1,000 ft (150 and 300 m) on April 5, 1969, and at an altitude of 11,000 ft (3,300m) on
CALCULATION OF EVAPOTRANSPIRATION USING COLOR-INFRARED PHOTOGRAPHY O3
EXPLANATION
Boundary of study area for reaches
o Location of study area
114 C 112 C 110C
.Peridot
50 100 MILES
SAN CARLOS RESERVOIR
0 50 100150 KILOMETERS INDEX
/ Gila River Phreatophyte / Project and adjacent areas
.Whitethorn site
Bare ground site
Grain sorghum field
Cultivated grass field
01 234567 8 KILOMETERS
FIGURE 1. Map of study area.
March 22, 1968; hourly missions from 9:00 a.m. to 3:00 p.m. were flown at an altitude of 3,600 ft (1,100 m) on May 31, 1968. The NASA missions were flown at an altitude of 60,000 ft (18,000 m) on September 30,1969, and September 11, 1970.
From July 21 to September 28, 1971, six missions were flown over the Cibecue Ridge area by the U.S. Geological Survey. The missions were flown at al titudes of 1,500 and 4,000 ft (460 and 1,200m). An analysis of the data obtained during these flights is included in this report.
Kodak Ektachrome Infrared Aero Film 8443 l was used in 1967-69; after 1969, Kodak Aerochrome In frared Film 2443 was used.
VEGETATION
In 1967 the Gila River flood plain was covered by a dense growth of phreatophytes mainly saltcedar (Tamarix pentandra). The vegetation in reach 1 was cleared before April 1967 as part of the comprehensive
'The use of name products in this report is for identification only and does not imply endorsement by the U.S. Geological Survey.
plan as outlined by Culler and others (1970, p. 3). Veg etation clearing in reach 2a was started in January 1969 and completed in December 1969, and clearing in reach 2b was started in November 1970 and completed in March 1971.
The terraces adjacent to the flood plain support small open forests of mesquite (Prosopis juliflora) and plant communities of xerophytes, such as creosote bush (Larrea tridentata), whitethorn (Acacia constricta), and various cacti. Interspersed within these plant com munities are small ephemeral plants that grow in re sponse to winter and summer rains; the species that respond to winter rains are different than the species that respond to summer rains (Shreve, 1964, p. 127- 142). Cultivated crops, such as tall wheat grass and grain sorghum, are grown adjacent to the project area. A small community of the evergreen species of saltcedar (Tamarix aphylla) is located in an adjacent area to reach 1 of the project area. An extensive de scription of the vegetation of this area was prepared by Turner (1973).
The main types of vegetation indigenous to the Cibecue Ridge area are juniper (Juniperus osteos-
04 GILA RIVER PHREATOPHYTE PROJECT
perma), pinyon pine (Pinus edulis), ponderosa pine (Pinus ponderosa), and native grasses. In 1967, one watershed was cleared of native trees and seeded with natural and exotic grasses.
COLOR-INFRARED PHOTOGRAPHY AS A TOOL FOR VEGETATION ANALYSIS
An economic method of obtaining frequent descrip tions of ground-surface conditions and changes, par ticularly that of vegetation, is needed for watershed management and hydrologic analyses, especially in large areas. Traditionally, black and white and color aerial photography have been used to inventory vege tation, but recent studies show that color-infrared pho tography generally is superior for species identifica tion, plant-vigor measurements, and vegetation map ping (Hunter and Bird, 1970, table 1).
COLOR-INFRARED FILM
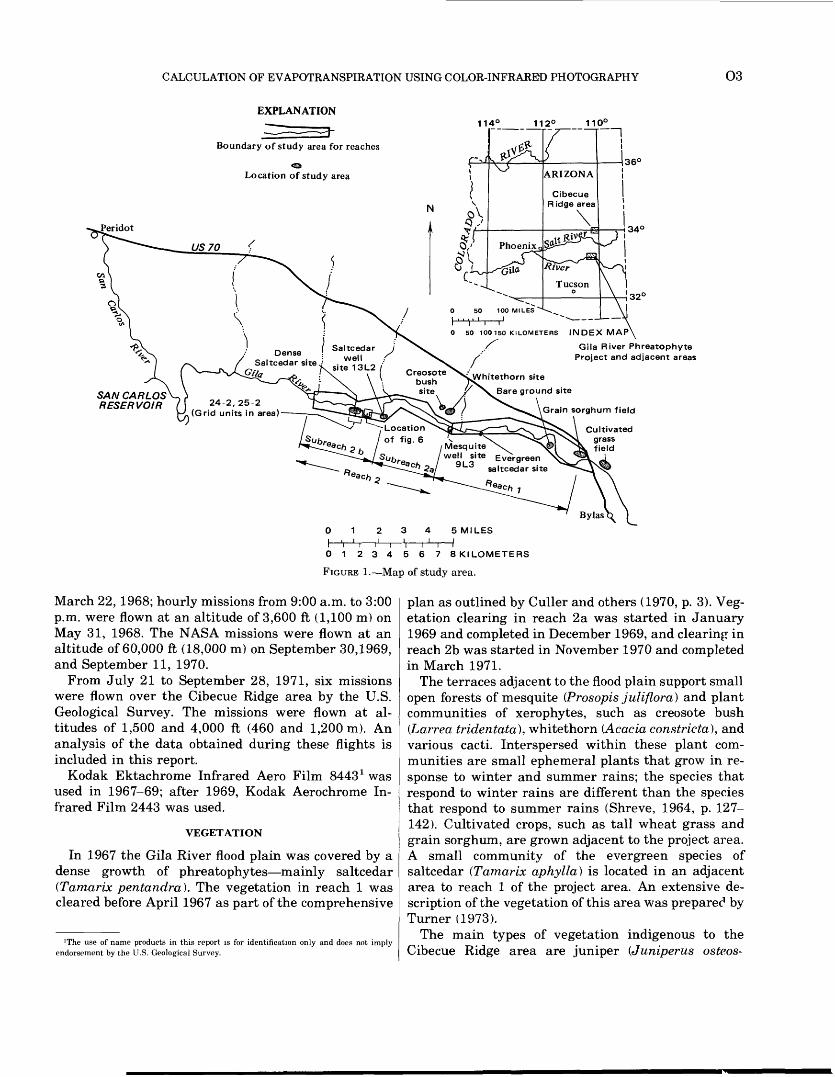
The advantage of color-infrared film for vegetation analysis is due to the high reflectivity of active vegeta tion in the 0.70-0.90 /am (micrometer) near-infrared wavelength range. The tripack color infrared film has three dye layers, cyan, magenta, and yellow, that mainly are sensitive to near-infrared (0.70-0.90 /am), red (0.60-0.70 /am), and green (0.50-0.60 /am) wavelength bands, respectively. In order to eliminate
100
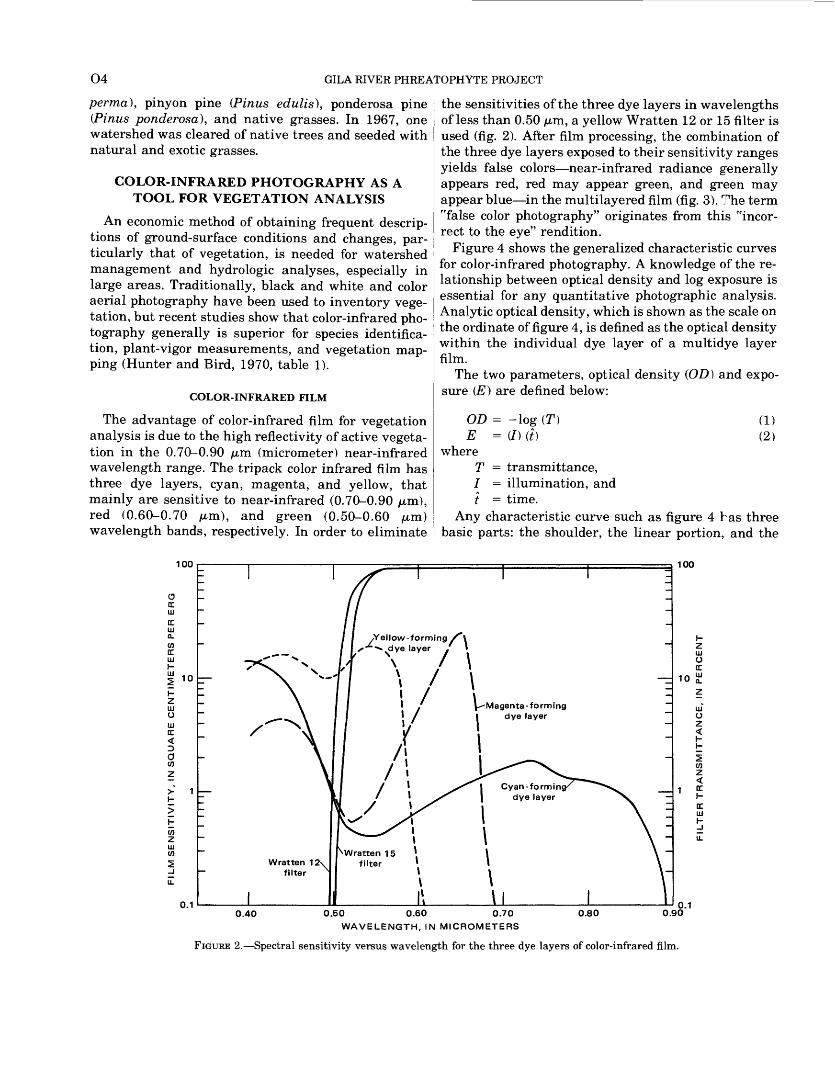
the sensitivities of the three dye layers in wavelengths of less than 0.50 /am, a yellow Wratten 12 or 15 filter is used (fig. 2). After film processing, the combination of the three dye layers exposed to their sensitivity ranges yields false colors near-infrared radiance generally appears red, red may appear green, and green may appear blue in the multilayered film (fig. 3). The term "false color photography" originates from this "incor rect to the eye" rendition.
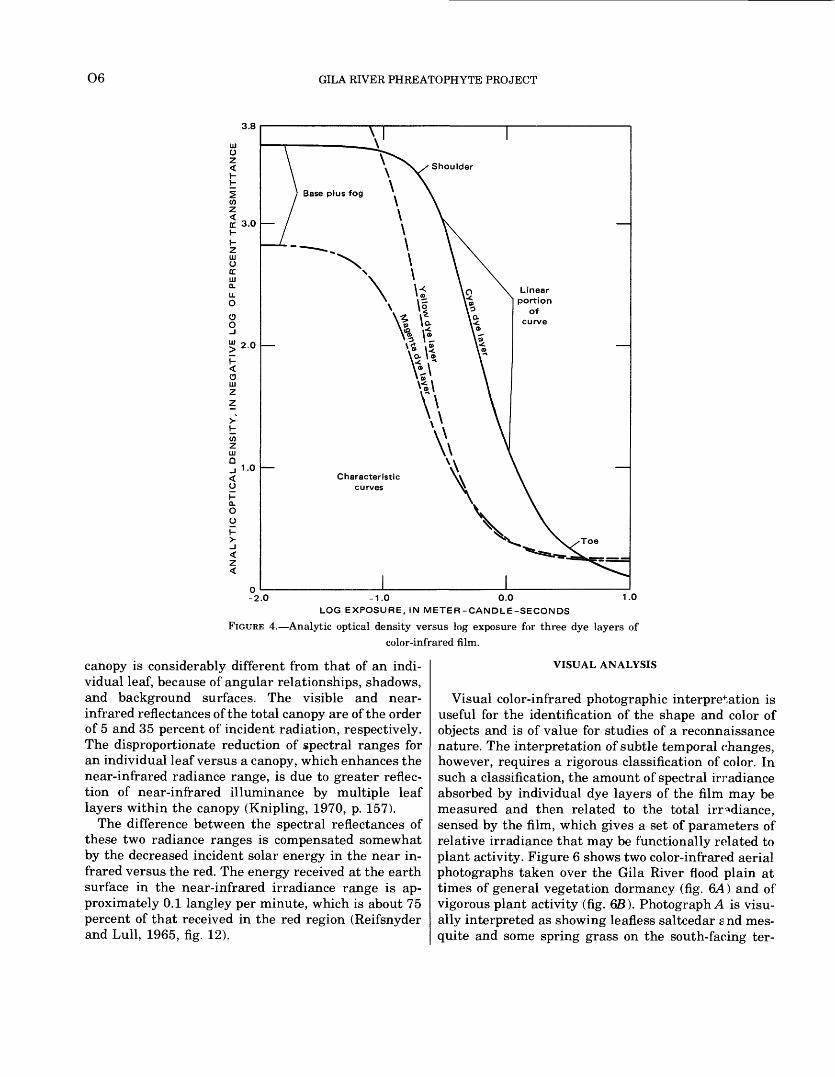
Figure 4 shows the generalized characteristic curves for color-infrared photography. A knowledge of the re lationship between optical density and log exposure is essential for any quantitative photographic analysis. Analytic optical density, which is shown as the scale on the ordinate of figure 4, is defined as the optical density within the individual dye layer of a multidye layer film.
The two parameters, optical density (OD) and expo sure (E) are defined below:
OD = -log(T) (1) E = (I) (t) (2)
whereT transmittance, 7 = illumination, and t = time.
Any characteristic curve such as figure 4 has three basic parts: the shoulder, the linear portion, and the
100
^-Magenta- forming dye layer
0.40 0.50 0.60 0.70 0.80
WAVELENGTH, IN MICROMETERS
FIGURE 2. Spectral sensitivity versus wavelength for the three dye layers of color-infrared film.
CALCULATION OF EVAPOTRANSPIRATION USING COLOR-INFRARED PHOTOGRAPHY O5
RESULTING VISUAL COLORS ON COLOR-INFRARED FILM, IN MICROMETERS
Blue , Green , Red
0.40
PRINCIPLE SENSITIVITY OF FILM LAYER _____
0.50 0.60 0.70
DYES BLEACHED BY EXPOSURE
Red 0.6-0.7
Green 0.5-0.6
Near infrared 0.7-0.9
Magenta
Yellow
Cyan
SOURCE OF RADIANCE, IN MICROMETERS
Blue Green0.40 0.50
I 0.60
Red \ 0.70
Near infrared0.90
Visual sensitivity range
Sensitivity range of color-infrared film with yellow filter
Spectral range oflow plant pigment reflectance
Spectral range ofhigh plant mesophyll reflectance
FIGURE 3. Color formation on color-infrared film and its relation to plant reflectance.
toe. The shoulder is the part where increasing exposure produces an increasing rate of density change, on the straight-line part the rate of change of density with log exposure is constant, and on the toe the rate is decreas ing. It must be noted that figure 4 is for a positive film; the characteristic curves would be reversed for a nega tive film.
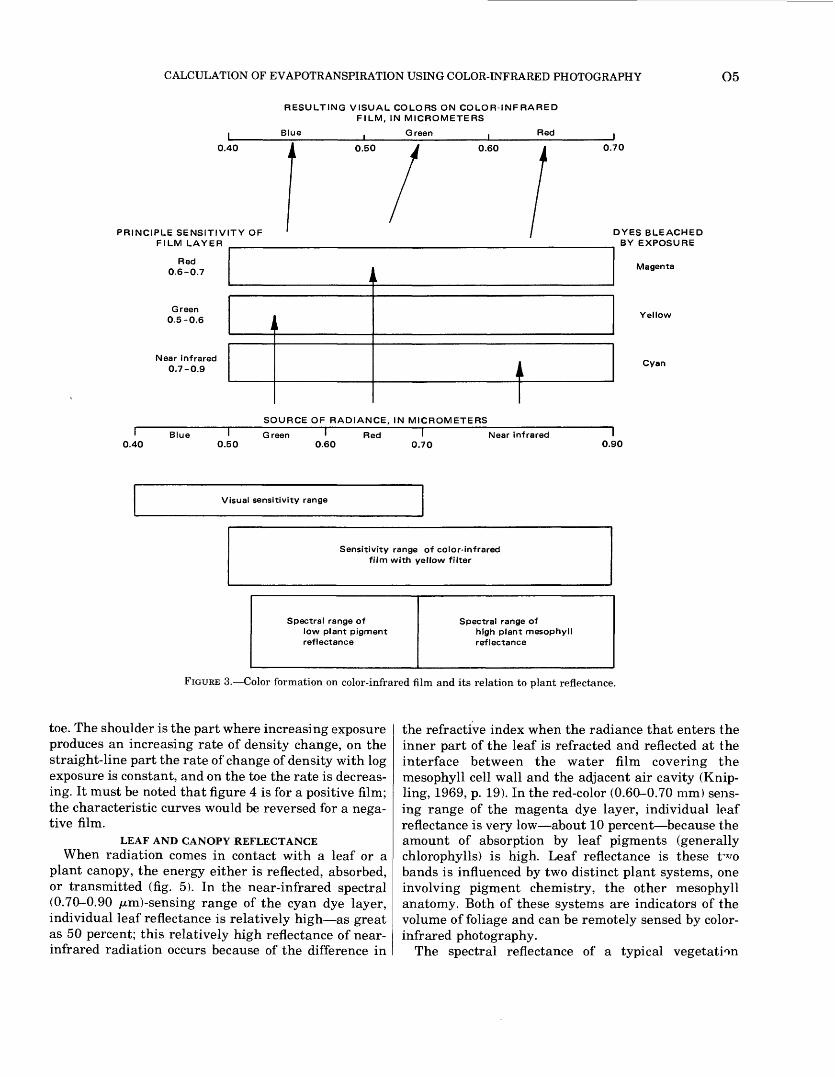
LEAF AND CANOPY REFLECTANCEWhen radiation comes in contact with a leaf or a
plant canopy, the energy either is reflected, absorbed, or transmitted (fig. 5). In the near-infrared spectral (0.70-0.90 //,m)-sensing range of the cyan dye layer, individual leaf reflectance is relatively high as great as 50 percent; this relatively high reflectance of near- infrared radiation occurs because of the difference in
the refractive index when the radiance that enters the inner part of the leaf is refracted and reflected at the interface between the water film covering the mesophyll cell wall and the adjacent air cavity (Knip- ling, 1969, p. 19). In the red-color (0.60-0.70 mm) sens ing range of the magenta dye layer, individual loaf reflectance is very low about 10 percent because the amount of absorption by leaf pigments (generally chlorophylls) is high. Leaf reflectance is these t^o bands is influenced by two distinct plant systems, one involving pigment chemistry, the other mesophyll anatomy. Both of these systems are indicators of the volume of foliage and can be remotely sensed by color- infrared photography.
The spectral reflectance of a typical vegetation
O6 GILA RIVER PHREATOPHYTE PROJECT
3.8
-2.0 1.0-1.0 0.0
LOG EXPOSURE, IN METER-CANDLE-SECONDS
FIGURE 4. Analytic optical density versus log exposure for three dye layers of
color-infrared film.
canopy is considerably different from that of an indi vidual leaf, because of angular relationships, shadows, and background surfaces. The visible and near- infrared reflectances of the total canopy are of the order of 5 and 35 percent of incident radiation, respectively. The disproportionate reduction of spectral ranges for an individual leaf versus a canopy, which enhances the near-infrared radiance range, is due to greater reflec tion of near-infrared illuminance by multiple leaf layers within the canopy (Knipling, 1970, p. 157).
The difference between the spectral reflectances of these two radiance ranges is compensated somewhat by the decreased incident solar energy in the near in frared versus the red. The energy received at the earth surface in the near-infrared irradiance range is ap proximately 0.1 langley per minute, which is about 75 percent of that received in the red region (Reifsnyder and Lull, 1965, fig. 12).
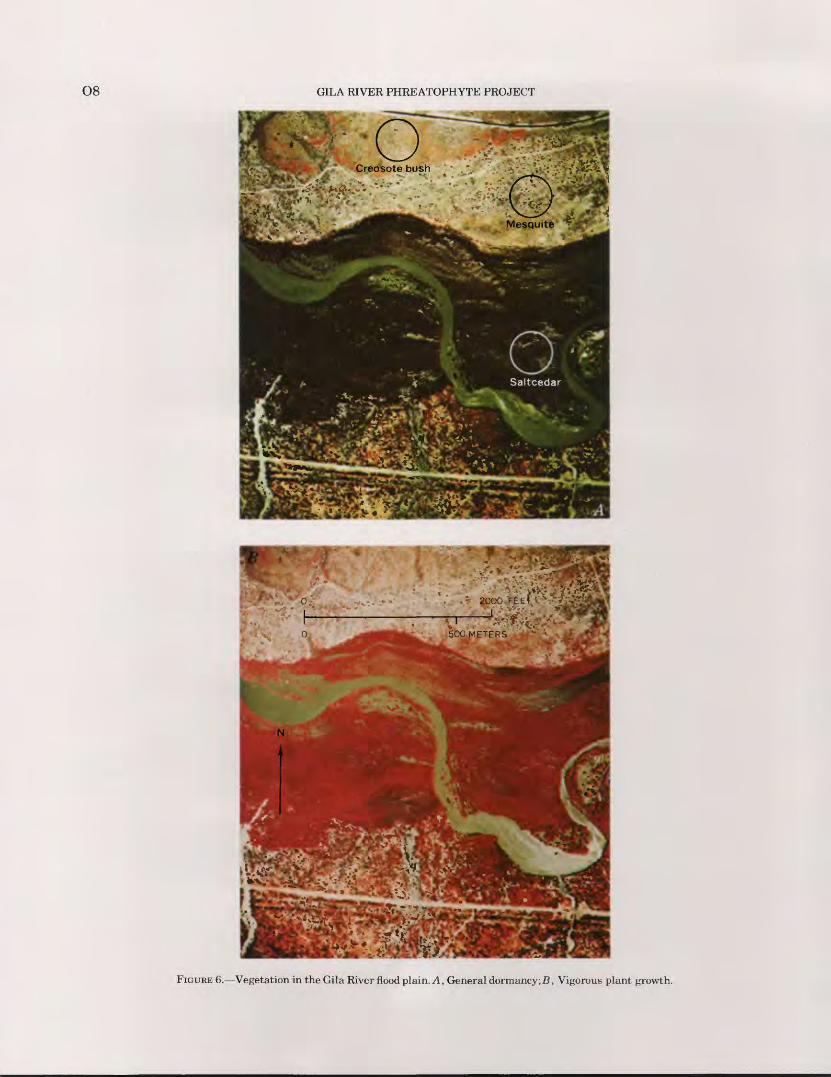
VISUAL ANALYSIS
Visual color-infrared photographic interpretation is useful for the identification of the shape and color of objects and is of value for studies of a reconnaissance nature. The interpretation of subtle temporal changes, however, requires a rigorous classification of color. In such a classification, the amount of spectral irradiance absorbed by individual dye layers of the film may be measured and then related to the total irradiance, sensed by the film, which gives a set of parameters of relative irradiance that may be functionally related to plant activity. Figure 6 shows two color-infrared aerial photographs taken over the Gila River flood plain at times of general vegetation dormancy (fig. 6A) and of vigorous plant activity (fig. 6B). Photograph A is visu ally interpreted as showing leafless saltcedar a nd mes- quite and some spring grass on the south-facing ter-

CALCULATION OF EVAPOTRANSPIRATION USING COLOR-INFRARED PHOTOGRAPHY O7
100
90
_IUJ
80
EC uj
il-- 70
s" 60_i }2 _i z> IDsi 50(0 0-i ii
40
_i oc 30u. O
20
10
Leaf absorption
NOTE: The transmitted radiance is equal to 100 percent minus the sum of reflectance plus absorption
Leaf reflectance
0.40 0.50 0.800.60 0.70
WAVELENGTH, IN MICROMETERS
FIGURE 5. Average leaf reflectance and absorption as a function of wavelength.
0.90
races. Photograph B is visually interpreted as showing increased foliation and vigor of the saltcedar and mes- quite, particularly by the saltcedar adjacent to the river, and dormant spring grass; this is a major vegeta tion change that occurred in less than a month March 22, 1968, to April 19, 1968. Healthy growing vegeta tion is shown as a red tone on figure 6B , which is prin cipally due to high values of near-infrared irradiance. Differences in soil types and the amount of soil mois ture probably account for the braided patterns that are shown in figure 6.
DATA COLLECTION
The evaluation of color-infrared photography as a means of evaluating hydrologic variables required the collection and tabulation of photographic data, which, in turn, was related to hydrologic data.
PHOTOGRAPHIC DATA COLLECTION
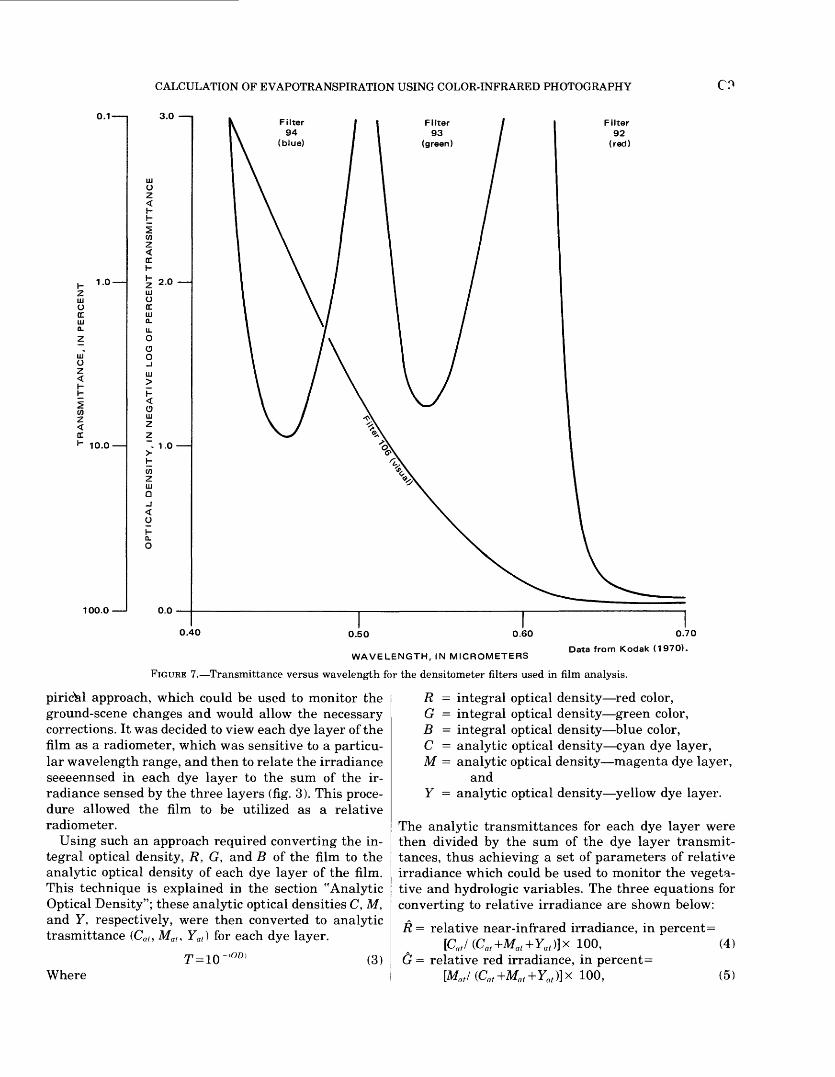
Optical density data were obtained from the positive transparencies using a Macbeth Model No. TD 402 transmittance densitometer with a 3-millimeter apera- ture using Wratten filters numbers 106, 92, 93, and 94. These filters transmit, respectively, the entire light (0.40-0.70 /mi) spectrum (corrected to the visual re sponse), the red (0.60-0.70 /mi), green (0.50-0.60 /mi), and blue (0.40-0.50 /mi) light (fig. 7). The resulting data from each filter is expressed in terms of the optical density of the multilayered film in each respective wavelength range.
The instrumentation and calibration limitations and the nature of the study prohibited photogrammetric data from being analyzed as a precise spectral radio- metric pheonomenon. The need for quantitative data for computer analysis did, however, require an em-
O8 GILA RIVER PHREATOPHYTE PROJECT
t- ^:*f Y+*yy.* ' , --.-7^^ <. . .^ »v>*^
FIGURE 6. Vegetation in the Gila River flood plain. A, General dormancy;!?, Vigorous plant growth.
CALCULATION OF EVAPOTRANSPIRATION USING COLOR-INFRARED PHOTOGRAPHY
0.1-
1.0
I COz <DC*- 10.0
100.0
3.0 i
2.0
1.0
0.0
Filter92
(red)
0.40 0.50 0.60 0.70
Data from Kodak (1970).WAVELENGTH, IN MICROMETERS
FIGURE 7. Transmittance versus wavelength for the densitometer filters used in film analysis.
piric^al approach, which could be used to monitor the ground-scene changes and would allow the necessary corrections. It was decided to view each dye layer of the film as a radiometer, which was sensitive to a particu lar wavelength range, and then to relate the irradiance seeeennsed in each dye layer to the sum of the ir radiance sensed by the three layers (fig. 3). This proce dure allowed the film to be utilized as a relative radiometer.
Using such an approach required converting the in tegral optical density, R, G, and B of the film to the analytic optical density of each dye layer of the film. This technique is explained in the section "Analytic Optical Density"; these analytic optical densities C, M, and Y, respectively, were then converted to analytic trasmittance (Cat , Mat , Yat ) for each dye layer.
T=10 -(OD) (3)Where
R = integral optical density red color,G = integral optical density green color,B integral optical density blue color,C = analytic optical density cyan dye layer,M = analytic optical density magenta dye layer,
and Y = analytic optical density yellow dye layer.
The analytic transmittances for each dye layer were then divided by the sum of the dye layer transmit tances, thus achieving a set of parameters of relative irradiance which could be used to monitor the vegeta tive and hydrologic variables. The three equations for converting to relative irradiance are shown below:
R = relative near-infrared irradiance, in percent=[CJ (Cat +Mat +Yat )]x 100, (4)
G = relative red irradiance, in percent=[MJ (Cat +Mat +Yat )]x 100, (5)
O10
(6)B relative green irradiance, in percent=
[YJ (Cat +Mat +Yat )]x 100.
Thus, by definition£ +G +B = 100 percent. (7)
Two characteristics of these trichromatic parameters (Wright, 1969, p. 83) are of particular importance to the researcher. $ and & are generally inversely pro portional and linearly related, because of the three following effects.
1. The spurious correlation due to the "closed sys tem" (Chayes, 1971) interrelationship between the var iables as shown in equation 7. For example, an in crease in $ dictates an equal decrease in the sum & +B. This effect is discussed in the section "Statistical Analysis of Variables."
2. The high reflectance in the near infrared and high absorption in the red by active vegetation as shown in figure 5.
3. The radiance from vegetation affecting the yellow dye layer (0.50-0.60 /w-m) is not significantly related to plant vigor.
Ideally, photographic step tablets and spectral sen sitivity curves should be generated for each roll of film to calibrate precisely the energy received by the film and to compensate for processing and aging effects. This was not done because of the limitations of the study, which have already been discussed. The actual area sampled by the 3-millimeter aperature on the 8,500-foot (2,600-m) photography is 0.50 acre (0.20 ha) per plot. This was a 14 percent area sample and was considered representative owing to the large sampling populations.
Densitometric data which were not on the linear parts of the characteristic curves were rejected. The difficulty of handling data from the toe or shoulder of a characteristic curve is obvious from figure 4.
HYDROLOGIC DATA COLLECTION
Hydrologic data sampling on the Gila River Phre- atophyte Project was done using the plot system already described. The hydrologic variables were mon itored by a network of ground-water observation wells, soil-moisture access tubes, rain gages, and river and tributary gaging stations. The sampling techniques and methods of evaluation have been discussed by Hanson, Kipple, and Culler (1972, p. 315).
VEGETATION DATA COLLECTION
The plant type and spatial distribution of vegetation on the project area was described by a combination of photographic reconnaissance and field checking.
Black and white aerial photographs with a scale of 1:7,200 were viewed through a dissecting binocular
GILA RIVER PHREATOPHYTE PROJECT
microscope, which had been fitted with an appropriate reticle, and were used to measure plant-crovn cover age (Culler and others, 1972; Turner, 1971). Tentative boundaries defining areas of homogeneous vegetation were first drawn on the photographs. A field check was then made to confirm these boundaries and determine the dominant species within each area. Fir ally, the photographs were examined under magnification. The squares on the reticle, when viewed through the micro scope, were considered to be plots projected onto the photographs. Plant coverage within each plo* was es timated according to a size-class system. Averaged data, taken from an examination of each plot, provided numerical values of percentage of crown coverage. Comparison of the photogrammetric method with one of the standard field measures of crown coverage was made (Turner, 1973), and agreement between the methods was close.
IDENTIFICATION AND MEASUREMENT OF VEGETATION PARAMETERS
Conventional hydrologic instrumentation is usually limited to point samples, but photographic remote sensing offers a method of obtaining a record of both the spatial and temporal variability of many vegeta tive parameters.
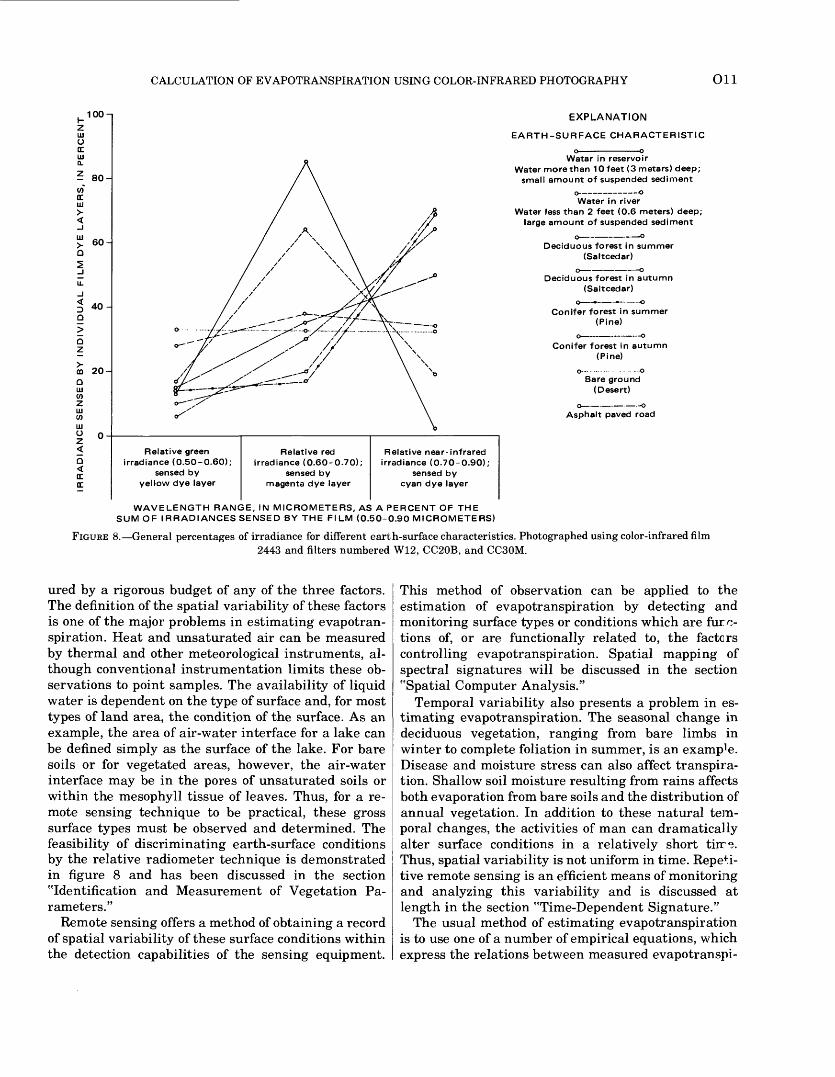
Definitive radiometric identification of gross earth- surface characteristics, such as bare ground, water, and vegetation type by photographic remote sensing, is prerequisite to the quantitative monitoring of many hydrologic variables. Figure 8 illustrates the relative irradiance characteristics C&, &, and B) of eight ground-scene conditions viewed with color-infrared photography. Automatic computer identification of earth-surface characteristics based on the spectral ir radiance appears possible and should be a productive research field, particularly with the advent of sat^llite imagery.
EVAPOTRANSPIRATION
The feasibility of estimating evapotranspiration by photographic remote sensing has been studied by the personnel of the Gila River Phreatophyte Project for several years. A primary objective of this project is the study and measurement of evapotranspiration.
Evapotranspiration is water withdrawn from a land area by evaporation from water surfaces, from moist soil, and by plant transpiration (Langbein and Iseri, 1960, p. 9). The vaporization process has three basic requirements: (1) heat for the phase change from liquid to vapor; (2) unsaturated air to remove the vapor; and (3) liquid water available at an air-water interface. Any of these factors can control the rate of vaporiza tion, and the quantity of water vaporized can be meas-
CALCULATION OF EVAPOTRANSPIRATION USING COLOR-INFRARED PHOTOGRAPHY Oil
100n
60-
40-
20-
EXPLANATION
EARTH-SURFACE CHARACTERISTIC
Watar in reservoirWater more than 10 feet (3 metars) deep;
small amount of suspended sediment
Water in riverWater less than 2 feet (0.6 meters) deep;
large amount of suspended sediment
Deciduous forest in summer (Saltcedar)
Deciduous forest in autumn(Saltcedar)
o . -oConifer forest in summer
(Pine)
Conifer forest in autumn (Pine)
Bare ground (Desert)
o . . . - .-o Asphalt paved road
Relative green irradiance (0.50-0.60);
sensed by yellow dye layer
Relative red irradiance (0.60-0.70);
sensed by magenta dye layer
Relative near-infrared irradiance (0.70-0.90);
sensed by cyan dye layer
WAVELENGTH RANGE, IN MICROMETERS, AS A PERCENT OF THE SUM OF IRRADIANCES SENSED BY THE FILM (0.50-0.90 MICROMETERS)
FIGURE 8. General percentages of irradiance for different eart h-surface characteristics. Photographed using color-infrared film2443 and filters numbered W12, CC20B, and CC30M.
ured by a rigorous budget of any of the three factors. The definition of the spatial variability of these factors is one of the major problems in estimating evapotran- spiration. Heat and unsaturated air can be measured by thermal and other meteorological instruments, al though conventional instrumentation limits these ob servations to point samples. The availability of liquid water is dependent on the type of surface and, for most types of land area, the condition of the surface. As an example, the area of air-water interface for a lake can be defined simply as the surface of the lake. For bare soils or for vegetated areas, however, the air-water interface may be in the pores of unsaturated soils or within the mesophyll tissue of leaves. Thus, for a re mote sensing technique to be practical, these gross surface types must be observed and determined. The feasibility of discriminating earth-surface conditions by the relative radiometer technique is demonstrated in figure 8 and has been discussed in the section "Identification and Measurement of Vegetation Pa rameters."
Remote sensing offers a method of obtaining a record of spatial variability of these surface conditions within the detection capabilities of the sensing equipment.
This method of observation can be applied to the estimation of evapotranspiration by detecting and monitoring surface types or conditions which are fur ra tions of, or are functionally related to, the factors controlling evapotranspiration. Spatial mapping of spectral signatures will be discussed in the section "Spatial Computer Analysis."
Temporal variability also presents a problem in es timating evapotranspiration. The seasonal change in deciduous vegetation, ranging from bare limbs in winter to complete foliation in summer, is an examp^. Disease and moisture stress can also affect transpira tion. Shallow soil moisture resulting from rains affects both evaporation from bare soils and the distribution of annual vegetation. In addition to these natural tem poral changes, the activities of man can dramatically alter surface conditions in a relatively short tirre. Thus, spatial variability is not uniform in time. Repeti tive remote sensing is an efficient means of monitoring and analyzing this variability and is discussed at length in the section "Time-Dependent Signature."
The usual method of estimating evapotranspiration is to use one of a number of empirical equations, which express the relations between measured evapotranspi-
O12 GILA RIVER PHREATOPHYTE PROJECT
ration and climatic conditions as described by Veih- meyer (1964, table 11-2).
Remote sensing in the form of color-infrared photog raphy has been applied to the widely used equation developed by Blaney and Criddle (1962). Studies by Cruff and Thompson (1967, p. 22) indicate that this equation is the most reliable for estimating potential evapotranspiration in arid and subhumid climates yielding variability ranging from -44 to +22 percent of adjusted evaporation data from Weather Bureau Class A pans. The equation is
u=kf, (8) where
u = calculated monthly evapotranspiration, in inches, derived from the Blaney-Criddle equation;
k = empirical consumptive-use coefficient, which can be defined for a vegetative area by re mote sensing (the coefficient is dependent on the species, composition, and quantity of vegetation as well as the background signa ture which may be soil or water), and
f = consumptive-use factor, defined as ^ ,
summed for the number of months of anal ysis, in which
p = monthly percentage of annual daytime hoursand
t = mean monthly temperature, in degreesFahrenheit.
In metric units,
u kp (45.7^+813
100 ) = monthly consumptive
use, in millimeters andt = mean monthly temperature, in degrees centi
grade.The k value is assumed to represent a gross measure of the air-water interface. It therefore represents the spa tially variable factor defined by the surface conditions, including such botanical parameters as vegetation type and aerial extent, plant density, and physiologic conditions. For the purposes of this study, k was de fined in two ways. The vegetation description of the project area was used to define a k which was used in the water-budget computations of evapotranspiration, and a second k was defined by remote sensing which was dependent on relative near-infrared irradiance. Values ofp are tabulated in Blaney and Criddle (1962), and t is generally available in published U.S. National Weather Service (issued annually) summaries. It is as
sumed that the factor/" describes the thermal and vapor conveyance requirements of evapotranspiration.
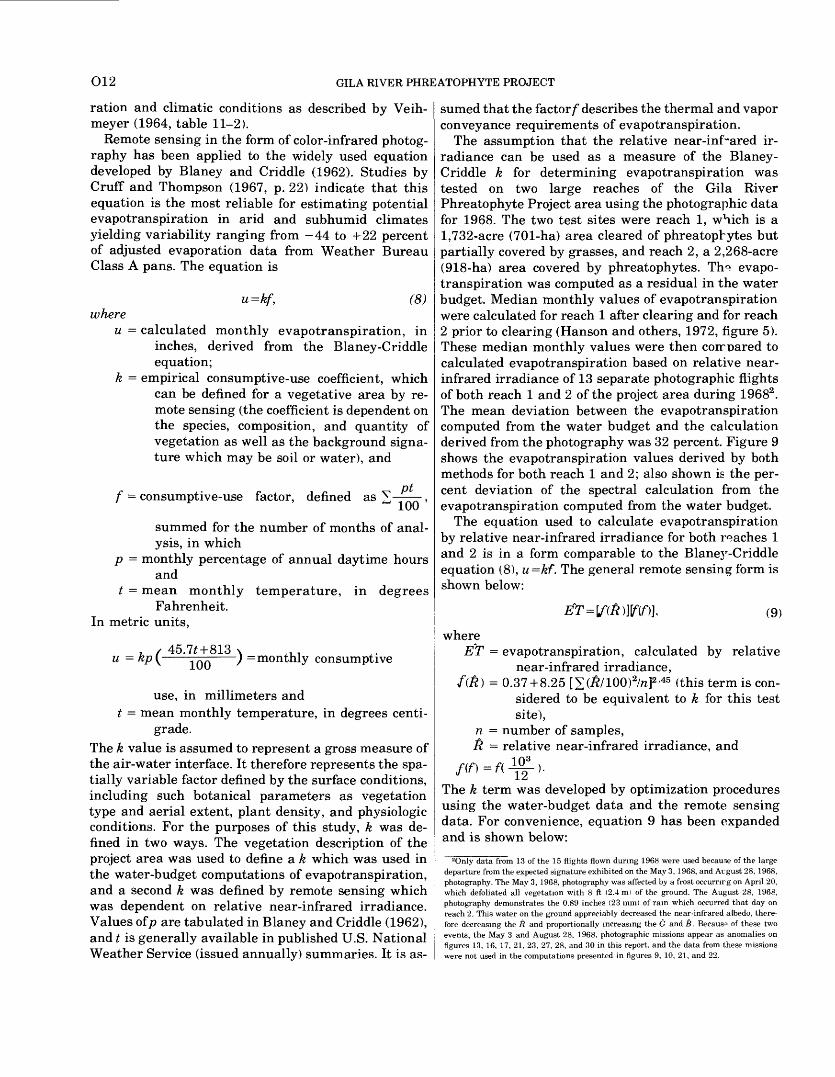
The assumption that the relative near-infrared ir radiance can be used as a measure of the Blaney- Criddle k for determining evapotranspiration was tested on two large reaches of the Gil a River Phreatophyte Project area using the photographic data for 1968. The two test sites were reach 1, which is a 1,732-acre (701-ha) area cleared of phreatophytes but partially covered by grasses, and reach 2, a 2,268-acre (918-ha) area covered by phreatophytes. Th« evapo transpiration was computed as a residual in the water budget. Median monthly values of evapotranspiration were calculated for reach 1 after clearing and for reach 2 prior to clearing (Hanson and others, 1972, figure 5). These median monthly values were then corrpared to calculated evapotranspiration based on relative near- infrared irradiance of 13 separate photographic flights of both reach 1 and 2 of the project area during 19682 . The mean deviation between the evapotranspiration computed from the water budget and the calculation derived from the photography was 32 percent. Figure 9 shows the evapotranspiration values derived by both methods for both reach 1 and 2; also shown is the per cent deviation of the spectral calculation from the evapotranspiration computed from the water budget.
The equation used to calculate evapotranspiration by relative near-infrared irradiance for both reaches 1 and 2 is in a form comparable to the Blaney-C riddle equation (8), u=kf. The general remote sensing form is shown below:
ET=[f(fi)W(f)], (9)
whereET - evapotranspiration, calculated by relative
near-infrared irradiance,= 0.37+8.25 [V(£/100)2/rcj2 -45 (this term is con
sidered to be equivalent to k for this test site),
n = number of samples, $ = relative near-infrared irradiance, and
The k term was developed by optimization procedures using the water-budget data and the remote sensing data. For convenience, equation 9 has been expanded and is shown below:
2Only data from 13 of the 15 flights flown during 1968 were used because of the large departure from the expected signature exhibited on the May 3, 1968, and August 28, 1968, photography. The May 3, 1968, photography was affected by a frost occurnrg on April 20, which defoliated all vegetation with 8 ft (2.4ml of the ground. The August 28, 1968, photography demonstrates the 0.89 inches (23 mm) of ram which occurred that day on reach 2. This water on the ground appreciably decreased the near -infrared albedo, there fore decreasing the R and proportionally increasing the G and tl. Because of these two events, the May 3 and August 28, 1968, photographic missions appear as anomalies on figures 13, 16, 17, 21, 23, 27, 28, and 30 in this report, and the data from these missions were not used in the computations presented in figures 9, 10, 21, and 22.
CALCULATION OF EVAPOTRANSPIRATION USING COLOR-INFRARED PHOTOGRAPHY O13
7r- EXPLANATION -,
6
5CO
0 4OoOC LU 0. »COLUX O 2
2
2~ 1
O t- < 0OC0.
oCM
- ^t^
Calculated evapotranspiration:
Reach 2, 2,268 acres (918 hectares).
,_*;
t _ i
Calculated using relative near- infrared ;£> ,_ irradiance. Calculatesd values are from +
13 photographic m ssions flown in1 968.Number, +20, is percent of deviation
from measured evapotranspiration
DMedian monthly evapotransp ration.
Computed using water -budget method ~ n
0 *> «CM
1
i i i | i I i i i I ill
2 4
OCI-O *3Q_ ^
^
^ 2
1
0
-
-
i i i i i i i i i i i i i 1--! i
|
1
*
ss \
\ \SsN S
^ '
^ 1^ ^
II' * '
in_ ^ mn «. +? ± ra\
v
V .;Jan. Feb. Mar.
^
Apr.
1
|1 '
-
s \\
1 '
;
;-J s
5;
;
;
|
§
|
\
s ssss
s ss s
\s s
s
\N
s ss s s ss
CD
^
i iii
S
SV
^S
|^^
|
1
i i i
before clearing phreatophytes
Mean absolute dev ation, 25 percent _
00*"
ss
n
1\
i 7 i i i
O)
i
I
)i i i i
00in
i
1
-
'
IT ii i i i i i ii ii
^ ^ Reach 1, 1,732 acres (710 hectares).£ ^ ^ 0 CM after clearing phreatophytes^
o ^ n $
|VI1fi !N.
N
|
i ss*1 K1s s
\ ss \ss
N S Ss\ \s,s\
;s s s s s
$S ~
Ss ss s\s ssss,\
s s s s s s s
-l ^ i i i i i i i i May 1 June
^ + Mean absolute deviation, 39 percent
s1 1
V
V
$ o oVs1- ' 1 1 1 i-
Julyi
n ~i i o
!Vs1
Aug.
CM
h 1s
s
'l 1 1
Sept.
-| 0) ~1 i i O
r^
i
^
1
CM
+
N -
|
-
1 1 1 1 1 1 1 1 III
Oct. Nov. Dec.
- 150
CO
<oo
- 100 £LUa.CO OCLU t-11)
- 50 I
i2
-0 \t-<(OC
- 100 £CO2
OCl- oa.
- 50 ^LU
- 0
FIGURE 9. Remote sensing and water-budget values of evapotranspiration versus time, Gila River Phreatophyte Project area.
ET = {0.37+8.25[V(£/ioO)%]2 '45 }[(/l(103/12)].aO)
Several items will be noted by scrutiny of figure 9.1. The evapotranspiration calculated spectrally is
consistently high for reach 1 and consistently low for reach 2. To be an effective tool over large areas of land scape, the remote sensing estimate of evapotranspira tion should be independent of any knowledge of ground condition, and for this reason the same spectral equa tion (equation 10) was used for both the phreatophyte- covered reach 2 and reach 1, which was cleared.
2. The nature of the different covers in the two reaches shown in figure 9 must also be considered to gain an understanding of the departure noted in item 1. Reach 1 was cleared of phreatophytes prior to the 1968 photographic flights, and the bare areas produced by the clearing have been reoccupied to varying de grees by perennial and ephemeral herbaceous plants (Culler and others, 1972). The primary source of water for this replacement vegetation is from shallow soil moisture. The water availability for these plants is considerably less than for the phreatophytes on reach 2, which predominately obtain their water from the water table. The relative near-infrared irradiance of
these replacement grasses is probably disproportion ately higher than phreatophytes for a given amount of water use because they are short, yet dense, and refect greatly in the near infrared. Therefore, evapotranspi ration calculated by relative near-infrared irradiance on reach 1 is assumed too high. This would also account for the underestimation of evapotranspiration on reach 2 because of the same equation being used simultane ously for both sets of data.
3. Figure 9 indicates that the relation between k and relative near-infrared irradiance is closer for dense vegetation than for sparse cover. The evapotransp; ra tion calculated by irradiance has a closer correlatior on the phreatophyte-covered reach 2 (25 percent versur 39 percent). This assumption is also shown in later examples.
4. An error source, which should be considered in analyzing figure 9, is the inherent deviation of the evapotranspiration derived from the water budget. These median evapotranspiration values have a devia tion of as much as 40 percent (Hanson and others, 1972, p. 326). This fact may also explain a portion of the deviation between the water-budget evapotranspi ration and the remote sensing approach.
a. (D
rt-
9-
"2. I.
5 Q
£>*
ME
AS
UR
ED
EV
AP
OT
RA
NS
PIR
AT
ION
,IN
IN
CH
ES
PE
R 3
0 D
AY
S
O
-»
ro
u
(D
O
> r
O c r > _
.H m O m < > o O
ro
H 13 > Z V) 2 I" 6 z
S
-1
-7<b
^
£.
3
o_
_
_
3
3J
o, -
cr
<g.
8
O
o> O Z z
^1 -or
or
ME
AS
UR
ED
E
VA
PO
TR
AN
SP
IRA
TIO
N,
IN M
ILL
IME
TE
RS
PE
R 30 D
AY
S
ME
AS
UR
ED
E
VA
PO
TR
AN
SP
IRA
TIO
N,
IN
INC
HE
S P
ER
30 D
AY
S_.
ro
to
^
01
oi
| |
| |
| |
O
O
> TJ
O
.01
TJ
°
> V)
o r
o r
ME
AS
UR
ED
E
VA
PO
TR
AN
SP
IRA
TIO
N,
IN M
ILL
IME
TE
RS
PE
R 30 D
AY
S
<Q
Q..
Q
O
0)
K'
B
D
3
O
£
O
<
£.
"DS
0)
Q)
^
'3
c"
""
3
S
»
O_»
0)
3
3S
S 2
"§?
:.O
3
3 ?
O
"D
3 5
m
X -D
> z. > H
O z.
3 =t
ffi
0)i
3
O
>-i
<rf
p
P
Ct>
tT
CO
p- o
' w
o fo
s;-
50
o £
p
CD
CDCO
CO
S±
fO
tn^
ct>ct>
O
(D
L_J
3 »
-ct>
era
£L
H*
- g*§
co<t>
cr o
<
? a s-
1 1SB
cr
q p
o
S
9 ft
EL»
SL
S P Oi
fcl
to O
en
Ct)
i's P
co
CT* 2
Ct)
3
cr 0
o
353
cr
qC
D
P co
y- a
Ct)
<t)
0 a
2 r >
» M
» '-d
ffi
»
M
H.
§ ffi O
O
Cli
i-s crq
CALCULATION OF EVAPOTRANSPIRATION USING COLOR-INFRARED PHOTOGRAPHY O15
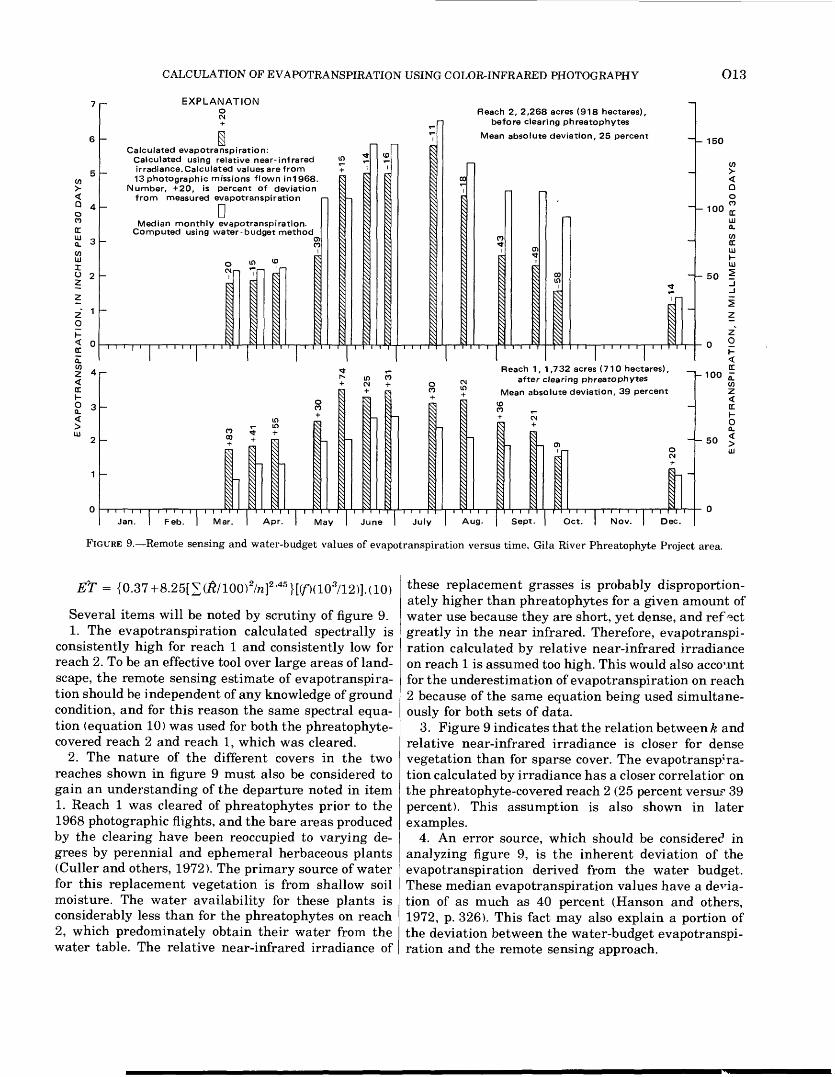
the coefficient of correlation for this equation is 0 .1 and
ET2 = 0.88( ET) + 108.2; (12)
the coefficient of correlation for the equation is 0.86; where
ET± evapotranspiration, reach 1, calculated as aresidual by the water-budget method and
ET2 = evapotranspiration, reach 2, calculated as aresidual by the water-budget method.
Figure 10 is a refinement of the data presented in figure 9, and although figure 10 should be viewed with caution (for the reasons presented in the discussion of fig. 9), the correlation within each reach is good, and more research of this type would appear justified.
Hanson, Kipple, and Culler (1972) described an analysis in which the measured evapotranspiration for each month of record on each reach of the Gila River Phreatophyte Project is related to foliar cover for the respective reach by solving the following transforma tion of equation 8:
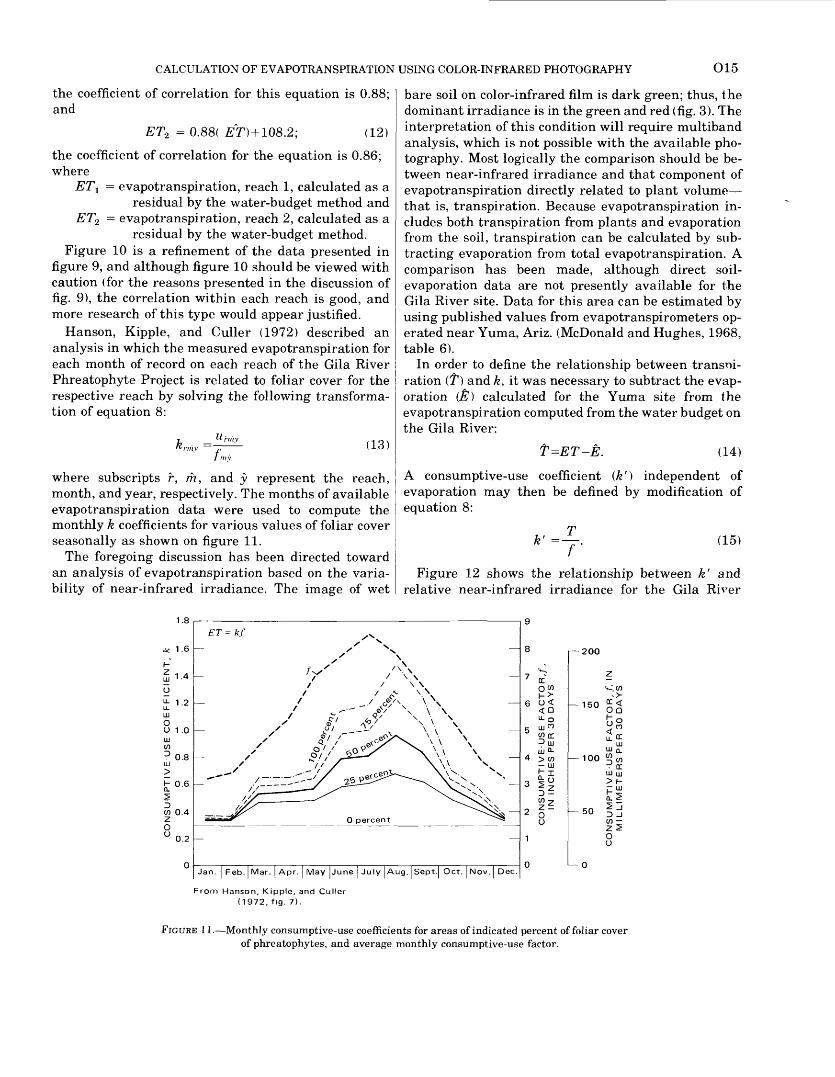
k ='v rm vU'rmy
I my(13)
where subscripts r, m, and y represent the reach, month, and year, respectively. The months of available evapotranspiration data were used to compute the monthly k coefficients for various values of foliar cover seasonally as shown on figure 11.
The foregoing discussion has been directed toward an analysis of evapotranspiration based on the varia bility of near-infrared irradiance. The image of wet
bare soil on color-infrared film is dark green; thus, the dominant irradiance is in the green and red (fig. 3). The interpretation of this condition will require multiband analysis, which is not possible with the available pho tography. Most logically the comparison should be be tween near-infrared irradiance and that component of evapotranspiration directly related to plant volume that is, transpiration. Because evapotranspiration in cludes both transpiration from plants and evaporation from the soil, transpiration can be calculated by sub tracting evaporation from total evapotranspiration. A comparison has been made, although direct soil- evaporation data are not presently available for the Gila River site. Data for this area can be estimated by using published values from evapotranspirometers op erated near Yuma, Ariz. (McDonald and Hughes, 1968, table 6).
In order to define the relationship between transm- ration CP) and k, it was necessary to subtract the evap oration (E) calculated for the Yuma site from the evapotranspiration computed from the water budget on the Gila River:
?=ET-E. (14)
A consumptive-use coefficient (k'} independent of evaporation may then be defined by modification of equation 8:
,, T k = -. (15)
Figure 12 shows the relationship between k' and relative near-infrared irradiance for the Gila River
1.8
Jan. Feb. Mar. Apr. May June July Aug. Sept. Oct. Nov. Dec.
From Hanson, Kipple, and Culler (1972, fig. 7).
I 200
^ 15°§1H«
100UJ Q_
50
0
DC111 UJ
FIGURE 11. Monthly consumptive-use coefficients for areas of indicated percent of foliar cover of phreatophytes, and average monthly consumptive-use factor.
O16 GILA RIVER PHREATOPHYTE PROJECT
EXPLANATION
2.0
g1.5
O
r 1.0
> 0.5_ix h
0 20 40 60 80 100
RELATIVE NEAR-INFRARED IRRADIANCE, IN PERCENT
Relationship between k' and data for un cleared subreach (2b)
Relation between k' and pooled data for cleared (2a) and uncleared (2b) subreaches
Data from energy-budget station, represent ing especially dense vegetation, is in cluded in both regression analyses
o Subreach 2a (cleared of phreatophytes)
A Subreach 2 b (uncleared of phreatophytes)
Energy budget station
R Relative near-infrared irradiance
k'
Monthly consumptive-use coefficient
r Coefficient of correlation
" y-x Standard error of estimates
2 Subscript, reach 2
2a Subscript, subreach 2a
FIGURE 12. Monthly consumptive-use coefficient versus relative near-infrared irradiance.
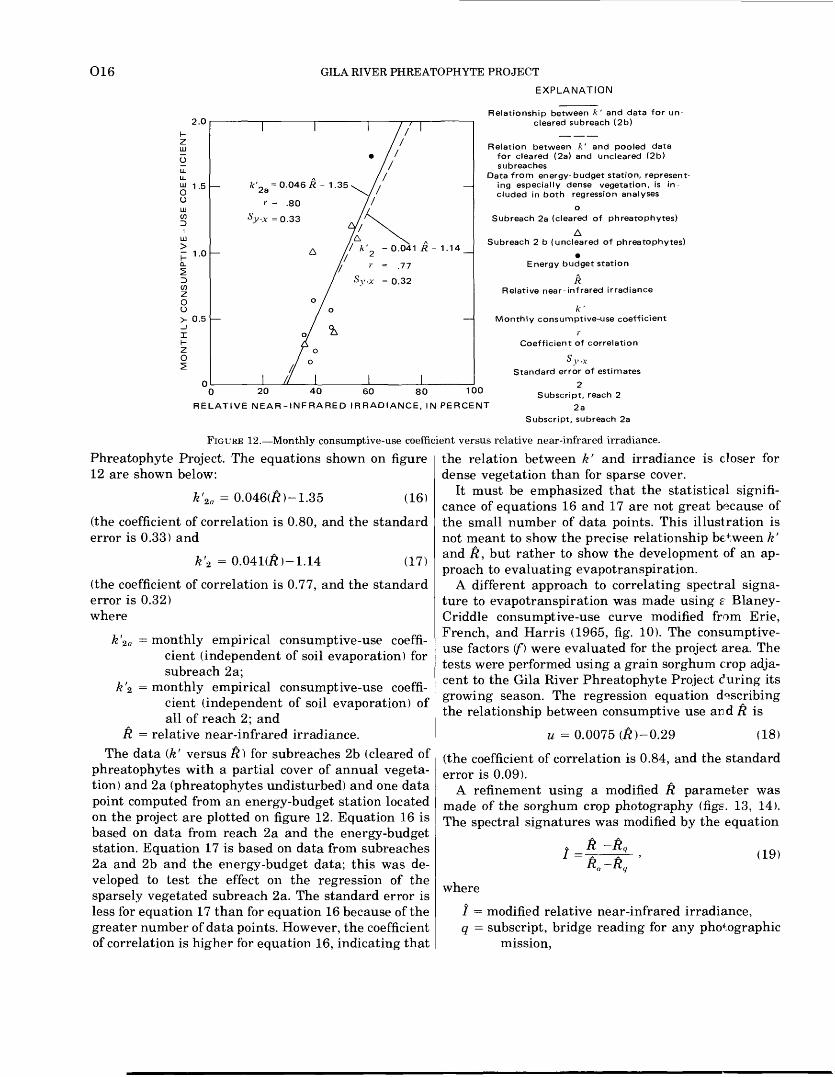
Phreatophyte Project. The equations shown on figure 12 are shown below:
k'2a = 0.046(£)-1.35 (16)
(the coefficient of correlation is 0.80, and the standard error is 0.33) and
'o = 0.041(£)-1.14 (17)
(the coefficient of correlation is 0.77, and the standarderror is 0.32)where
k'za = monthly empirical consumptive-use coeffi cient (independent of soil evaporation) for subreach 2a;
k'2 = monthly empirical consumptive-use coeffi cient (independent of soil evaporation) of all of reach 2; and
fi = relative near-infrared irradiance.The data (k' versus $) for subreaches 2b (cleared of
phreatophytes with a partial cover of annual vegeta tion) and 2a (phreatophytes undisturbed) and one data point computed from an energy-budget station located on the project are plotted on figure 12. Equation 16 is based on data from reach 2a and the energy-budget station. Equation 17 is based on data from subreaches 2a and 2b and the energy-budget data; this was de veloped to test the effect on the regression of the sparsely vegetated subreach 2a. The standard error is less for equation 17 than for equation 16 because of the greater number of data points. However, the coefficient of correlation is higher for equation 16, indicating that
the relation between k' and irradiance is closer for dense vegetation than for sparse cover.
It must be emphasized that the statistical signifi cance of equations 16 and 17 are not great because of the small number of data points. This illustration is not meant to show the precise relationship between k' and &, but rather to show the development of an ap proach to evaluating evapotranspiration.
A different approach to correlating spectral signa ture to evapotranspiration was made using £ Blaney- Criddle consumptive-use curve modified from Erie, French, and Harris (1965, fig. 10). The consumptive- use factors (f) were evaluated for the project area. The tests were performed using a grain sorghum crop adja cent to the Gila River Phreatophyte Project during its growing season. The regression equation describing the relationship between consumptive use an d & is
u = 0.0075 (#)-0.29 (18)
(the coefficient of correlation is 0.84, and the standard error is 0.09).
A refinement using a modified j$ parameter was made of the sorghum crop photography (figs. 13, 14). The spectral signatures was modified by the equation
(19)
where
/ = modified relative near-infrared irradiance, q = subscript, bridge reading for any photographic
mission,

CALCULATION OF EVAPOTRANSPIRATION USING COLOR-INFRARED PHOTOGRAPHY O17
0.5
Irradiance prior to plant emergence
1968 Consumptive-use data modified from Erie, French, and Harris (1965, fig. 10)
£t UJ
10o-COccLUK-
8 UJ
6
2
FIGURE 13. Consumptive use of water and modified relative near-infrared irradiance versus time for grain sorghum during1968 growing season.
0.5
QIt 0.4UJ
0.3
UJ COD 0.2UJ>K-Q_
| 0-1
o o
EXPLANATION
Modified relative r nfrared
Consu
Coeff
r- 12 >
Qtr.
hioSCOtcUJ
- 8 uj
- 6
4
- 2
- 00 20 40 60 80 100 120
MODIFIED RELATIVE NEAR - IN FR ARED IRRADIANCE IN PERCENT
FIGURE 14. Regression relation between consumptive use of water and modfied relative near-infrared irradiance for grain sorghum during the 1969 growing season.
a = subscript, data from a sampled plot of an ever green species of saltcedar (Tamarix aphylla) located on the project area.
/ was then related to the consumptive use; the regres sion equation is
w =0.0049 (/)-0.14 (20)
(the coefficient of correlation is 0.93, and the standard error is 0.06).
The parameter T presents the amount of radiance of the grain sorghum crop as a function of two presumed constant radiating surfaces, and although this assump tion is not exactly true, particularly with regard to the saltcedar, this empirical ratio does show promise. The increase in the coefficient of correlation and the de crease of the standard error of estimate between equa tions 18 and 20 seem to verify this. Equation 19 repre sents a method of calibrating for the change of chrcma
O18 GILA RIVER PHREATOPHYTE PROJECT
(and to a lesser extent the hue) as sensed by the film. Ideally this should be done by using a series of large panels with precise reflectance characteristics, which could be photographed and used to calibrate the spec tral data.
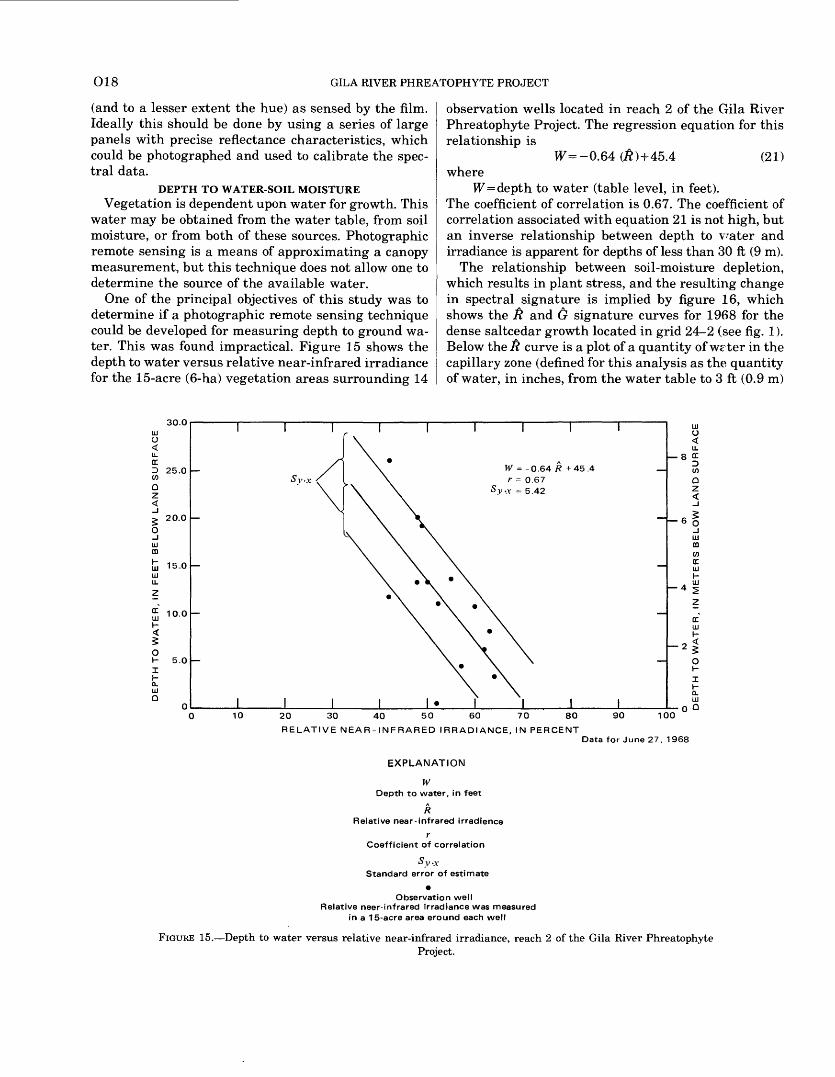
DEPTH TO WATER-SOIL MOISTUREVegetation is dependent upon water for growth. This
water may be obtained from the water table, from soil moisture, or from both of these sources. Photographic remote sensing is a means of approximating a canopy measurement, but this technique does not allow one to determine the source of the available water.
One of the principal objectives of this study was to determine if a photographic remote sensing technique could be developed for measuring depth to ground wa ter. This was found impractical. Figure 15 shows the depth to water versus relative near-infrared irradiance for the 15-acre (6-ha) vegetation areas surrounding 14
observation wells located in reach 2 of the Gila River Phreatophyte Project. The regression equation for this relationship is
W=-0.64 (£)+45.4 (21) where
W= depth to water (table level, in feet). The coefficient of correlation is 0.67. The coefficient of correlation associated with equation 21 is not high, but an inverse relationship between depth to vater and irradiance is apparent for depths of less than 30 ft (9 m).
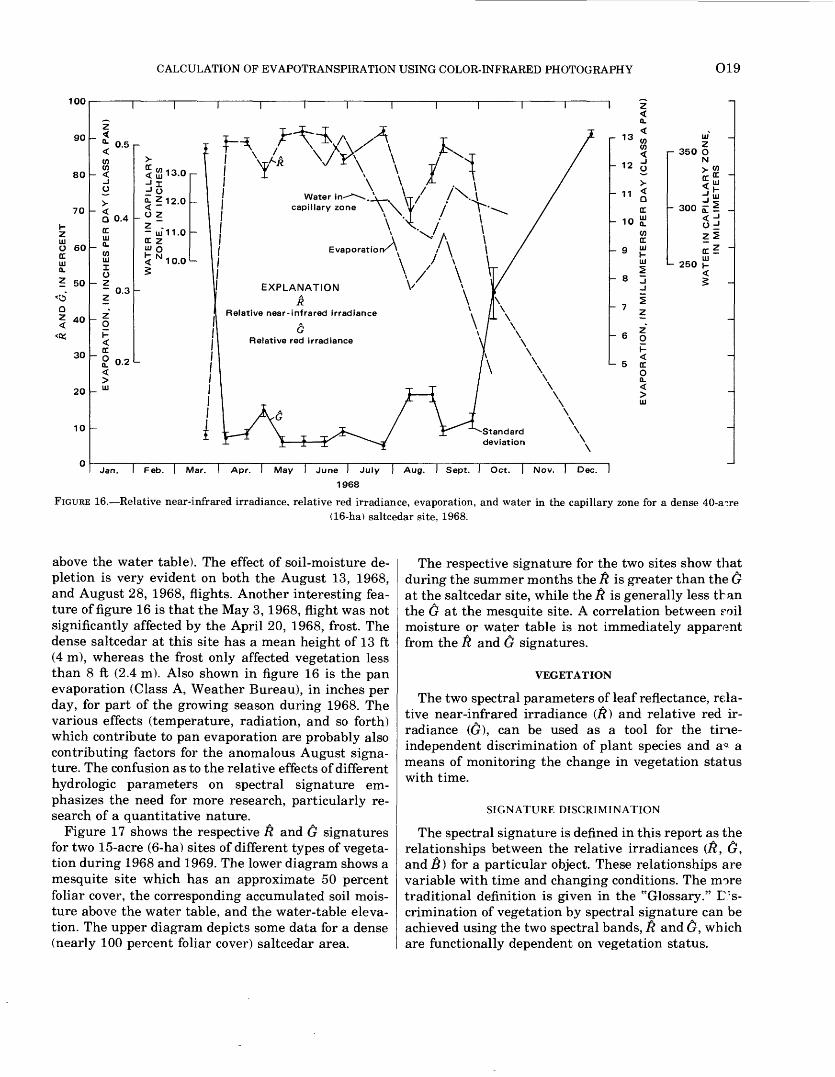
The relationship between soil-moisture depletion, which results in plant stress, and the resulting change in spectral signature is implied by figure 16, which shows the £ and & signature curves for 1968 for the dense saltcedar growth located in grid 24-2 (see fig. 1). Below the $ curve is a plot of a quantity of wrter in the capillary zone (defined for this analysis as the quantity of water, in inches, from the water table to 3 ft (0.9 m)
30.0
25.0
20.0
15.0
10.0
5.0
8
4
10 20 30 40 50 60 70 80
RELATIVE NEAR-INFRARED IRRADIANCE, IN PERCENT
EXPLANATION
W Depth to water, in feet
R Relative near-infrared irradience
Coefficient of correlation
90 100
Data for June 27, 1968
Standard error of estimate
Observation wellRelative neer-infrared irradiance was measured
in a 15-acre area eround each well
FIGURE 15. Depth to water versus relative near-infrared irradiance, reach 2 of the Gila River PhreatophyteProject.
CALCULATION OF EVAPOTRANSPIRATION USING COLOR-INFRARED PHOTOGRAPHY O19
100
90
80
70
I- 2UJO 60DC UJ Q.
40
30
20
10
2<°- 0.5
>
Q 0.4
CO UJ1O2~ 0.3
< ft 13.0
^0-. Z 12.0<O 2
- ui" 11.0DC 2UJ o
S N 10.0 §
EXPLANATION
R Relative near-infrared irradiance
r 13
- 12
- 11
DC lOff
toDC
9 ^ID I13_ji2
h- 8
- 6
- 5
2350 O
N
300 5- £o=J2!£-
L- 250 h
Jan. T Feb. I Mar. I Apr. I May I June I July I Aug. I Sept. I Oct. I Nov. 1 Dec^I
1968
FIGURE 16. Relative near-infrared irradiance, relative red irradiance, evaporation, and water in the capillary zone for a dense 40-a?re(16-ha) saltcedar site, 1968.
above the water table). The effect of soil-moisture de pletion is very evident on both the August 13, 1968, and August 28, 1968, flights. Another interesting fea ture of figure 16 is that the May 3,1968, flight was not significantly affected by the April 20, 1968, frost. The dense saltcedar at this site has a mean height of 13 ft (4 m), whereas the frost only affected vegetation less than 8 ft (2.4 m). Also shown in figure 16 is the pan evaporation (Class A, Weather Bureau), in inches per day, for part of the growing season during 1968. The various effects (temperature, radiation, and so forth) which contribute to pan evaporation are probably also contributing factors for the anomalous August signa ture. The confusion as to the relative effects of different hydrologic parameters on spectral signature em phasizes the need for more research, particularly re search of a quantitative nature.
Figure 17 shows the respective $ and & signatures for two 15-acre (6-ha) sites of different types of vegeta tion during 1968 and 1969. The lower diagram shows a mesquite site which has an approximate 50 percent foliar cover, the corresponding accumulated soil mois ture above the water table, and the water-table eleva tion. The upper diagram depicts some data for a dense (nearly 100 percent foliar cover) saltcedar area.
The respective signature for the two sites show that during the summer months the $ is greater than the & at the saltcedar site, while the $ is generally less than the G at the mesquite site. A correlation between foil moisture or water table is not immediately apparent from the $ and & signatures.
VEGETATION
The two spectral parameters of leaf reflectance, rela tive near-infrared irradiance (&) and relative red ir radiance (d?), can be used as a tool for the time- independent discrimination of plant species and a^ a means of monitoring the change in vegetation status with time.
SIGNATURE DISCRIMINATION
The spectral signature is defined in this report as the relationships between the relative irradiances C&, &, and 6) for a particular object. These relationships are variable with time and changing conditions. The more traditional definition is given in the "Glossary." P ; s- crimination of vegetation by spectral signature can be achieved using the two spectral bands, $ and &, which are functionally dependent on vegetation status.
CU
MU
LA
TIV
E
DE
PT
H T
O W
AT
E R
,
SO
IL M
OIS
TU
RE
, D
J,N
««
^I'K
,«IM
IM
rHF
«?
BE
LO
W L
AN
DIN
IN
CH
ES
S
UR
FA
CE
Ol
Ol
Ol
Ol
0)
Ji
10
O
~i i
r0>
O
l A
W
i i
r
A A
ND
G
. IN
P
ER
CE
NT
-»W
CO
*«O
101
svlC
O(O
O
O O
OO
OO
OO
O
1II1
IIIr~
CU
MU
LA
TIV
ES
OIL
MO
IST
UR
E,
IN IN
CH
ES
DE
PT
H T
O W
AT
ER
,IN
F
EE
T,
BE
LO
W L
AN
DS
UR
FA
CE
O
to o
<D O)
~»
«_ > o
§ 2. -
ZO
~
CD _
IS3
IS3
KJ
IS3
KJ
-»
-»00
0)
^
IS3
O
00
O>
i i
i i
r
8 H
O
H
-^
CJ
^
Wo
o
O
O
DE
PT
H T
O W
AT
ER
, C
UM
ULA
TIV
E
IN M
ET
ER
S,
SO
IL M
OIS
TU
RE
, B
EL
OW
LA
ND
IN
M
ILLIM
ET
ER
S
SU
RF
AC
E
I I
I I
I I
I I
I I
] I
1 I
o
1
o
SO
O
o
o
DE
PT
H T
O W
AT
ER
,C
UM
ULA
TIV
E
IN M
ET
ER
S,
SO
IL M
OIS
TU
RE
, B
EL
OW
LA
ND
IN
M
ILLIM
ET
ER
S
SU
RF
AC
E
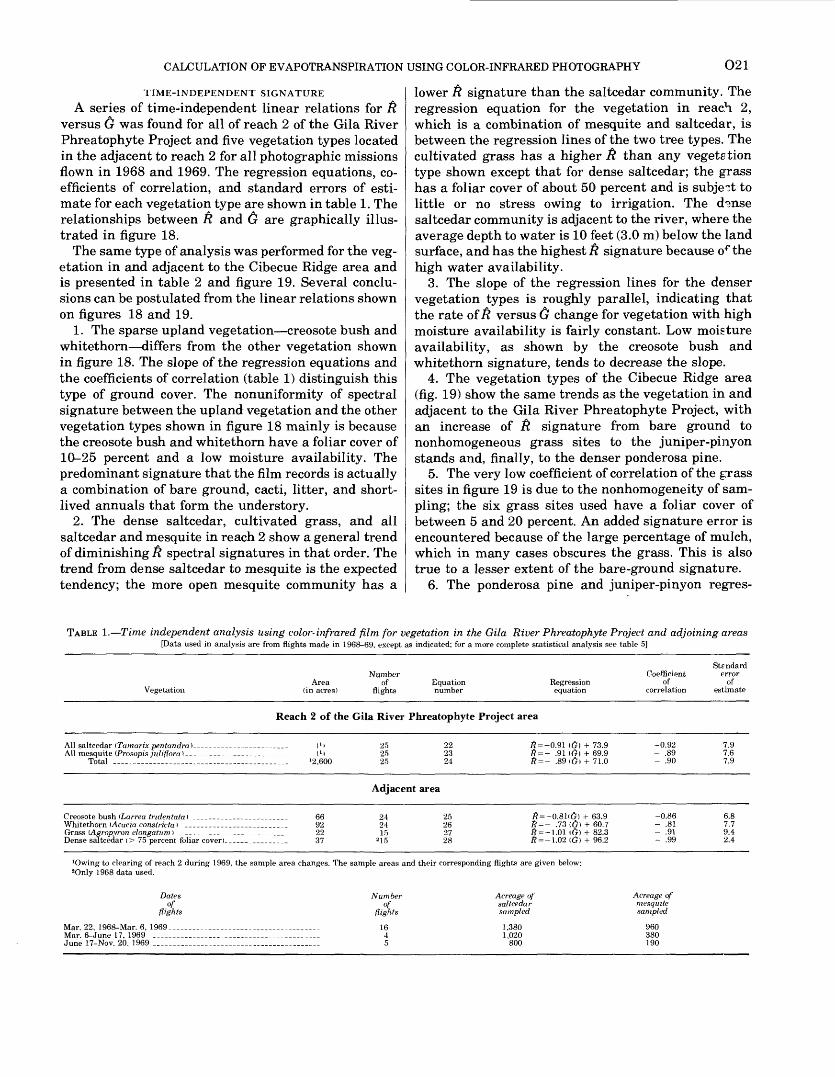
CALCULATION OF EVAPOTRANSPIRATION USING COLOR-INFRARED PHOTOGRAPHY O21
TIME-INDEPENDENT SIGNATURE
A series of time-independent linear relations for P. versus (j was found for all of reach 2 of the Gila River Phreatophyte Project and five vegetation types located in the adjacent to reach 2 for all photographic missions flown in 1968 and 1969. The regression equations, co efficients of correlation, and standard errors of esti mate for each vegetation type are shown in table 1. The relationships between ft and (j are graphically illus trated in figure 18.
The same type of analysis was performed for the veg etation in and adjacent to the Cibecue Ridge area and is presented in table 2 and figure 19. Several conclu sions can be postulated from the linear relations shown on figures 18 and 19.
1. The sparse upland vegetation creosote bush and whitethorn differs from the other vegetation shown in figure 18. The slope of the regression equations and the coefficients of correlation (table 1) distinguish this type of ground cover. The nonuniformity of spectral signature between the upland vegetation and the other vegetation types shown in figure 18 mainly is because the creosote bush and whitethorn have a foliar cover of 10-25 percent and a low moisture availability. The predominant signature that the film records is actually a combination of bare ground, cacti, litter, and short lived annuals that form the understory.
2. The dense saltcedar, cultivated grass, and all saltcedar and mesquite in reach 2 show a general trend of diminishing ft spectral signatures in that order. The trend from dense saltcedar to mesquite is the expected tendency; the more open mesquite community has a
lower $ signature than the saltcedar community. The regression equation for the vegetation in reach 2, which is a combination of mesquite and saltcedar, is between the regression lines of the two tree types. The cultivated grass has a higher ft than any veget&tion type shown except that for dense saltcedar; the grass has a foliar cover of about 50 percent and is subject to little or no stress owing to irrigation. The d^nse saltcedar community is adjacent to the river, where the average depth to water is 10 feet (3.0 m) below the land surface, and has the highest £ signature because of the high water availability.
3. The slope of the regression lines for the denser vegetation types is roughly parallel, indicating that the rate of ft versus (j change for vegetation with high moisture availability is fairly constant. Low moisture availability, as shown by the creosote bush and whitethorn signature, tends to decrease the slope.
4. The vegetation types of the Cibecue Ridge area (fig. 19) show the same trends as the vegetation in and adjacent to the Gila River Phreatophyte Project, with an increase of ft signature from bare ground to nonhomogeneous grass sites to the juniper-pinyon stands and, finally, to the denser ponderosa pine.
5. The very low coefficient of correlation of the grass sites in figure 19 is due to the nonhomogeneity of sam pling; the six grass sites used have a foliar cover of between 5 and 20 percent. An added signature error is encountered because of the large percentage of mulch, which in many cases obscures the grass. This is also true to a lesser extent of the bare-ground signature.
6. The ponderosa pine and juniper-pinyon regres-
TABLE 1. Time independent analysis using color-infrared film for vegetation in the Gila River Phreatophyte Project and adjoining areas[Data used in analysis are from nights made in 1968-69, except as indicated; for a more complete statistical analysis see table 5]
Vegetation
NumberArea of Equation
(in acres) flights numberRegression equation
Coefficientof
correlation
Stendard error
of estimate
Reach 2 of the Gila River Phreatophyte Project area
2525
222324
£ = -0.91 «3) + 73.9
#-- .89(6) + 71.0
-0.92- .89- .90
7.97.67.9
Adjacent area
Creosote bush (Larrea tridentata)Whitethorn (Acacia constricta I - .
_____ 66
22
24 25
27
8KRft
--0.811(5) + 63.9
= -1.01 (6) + 82.3= -1.02 (6) + 96.2
-0.86 .51- .91- .99
6.87.7 9.42.4
'Owing to clearing of reach 2 during 1969, the sample area changes. The sample areas and their corresponding flights are given below: 2Only 1968 data used.
Datesof
flights
Mar. 22, 1968-Mar. 6, 1969 _ Mar. 6-June 17, 1969 __. June 17-Nov. 20, 1969 __.
Numberof
flights
1645
Acreage of saltcedar sampled
1,3801,020
800
Acreage of mesquite sampled
960380190
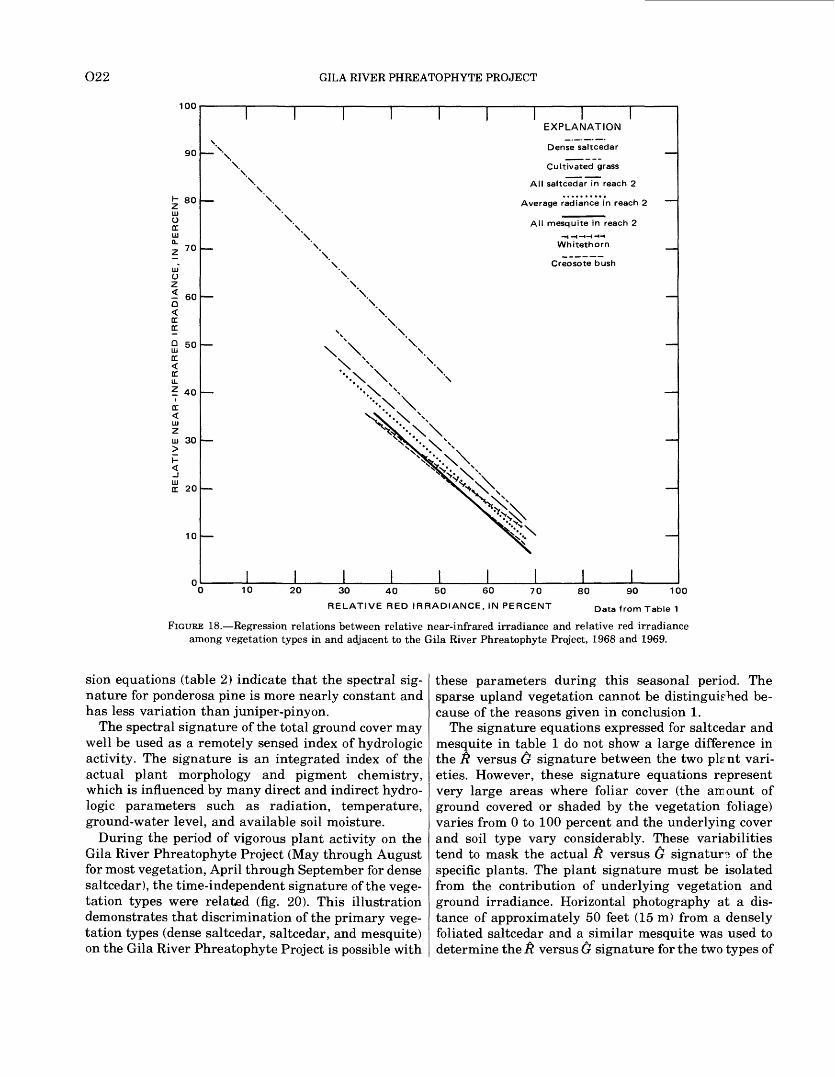
O22 GILA RIVER PHREATOPHYTE PROJECT
100
90
80
UJOz< 60Q
CC CC
S 50CC
CC u_? 40
i CC
UJ
30
CC 20
10
\
\
EXPLANATION
Dense saltcedar
Cultivated grass
All saltcedar in reach 2
Average radiance in reach 2
All mesquite in reach 2 <-H I-I-H-I
Whitethorn
Creosote bush
10 20 30 40 50 60 70
RELATIVE RED IRRADIANCE, IN PERCENT
80 90 100
Data from Table 1
FIGURE 18. Regression relations between relative near-infrared irradiance and relative red irradiance among vegetation types in and adjacent to the Gila River Phreatophyte Project, 1968 and 1969.
sion equations (table 2) indicate that the spectral sig nature for ponderosa pine is more nearly constant and has less variation than juniper-piny on.
The spectral signature of the total ground cover may well be used as a remotely sensed index of hydrologic activity. The signature is an integrated index of the actual plant morphology and pigment chemistry, which is influenced by many direct and indirect hydro- logic parameters such as radiation, temperature, ground-water level, and available soil moisture.
During the period of vigorous plant activity on the Gila River Phreatophyte Project (May through August for most vegetation, April through September for dense saltcedar), the time-independent signature of the vege tation types were related (fig. 20). This illustration demonstrates that discrimination of the primary vege tation types (dense saltcedar, saltcedar, and mesquite) on the Gila River Phreatophyte Project is possible with
these parameters during this seasonal period. The sparse upland vegetation cannot be distinguished be cause of the reasons given in conclusion 1.
The signature equations expressed for saltcedar and mesquite in table 1 do not show a large difference in the $ versus & signature between the two plrnt vari eties. However, these signature equations represent very large areas where foliar cover (the amount of ground covered or shaded by the vegetation foliage) varies from 0 to 100 percent and the underlying cover and soil type vary considerably. These variabilities tend to mask the actual ft versus & signature of the specific plants. The plant signature must be isolated from the contribution of underlying vegetation and ground irradiance. Horizontal photography at a dis tance of approximately 50 feet (15 m) from a densely foliated saltcedar and a similar mesquite was used to determine the ft versus & signature for the two types of
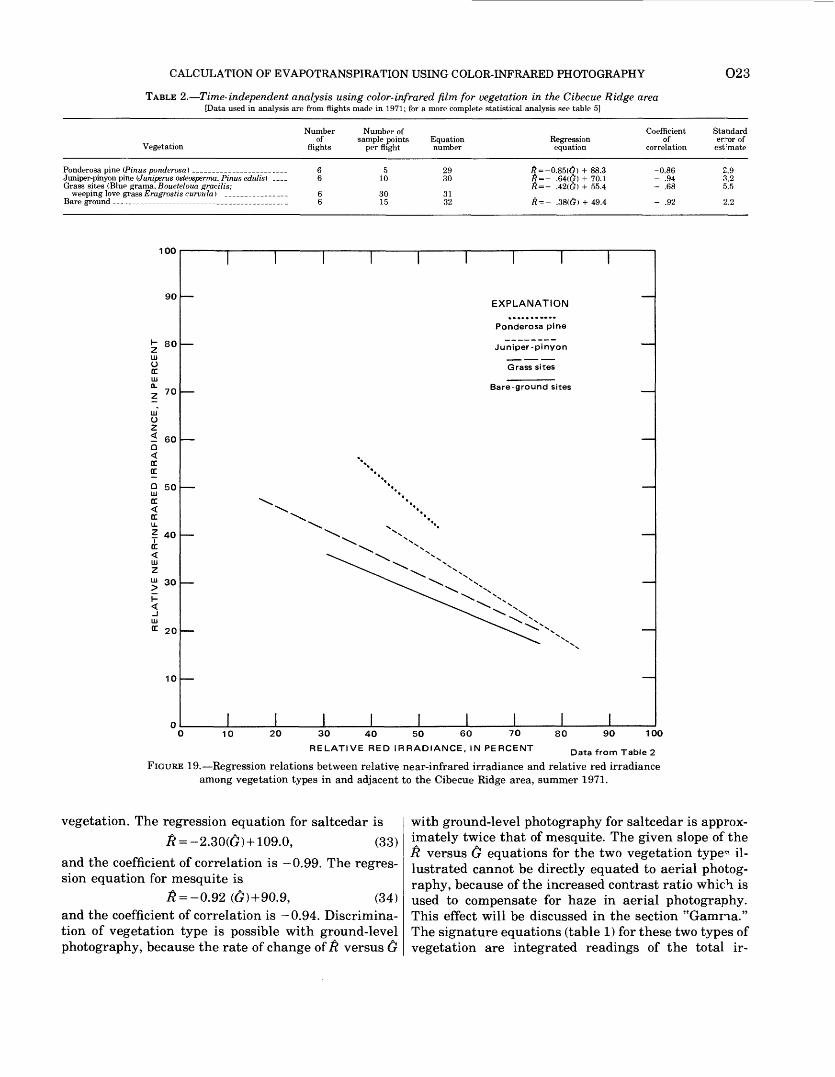
CALCULATION OF EVAPOTRANSPIRATION USING COLOR-INFRARED PHOTOGRAPHY
TABLE 2. Time-independent analysis using color-infrared film for vegetation in the Cibecue Ridge area[Data used in analysis are from flights made in 1971; for a more complete statistical analysis see table 5]
O23
Vegetation
Juniper-pinyon pine (Juniperus osfeos; Grass sites (Blue grama, Boueteloui
weeping love grass Eragrostis cw
perma, Pinus edidis} ____ i gracilis; "vula} _ _
Number of
flights
6 6
6 6
Number of sample points
per flight
5 10
3015
Equation number
29 30
31 32
Regression equation
ft = -0.85(6) + 88.3 # = - .64(6) + 70.1 & = - .42(6) + 55.4
Coefficient of
correlation
-0.86 - .94 - .68
- .92
Standard error of est : mate
2.9 3.2 5.5
2.2
100
90
I- 80
inoDC 111
t 70
m Oz< 60O<DC DC
Q 50
40DC
30
20
10
EXPLANATION
Ponderosa pine
Juniper-pinyon
Grass sites
Bare-ground sites
10 20 80 90 10030 40 50 60 70
RELATIVE RED IRRADIANCE, IN PERCENT Data from Table 2
FIGURE 19. Regression relations between relative near-infrared irradiance and relative red irradiance among vegetation types in and adjacent to the Cibecue Ridge area, summer 1971.
vegetation. The regression equation for saltcedar is£ = -2.30(6) +109.0, (33)
and the coefficient of correlation is 0.99. The regres sion equation for mesquite is
£ = -0.92 (6)+90.9, (34) and the coefficient of correlation is 0.94. Discrimina tion of vegetation type is possible with ground-level photography, because the rate of change of$ versus &
with ground-level photography for saltcedar is approx imately twice that of mesquite. The given slope of the ft versus dr equations for the two vegetation type*" il lustrated cannot be directly equated to aerial photog raphy, because of the increased contrast ratio which is used to compensate for haze in aerial photography. This effect will be discussed in the section "Gamma." The signature equations (table 1) for these two types of vegetation are integrated readings of the total ir-
O24 GILA RIVER PHREATOPHYTE PROJECT
100
90
80
70
60
DC DC
Q 50
DC
Z 40
zLU 30
DC 20
10
EXPLANATION
Dense saltcedar
D Saltcedar
Mesquite
Whitethorn
Creosote bush
Vegetation zone
10 20 80 90 10030 40 50 60 70
RELATIVE RED IRRADIANCE, IN PERCENT
FIGURE 20. Relative near-infrared irradiance versus relative red irradiance for five vegetation types in and adjacent to the Gila River Phreatophyte Project, summer 1968 and 1969.
radiance from the photographed surface. For precise discrimination of plant type by aerial photogaphy, the relative contributions of each ground parameter (short-lived ephemeral plants, soil, water, and others) should be evaluated.
TIME-DEPENDENT SIGNATURE
The spectral signature change with time is used to monitor a dynamic phenomenon, and this precludes its use as a predictive tool; however, a model curve can be used to determine the departure of the spectral signa ture from the expected value, thus enabling the re searcher to see trends and anomalies which should be investigated. The variability of the $ and <j spectral signature change with time is shown in figure 21; ft, G, and the modeling curves are given for all of reach 2 during 1968 and 1969.
The general model curve used in this study has four distinct segments. First, is a linear segment for the
mean spectral signature during the period of dormancy of the deciduous vegetation, from late fall to early spring (4-1' on the/?' curve). Two nonlinear segments, 1-2 and 3-4, on the R' curve (fig. 21) represent the transition from winter dormancy to high summer plant activity and from high summer plant activity to winter dormancy, respectively; these segments are described by equation 35. The last is a linear segment (2-3 of the R' curve) derived by assuming linearity between the two peaks of the bimodal curve from equation 35. These peaks occur on May 19 and August 11. This segment is assumed to represent the average summer maximum plant activity value.
The generalized form for the equations describing the model curves are given below:
R' =[H(sin N+l/5 sin 3N) +P] x 100, (35)
whereR' = value of the model curve for relative near-
CALCULATION OF EVAPOTRANSPIRATION USING COLOR-INFRARED PHOTOGRAPHY O25
1968 1969
EXPLANATION
Relative red irradiance
Model curve for relative red irradiance
Relative near-infrared irradiance
1Model curve for relative near-in
frared irradiance; number indicates atimeofchange in the spectral signature of vegetation
FIGURE 21. Relative near-infrared irradiance, relative red irradiance, and model curves, reach 2 of the Gila River PhreatophyteProject, 1968 and 1969.
infrared irradiance, in percent, H - the amplitude of the sine wave for relative
near-infrared irradiance, P = the mean relative near-infrared irradiance
during dormancy, and N a function of time, expressed as
whered = the calendar-year day on which the photo
graphic mission was flown [January 1,0 = 1; December 31, 0=365 or 366 (leap year)],
D = calendar-year day for the end of dormancy de termined by the low relative near-infrared irradiance, and
L duration, in days, for the period of plant vigor, determined by the change in relative near- infrared irradiance,
and G' = {/T[sin(180°+/n +
1/5 sin(1800 +37V')]+P'}xlOO, (36) where
G' = value of the model curve for relative red irradiance, in percent,
H' = the amplitude of the sine wave, for relative
red irradiance, P' = the mean relative red irradiance during
dormancy, and N' = a function of time, expressed as
whereD' = calendar-year day for the end of dormancy
determined by the high relative red ir radiance and
L' = duration, in days, for the period of plant vigor, determined by the change in relative red irradiance.
The actual model equations used for figure 21 are given below:
#'=[0.47(sin7V + l/5 sin 37V)+0.03]x 100, (37)
where
214
' = {0.48[sin(180°+7V') + l/5 sin+ 3An]+0.76}xlOO, (38)
where
O26 GILA RIVER PHREATOPHYTE PROJECT
245
The accuracy of fit of the model equations to spectral data was checked by relating the data from the 233 data points presumed to be representative of the change of signature with time to the predicted values from iheR' model equation 37 represented in figure 21. The standard error of estimate (Sv, x ) from the line of equality of 0.04 is shown in figure 22.
The time-dependent plant signature (£ and G) of various types of vegetation are shown on figure 23, and curves similar to those of figure 21 could be developed.
Several observations can be made with the aid of the model curve.
1. The time-dependent signature of large areas can be used to recognize and map vegetation types by using the sensing bands of satellite imagery in a similar manner to that proposed here for aerial photography. The 9- or 18-day cycle of LANDSAT is ideal for monitoring these changes.
2. Probably the most useful application of the model curve for aerial photography is to determine a schedule of flights to define the periods of growth at a particular study site. The minimum number of flights during a year to define the growth periods reliably for the Gila River Phreatophyte Project, as indicated by figure 21, is five: one taken during the period of dormancy (November through February), one during the spring transition period (April 1), two taken while the plants are vigorously active (June 1, July 30), and one during the fall transition period (September 30). For a long term investigation where only one flight per year is feasible, it would appear that sometime in June is the best choice for this particular area.
3. The transition period, from dormancy to vigorous activity as sensed by the G sensitivity range, was not the same in 1968 as it was in 1969. The transition period started approximately 1 month later and ended 1 month earlier in 1968 than in 1969. The reflectance in the visual spectral range, of which G (red color) is functionally related, which responds to photosynthetic activity, is well documented (Knipling, 1970, p. 158; Gates, 1970, p. 226). This time lag in activity between 1968 and 1969 is probably a function of many interre lated contributing variables such as radiation, temper ature, rainfall, and others.
4. These modeling techniques were not successful on the Cibecue Ridge area, primarily because the pre dominant vegetation is perennial and the small signa-
3Only data from 23 of the 25 photographic missions flown during 1968 and 1969 were used in this computation because of the reasons given in footnote 2.
cc O< DCCC U-"- I-
50
40
R= 1.00 R + 0.00 r = 0.98 x = 0.04
0 10 20 30 40 50
RELATIVE NEAR-INFRARED IRRADIANCE, IN PERCENT FROM TIME-DEPENDENT MODEL EQUATION
EXPLANATION
Relative near-infrared irradiance sensed by the filmR'
Relative near-infrared irradiance predicted by the model equation
r Coefficient of correlation
Sy.X Standard error of estimate
1968A
1969
FIGURE 22. Regression relation between relative near-infrared ir radiance determined from film and from a time-dependent model equation, reach 2 of the Gila River Phreatophyte Project, 1968 and 1969.
ture change with time is largely over-shadowed by the inherent error in the photography.
SPATIAL COMPUTER ANALYSIS
The .6 versus G signatures can also be used as a means of spatial evaluation. Figure 24 shows the tri chromatic coordinates subdivided into 10 percent sub groups. The first digit indicates the percent of .6, and the second digit the percent of £; for example, the number 72 means 70 percent relative near-infrared ir radiance and 20 percent relative red irradiance. The remaining parts out of a hundred, in this case 10 per cent, signify the relative green irradiance. Figure 25 shows a computer printout of the ft and & trichromatic
CALCULATION OF EVAPOTRANSPIRATION USING COLOR-INFRARED PHOTOGRAPHY O27
l_ 90
u 80O 70
UJ 60Q.2 50
" 4°
Z 20
5 10
NOTE: Irregularity of spectral signature mainly is due to irrigation
90CULTIVATED GRASS STUDY SITE
Z 80UJO 70
60
- 40 'S 30
§20 < 10
1 I I I
WHITETHORN STUDY SITE
CREOSOTE BUSH STUDY SITE
i I i I II II
ALL MESQUITE IN REACH 2
S ' O ' N1969
ALLSALTCEDAR IN REACH 2
EXPLANATION
G = Relative red irradiance & = Relative near-infrared irradiance
FIGURE 23. Relative near-infrared irradiance and relative red irradiance versus time for five vegetation types in and adjacent to the Gila River Phreatophyte Project area, 1968 and 1969.
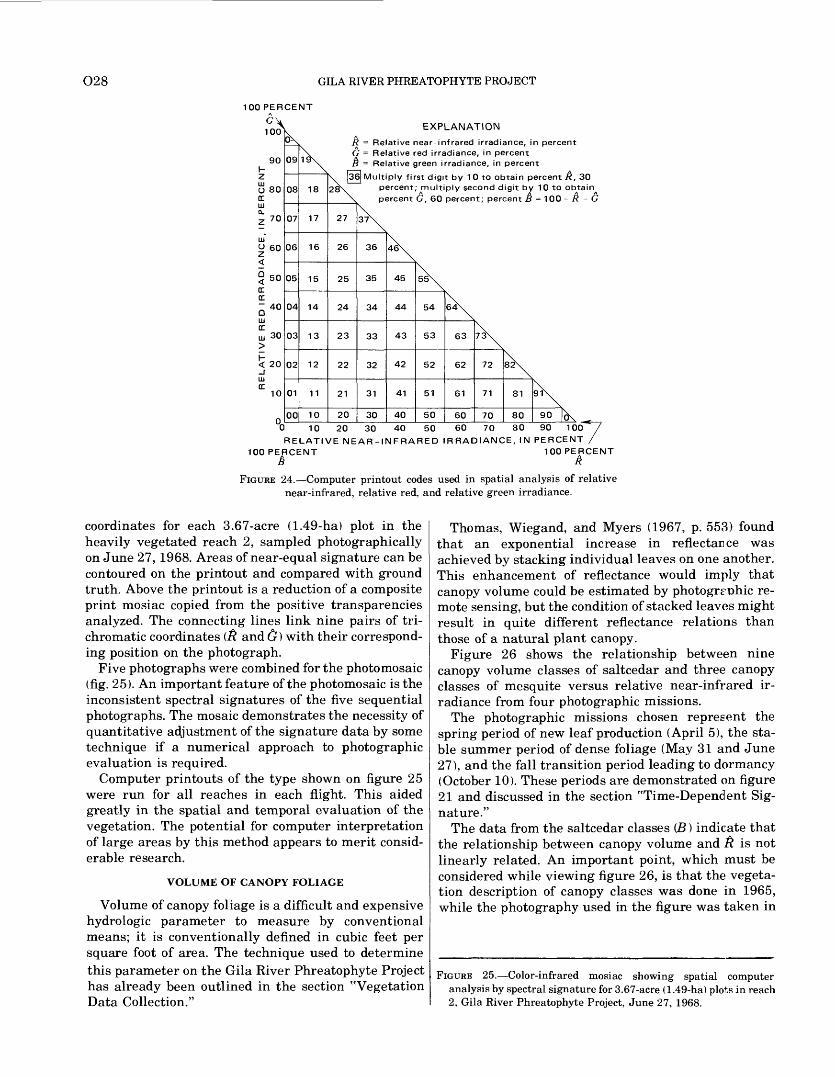
O28 GILA RIVER PHREATOPHYTE PROJECT
100 PERCENT
100
90t- Z
U 80OC
O 60
50
4°
30
< 20
10
EXPLANATIONox
09
08
07
06
05
04
03
02
01
00
N18
17
16
15
14
13
12
11
10
G &
\HB28\
27
26
25
24
23
22
21
20
= Relative near- infrared irradiance, in percent ' = Relative red irradiance, in percent = Relative green irradiance, in percent
i] Multiply first digit by 1 0 to obtain percent R, 30 percent; multiply second digit by 10 to obtain^ percent G, 60 percent; percent B = 100 - R - G
37\
36
35
34
33
32
31
30
46\
45
44
43
42
41
40
55\
54
53
52
51
50
64\
63
62
61
60
73\
72 82\
71 81 91\
70 80 90 [Q\
'0 10 20 30 40 50 60 70 80 90 100
RELATIVE NEAR-INFRARED IRRADIANCE, IN PERCENT /100 PERCENT100 PERCENT
Ba n
FIGURE 24. Computer printout codes used in spatial analysis of relative near-infrared, relative red, and relative green irradiance.
coordinates for each 3.67-acre (1.49-ha) plot in the heavily vegetated reach 2, sampled photographically on June 27, 1968. Areas of near-equal signature can be contoured on the printout and compared with ground truth. Above the printout is a reduction of a composite print mosiac copied from the positive transparencies analyzed. The connecting lines link nine pairs of tri chromatic coordinates (P, and G) with their correspond ing position on the photograph.
Five photographs were combined for the photo mosaic (fig. 25). An important feature of the photomosaic is the inconsistent spectral signatures of the five sequential photographs. The mosaic demonstrates the necessity of quantitative adjustment of the signature data by some technique if a numerical approach to photographic evaluation is required.
Computer printouts of the type shown on figure 25 were run for all reaches in each flight. This aided greatly in the spatial and temporal evaluation of the vegetation. The potential for computer interpretation of large areas by this method appears to merit consid erable research.
VOLUME OF CANOPY FOLIAGE
Volume of canopy foliage is a difficult and expensive hydrologic parameter to measure by conventional means; it is conventionally defined in cubic feet per square foot of area. The technique used to determine this parameter on the Gila River Phreatophyte Project has already been outlined in the section "Vegetation Data Collection."
Thomas, Wiegand, and Myers (1967, p. 553) found that an exponential increase in reflectance was achieved by stacking individual leaves on one another. This enhancement of reflectance would imply that canopy volume could be estimated by photographic re mote sensing, but the condition of stacked leaves might result in quite different reflectance relations than those of a natural plant canopy.
Figure 26 shows the relationship between nine canopy volume classes of saltcedar and three canopy classes of mesquite versus relative near-infrared ir radiance from four photographic missions.
The photographic missions chosen represent the spring period of new leaf production (April 5), the sta ble summer period of dense foliage (May 31 and June 27), and the fall transition period leading to dormancy (October 10). These periods are demonstrated on figure 21 and discussed in the section "Time-Dependent Sig nature."
The data from the saltcedar classes (B) indicate that the relationship between canopy volume and $ is not linearly related. An important point, which must be considered while viewing figure 26, is that the vegeta tion description of canopy classes was done in 1965, while the photography used in the figure was taken in
FIGURE 25. Color-infrared mosiac showing spatial computer analysis by spectral signature for 3.67-acre (1.49-ha) plots in reach 2, Gila River Phreatophyte Project, June 27, 1968.
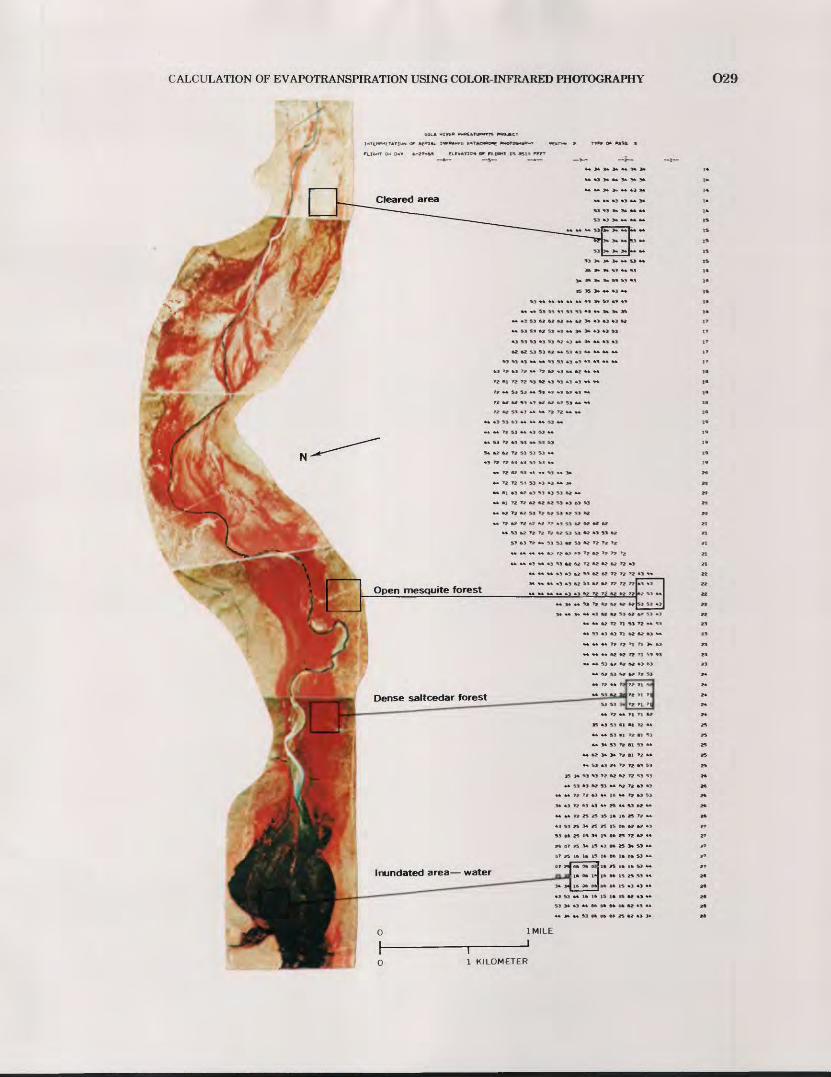
CALCULATION OF EVAPOTRANSPIRATION USING COLOR-INFRARED PHOTOGRAPHY O29
IL* «»E» pnOEnrorwrn MOJCCT
I4L INFWWOr
6-27-aa ELE»»TICTJ» OF PLIB4T IS BSffn
1 KILOMETER

O30 GILA RIVER PHREATOPHYTE PROJECT
1 1 1 1 1 1 1EXPLANATION
4- 5-68 Partial foliation _._._._ 5_3i-68 Full -foliation
6-28-68 Full foliationAverage Range 10-10-68 Unfoliated number Range of of 1 Standard deviation
of canopy, height, t isampled in percent in feet Pooled standard devjation of irra _
plots of area (meters) Hi»nr» f«r th 0 th roo * .,-,**
173
45
51
50-75
25-50
0-25
7 + (2.1)
7 + (2.1)
7 +(2.1)
canopy classes;4-5-68 data is7 percent
at>- UJ
< m u.O^uj 3.0LL°a: oz<LU 3 2.05 uj a30"J -S T-0>QQ-
LL
T i , . ,
\ I /
\ I '
f i \ H
i / //i / /1 / '/ / y/
A. MESQUITE
i i i i i i i
0CO
^ cc
- UJ
< UJ
ilU. ri
ft J1 sLL UJO t-
^-^
O
n10 20 30 40 50 60
RELATIVE NEAR-INFRARED IRRADIANCE, IN PERCENT70
Average number of sam pled plots
51
31166
19
30
34
23
9
6
Range of canopy, n percent of area
75-100
75-100
50 75
25-50
25-50
75-100
50-75
25-50
Range of weight, in feet
(meters)
13+(4)
13+(4)
6.5 13 (2-4)
6.5-13(2-4)
13+(4)
6.5-13(2-4) 0-6.5(0-2)
0-6.5(0-2)
0.65 (0-2)
14.0
O O "- 13.0LUcc
§ 12.0
O(n a: 11-0LUa.t- 10.0atUJ LL
0 9-0
CD
0 8.0Z
lu" 7.0O<
-I 6.0OLL
> 5.0
O
< 4.0
LLO 3.0
LLJ
2
^ 2.0
O
> i.o
1 i l l i 1 1
\ /" "
: \ / / :\ / / iy j i --- * i ___ « _ -=.. =* *
r" i \ -~ \~^^" '
\ \ iv \ \ i
\ t\ \ K} 3 j-\ ]/ ^^ ^1 ^-^"^ ~^"~^ po°lecl standard deviation of irra-
/ / \ \ canopy classes;4-5-68 data is / / \ \ "*4 percent
<, _____ L v. w. .
\ ' , \v "\>>
B. SALTCEDARi i i i i i i
-4
- 3
2
- 1
700 10 20 30 40 50 60
RELATIVE NEAR-INFRARED IRRADIANCE, IN PERCENT
FIGURE 26. Volume of canopy foliage versus relative near-infrared irradiance for photographic flights during 1968, reach 2, GilaRiver Phreatophyte Project.
1968. The effect which this time lag had on the data is unknown. Several conditions and relationships are il lustrated by figure 26. Mesquite volume (A) also seems to indicate a nonlinear relationship, although it is dif ficult to postulate any conclusions based on these data
alone, because of the limited number of canopy classes. It is apparent that although the canopy class versus irradiance curves are nonlinear, they all consistently exhibit the same general shape.
The transition period leading to dormancy, as shown
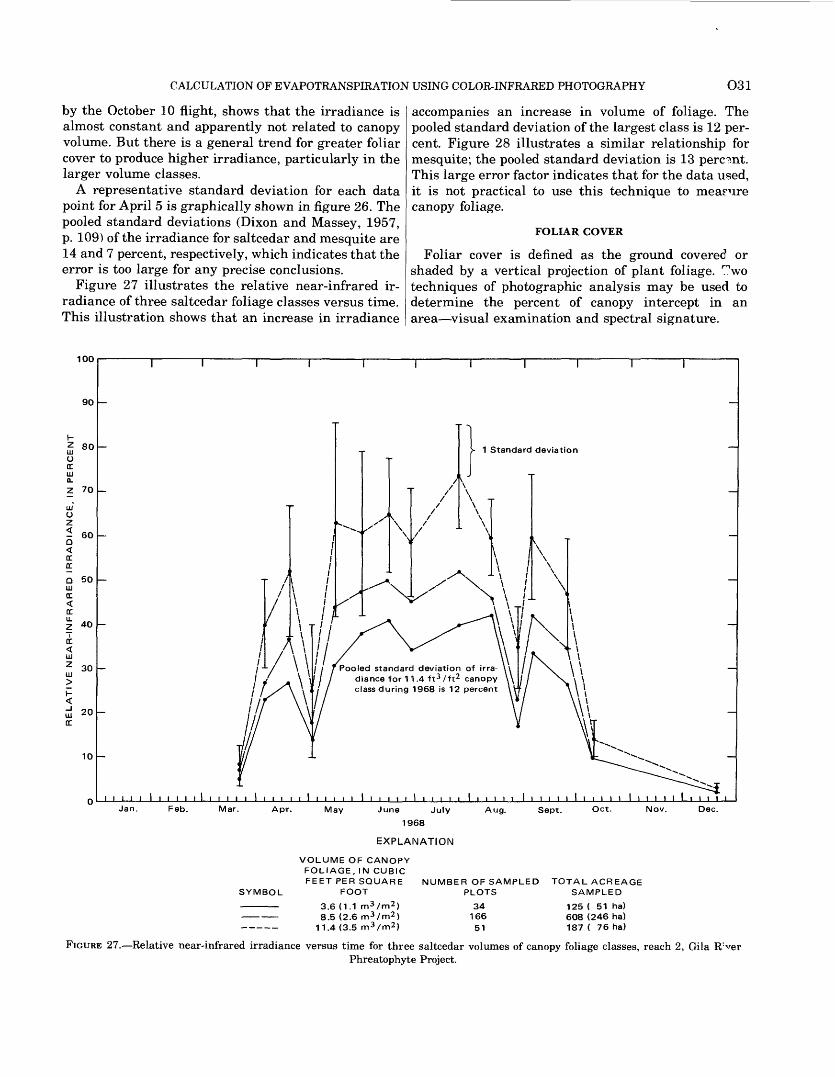
CALCULATION OF EVAPOTRANSPIRATION USING COLOR-INFRARED PHOTOGRAPHY O31
by the October 10 flight, shows that the irradiance is almost constant and apparently not related to canopy volume. But there is a general trend for greater foliar cover to produce higher irradiance, particularly in the larger volume classes.
A representative standard deviation for each data point for April 5 is graphically shown in figure 26. The pooled standard deviations (Dixon and Massey, 1957, p. 109) of the irradiance for saltcedar and mesquite are 14 and 7 percent, respectively, which indicates that the error is too large for any precise conclusions.
Figure 27 illustrates the relative near-infrared ir radiance of three saltcedar foliage classes versus time. This illustration shows that an increase in irradiance
accompanies an increase in volume of foliage. The pooled standard deviation of the largest class is 12 per cent. Figure 28 illustrates a similar relationship for mesquite; the pooled standard deviation is 13 percent. This large error factor indicates that for the data used, it is not practical to use this technique to mearure canopy foliage.
FOLIAR COVER
Foliar cover is defined as the ground covered or shaded by a vertical projection of plant foliage, ^wo techniques of photographic analysis may be used to determine the percent of canopy intercept in an area visual examination and spectral signature.
100
90
80
Z 70
oZ
< 60
DC DC
Q 50UJ CC
40
30
20
10 -
1 Standard deviation
Jan. Feb. Mar. Apr. May June July
1968
EXPLANATION
Aug. Sept. Oct. Nov. Dec.
SYMBOL
VOLUME OF CANOPYFOLIAGE, IN CUBICFEET PER SQUARE
FOOT
3.6 (1.1 m 3 /m 2 )8.5 (2.6 m 3 /m2 )
11.4 (3.5 m 3 /m2 )
NUMBER OF SAMPLED PLOTS
3416651
TOTAL ACREAGE SAMPLED
125 ( 51 ha) 608 (246 ha) 187 ( 76 ha)
FIGURE 27. Relative near-infrared irradiance versus time for three saltcedar volumes of canopy foliage classes, reach 2, Gila R: verPhreatophyte Project.
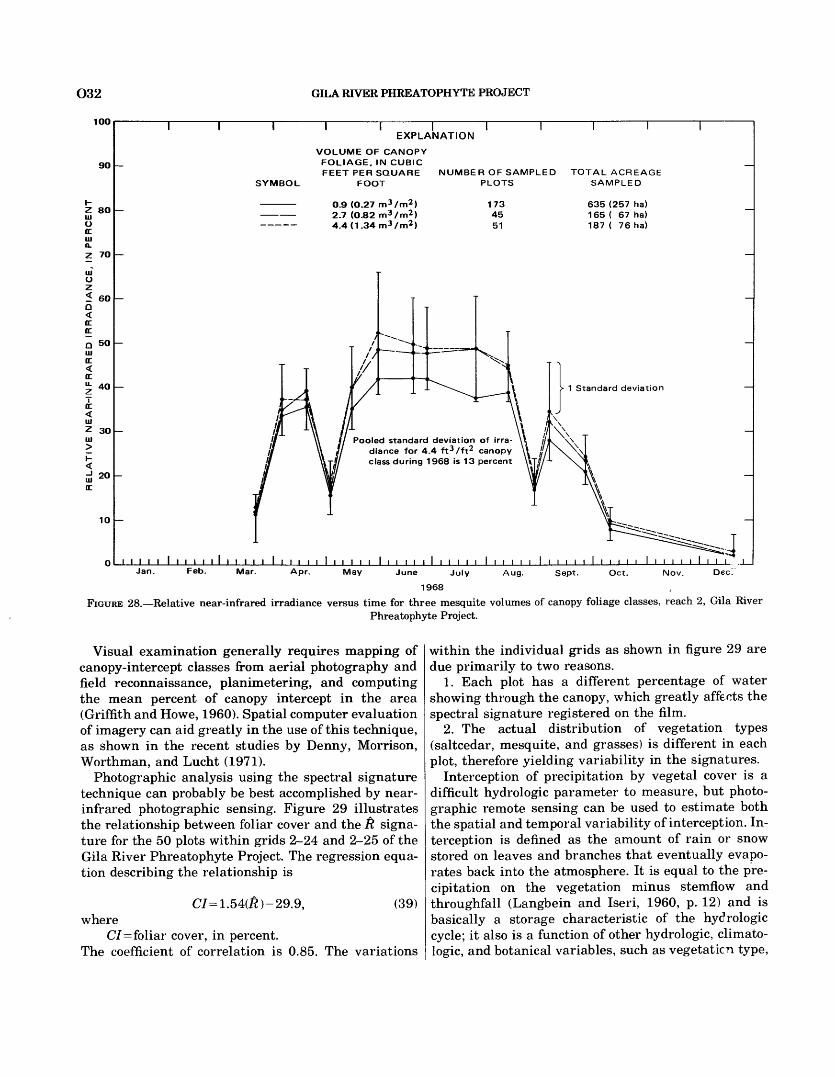
O32
100
9O
Z 80til U DC 111 OLZ 70
Uz5 60Q<DCDC
Q 50
£ 40
DC <111
Z 30
20
10
GILA RIVER PHREATOPHYTE PROJECT
EXPLANATION
SYMBOL
VOLUME OF CANOPYFOLIAGE, IN CUBICFEET PER SQUARE
FOOT
O.9 (O.27 m 3 /m2 ) 2.7 (O.82 m 3 /m2 ) 4.4(1.34m3/m2 )
NUMBER OF SAMPLED PLOTS
1734551
TOTAL ACREAGE SAMPLED
635 (257 ha) 165 ( 67 ha) 187 ( 76 ha)
Pooled standard deviation of irra diance for 4.4 ft^/ft2 canopy class during 1968 is 13 percent
1 Standard deviation
Jan. Feb. Mar. Apr. May Aug. Sept. Oct. Nov. Dec!June July
1968
FIGURE 28. Relative near-infrared irradiance versus time for three mesquite volumes of canopy foliage classes, reach 2, Gila RiverPhreatophyte Project.
Visual examination generally requires mapping of canopy-intercept classes from aerial photography and field reconnaissance, planimetering, and computing the mean percent of canopy intercept in the area (Griffith and Howe, 1960). Spatial computer evaluation of imagery can aid greatly in the use of this technique, as shown in the recent studies by Denny, Morrison, Worthman, and Lucht (1971).
Photographic analysis using the spectral signature technique can probably be best accomplished by near- infrared photographic sensing. Figure 29 illustrates the relationship between foliar cover and the £ signa ture for the 50 plots within grids 2-24 and 2-25 of the Gila River Phreatophyte Project. The regression equa tion describing the relationship is
C7=1.54(£)-29.9, (39) where
CI= foliar cover, in percent. The coefficient of correlation is 0.85. The variations
within the individual grids as shown in figure 29 are due primarily to two reasons.
1. Each plot has a different percentage of water showing through the canopy, which greatly affects the spectral signature registered on the film.
2. The actual distribution of vegetation types (saltcedar, mesquite, and grasses) is different in each plot, therefore yielding variability in the signatures.
Interception of precipitation by vegetal cover is a difficult hydrologic parameter to measure, but photo graphic remote sensing can be used to estimate both the spatial and temporal variability of interception. In terception is defined as the amount of rain or snow stored on leaves and branches that eventually evapo rates back into the atmosphere. It is equal to the pre cipitation on the vegetation minus stemflow and throughfall (Langbein and Iseri, 1960, p. 12) and is basically a storage characteristic of the hydrologic cycle; it also is a function of other hydrologic, climato- logic, and botanical variables, such as vegetation type,
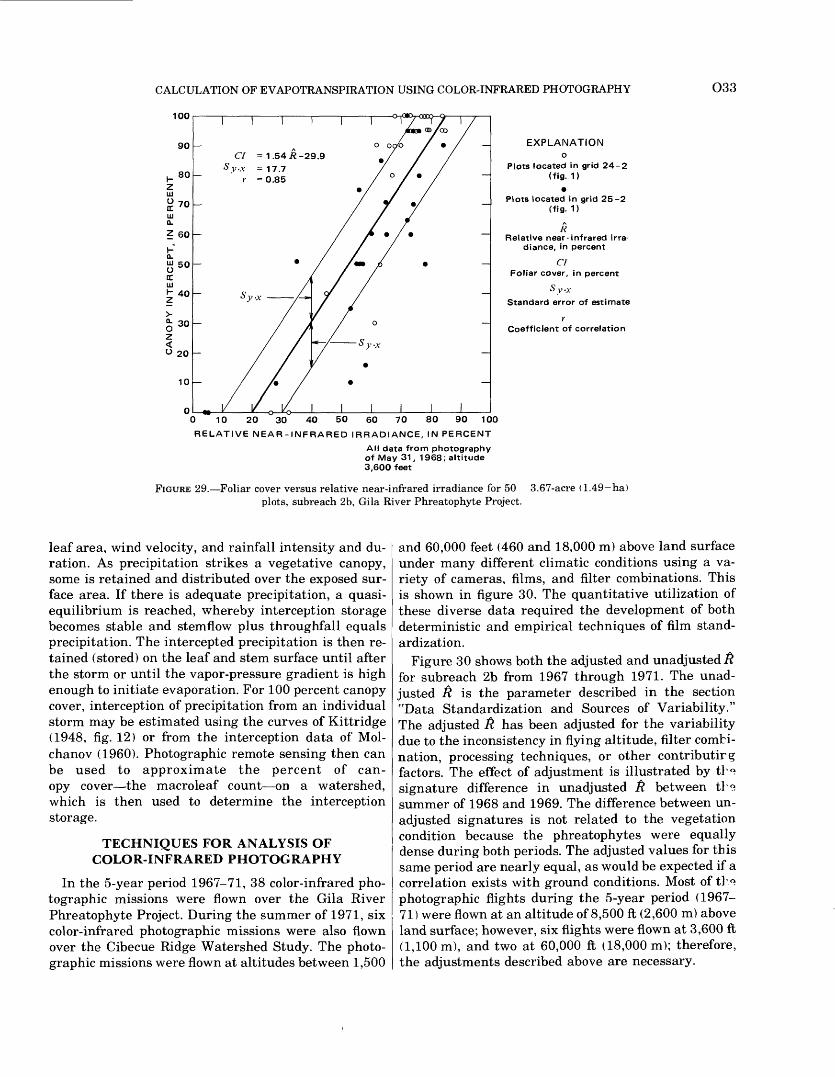
CALCULATION OF EVAPOTRANSPIRATION USING COLOR-INFRARED PHOTOGRAPHY
100i i i i i i l / 1 / 1 /
mm» <a>/oo /EXPLANATION
O33
a. Z 60
CI = 1.54 #-29.9Sy.x =17.7
r = 0.85
Plots located in grid 24-2(fig. 1)
Plots located in grid 25-2
(fig- D
Relative near-infrared irra- diance, in percent
CI Foliar cover, in percent
Syx
Standard error of estimate
r Coefficient of correlation
50
40
30
20
10
0 10 20 30 40 50 60 70 80 90 100
RELATIVE NEAR-INFRARED IRRADIANCE, IN PERCENT
All data from photography of May 31, 1968; altitude 3,600 feet
FIGURE 29. Foliar cover versus relative near-infrared irradiance for 50 3.67-acre (1.49 ha) plots, subreach 2b, Gila River Phreatophyte Project.
leaf area, wind velocity, and rainfall intensity and du ration. As precipitation strikes a vegetative canopy, some is retained and distributed over the exposed sur face area. If there is adequate precipitation, a quasi- equilibrium is reached, whereby interception storage becomes stable and stemflow plus throughfall equals precipitation. The intercepted precipitation is then re tained (stored) on the leaf and stem surface until after the storm or until the vapor-pressure gradient is high enough to initiate evaporation. For 100 percent canopy cover, interception of precipitation from an individual storm may be estimated using the curves of Kittridge (1948, fig. 12) or from the interception data of Mol- chanov (1960). Photographic remote sensing then can be used to approximate the percent of can opy cover the macroleaf count on a watershed, which is then used to determine the interception storage.
TECHNIQUES FOR ANALYSIS OF COLOR-INFRARED PHOTOGRAPHY
In the 5-year period 1967-71, 38 color-infrared pho tographic missions were flown over the Gila River Phreatophyte Project. During the summer of 1971, six color-infrared photographic missions were also flown over the Cibecue Ridge Watershed Study. The photo graphic missions were flown at altitudes between 1,500
and 60,000 feet (460 and 18,000 m) above land surface under many different climatic conditions using a va riety of cameras, films, and filter combinations. This is shown in figure 30. The quantitative utilization of these diverse data required the development of both deterministic and empirical techniques of film stand ardization.
Figure 30 shows both the adjusted and unadjusted £ for subreach 2b from 1967 through 1971. The unad justed £ is the parameter described in the section "Data Standardization and Sources of Variability." The adjusted ft has been adjusted for the variability due to the inconsistency in flying altitude, filter combi nation, processing techniques, or other contributirg factors. The effect of adjustment is illustrated by th« signature difference in unadjusted ^ between th? summer of 1968 and 1969. The difference between un adjusted signatures is not related to the vegetation condition because the phreatophytes were equally dense during both periods. The adjusted values for this same period are nearly equal, as would be expected if a correlation exists with ground conditions. Most of th« photographic flights during the 5-year period (1967- 71) were flown at an altitude of 8,500 ft (2,600 m) above land surface; however, six flights were flown at 3,600 ft (1,100 m), and two at 60,000 ft (18,000 m); therefore, the adjustments described above are necessary.
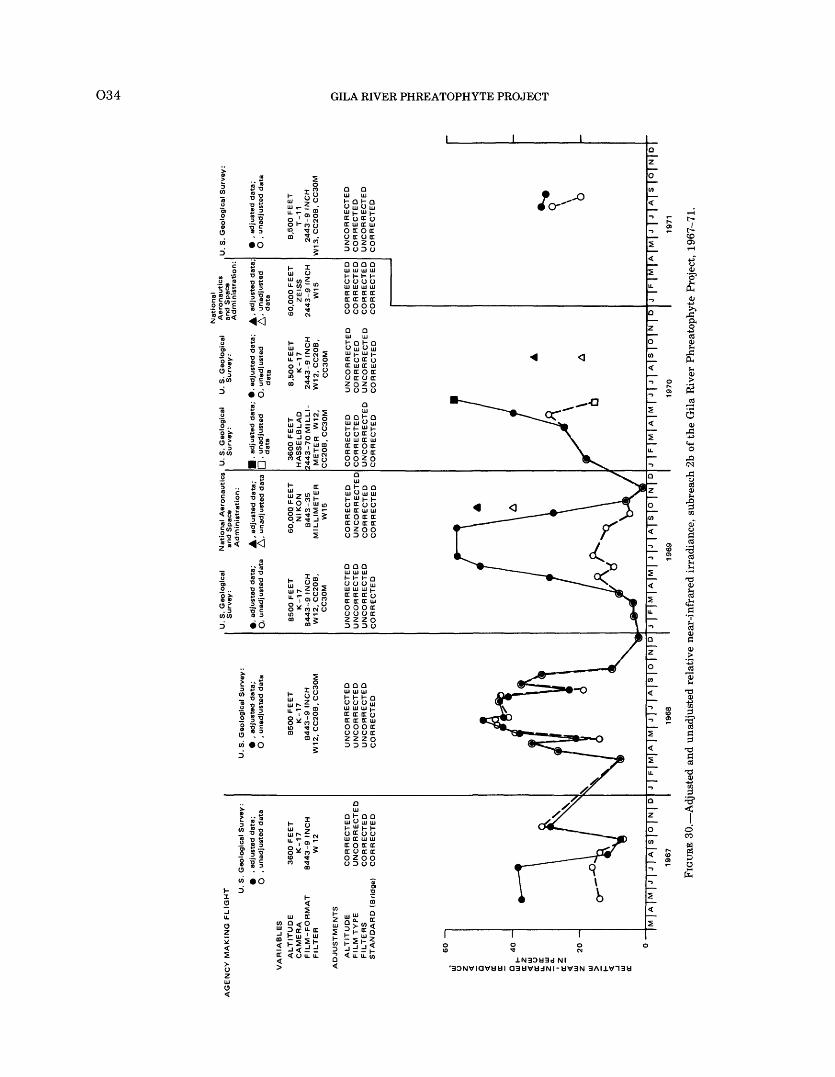
RELATIVE NEAR-INFRARED IRRADIANCE, IN PERCENT
O Z
fa- pi 3
3 - T
o
SI S
xoar OHd axAHdOxvanHd HSAIH viio
CALCULATION OF EVAPOTRANSPIRATION USING COLOR-INFRARED PHOTOGRAPHY O35
COST OF PHOTOGRAPHIC ANALYSIS
The cost in 1968 of using conventional techniques to assess the vegetation on the Gila River Phreatophyte Project (the technique is outlined in the section "Vege tation Data Collection") was approximately $6,600, while the cost of a color-infrared photographic mission and a complete computer analysis of the photographic data cost approximately $650.
BASIC PHOTOGRAPHIC CONCEPTS
The analysis of photographic remote sensing data requires a basic knowledge of the fundamentals of pho tographic science. Spectral sensitivity, density versus log exposure, and analytic optical density are photo graphic topics necessary for the type of analysis utilized in this report.
SPECTRAL SENSITIVITY
Spectral sensitivity, S(X), for color-infrared film is defined as follows:
S(X) = 1/E(X), (40)
where E(X) is the energy in ergs/cm2 of monochromatic radiation required to produce in the individual dye layer an equivalent neutral density, usually 1.0 (N.L. Fritz, 1969, written commun.). Equivalent neutral density (END) is defined as the visual density a dye layer would have if it were converted to a neutral gray by superimposing the minimum necessary amounts of dye in the other two dye layers (Todd and Zakia, 1969, p. 215-219).
The relationship between wavelength sensitivity and color formulation of color-infrared film was discus sed in the section "Color-Infrared Film" and was dem onstrated in figures 2 and 3.
Multigeneration photography such as received from NASA during the study refers to the fact that the color-infrared photography has been duplicated on color film for data analysis. A quantitative analysis of the data must include consideration of the sensitivity of the duplicated and duplicating films.
FILM DENSITY VERSUS EXPOSURE
The relationship between film density and exposure was discussed in the section "Color-Infrared Film" and shown in figure 4.
BASE PLUS FOG DENSITY
Base plus fog density (Z)0 ) may be referred to as the fog level of the film. It is the optical density obtained after processing film which has received no exposure and is the result of chemical reduction by the developer on unexposed grains. For example, the base plus fog
level for the cyan dye layer in figure 4 is an optical density of approximately 3.6. The actual base plus fog densities of the dye layers of film type 8443 analyzed with our equipment are shown below:
Cyan Do =2.76,Magenta Do =1.38, andYellow Do = 2.22.
GAMMA
Gamma (y) is the slope of the linear portion of the characteristic curve:
AODy=Alog E
(41)
A perfect tone reproduction of a scene is obtained when the gamma is equal to 1 (for positive film), and a gamma less than -1 means that the scene is repro duced at a higher contrast. (This discussion applies to positive film only; a negative film would have a posi tive gamma.) Aerial films, such as color-infrared film, which are used for high-altitude photography usually have gammas of approximately -2.0. The reason for the low gamma of aerial films is because the original scene contrast is greatly reduced by atmospheric at tenuation, and the lower gamma compensates for this.
The gammas for the dye layers of film type 8443 as analyzed by our equipment were:
Cyan y= -2.00, Magenta y= -0.81, and Yellow y= -2.82.
DATA STANDARDIZATION AND SOURCES OF VARIABILITY
The use of color-infrared photography as a tool for the quantitative monitoring of ground-scene changes with time requires the standardization of the data taken from the film. Certain sources of variability from one photographic flight to another and within a roll of film can be controlled by consistent practices and care ful planning. Controllable variables are camera, film, filter combinations, flying altitude, and certain proce dures in the film processing. Variability in the data from these sources can to some degree be controlled by consistency, or if necessary, by mathematical adjust ments. Other sources of variability, such as atmcs- pheric changes, film-emulsion variation, and film- processing changes and inconsistency, are less deter ministic in nature, and the investigator has very little control over these sources of error. Variability in the data from these sources are very difficult to correct without elaborate instrumentation and calibration and, to a large degree, must be adjusted by an empiri cal approach if precise calibration is not available.
Theoretically, the standardizations of photographic
O36 GILA RIVER PHREATOPHYTE PROJECT
data for such variables as atmospheric attenuation, solar altitude, and filter transmittance should be made as exposure adjustments for the film gamma. This was not done for two reasons: (1) the high cost involved in precisely measuring the energy radiated from the ground scene and subsequently sensed by the film and (2) the high error involved in measuring hydrologic phenomenon such as evapotranspiration.
As pointed out previously (in the section "Photo graphic Data Collection"), each dye layer of the film was viewed as a relative radiometer, and the irradi- ance sensed in each dye layer was related to the sum of the irradiance sensed by the three dye layers. For clarification the reader should refer back to equations 3, 4, 5, 6, and 7.
ANALYTIC OPTICAL DENSITY
Analytic optical density is defined as the optical den sity within the individual dye layers of a multidye layer film. The necessity for isolating the individual dye-layer spectral contribution is illustrated in figure 2 by the spectral sensitivity curves for color-infrared film. It should be borne in mind that these curves (fig. 2) are only for the film and do not show the effect of the instrumentation (filters, lenses, densitometer, and so forth) used for analysis. The color density measured by the densitometer in each selected wavelength band (fig. 7) is the sum of the radiation absorbed by all three of the dye layers.
Several techniques are available for isolating the exposure in each of the three dye layers. The process used in the following analysis involves selective expo sure yielding a step tablet in this case a film strip graduated in transparency from one end to the other, for each dye layer of the film. The relative contribution of each dye layer in the three sensing bands was then isolated algebraically through the use of a matrix in version (Evans and others, 1952, p. 441-447).
The step tablets were analyzed using the transmit tance densitometer (Macbeth TD 402) by recording the three optical densities (R0d, God, B0d) transmitted at each exposure step of each step tablet. These were then plotted graphically with the major optical density (Rc for the cyan dye layer) versus the two minor optical densities (Gc and Bc for the cyan dye layer) for each step tablet (the slope of the major optical density of the dye layer taken as 1, fig. 31). The slopes of the major versus minor optical densities for each dye layer were then entered into a 3x3 matrix (A). The inverse (A" 1 ) of the matrix (A) was then taken. CA" 1 ) was then used for the three equations to convert the three integral optical densities (R, G, B) to their respective analytic optical density (C, M, Y). Matrices (A) and (A~ l ) and the resulting analytic optical density equations for film
type 8443 analyzed with our equipment are given below:
7? 7? ]fl c fl m L£(A)8443 = Gc G m Gy =
Bc Bm Bvand
CMY
where
(A )g443 =
Therefore
« 8443
= (A-8443
1.012-0.185-0.011^
1.000 0.065 0.010.184 1 .000 0.100.046 0.192 1.00^
'8443 ^
-0.063
RGB
-0
5
8443
.0081.032 -0.107-0.195 1 .021
C8443 = 1.012CR)-0.063(G)-0.008(B),
55 (42)0__ 8443
(43)
(44)
8443
(45)= -0.185CR) + 1.032(G)-0.107(B), end (46) = -0.0111R)-0.195(G) + 1.021(S). (47)
FILM TYPE CORRECTION
During the period of study for this report, two color- infrared films were used. Film type 8443 wa? used in 1967-69; after 1969, film type 2443 was used. The 2443 film has three advantages over its predecessor: (1) bet ter infrared color balance; (2) increased overall speed; and (3) improved consistency from emulsion to emul sion. The quantitative use of the photographic data re quired that the data from film type 2443 be corrected to the same spectral response as film type 8443. The technique for accomplishing this was to premultiply the inverse type 8443 [(A"1 ^443] by a conversion ma trix, [CA)844s], which was supplied by Kodak (N. L. Fritz, written commun., 1972):
where'2443
x8443. J2443"
2443] X [(A
1.094 -0.024 -0.0090.000 0.997 0.0030.011 -0.029 1.043
(48)
(49)
It must be emphasized that the technique illustratedby equations 48 and 49 is not precise but is a usableapproximation.The solution for (A"1 ^443 is given below:
)2443 =
1.112 -0.092 -0.015-0.184 1.028 -0.104
0.005 -0.240 1.065(50)
2443
The analytic optical densities (C, M, Y) for film type 2443 were derived as shown below:
therefore,
CM Y
2443
(51)
2443
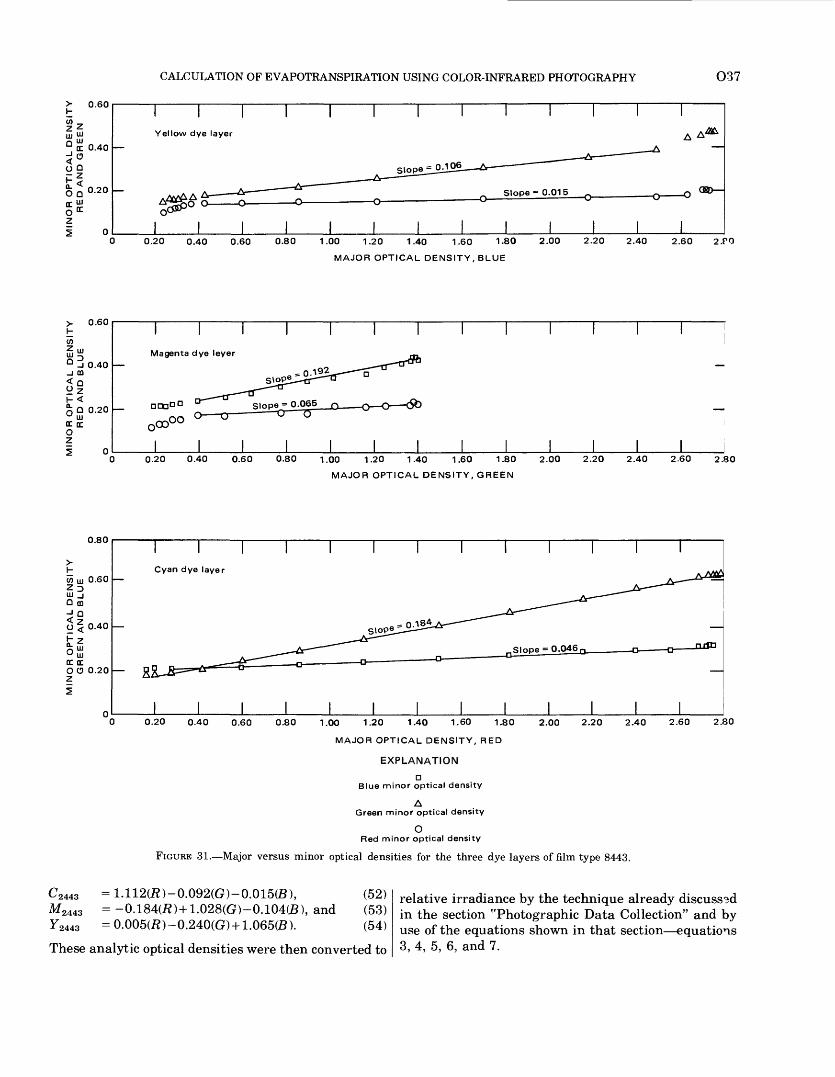
CALCULATION OF EVAPOTRANSPIRATION USING COLOR-INFRARED PHOTOGRAPHY O37
0.20 0.40 0.60 0.80 1.00 1.20 1.40 1.60 1-80 2.00 2.20 2.40 2.60
MAJOR OPTICAL DENSITY, BLUE
2.PQ
0.60
0.40
0.20
Magenta dye leyer
0.20 0.40 0.60 0.80 1.00 1.20 1.40 1.60 1.80
MAJOR OPTICAL DENSITY, GREEN
2.00 2.20 2.40 2.60 2.80
0.80
0.20 0.40 0.60 0.80 2.00 2.201.00 1.20 1.40 1.60 1.80
MAJOR OPTICAL DENSITY, RED
EXPLANATION
D Blue minor optical density
A Green minor optical density
O Red minor optical density
FIGURE 31. Major versus minor optical densities for the three dye layers of film type 8443.
2.40 2.60 2.80
= 1.112CR)-0.092(G)-0.015(B), (52)= -0.184(72) +1.028(G)-0.104(B), and (53)
^2443 = 0.005(72)-0.240(G) + 1.065(B). (54)
These analytic optical densities were then converted to
relative irradiance by the technique already discussed in the section "Photographic Data Collection" and by use of the equations shown in that section equations 3, 4, 5, 6, and 7.
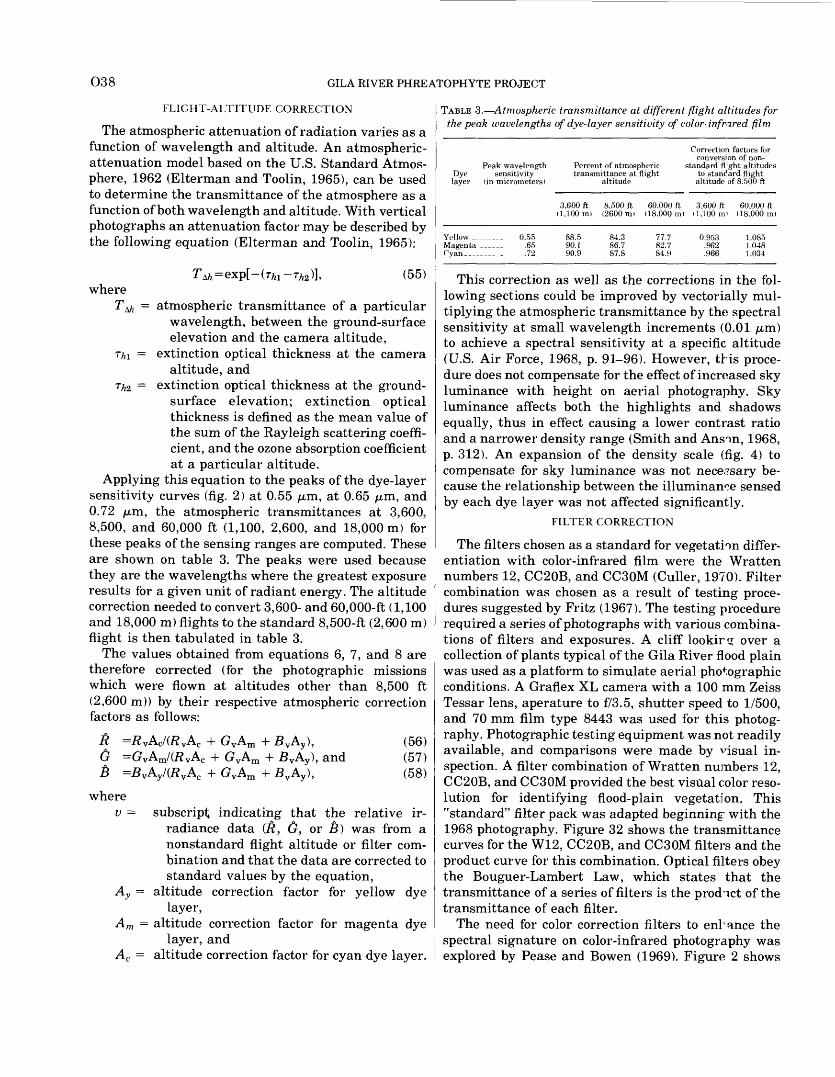
O38 GILA RIVER PHREATOPHYTE PROJECT
FLIGHT-ALTITUDE CORRECTION
The atmospheric attenuation of radiation varies as a function of wavelength and altitude. An atmospheric- attenuation model based on the U.S. Standard Atmos phere, 1962 (Elterman and Toolin, 1965), can be used to determine the transmittance of the atmosphere as a function of both wavelength and altitude. With vertical photographs an attenuation factor may be described by the following equation (Elterman and Toolin, 1965):
r__/i=exp[-(TAl rfcj)], (55) where
T atmospheric transmittance of a particular wavelength, between the ground-surface elevation and the camera altitude,
Thi extinction optical thickness at the cameraaltitude, and
r/,2 = extinction optical thickness at the ground- surface elevation; extinction optical thickness is defined as the mean value of the sum of the Rayleigh scattering coeffi cient, and the ozone absorption coefficient at a particular altitude.
Applying this equation to the peaks of the dye-layer sensitivity curves (fig. 2) at 0.55 jam, at 0.65 jam, and 0.72 (Jim, the atmospheric transmittances at 3,600, 8,500, and 60,000 ft (1,100, 2,600, and 18,000m) for these peaks of the sensing ranges are computed. These are shown on table 3. The peaks were used because they are the wavelengths where the greatest exposure results for a given unit of radiant energy. The altitude correction needed to convert 3,600- and 60,000-ft (1,100 and 18,000 m) flights to the standard 8,500-ft (2,600 m) flight is then tabulated in table 3.
The values obtained from equations 6, 7, and 8 are therefore corrected (for the photographic missions which were flown at altitudes other than 8,500 ft (2,600 m)) by their respective atmospheric correction factors as follows:
R =R VAC/(R VAC + GvAm + BvAy ),& =GvAm/(R vAc + G vAm + BvAy), andB =BvAy/(RvAc + GvAm + BvAy),
(56)(57)(58)
wherev = subscript indicating that the relative ir-
radiance data (R, Cr, or B) was from a nonstandard flight altitude or filter com bination and that the data are corrected to standard values by the equation,
Ay = altitude correction factor for yellow dye layer,
Am = altitude correction factor for magenta dye layer, and
Ac = altitude correction factor for cyan dye layer.
TABLE 3. Atmospheric transmittance at different flight altitudes for the peak wavelengths of dye-layer sensitivity of color^infrired film
Peak wavelength Dye sensitivity layer (in micrometers)
Percent of atmospherictransmittance at flight
altitude
Correction factors forconversion of non-
standard fl ;ght altitudes to standard flight altitude of 8,500 ft
3,600 ft 8,500 ft 60,000 ft 3,600 ft 60,000 ft (1,100ml (2600ml (18,000ml (1,100ml (18,000ml
Yellow _Magenta ______
0.55.65.72
88.590.190.9
84.386.787.8
77.782.784.9
0.953.962.966
1.0851.0481.034
This correction as well as the corrections in the fol lowing sections could be improved by vectorially mul tiplying the atmospheric transmittance by the spectral sensitivity at small wavelength increments (0.01 ju,m) to achieve a spectral sensitivity at a specific altitude (U.S. Air Force, 1968, p. 91-96). However, this proce dure does not compensate for the effect of increased sky luminance with height on aerial photography. Sky luminance affects both the highlights and shadows equally, thus in effect causing a lower contrast ratio and a narrower density range (Smith and Anson, 1968, p. 312). An expansion of the density scale (fig. 4) to compensate for sky luminance was not necessary be cause the relationship between the illuminance sensed by each dye layer was not affected significantly.
FILTER CORRECTION
The filters chosen as a standard for vegetation differ entiation with color-infrared film were the Wratten numbers 12, CC20B, and CC30M (Culler, 1970). Filter combination was chosen as a result of testing proce dures suggested by Fritz (1967). The testing procedure required a series of photographs with various combina tions of filters and exposures. A cliff lookir? over a collection of plants typical of the Gila River flood plain was used as a platform to simulate aerial photographic conditions. A Graflex XL camera with a 100 mm Zeiss Tessar lens, aperature to f/3.5, shutter speed to 1/500, and 70 mm film type 8443 was used for this photog raphy. Photographic testing equipment was not readily available, and comparisons were made by visual in spection. A filter combination of Wratten numbers 12, CC20B, and CC30M provided the best visual color reso lution for identifying flood-plain vegetation. This "standard" filter pack was adapted beginning: with the 1968 photography. Figure 32 shows the transmittance curves for the W12, CC20B, and CC30M filters and the product curve for this combination. Optical filters obey the Bouguer-Lambert Law, which states that the transmittance of a series of filters is the product of the transmittance of each filter.
The need for color correction filters to enhance the spectral signature on color-infrared photography was explored by Pease and Bowen (1969). Figure 2 shows
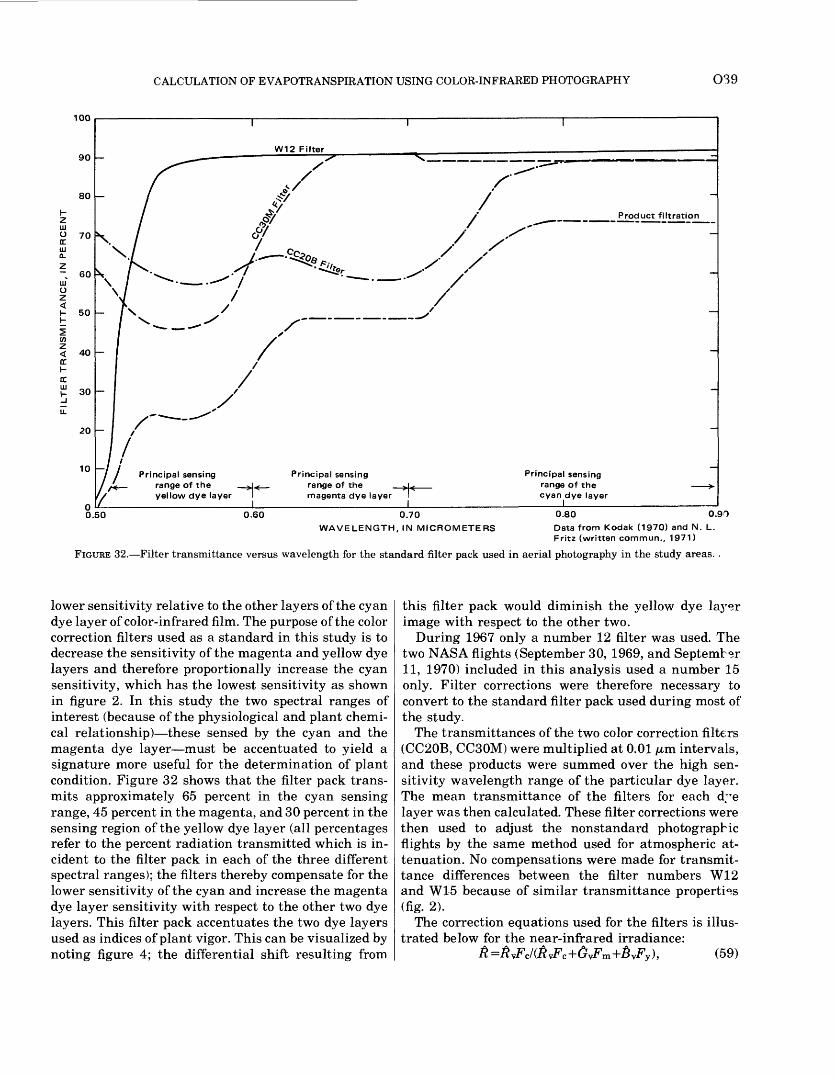
CALCULATION OF EVAPOTRANSPIRATION USING COLOR-INFRARED PHOTOGRAPHY O39
100
90
80
70
- 60
<I- 50H
5 (/)
< 40CCI-
ccHI 30
20
10
W12 Filter
/Product filtration
t '/
Principal sensingrange of the _^J^
3r Hyellow dye laye
Principal sensing range of the magenta dye layer
Principal sensing range of the cyan dye layer
0.50 0.60 0.70
WAVELENGTH, IN MICROMETERS
0.80 0.90
Data from Kodak (1970) and N. L. Fritz (written commun., 1971)
FIGURE 32. Filter transmittance versus wavelength for the standard filter pack used in aerial photography in the study areas. .
lower sensitivity relative to the other layers of the cyan dye layer of color-infrared film. The purpose of the color correction filters used as a standard in this study is to decrease the sensitivity of the magenta and yellow dye layers and therefore proportionally increase the cyan sensitivity, which has the lowest sensitivity as shown in figure 2. In this study the two spectral ranges of interest (because of the physiological and plant chemi cal relationship) these sensed by the cyan and the magenta dye layer must be accentuated to yield a signature more useful for the determination of plant condition. Figure 32 shows that the filter pack trans mits approximately 65 percent in the cyan sensing range, 45 percent in the magenta, and 30 percent in the sensing region of the yellow dye layer (all percentages refer to the percent radiation transmitted which is in cident to the filter pack in each of the three different spectral ranges); the filters thereby compensate for the lower sensitivity of the cyan and increase the magenta dye layer sensitivity with respect to the other two dye layers. This filter pack accentuates the two dye layers used as indices of plant vigor. This can be visualized by noting figure 4; the differential shift resulting from
this filter pack would diminish the yellow dye la}Ter image with respect to the other two.
During 1967 only a number 12 filter was used. The two NASA flights (September 30, 1969, and September 11, 1970) included in this analysis used a number 15 only. Filter corrections were therefore necessary to convert to the standard filter pack used during most of the study.
The transmittances of the two color correction filters (CC20B, CC30M) were multiplied at 0.01 /mi intervals, and these products were summed over the high sen sitivity wavelength range of the particular dye layer. The mean transmittance of the filters for each d;re layer was then calculated. These filter corrections were then used to adjust the nonstandard photographic flights by the same method used for atmospheric at tenuation. No compensations were made for transmit tance differences between the filter numbers W12 and W15 because of similar transmittance properties (fig. 2).
The correction equations used for the filters is illus trated below for the near-infrared irradiance:
m +&vF), (59)
O40 GILA RIVER PHREATOPHYTE PROJECT
whereFy = filter correction factor for the yellow dye
layer, Fm = filter correction factor for the magenta dye
layer, andFc = filter correction factor for the cyan dye layer.
The actual values for the correction factors for the specific filters cited are given below:
Fc =0.73, Fm = 0.50, and Fy =0.35.
This filter correction could be improved by the vectorial multiplication of the filter correction and the spectral sensitivity at small increments of wavelength as pro posed for atmospheric attenuation, but it was not done because of the limitations of the study.
SOLAR ANGLE CORRECTION
The effect of solar angle (<I» should also be considered when interpreting color-infrared photography taken at different times of year or day. The solar angle, the an gular departure from the local vertical, can be calcu lated at solar noon as
<!>=latitude -solar declination. (60) The effect of solar angle on the amount of radiation reaching a reflecting source can be computed as (El- terman and Toolin, 1965)
T'=exp(-TA2 sec $), (61) where
T" = atmospheric transmittance of radiation at aparticular wave length through the totalatmosphere and
Th2 extinction optical thickness at a particularwavelength through the total atmosphereto the ground-surface elevation.
The relationships between object reflectance and solar angle, incidence look angle, and azimuth look angle are treated in Egbert and Ulaby (1972), while solar angle versus exposure is explored in Sprecht, Fritz, and Sorem (1966). The Gila River Phreatophyte Project is at latitude 33°10', and the noon solar angle that occurs during summer and winter solstice (June 21, December 22) are 9.88° and 55.62°, respectively.
A computation of the transmittances at the peak of each dye-layer sensing range for June 21 and De cember 22 are given in table 4. Table 4 shows that the maximum possible solar angle effect on the three wavelength regions of interest would be significant if all other effects were constant. During the period of plant activity (April through September) this effect is not significant at this latitude when the photographic data is analyzed as a ratio. Further evidence of this is shown in figure 33, which shows that the spectral sig-
TABLE 4. Atmospheric transmittance for the peak sensitivity of dye layers of color-infrared film at summer and winter solstice
Dye layer
Peak wavelengthsensitivity
(in micrometers 1
Percent of atmospheric transmittance
Winter solstice
Summer solstice
Ratio ofvinter solstice
to summersolstice
Yellow _ Magenta Cyan _
0.55 .65 .72
65.974.078.9
78.684.187.2
0.84
nature parameters of plant activity (&, &} are largely independent of solar angle. Figure 33A is the bare ground site shown in figure 1, while 33B is a part of the dense saltcedar site in 25-2 also shown in figure 1.
The decrease of$ and increase of & in figure 33B at 1200 hours results primarily from the high sun angle which allows irradiance from the ground between the trees to register on the photographs. The increase in $ at 1400 hours in figure 33A is more difficult to explain, but this is perhaps due to an increase in temperature of the soil which may cause a depletion of the surface soil moisture and a change in signature.
STANDARD CORRECTION
Many photographic variables, such as atmospheric changes, processing inconsistencies, and shifts in film color balance due to aging or improper storage, are very difficult to correct. Elaborate ground ins^rumen- tation data and the use of complicated sensitometric methods are necessary to derive such corrections. However, a simple empirical correction for this type of variability was attained by using the spectral signa ture of a highway bridge as a standard calibration. The necessity of a standard correction is indicated by the uncorrected signature of reach 2b during 1968 versus 1969 (fig. 30).
The basic theoretical assumptions inherent in the bridge correction procedure are given below.
1. The bridge is assumed to be a gray surface, such that the film (using the "standard" filter pack) regis ters equal quantities of energy in the three wavelength regions sensed by the individual dye layers; the photo graphic mission flown on June 27, 1968, was used as the standard photographic flight for this reason.
2. The characteristic curves (fig. 4) are superim posed at the analytic densities of the bridge readings, achieving an equivalent neutral density.
The accuracy of this empirical method is considered adequate for this'study, and although it is recognized that neither of these conditions is precisely met, the effect of error is overshadowed by the need for a usable inexpensive correction technique.
Densitometric readings of the highway bridge lo cated on the Gila River were taken on each photo graphic flight,convertedto $, &, andB by the technique
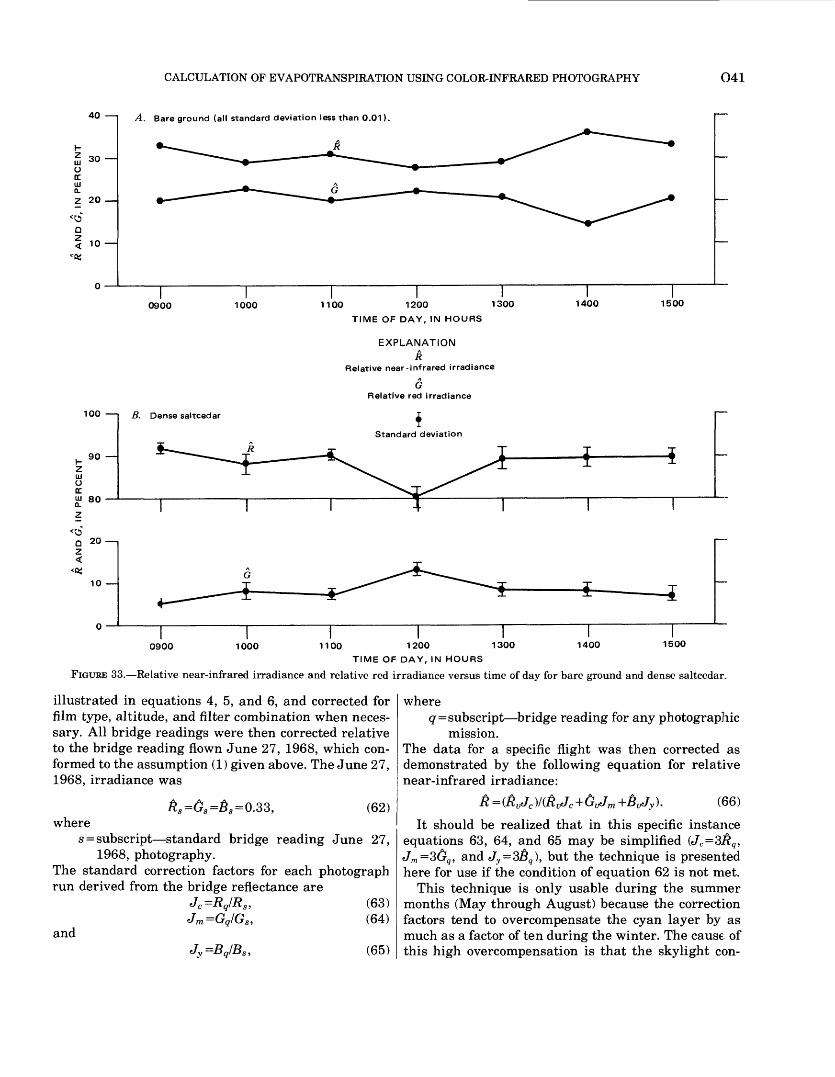
CALCULATION OF EVAPOTRANSPIRATION USING COLOR-INFRARED PHOTOGRAPHY O41
40 I
g 30 JODCUJ0.
Z 20
Q
I 10
A. Bare ground (all standard deviation less than 0.01)
R
0900 1000 1100 1200 1300
TIME OF DAY, IN HOURS
EXPLANATION
R Relative near-infrared irradiance
G Relative red irradiance
1400 1500
100 ,
Q 20Z
10
0900 1000 1400 15001100 1200 1300
TIME OF DAY, IN HOURS
FIGURE 33. Relative near-infrared irradiance and relative red irradiance versus time of day for bare ground and dense saltcedar.
illustrated in equations 4, 5, and 6, and corrected for film type, altitude, and filter combination when neces sary. All bridge readings were then corrected relative to the bridge reading flown June 27, 1968, which con formed to the assumption (1) given above. The June 27, 1968, irradiance was
RS =&S =BS =Q.33, (62) where
s = subscript standard bridge reading June 27,1968, photography.
The standard correction factors for each photograph run derived from the bridge reflectance are
<Jc =Rq/Rs , (63) Jm =Gq/Gs , (64)
andJy =Bq/Bs , (65)
whereq=subscript bridge reading for any photographic
mission.The data for a specific flight was then corrected as demonstrated by the following equation for relative near-infrared irradiance:
R =(RVJC )/(R VJC +GvJm +BVJV ), (66)
It should be realized that in this specific instance equations 63, 64, and 65 may be simplified (Jc =3Rq , Jm =3Crq , and Jy = 3&q \ but the technique is presented here for use if the condition of equation 62 is not met.
This technique is only usable during the summer months (May through August) because the correction factors tend to overcompensate the cyan layer by as much as a factor of ten during the winter. The cause of this high overcompensation is that the skylight con-
O42 GILA RIVER PHREATOPHYTE PROJECT
tribution to the cyan dye layer is much lower in the winter than in the summer, the vegetation adjacent to the bridge becomes dormant during the winter, and the effect of the scattered near-infrared radiance from this source is greatly reduced, therefore reducing the quan tity of near-infrared irradiance received by the film sensing the bridge.
STATISTICAL ANALYSIS OF VARIABLES
Extensive statistical analyses have been performed on the equations presented in this report. For the use of those interested in these evaluations, the statistical parameters are presented in table 5.
To attain significance in a quantitative study of spectral data requires a rigorous statistical approach. This is of particular importance in the study of indi vidual plant signatures, where the two primary parameters used (R,Cr) are elements of a closed system, as shown by equation 7 in the text, $+G+£ = 100 per cent. The interrelationship between variables in a closed system such as expressed in equation 7 yields a spurious correlation. For example, an increase in R dictates an equal decrease in the sum of &+B. In addi tion, the fact that the sum of the parameters is a con stant destroys the independence of both the variance and covariance and induces a bias toward a negative correlation. Therefore, the correlation coefficient of a closed system, such as that used in this report, may not be related to the conventional null hypothesis, p = 0. Chayes (1960, 1971) proposed that the expected value for a null hypothesis with this "closure restraint" may be approximated byp=(l n)" 1 , where n is the number of interrelated variables in the closed system. This value can then be utilized in the Fisher Z transforma tion (Fisher, 1950, paper 3, p. 125) to determine the distribution of the coefficient of correlation. A pictorial representation of the distribution of this transforma tion is shown by Natrella (1963, 20- le).
The normal sampling distribution at a particular confidence level can be approximated by the equation for Z given below; for ease of calculation a table ofZ values has been published in Dixon and Massey (1957, table A-30b). The equation used to determine the con fidence levels of the coefficient of correlation is
Z'r =Zr±(t')(SD), where
Z'r the maximum and minimum values of Z for the coefficient of correlation as determined by the t' distribution,
SD = 1/Vn 3, where rc=number of samples,
t' = "student" t value of a particular significance level, and
r = coefficient of correlation.This procedure was used in this report to solve for the ^max and ''min by the inverse transformation,
Similarly, the corresponding confidence levels for the null hypothesis were computed as
whereZ' p the maximum and minimum values of Z for
the null hypothesis as determined by the t' distribution,
p = value of the null hypothesis,and the values for pmax and pmin were derived by the transformation,
p=Z-l (Z'p).
This was done for both the null hypothesis and the coefficient of correlation at the 95 percent confidence level and is presented along with the value for p and r in table 5.
The percent confidence level of the computed r when related to the null hypothesis was computed by
Zp =Zr-(t')(SD\ which is then solved for t',
t' =SD
The confidence level for the t' for each computed corre lation coefficient as related to the null hypothesis is also given in table 5.
The statistical parameters shown in table 5 which have not been discussed were evaluated from the defi nitions given in Ezekiel and Fox (1963).
SUMMARY
In the 5-year period 1967-71, 38 color-infrared photographic missions were flown over the Gila River Phreatophyte Project in southeastern Arizona. Data from these missions were analyzed to determine the possibility of identifying and measuring vegetative parameters and their associated hydrologic variables by spectral analysis of the photography. Dur ; ng the summer of 1971, additional data from six color- infrared photographic missions flown over the Cibecue Ridge Watershed Study in central Arizona we^e used to test the validity of some of the techniques developed in this study.
A transmittance densitometer was used to obtain a
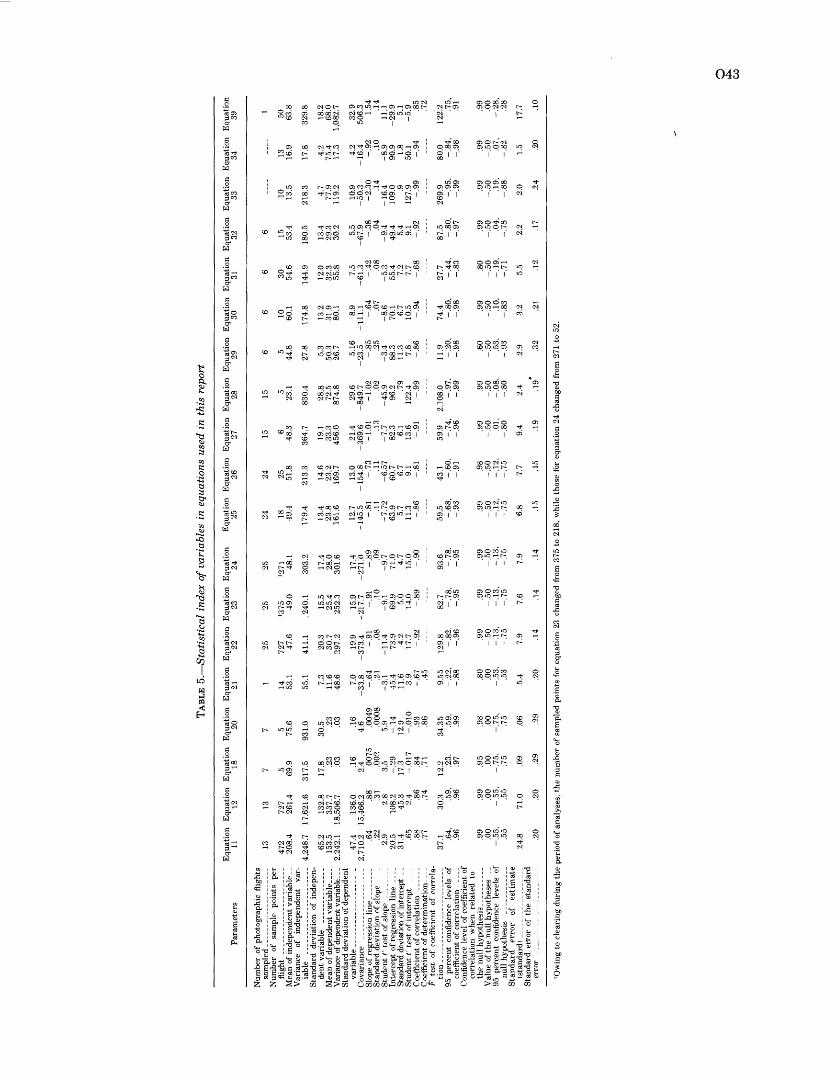
TABL
E 5.
Sta
tist
ica
l in
dex
of
vari
able
s in
equ
atio
ns u
sed
in t
his
repo
rt
Par
amet
ers
Equ
atio
n E
quat
ion
Equ
atio
n E
quat
ion
Equ
atio
n E
quat
ion
Equ
atio
n E
quat
ion
11
12
18
20
21
22
23
24E
quat
ion
Equ
atio
n E
quat
ion
Equ
atio
n E
quat
ion
Equ
atio
n E
quat
ion
Equ
atio
n E
quat
ion
Equ
atio
n E
quat
ion
25
26
27
28
29
30
31
32
33
34
39
Num
ber
of p
hoto
grap
hic
nigh
ts
Num
ber
of
sam
ple
poin
ts
per
flig
ht
____
____
____
____
____
__
472
Mea
n of
ind
epen
dent
var
iabl
e __
20
8.4
Var
ianc
e of
in
depe
nden
t va
r
iabl
e ...
_____ _ _____
4,24
8.7
Sta
ndar
d de
viat
ion
of i
ndep
en
dent
var
iabl
e ._
..
65.2
Mea
n of
dep
ende
nt v
aria
ble_
___
153.
5 V
aria
nce
of d
epen
dent
var
iabl
e _
2,24
2.1
Sta
ndar
d de
viat
ion
of d
epen
dent
Sta
ndar
d de
viat
ion
of s
lope
___
. .2
2 S
tude
nt t
' te
st o
f sl
ope
. 2.
9In
terc
ept
of re
gres
sion
lin
e __
-_
20.5
S
tand
ard
devi
atio
n of
inte
rcep
t __
31
.4
Stu
dent
t'
test
of
inte
rcep
t __
__
.65
Coe
ffic
ient
of
corr
elat
ion
____
__
.88
Coe
ffic
ient
of
dete
rmin
atio
n- _
.7
7 P
tes
t of
coe
ffic
ient
of
cor
rela
- ti
on__
___ _ ___ . ____
. 37
.195
pe
rcen
t co
nfid
ence
le
vels
of
.64,
co
effi
cien
t of
cor
rela
tion
__
__
.96
Con
fide
nce
leve
l of
coe
ffic
ient
of
corr
elat
ion
whe
n re
late
d to
Val
ue o
f the
nul
l hy
poth
eses
__
.0
0 95
pe
rcen
t co
nfid
ence
le
vels
of
.55,
Sta
ndar
d
erro
r of
es
tim
ate
Sta
ndar
d er
ror
of t
he s
tand
ard
erro
r _
_ .
_.
_ .2
0
13 727
261.
4
17,6
21.6
132.
8 33
7.7
18,5
06.7
136.
0 15
,466
.2
.88
.31
2.8
108.
2 45
.3
2.4 .8
6 .7
4
30.3
.5
9,
.96
.99
.00
-.55,
.55
71.0
.20
7 5 69.9
317.
5
17.8
.2
3 .0
3
.16
2.4 00
75
002
3.5
-.2
9
17.3
-.
01
7
.84
.71
12.2
.2
3,
.97
.95
.00
-.7
5,
.75
.09 .29
7 5 75.6
931.
0
30.5
.2
3 .0
3
.16
4.6 .0
049
.000
8 5.
9 -.
14
12
.9
-.010
.93
.86
34.3
5 .5
9,
.99
.98
.00
-.7
5,
.75
.06 .29
1 14
53.1
55.1 7.3
11.6
48
.6 7.0
-.6
4 .21
-3.1
45
.4
11.6
3.
9 -.
67
.45
9.55
-.
22
, -.
88
.80
.00
-.5
3,
.53
5.4 .2
0
25 727 47
.6
411.
1
20.3
30
.7
297.
2
19.9
-3
73
.4
-.91
.08
-11.4
73
.9
4.2
17.7
-.
92
129.
8 -.
82
, -.
96
.99
-.5
0
-.13,
-.75
7.9 .1
4
25
'375
49
.0
,240
.1
15.5
25
.4
252.
3
15.9
-2
17
.7
-.91
.10
-9.1
69
.9
5.0
14.0
-.
89
82.7
-.
78,
-.95
.99
-.5
0
-.1
3,
-.75
7.6 .1
4
25
'271
48
.1
303.
2
17.4
28
.0
301.
6
17.4
27
1.0
-.89
.09
-9.7
71
.0
4.7
15.0
-.
90
93.6
-.78,
-.95
.99
-.50
-.1
3,
-.75
7.9 .1
4
24 18
49.4
179.
4
13.4
23
.8
161.
6
12.7
-1
45.5 -.81
.11
-7.7
2
63.9
5.
7 11
.3
-.86
59.5
-.
68,
-.93
.99
-.50
-.12,
-.75
6.8 .1
5
24 25 51.8
213.
3
14.6
23
.2
169.
7
13.0
-1
54.8
-.
73
.11
-6.5
7
60.7
6.
7 9.
1 -.
81
43.1
-.
60
, -.
91
.98
-.50
-.1
2,
-.75
7.7 .1
5
15 648
.3
364.
7
19.1
33
.3
456.
0
21.4
36
9.6
-1.0
1
.13
-7.7
82
.3
6.1
13.6
-.
91
59.9
-.
74,
-.9
6
.99
-.50
.01,
-.
80
9.4 .1
9
15 5 23
.1
830.
4
28.8
72
.5
874.
8
29.6
-84
9.7
-1
.02
.02
-45
.9
96.2
.7
9 12
2.4
-.9
9
2,10
8.0
-.97,
-.99
.99
-.50
-.08,
-.80
2.4 .1
9*
6 544
.8
27.8 5.3
50.3
26
.7 5.16
-2
3.5
-.
85
.2
5 -3
.4
88.3
11
.3
7.8
-.86
11.9
-.
20
, -.
98
.60
-.50
.53,
-.
93
2.9 .3
2
6 10
60.1
174.
8
13.2
31
.9
80.1 8.9
-111
.1
-.64
.07
-8.6
70
.1
6.7
10.5
-.
94
74.4
-.9
8
.99
-.50
.10,
-.
83
3.2 .2
1
6 30
54.6
144.
9
12.0
32
.355
.8 7.5
-61.3
-.
42
.08
-5.3
55
.4
7.2
7.7
-.68
27.7
-.
44,
-.83
.80
-.5
0
-.19,
-.7
1
5.5 .1
2
6 15
53.4
180.
5
13.4
29
.3
30.2 5.5
-67.9
-.
38
.04
-9.4
49
.4
5.4
9.1
-.92
87.5
-.
80,
-.97
.99
-.5
0
.04,
-.78
2.2 .1
7
10
13.5
218.
3
4.7
77.9
11
9.2
10.9
-5
0.3
-2
.30
.14
-16
.4
109.
0 .9
127.
9 -.
99
269.
9 -.
95,
-.9
9
.99
^.50
.1
9,
-.88
2.0 .2
4
13
16.9
17.8 4.2
75.4
17
.3 4.2
-16
.4
-.9
2
.10
-8.9
90
.9
1.8
50.1
-.
94
80.0
-.84,
-.9
8
.99
-.50
.07,
-.
82
1.5 .2
0
1 50
63.8
329.
8
18.2
68
.0
1,08
2.7
32.9
50
6.3
1.54
.1
4 11
.1
-29
.9
5.1
-5.9
.8
5 .7
2
122.
2 .75,
.9
1
.99
.00
-.2
8,
.28
17.7
.10
'Ow
ing
to c
lear
ing
duri
ng t
he p
erio
d of
ana
lyse
s, t
he n
umbe
r of
sam
pled
poi
nts
for
equa
tion
23
chan
ged
from
375
to
218,
whi
le t
hose
for
equ
atio
n 24
cha
nged
fro
m 2
71 t
o 52
.
o CO
O44 GILA RIVER PHREATOPHYTE PROJECT
14 percent sample of the study area. Optical density readings in each of three primary colors of the positive transparencies were taken. The irradiance (defined in this report as energy recorded on the film) sensed from the dye concentration in each of these primary colors was determined and related to the total energy sensed by the film, achieving three parameters of relative ir radiance (near-infrared, red, and green) which were functionally related to spectral regions indicative of plant activity. These parameters were then corrected to a "standard photo flight" by adjusting the den- sitometric data for flight altitude, filter combination, film type, and a standard correction based on the spectral signature of a highway bridge located in the project area.
Remote sensing calculations of evapotranspiration from 13 photographic missions flown during 1968 were related to water-budget measurements for a 1,700-acre (689-ha) area cleared of vegetation and a 2,200-acre (891-ha) phreatophyte-covered area of the Gila River flood plain. The coefficients of correlation between the water-budget measurements and the remote sensing calculations were 0.88 for the cleared area and 0.86 for the phreatophyte-covered area. Evapotranspiration calculated from seven photographic missions flown during 1968 over a spatially homogeneous grain sor ghum field gave a coefficient of correlation of 0.93 when related to evapotranspiration computed by the Blaney-Criddle equation.
Determining depth to the ground-water level spec trally was not practical, although depths to water of less than 30 ft (9 m) had a standard error of 5.4 ft (1.6 m). Moisture content of the soil could not be de termined spectrally, but plant stress due to moisture content deficiencies was detectable. Plant-type dis crimination was possible between eight different plant communities, which included both deciduous and pe rennial species. A spectral evaluation of near-infrared versus red irradiance of these plant communities showed that each had a standard error of less than 10 percent. Computer maps of the spectral signature dis tribution for each photographic mission flown of the Gila River flood plain were found useful for spatial and temporal evaluation of vegetation. The spectral signa tures for different types of vegetation were harmoni cally modeled and used as a means of recognizing sea sonal trends and anomalies in the vegetation. When an increase in volume of canopy for both mesquite and saltcedar was noted, there was a corresponding in crease of near-infrared irradiance, but the measure ment errors of both irradiance and canopy volume were very large. However, foliar cover versus irradiance had a high coefficient of correlation, 0.85.
During this study it was determined that a color-
infrared photographic mission and a computer analysis of the photographic data for the Gila River Phreatophyte Project area cost about a tenth of the amount of conventional species classification and canopy-measurement techniques ($650 versus $6,600).
A short discussion of the derived spectral eiuations and a table of 24 statistical parameters describing the spectral and hydrologic variables is included to aid the reader in evaluating the significance of the study.
REFERENCES CITED
Blaney, H. F., and Griddle, W. D., 1962, Determining consumptive use and irrigation water requirements: U.S. Agr. Research Serv ice Tech. Bull. 1275, 59 p.
Chayes, Felix, 1960, On correlation between variables of constant sum: Jour. Geophys. Research, v. 65, no. 12, p. 4185-4193.
1971, Ratio correlation a manual for students oe petrology and geochemistry: Chicago, 111., Univ. Chicago Press, 99 p.
Gruff, R. W., and Thompson, T. H., 1967, A comparison of methods of estimating potential evapotranspiration from cliraatological data in arid and subhumid environments: U.S. Sur rey Water- Supply Paper 1839-M, 28 p.
Culler, R. C., 1970, Application of infrared color photography to the description of flood plain vegetation, in Workshop on aerial color photography in the plant sciences: Gainesville, Florida Dept. Agriculture, Div. Plant Industry, p. 159-164.
Culler, R. C., Jones, J. E., and Turner, R. M., 1972, Quantitative relationship between reflectance and transpiration of phreatophytes Gila River Test Site: Fourth Ann. Earth Re sources Program Review, Natl. Aeronautics and Space Adm., v. 3, chap. 83, p. 1-9.
Culler, R. C., and others, 1970, Objectives, methods, and environment Gila River Phreatophyte Project, Graham County, Arizona: U.S. Geol. Survey Prof. Paper 655-A, 25 p.
Denny, C. H., Morrison, E. L., Jr., Worthman, C. D., and Lucht, D. D., 1971, Automated processing of forest imagery, in Applied remote sensing of earth resources in Arizona: Uni^. Arizona, Proc. Arizona Regional Ecological Test Site Symposium, 2d, p. 111-125.
Dixon, W. J., and Massey, F. J., Jr., 1957, Introduction to statistical analysis: New York, McGraw-Hill Book Co., 488 p.
Egbert, D. D., and Ulaby, F. T., 1972, Effect of angles on reflectivity: American Soc. Photogrammetry Jour., v. 38, no. 6, p. 556-564.
Elterman, Louis, and Toolin, R. B., 1965, Atmospheric optics, in Val ley, S. L., ed. Handbook of geophysics and space environment: Cambridge, Mass., U.S. Air Force, Office Aerospace Research, Cambridge Research Labs., chap. 7, p. 1-32.
Erie, L. J., French, O. F., and Harris, Karl, 1965, Consumptive use of water by crops in Arizona: Univ. Arizona, Agr. Expt. Sta. Tech. Bull. 169, 44 p.
Evans, R. M., Hanson, W. T., Jr., and Brewer, W. L., 1952, Principles of color photography: New York, John Wiley and Sons, Inc., 709 p.
Ezekiel, Mordecai, and Fox, K. A., 1963, Methods of correlation and regression analysis: New York, John Wiley and Sons, Inc., 548 p.
Fisher, R. A., 1950, Contributions to mathematical statistics: New York, John Wiley and Sons, Inc., 43 papers.
Fritz, N. L., 1967, Optimum methods for using infrared-sensitive color film, in Workshop infrared color photography in the plant sciences: Winter Haven, Florida Dept. Agriculture, Div. Plant Industry, pt. 3, p. 1-19.
Gates, D. M., 1970, Physical and physiological properties of plants, in
CALCULATION OF EVAPOTRANSPIRATION USING COLOR-INFRARED PHOTOGRAPHY
Remote sensing with special reference to agriculture and fores try, by Committee on Remote Sensing for Aricultural Purposes: National Acad. Sci., p. 224-252.
Griffith, S. V., and Howe, R. H. L., 1960, Photo interpretation in hydrology and watershed management, in Colwell, R. N., ed.: Manual of photographic interpretation: American Soc. Photo- grammetry, p. 539-560.
Hanson, R. L., Kipple, F. P., and Culler, R. C., 1972, Changing the consumptive use of a flood plain, in Age of changing priorities for land and water: Am. Soc. Civil Engineers, Irrigation and Drain age Div. Specialty Conf., p. 309-330.
Hunter, G. T., and Bird, S. J. G., 1970, Critical terrain analysis: Am. Soc. Photogrammetry Jour., v. 36, no. 9, p. 939-952.
Kittredge, Joseph, 1948, Forest influences: New York, McGraw-Hill Book Co., 394 p.
Knipling, E. B., 1969, Leaf reflectance and image formation on color infrared film, in Johnson P. L., ed. Remote sensing in ecology,: Athens, Univ. Georgia Press, p. 17-29.
1970, Physical and physiological basis for the reflectance of visible and near-infrared radiation from vegetation: Remote Sensing Environment Jour., v. 1, no. 3, p. 155-159.
Kodak, 1970, Kodak filters for scientific and technical uses: Roches ter, New York, Eastman Kodak Company Pub. B3, 88 p.
Langbein, W. B., and Iseri, K. T., 1960, General introduction and hydrologic definitions: U.S. Geol. Survey Water-Supply Paper 1541-A, 29 p.
McDonald, C. C., and Hughes, G. H., 1968, Studies of consumptive use of water by phreatophytes and hydrophytes near Yuma, Arizona: U.S. Geol. Survey Prof. Paper 486-F, 24 p.
Molchanov, A. A., 1960, Gidrologicheskaya rol'esa, Izdatel'stvo Akademii Nauk, SSSR, Moskva, translated from the Russian by Prof. A. Gourevitch (1963): Washington, D. C., U.S. Dept. Com merce, Office Tech. Services, 407 p.
Natrella, M. G., 1963, Experimental statistics: U.S. National Bur. Standards Handb. 91, 504 p.
Pease, R. W., and Bowen, L. W., 1969, Making color infrared film amore effective high-altitude remote sensor: Remote Sensin En vironment Jour., v. 1, no. 1, p. 23-30.
Reifsynder, W. E., and Lull, H. W., 1965, Radiant energy in relat-onto forests: U.S. Dept. Agriculture Tech. Bull. 1344, 111 p.
Shreve, Forrest, 1964, Vegetation of the Sonoran Desert, in ForrestShreve and Ira Wiggins, Vegetation and flora of the SonoranDesert: Stanford Univ. Press, Calif. 2 v.
Smith, J. T., and Anson, Abraham, eds., 1968, Manual of color aerialphotography: Am. Soc. Photogrammetry, 550 p.
Sprecht, M. R., Fritz, N. L., and Sorem, A. L., 1966, The change ofaerial camera exposure with solar altitude: Photographic P-a.and Eng., v. 10, no. 3, p. 150-155.
Thomas, J. R., Weigand, C. L., Myers, V. I., 1967, Reflectance of cot ton leaves and its relation to yield: Jour. Agronomy, v. 59,p. 551-554.
Todd, H. N., andZakia, R. D., 1969, Photographic sensitometry thestudy of tone, reproduction: New York, Morgan and Morgan,Inc., 312 p.
Turner, R. M., 1971, Measurement of spatial and temporal changesin vegetation from color-IR film: Am. Soc. PhotogrammetryProc., San Francisco, ASP Fall Convention, p. 426-441.
1973, Quantitative and historical evidence of vegetationchanges along the upper Gila River, Arizona: U.S. Geol. SurreyProf. Paper 655-H, 20 p.
Veihmeyer, F. J., 1964, Evapotranspiration, in Chow, V. T., ed.,Handbook of applied hydrology: New York, McGraw-Hill BookCo., chap. 11, p. 1-38.
Wright, W. D., 1969, The measurement of colour: New York, VanNostrand Reinhold Company, 340 p.
U.S. Air Force Avionics Laboratory, 1968, Color tonereproduction Part 1, Theory Manual: U.S. Air Force AvionicsLaboratory Tech. Rept. AFAL-TR-67-164, 65 p.
[U.S.] National Weather Service, issued annually, Climatolog; caldata, Arizona: U.S. Dept. Commerce.
£? U.S. GPO:1978-794-706