calculating energy consumption of motor systems with
TRANSCRIPT
Abstract – Increasing awareness of ecological problems
forces machine manufacturers to design greener machines. This
implies amongst other things the selection of the most efficient
electric motor system for their specific application. On the
other hand, machine building applications evolve more and
more from constant speed and load characteristics to varying
speed and load applications. Therefore, the motor system that
is used evolves more and more from direct online (DOL) to
motors fed by a variable speed drive (VSD). However, current
efficiency standardization focuses on DOL applications, and
can by consequence not offer assistance to the machine builder
to select the most efficient motor-VSD combination for his
particular varying load application. The goal of this paper is to
present a methodology that allows to predict the energy
consumption for a specific motor-VSD combination and a
specific varying speed-load application, using the fairly new
concept of iso efficiency contours. By comparing the predicted
energy consumption for a number of selected combinations, the
most efficient one is revealed.
Index Terms — Variable Speed Drives, Varying Load,
Efficiency, Iso Efficiency Contours
I. INTRODUCTION
ROWING awareness of environmental issues leads to
increased social pressure to reduce energy consumption
in as many sectors as possible. This pressure affects also the
machine building sector and pushes it towards the
development of more ecological or “green” machines that
are supposed to consume considerably less energy than their
predecessors. Moreover, a machine builder who can prove
that his machine has a lower “total cost of ownership”
because of its decreased energy consumption, possesses a
serious competitive advantage.
A substantial part of the energy consumption of machines
in general is electrical energy. This is to a large extent due to
the electrical motor systems they commonly employ.
Electrical motor-driven systems account for roughly 50% of
the total electricity demand today, and approximately 65% of
the electricity used in industry is consumed by electrical
motors [2]-[3], the majority of which are induction motors.
Therefore, machine builders are nowadays confronted with
the design question: “what would be the most efficient
electrical motor system for my application?”
The fact is, however, that more and more of those
This work was partly supported by the Flemish Government (IWT),
grant IWT80144. D. Vanhooydonck and W. Symens are with Flanders' Mechatronics
Technology Centre (FMTC), Celestijnenlaan 300D, 3001 Leuven, Belgium
(e-mail: [email protected] and [email protected]). W. Deprez and J. Lemmens are with Katholieke Universiteit Leuven,
Dept. Electrical Engineering (ESAT), Div. ELECTA, Kasteelpark Arenberg
10, 3001 Heverlee, Belgium (e-mail: [email protected] and [email protected]).
K. Stockman and S. Dereyne are with Technical University College of
West-Flanders, Graaf Karel de Goedelaan 5, Kortrijk 8500, Belgium and Department of Electrical Energy, Systems and Automation, Ghent
University, Gent 9000, Belgium (e-mail: [email protected]).
applications are not constant speed applications, but a
variable speed output at the motor shaft might be required
during operation, either continuously and dynamically
varying (e.g. in hybrid cars), or as a sequence of different
stationary speed set points (e.g. in washing machines). Next
to that, the load torque might also be varying. Accurate
control of motor speed and torque is therefore required and
variable speed drives (VSD’s) are increasingly used to
facilitate this control. Moreover, certain motor types like
permanent magnet synchronous motors (PMSM’s) or
switched reluctance motors (SRM’s) inherently require
power electronic converters for their operation, and start to
penetrate the market as well.
This means, however, that classical motor efficiency
standards, like the IEC Std 60034-2-1 for efficiency
measurement and the IEC Std 60034-30 for efficiency
classification, cannot be used anymore by machine
manufacturers for the selection of the most efficient
electrical motor system (i.e. motor and VSD), since these
standards have been developed for direct-online applications
and only deal with efficiency values at rated speed and load.
This paper describes an approach, developed jointly by
three collaborating research institutes, to tackle the question:
“Given the required time-varying output speed and torque (at
the motor shaft) of my application, and given a number of
different optional motor-VSD combinations, which
combination is the most efficient one?”
In order to provide an answer to this question, the
proposed approach specifies how to calculate, for a specific
motor-VSD combination, a prediction of the energy
consumption during the specific torque-speed trajectory that
is required by the application. By doing so for each optional
combination and by comparing the predicted consumptions,
the most efficient combination is revealed.
For the calculation of the consumed energy, the proposed
approach uses the concept of iso efficiency contours (also
labeled as “efficiency maps”). This concept is fairly new in
the area of electrical motors. Its purpose is to characterize a
motor system’s efficiency in the full operating range (i.e. at
different torque-speed load points). As mentioned before,
standardization is still lacking here, but one of the goals of
the larger research project that encompasses this paper, is to
contribute to the motivation for this standardization.
For that reason and to set the stage for the remainder of
this paper, section II starts with a concise description of the
concept of iso efficiency contours in the field of electrical
motor systems. Afterwards, section II will continue with an
explanation of the proposed approach to predict energy
consumption, using these contours. Sections III and IV
report on two sets of measurements that have been
performed to evaluate the proposed approach: section III
treats measurements for a continuously time-varying torque-
speed trajectory, whereas section IV deals with
Calculating Energy Consumption of Motor Systems
with Varying Load using Iso Efficiency Contours Dirk Vanhooydonck, Wim Symens, Wim Deprez, Joris Lemmens, Kurt Stockman, Steve Dereyne
G
measurements for a torque-speed output trajectory that
consists of a sequence of separate torque-speed set points.
II. METHODOLOGY FOR ESTIMATION OF THE ENERGY
CONSUMPTION USING ISO EFFICIENCY CONTOURS
A. Iso Efficiency Contours or Efficiency Maps
The concept of iso efficiency contours is fairly new in the
field of electrical motor systems, but has already a history in
other fields, with other types of actuation and energy
conversion. They are, for instance, used in combustion
motor technology to describe the ratio of produced
mechanical power and consumed fuel ([kWh/g]) as a
function of engine speed and torque (i.e. for the full 2D
operating area). They also appear in hydraulics, to
characterize, for example, the efficiency of pumps (ratio of
produced hydraulic output power and mechanical input
power) as a function of pressure and speed.
In the context of electrical motors, efficiency maps have
already been used for the drive train design of electrical and
hybrid cars [1]-[4]. Outside this area, however, the usage is
limited, although its usefulness can be significant in the
broader machine building industry, due to the increasing
amount of variable speed-torque applications. For that
reason, a joint research project was set up dealing with iso
efficiency contours for electrical motor-VSD combinations.
The main goals of this research project are: (1) a conceptual
exploration of the contours and methods to measure them,
(2) comparing the contours for different motors and motor
types, and (3) checking the feasibility of using these
contours to predict electrical energy consumption during an
application with time-varying speed and torque. The
outcome of this project is also hoped to contribute to the
motivation for standardization of electrical motor system
efficiencies for the full torque-speed operating range.
The third project goal above is the topic of this paper and
will be treated further on, starting from the next paragraph
(B.). The first and second project goal and the corresponding
results are detailed in two other papers that have been
submitted to this conference, respectively Fout!
Verwijzingsbron niet gevonden. and [6].
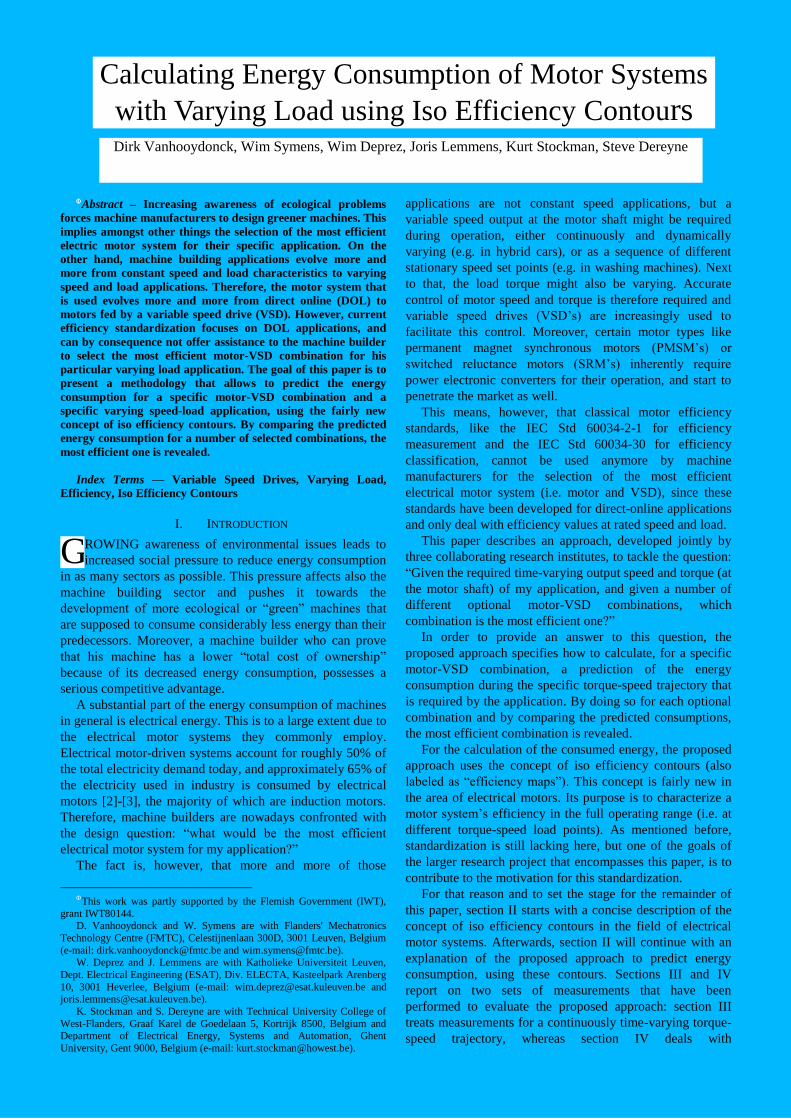
Fig. 1 shows an example of an iso efficiency contour that
was measured in the framework of the project. It pictures the
contour for a commercial 7.5 kW induction motor (IE2) with
a commercial VSD in scalar mode. The efficiency is
depicted as a function of the mechanical quantities, being
motor speed and torque, and shows for each pair of those the
corresponding efficiency of the electrical motor system. The
efficiency is defined as the ratio of mechanical output power
at the motor shaft and electrical input power going in the
VSD, when the system is in motor operation and vice versa
when the system is in generator operation. In Fig. 1, the first
quadrant is shown, illustrating the efficiency in motor
operation. The second and fourth quadrant can be used when
the efficiency in generator operation is also required. The
efficiency contour has been acquired by selecting a dense
grid of torque-speed pairs in the full operating range and by
measuring the ratio of mechanical and electrical power in
each of these load points in static conditions (i.e. keeping
torque and speed constant for some time). The upper
boundaries are determined by the peak torque (under rated
speed) and the peak power (above rated speed), while the
full line is indicating the maximal continuous torque (49Nm)
and power (7.5kW).
Fig. 1. Example of an iso efficiency contour for a commercial 7.5 kW induction motor (rated speed 1500rpm), with a commercial variable speed
drive in scalar mode. Efficiency values can vary between 0 and 1.
For more detailed information on the concept of
efficiency maps for electrical motor systems and on the
measurement procedure, and for more examples and
comparisons, we refer again to Fout! Verwijzingsbron niet
gevonden. and [6].
B. Prediction of the consumed energy during a time
varying torque-speed trajectory
We use the terminology “a time varying torque-speed
trajectory” or “time varying load trajectory” to indicate a
mathematical or numerical description of the variation over
time of the required speed and the torque at the motor shaft,
during operation. Hence, this variation can be plotted as a
“trajectory” in the 2D torque-speed space. Two types of
trajectories are considered here: (1) those with continuously
varying torque and speed, and (2) sequences of different
(stationary) speed-torque set points.
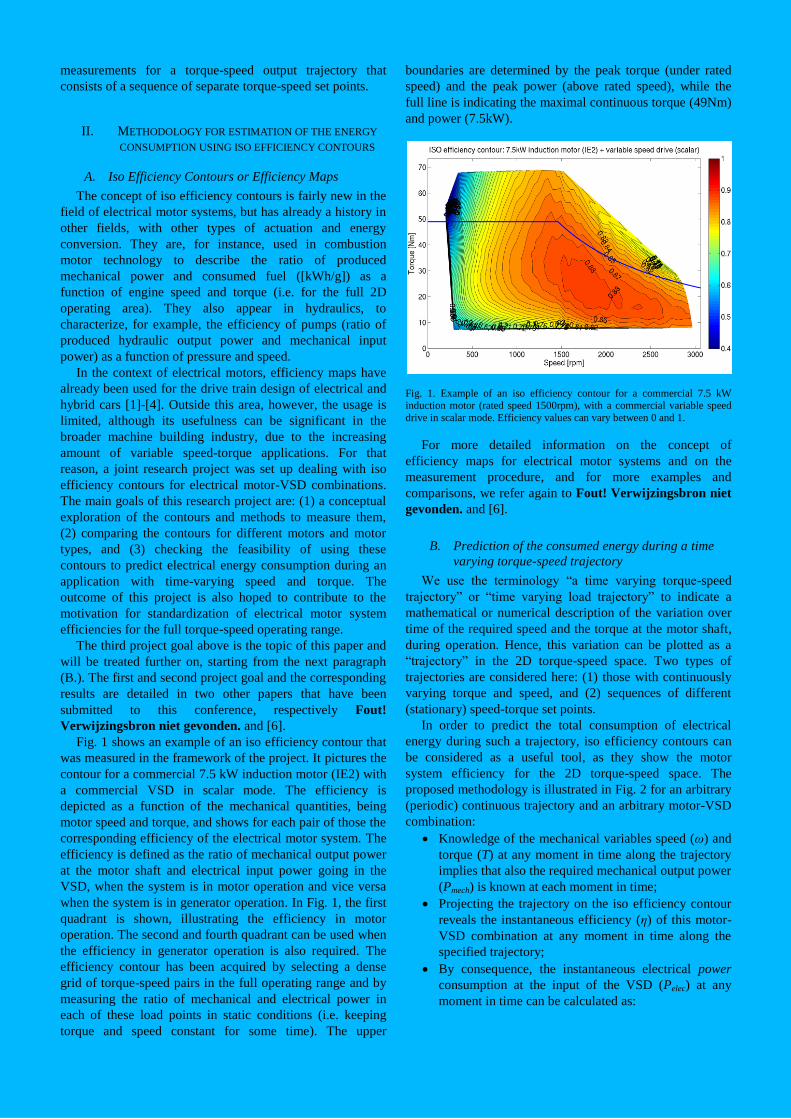
In order to predict the total consumption of electrical
energy during such a trajectory, iso efficiency contours can
be considered as a useful tool, as they show the motor
system efficiency for the 2D torque-speed space. The
proposed methodology is illustrated in Fig. 2 for an arbitrary
(periodic) continuous trajectory and an arbitrary motor-VSD
combination:
Knowledge of the mechanical variables speed (ω) and
torque (T) at any moment in time along the trajectory
implies that also the required mechanical output power
(Pmech) is known at each moment in time;
Projecting the trajectory on the iso efficiency contour
reveals the instantaneous efficiency (η) of this motor-
VSD combination at any moment in time along the
specified trajectory;
By consequence, the instantaneous electrical power
consumption at the input of the VSD (Pelec) at any
moment in time can be calculated as:
when the system is in motor operation, or as:
when the system is in generator operation (both Pelec
and Pmech are negative then).
The total electrical energy consumption (Eelec) during
the trajectory between tstart and tend can then be
calculated (or predicted) as:
∫
∫
in case of a continuously varying trajectory, or as:
∑
∑
when the trajectory consists of a sequence of
stationary set points, where Δti indicates the amount of
time that the motor system is operating in the
corresponding set point (Ti, ωi). Remark that equations
(3) and (4) are written, assuming that the system is in
motor operation during the whole trajectory, using
equation (1) to describe Pelec. If there are also parts
where the system is in generator operation, equation
(2) has to be used to describe Pelec for these parts.
Fig. 2. Illustration of the procedure to calculate the electrical energy
consumption of a specific motor system (motor and VSD) during a specific trajectory, using (1) the motor system’s efficiency contour (upper left) and
(2) the knowledge of the properties of the trajectory (upper right).
Next to the total electrical power consumption, also the
average efficiency can be calculated for a certain motor
system and a certain trajectory. This average efficiency is
defined as the ratio of the total required mechanical power
and the total consumed electrical power:
where the total electrical energy can be calculated as shown
in (2) or (3) and the mechanical energy can be calculated as:
∫
∫
for the continuously varying trajectories, and as:
∑
∑
for a sequence of stationary set points.
To determine which motor system (motor and VSD),
given a varying load trajectory, is the most efficient one
from a number of options, one can compare either the
predicted electrical energy consumption for each motor
system, or the average efficiency (as the mechanical energy
is a constant for a certain trajectory).
In order to verify the methodology, two parallel
measurement campaigns were set up by the research
institutes involved in this project. The goal of both
campaigns was to compare the predicted energy
consumption with the measured one, given a motor system
for which the iso efficiency contour is known (i.e. measured)
and given the knowledge of the load trajectory (that can be
applied to the motor on a test bench). The first measurement
campaign deals with continuously varying load trajectories
and is reported on in section III. Section IV discusses the
second measurement campaign, which focused on
trajectories that consist of sequences of discrete load points.
One of the questions that needed to be answered is how
accurate the prediction methodology is for a continuously
varying trajectory, given the fact that the iso efficiency
contours have been measured in stationary conditions.
III. VERIFICATION FOR CONTINUOUSLY VARYING
TRAJECTORIES
A. Measurement setup
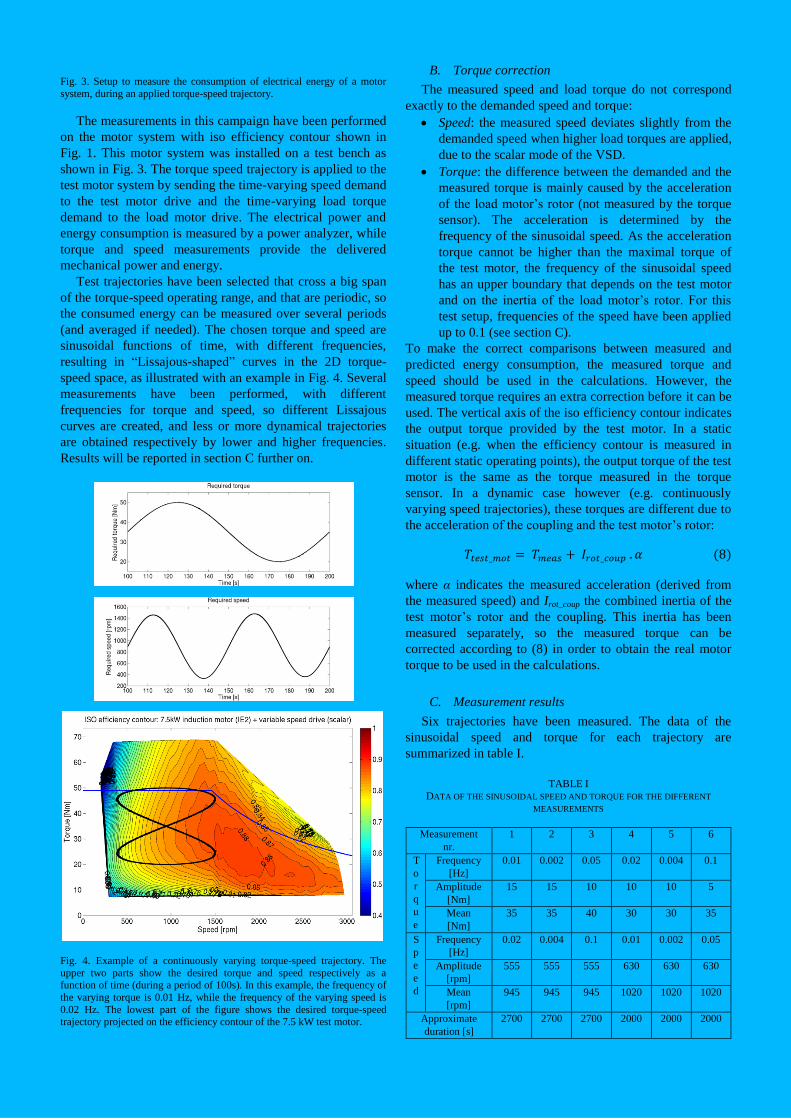
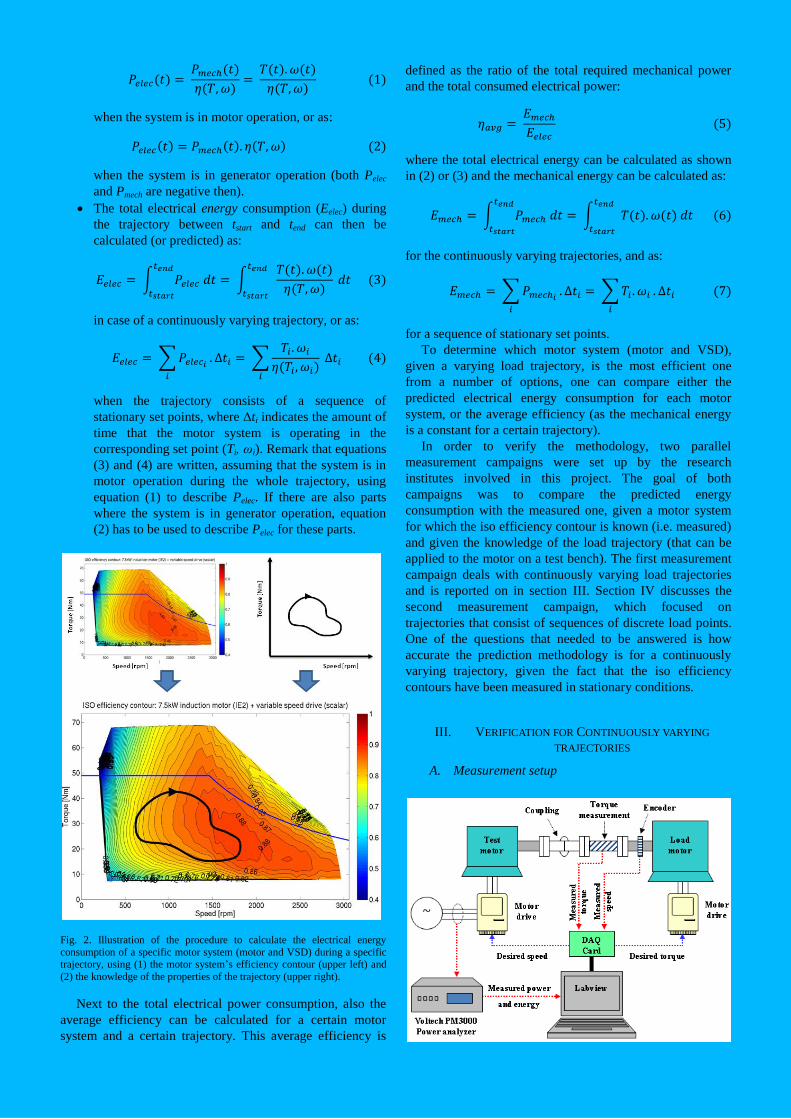
Fig. 3. Setup to measure the consumption of electrical energy of a motor
system, during an applied torque-speed trajectory.
The measurements in this campaign have been performed
on the motor system with iso efficiency contour shown in
Fig. 1. This motor system was installed on a test bench as
shown in Fig. 3. The torque speed trajectory is applied to the
test motor system by sending the time-varying speed demand
to the test motor drive and the time-varying load torque
demand to the load motor drive. The electrical power and
energy consumption is measured by a power analyzer, while
torque and speed measurements provide the delivered
mechanical power and energy.
Test trajectories have been selected that cross a big span
of the torque-speed operating range, and that are periodic, so
the consumed energy can be measured over several periods
(and averaged if needed). The chosen torque and speed are
sinusoidal functions of time, with different frequencies,
resulting in “Lissajous-shaped” curves in the 2D torque-
speed space, as illustrated with an example in Fig. 4. Several
measurements have been performed, with different
frequencies for torque and speed, so different Lissajous
curves are created, and less or more dynamical trajectories
are obtained respectively by lower and higher frequencies.
Results will be reported in section C further on.
Fig. 4. Example of a continuously varying torque-speed trajectory. The
upper two parts show the desired torque and speed respectively as a function of time (during a period of 100s). In this example, the frequency of
the varying torque is 0.01 Hz, while the frequency of the varying speed is
0.02 Hz. The lowest part of the figure shows the desired torque-speed trajectory projected on the efficiency contour of the 7.5 kW test motor.
B. Torque correction
The measured speed and load torque do not correspond
exactly to the demanded speed and torque:
Speed: the measured speed deviates slightly from the
demanded speed when higher load torques are applied,
due to the scalar mode of the VSD.
Torque: the difference between the demanded and the
measured torque is mainly caused by the acceleration
of the load motor’s rotor (not measured by the torque
sensor). The acceleration is determined by the
frequency of the sinusoidal speed. As the acceleration
torque cannot be higher than the maximal torque of
the test motor, the frequency of the sinusoidal speed
has an upper boundary that depends on the test motor
and on the inertia of the load motor’s rotor. For this
test setup, frequencies of the speed have been applied
up to 0.1 (see section C).
To make the correct comparisons between measured and
predicted energy consumption, the measured torque and
speed should be used in the calculations. However, the
measured torque requires an extra correction before it can be
used. The vertical axis of the iso efficiency contour indicates
the output torque provided by the test motor. In a static
situation (e.g. when the efficiency contour is measured in
different static operating points), the output torque of the test
motor is the same as the torque measured in the torque
sensor. In a dynamic case however (e.g. continuously
varying speed trajectories), these torques are different due to
the acceleration of the coupling and the test motor’s rotor:
where α indicates the measured acceleration (derived from
the measured speed) and Irot_coup the combined inertia of the
test motor’s rotor and the coupling. This inertia has been
measured separately, so the measured torque can be
corrected according to (8) in order to obtain the real motor
torque to be used in the calculations.
C. Measurement results
Six trajectories have been measured. The data of the
sinusoidal speed and torque for each trajectory are
summarized in table I.
TABLE I
DATA OF THE SINUSOIDAL SPEED AND TORQUE FOR THE DIFFERENT
MEASUREMENTS
Measurement
nr.
1 2 3 4 5 6
T
o
r
q
u
e
Frequency
[Hz]
0.01 0.002 0.05 0.02 0.004 0.1
Amplitude
[Nm]
15 15 10 10 10 5
Mean
[Nm]
35 35 40 30 30 35
S
p
e
e
d
Frequency
[Hz]
0.02 0.004 0.1 0.01 0.002 0.05
Amplitude
[rpm]
555 555 555 630 630 630
Mean
[rpm]
945 945 945 1020 1020 1020
Approximate
duration [s]
2700 2700 2700 2000 2000 2000
For measurements 1, 2 and 3, the frequency of the speed
is always twice the frequency of the torque, resulting in
Lissajous figures similar to the one in Fig. 4. For
measurements 4, 5 and 6, the frequency of the torque is
always twice the frequency of the speed, resulting in a
different Lissajous figure. Measurements 2 and 5 are rather
slow, while 3 and 6 are faster (higher frequencies).
Measurement 3 has the highest frequency for the speed,
which corresponds to the limitations of the test bench as
mentioned before (max. acceleration 37 rad/s2).
The trajectory of measurement 1 is the one that has been
shown in Fig. 4. The figure shows the demanded trajectory,
but the measured and corrected trajectories deviate only
slightly. In measurement 3, however, the difference between
the demanded and corrected trajectories is considerably
higher, due to the higher frequency of the varying speed (and
therefore the higher acceleration torque). The next three
figures illustrate the results for measurement 1.
Fig. 5. Comparison of the measured mechanical power, the measured
electrical power consumption and the calculated electrical power consumption during 2 cycles of the trajectory in measurement 1.
Fig. 6. Evolution of the measured mechanical energy, the measured
electrical energy consumption and the calculated electrical energy
consumption during measurement 1
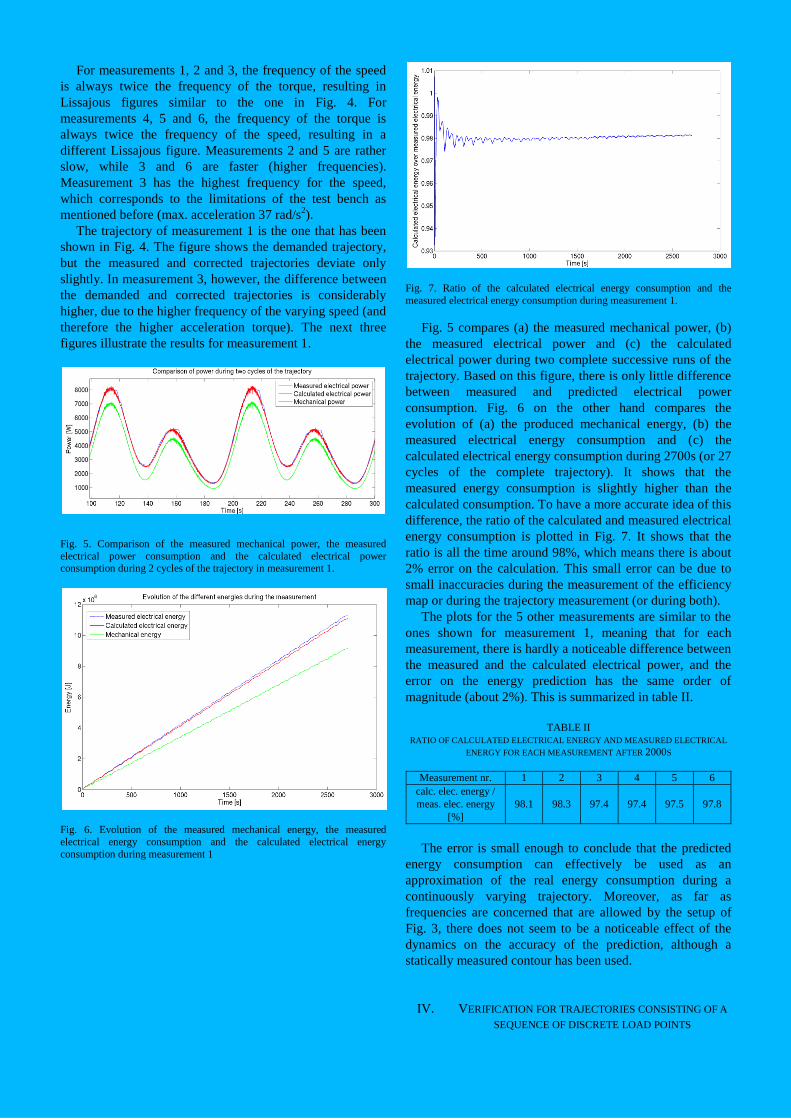
Fig. 7. Ratio of the calculated electrical energy consumption and the
measured electrical energy consumption during measurement 1.
Fig. 5 compares (a) the measured mechanical power, (b)
the measured electrical power and (c) the calculated
electrical power during two complete successive runs of the
trajectory. Based on this figure, there is only little difference
between measured and predicted electrical power
consumption. Fig. 6 on the other hand compares the
evolution of (a) the produced mechanical energy, (b) the
measured electrical energy consumption and (c) the
calculated electrical energy consumption during 2700s (or 27
cycles of the complete trajectory). It shows that the
measured energy consumption is slightly higher than the
calculated consumption. To have a more accurate idea of this
difference, the ratio of the calculated and measured electrical
energy consumption is plotted in Fig. 7. It shows that the
ratio is all the time around 98%, which means there is about
2% error on the calculation. This small error can be due to
small inaccuracies during the measurement of the efficiency
map or during the trajectory measurement (or during both).
The plots for the 5 other measurements are similar to the
ones shown for measurement 1, meaning that for each
measurement, there is hardly a noticeable difference between
the measured and the calculated electrical power, and the
error on the energy prediction has the same order of
magnitude (about 2%). This is summarized in table II.
TABLE II
RATIO OF CALCULATED ELECTRICAL ENERGY AND MEASURED ELECTRICAL
ENERGY FOR EACH MEASUREMENT AFTER 2000S
Measurement nr. 1 2 3 4 5 6
calc. elec. energy /
meas. elec. energy
[%]
98.1
98.3
97.4
97.4
97.5
97.8
The error is small enough to conclude that the predicted
energy consumption can effectively be used as an
approximation of the real energy consumption during a
continuously varying trajectory. Moreover, as far as
frequencies are concerned that are allowed by the setup of
Fig. 3, there does not seem to be a noticeable effect of the
dynamics on the accuracy of the prediction, although a
statically measured contour has been used.
IV. VERIFICATION FOR TRAJECTORIES CONSISTING OF A
SEQUENCE OF DISCRETE LOAD POINTS
A. Measurement setup
The second measurement campaign was performed on a
different test bench, but the setup is similar to the one
explained in Fig. 3.
The test motor for this case was a commercial 4kW IE1
induction motor with a commercial VSD in direct torque
control mode. The applied trajectory is shown in Fig. 8 and
represents a number of successive speed-torque set points.
B. No torque correction needed
For the calculation of the predicted energy consumption
during this trajectory, the acceleration from one set point to
the next is assumed to be instantaneous, and the inertia
torque is neglected (and therefore also the acceleration
energy). Comparing the measured and calculated energy
consumption will verify whether these assumptions are
valid.
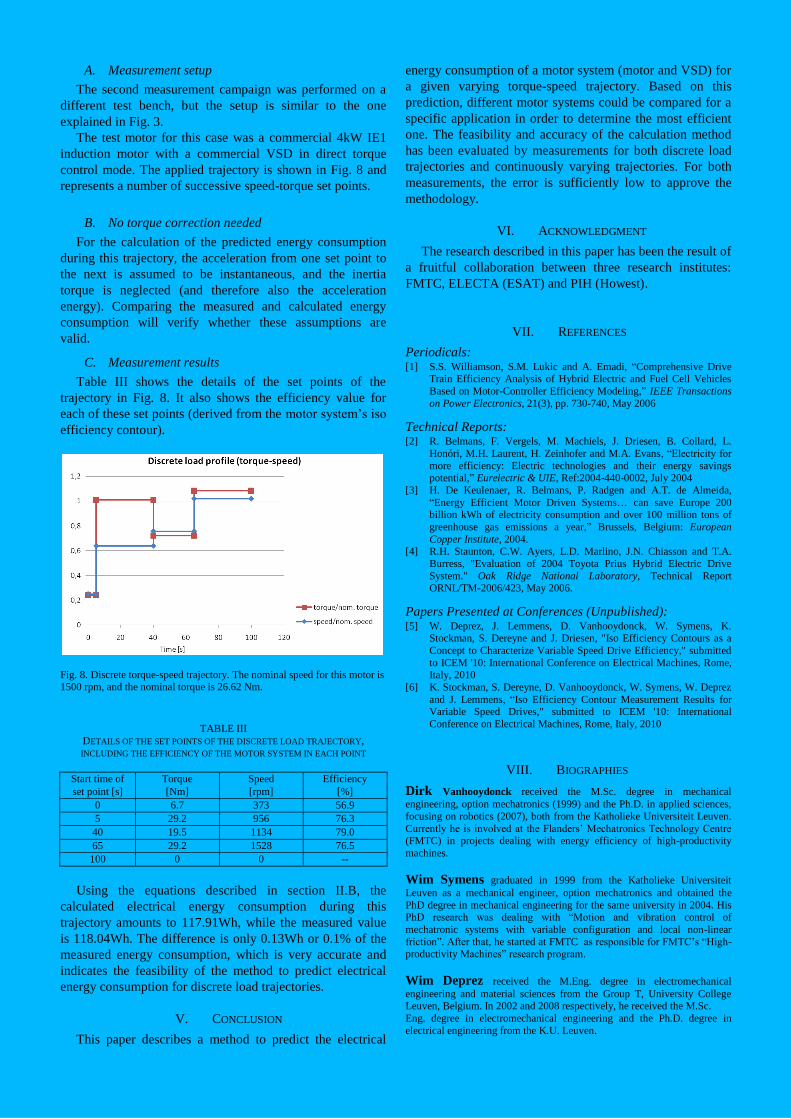
C. Measurement results
Table III shows the details of the set points of the
trajectory in Fig. 8. It also shows the efficiency value for
each of these set points (derived from the motor system’s iso
efficiency contour).
Fig. 8. Discrete torque-speed trajectory. The nominal speed for this motor is 1500 rpm, and the nominal torque is 26.62 Nm.
TABLE III
DETAILS OF THE SET POINTS OF THE DISCRETE LOAD TRAJECTORY, INCLUDING THE EFFICIENCY OF THE MOTOR SYSTEM IN EACH POINT
Start time of
set point [s]
Torque
[Nm]
Speed
[rpm]
Efficiency
[%]
0 6.7 373 56.9
5 29.2 956 76.3
40 19.5 1134 79.0
65 29.2 1528 76.5
100 0 0 --
Using the equations described in section II.B, the
calculated electrical energy consumption during this
trajectory amounts to 117.91Wh, while the measured value
is 118.04Wh. The difference is only 0.13Wh or 0.1% of the
measured energy consumption, which is very accurate and
indicates the feasibility of the method to predict electrical
energy consumption for discrete load trajectories.
V. CONCLUSION
This paper describes a method to predict the electrical
energy consumption of a motor system (motor and VSD) for
a given varying torque-speed trajectory. Based on this
prediction, different motor systems could be compared for a
specific application in order to determine the most efficient
one. The feasibility and accuracy of the calculation method
has been evaluated by measurements for both discrete load
trajectories and continuously varying trajectories. For both
measurements, the error is sufficiently low to approve the
methodology.
VI. ACKNOWLEDGMENT
The research described in this paper has been the result of
a fruitful collaboration between three research institutes:
FMTC, ELECTA (ESAT) and PIH (Howest).
VII. REFERENCES
Periodicals: [1] S.S. Williamson, S.M. Lukic and A. Emadi, “Comprehensive Drive
Train Efficiency Analysis of Hybrid Electric and Fuel Cell Vehicles
Based on Motor-Controller Efficiency Modeling,” IEEE Transactions
on Power Electronics, 21(3), pp. 730-740, May 2006
Technical Reports: [2] R. Belmans, F. Vergels, M. Machiels, J. Driesen, B. Collard, L.
Honóri, M.H. Laurent, H. Zeinhofer and M.A. Evans, “Electricity for
more efficiency: Electric technologies and their energy savings potential,” Eurelectric & UIE, Ref:2004-440-0002, July 2004
[3] H. De Keulenaer, R. Belmans, P. Radgen and A.T. de Almeida,
“Energy Efficient Motor Driven Systems… can save Europe 200 billion kWh of electricity consumption and over 100 million tons of
greenhouse gas emissions a year,” Brussels, Belgium: European
Copper Institute, 2004. [4] R.H. Staunton, C.W. Ayers, L.D. Marlino, J.N. Chiasson and T.A.
Burress, "Evaluation of 2004 Toyota Prius Hybrid Electric Drive
System." Oak Ridge National Laboratory, Technical Report ORNL/TM-2006/423, May 2006.
Papers Presented at Conferences (Unpublished): [5] W. Deprez, J. Lemmens, D. Vanhooydonck, W. Symens, K.
Stockman, S. Dereyne and J. Driesen, "Iso Efficiency Contours as a
Concept to Characterize Variable Speed Drive Efficiency," submitted
to ICEM '10: International Conference on Electrical Machines, Rome, Italy, 2010
[6] K. Stockman, S. Dereyne, D. Vanhooydonck, W. Symens, W. Deprez
and J. Lemmens, “Iso Efficiency Contour Measurement Results for Variable Speed Drives," submitted to ICEM '10: International
Conference on Electrical Machines, Rome, Italy, 2010
VIII. BIOGRAPHIES
Dirk Vanhooydonck received the M.Sc. degree in mechanical
engineering, option mechatronics (1999) and the Ph.D. in applied sciences,
focusing on robotics (2007), both from the Katholieke Universiteit Leuven.
Currently he is involved at the Flanders’ Mechatronics Technology Centre (FMTC) in projects dealing with energy efficiency of high-productivity
machines.
Wim Symens graduated in 1999 from the Katholieke Universiteit
Leuven as a mechanical engineer, option mechatronics and obtained the
PhD degree in mechanical engineering for the same university in 2004. His PhD research was dealing with “Motion and vibration control of
mechatronic systems with variable configuration and local non-linear
friction”. After that, he started at FMTC as responsible for FMTC’s “High-productivity Machines” research program.
Wim Deprez received the M.Eng. degree in electromechanical
engineering and material sciences from the Group T, University College Leuven, Belgium. In 2002 and 2008 respectively, he received the M.Sc.
Eng. degree in electromechanical engineering and the Ph.D. degree in
electrical engineering from the K.U. Leuven.

Joris Lemmens received the M.Eng. degree in electromechanical
engineering in 2008 from the KHLim University College, Diepenbeek,
Belgium.
Kurt Stockman was born in Belgium in 1972. He received his Master
degree in electrotechnics from Provinciale Hogeschool West-Vlaanderen,
Kortrijk, Belgium in 1994 and the Ph.D. degree an Katholieke Universiteit
Leuven, in 2003. He is currently professor at University College Howest, Kortrijk, Belgium. His research interests include control of electrical
machines, energy efficiency and reliability of adjustable speed drives.
Steve Dereyne was born in Belgium in 1979. He received his Master
degree in electrotechnics from Provinciale Hogeschool West-Vlaanderen,
Kortrijk, Belgium in 2001. He is currently assistant at University College Howest, Kortrijk, Belgium. His research interests include motortesting,
energy efficiency and design of electrical LV-grids.