cafr 2017 v2 - home | san diego metropolitan transit system · schedule of funding progress of...
TRANSCRIPT


San Diego Metropolitan Transit System
San Diego, California
Comprehensive Annual Financial Report and Independent Auditors’ Reports
For the Years Ended June 30, 2017 and 2016
PREPARED BY SAN DIEGO METROPOLITAN TRANSIT SYSTEM FINANCE DEPARTMENT


San Diego Metropolitan Transit System
Table of Contents
Page
Introductory Section (Unaudited): Letter of Transmittal .................................................................................................................................. i Listing of Board of Directors and Management ........................................................................................ vi Executive Level Organization Chart .......................................................................................................... viii Certificate of Achievement for Excellence in Financial Reporting – GFOA ............................................ ix Financial Section:
Independent Auditors' Report .................................................................................................................. 1 Management's Discussion and Analysis (Required Supplementary Information) (Unaudited) ............................................................................ 3 Basic Financial Statements: Statements of Net Position .............................................................................................................. 8 Statements of Revenues, Expenses and Changes in Net Position ................................................... 11 Statements of Cash Flows ............................................................................................................... 12 Notes to Basic Financial Statements ............................................................................................... 15 Required Supplementary Information (Unaudited): Schedule of Proportionate Share of the Net Pension Liability ....................................................... 74 Schedule of Changes in Net Pension Liability and Related Ratios ................................................ 75 Schedule of Contributions ............................................................................................................... 78 Schedule of Funding Progress of Other Postemployment Healthcare Plan .................................... 83 Supplementary Information: Combining Schedule of Net Position .............................................................................................. 86 Combining Schedule of Revenues, Expenses, and Changes in Net Position .................................. 90 Combining Schedule of Cash Flows ............................................................................................... 92 Schedules of Revenues, Expenses and Changes in Net Position - Budget and Actual: Combined Operations ................................................................................................................ 94 General Operations: General Fund ......................................................................................................................... 96 Taxicab Administration ........................................................................................................ 98 San Diego & Arizona Eastern Railway ................................................................................. 99 Contracted Services .............................................................................................................. 100 San Diego Transit Corporation ............................................................................................. 102 San Diego Trolley, Inc. ......................................................................................................... 104

San Diego Metropolitan Transit System
Table of Contents (Continued)
Page
Statistical Section (Unaudited): Financial Trends: Net Position by Component ............................................................................................................ 109 Changes in Net Position .................................................................................................................. 110 Revenue Capacity: Operating Revenue by Source ........................................................................................................ 114 Fare Structure .................................................................................................................................. 115 Farebox Recovery Percentages ....................................................................................................... 116 Debt Capacity: Ratio of Outstanding Debt by Type ................................................................................................ 118 Demographic and Economic Statistics: Regional Population and Personal Income Statistics ...................................................................... 120 Full-time and Part-time Employees by Function ............................................................................ 121 Ten Largest Employers in San Diego County ................................................................................ 122 Operating Information: Operating Indicators by Function ................................................................................................... 124 Service Performance Data ............................................................................................................... 125 Capital Assets Statistics by Function .............................................................................................. 126 Ridership ......................................................................................................................................... 127 Operating Subsidy ........................................................................................................................... 128
Independent Auditors' Report on Compliance and on Internal Control Over Financial Reporting Based on an Audit of Financial Statements Performed in Accordance with Government Auditing Standards .................................................... 129

INTRODUCTORY SECTION

This page intentionally left blank.

Board of Directors and Transit Riders San Diego Metropolitan Transit System The comprehensive annual financial report of the San Diego Metropolitan Transit System (MTS) for the fiscal years ended June 30, 2017 and 2016 is hereby submitted. Responsibility for both the accuracy of the data, and the completeness and fairness of the presentation, including all disclosures, rests with management. The MTS Board of Directors has established an Audit Oversight Committee to provide an additional level of scrutiny to the preparation of the comprehensive annual financial report. Management of MTS is responsible for establishing and maintaining an internal control structure designed to ensure that the assets of MTS are protected from loss, theft, or misuse and to ensure that adequate accounting data are compiled to allow for preparation of financial statements in conformity with generally accepted accounting principles in the United States of America (U.S. GAAP). The internal control structure is designed to provide reasonable, but not absolute, assurance that these objectives are met. The concept of reasonable assurance recognizes that (1) the cost of a control should not exceed the benefits likely to be derived and (2) the valuation of costs and benefits requires estimates and judgments by management. As management, we assert that, to the best of our knowledge and belief, this financial report is complete and reliable in all material respects. State statutes require an annual audit by independent certified public accountants. The Pun Group LLP, Accountants and Advisors, has been retained to meet this requirement. The goal of the independent audit was to provide reasonable assurance that the financial statements of MTS for the fiscal years ended June 30, 2017 and 2016 are free of material misstatement. The independent audit involved examining, on a test basis, evidence supporting the amounts and disclosures in the financial statements; assessing the accounting principles used and significant estimates made by management; and evaluating the overall financial statement presentation. The independent auditors concluded, based upon the audit, that there was a reasonable basis for rendering an unmodified opinion that MTS's financial statements for the fiscal years ended June 30, 2017 and 2016 are fairly presented, in all material respects, in conformity with U.S. GAAP. The independent auditors' report is presented as the first component of the financial section of this report. The independent audit also was designed to meet the requirements of a broader, federally mandated "Single Audit" and to meet the special needs of federal grantor agencies. The standards governing Single Audit engagements required the independent auditor to report not only on the fair presentation of the financial statements, but also on the audited government's internal controls and compliance with legal requirements, with special emphasis on internal controls and legal requirements involving the administration of federal awards. The reports related specifically to the Single Audit are issued under separate cover. U.S. GAAP requires that management provide a narrative introduction, overview, and analysis to accompany the financial statements in the form of Management’s Discussion and Analysis (MD&A). This letter of transmittal is designed to complement the MD&A and should be read in conjunction with it. The MD&A can be found immediately following the report of the independent auditors.

ii
REPORTING ENTITY The San Diego Metropolitan Transit System was created effective January 26, 1976 to provide the policy setting and overall management coordination of the public transportation system in the San Diego metropolitan service area. This service area encompasses approximately 3 million people residing in a 570 square mile area of San Diego County, including the cities of Chula Vista, Coronado, El Cajon, Imperial Beach, La Mesa, Lemon Grove, National City, Poway, Santee, and San Diego and the unincorporated area of the County of San Diego. MTS’s mission statement, adopted by the Board of Directors, is to enhance the personal mobility of San Diego metropolitan area residents and visitors by:
Obtaining maximum benefit for every dollar spent. Being the community’s major public transportation advocate. Increasing public transportation usage per capita. Taking a customer-oriented approach. Implementing capital projects on schedule and within budget. Offering high-quality public transportation services. Responding to the community’s socioeconomic interests.
California law establishes the San Diego Association of Governments (SANDAG) as the planning agency for San Diego County. The responsibility and decision-making for all transportation-related planning, programming and development activities occurs within SANDAG's nine-member Transportation Committee. Approved transportation plans and programs are subsequently executed by SANDAG staff. Within this structure, MTS and the North County Transit District (NCTD) focus primarily on operating activities. MTS is effectively an umbrella agency. MTS owns the assets of San Diego Trolley, Inc. (SDTI) and San Diego Transit Corporation (SDTC), the area’s two largest transit operators. These two transit units were formed under California law as not-for-profit public corporations and function as operating subsidiaries of MTS. SDTI and SDTC are considered component units and are blended component units for financial reporting purposes. SDTI operates three Light Rail Transit (LRT) routes: the UC San Diego Blue Line from the America Plaza Station to San Ysidro at the International Border, the Orange Line from the America Plaza through Centre City and then east to El Cajon Transit Center, and the Green Line from the 12th and Imperial Transit Center Bayside platform to Santee. SDTI operates on a total of 54.3 miles of track. SDTC operates 27 routes with an active fleet of 273 buses. The relationship between MTS and the transit operating subsidiaries, SDTI and SDTC, is formally established through operating agreements and MTS-adopted corporate policies. These agreements and corporate policies specify the roles and responsibilities of each of the organizations and outline the procedures in numerous functional areas including accounting and budgeting, fare setting, marketing and public information, revenue-producing advertising, service contracts, and programming of federal, state and local subsidies. The MTS Board of Directors has the policy-setting responsibility for the operation and development of MTS’s transit operating subsidiaries as well as for the planning and approval of capital expenditures by or on behalf of these entities. The day-to-day operating functions, labor matters and maintenance of facilities are managed by the individual transit operators. MTS has centralized and consolidated Security, Planning, Human Resources, Finance, Information Technology, Stores, and Purchasing for MTS and all subsidiaries. In addition to the bus routes operated by SDTC, MTS is financially accountable for the operation of certain additional bus routes. MTS contracts with outside parties for the operation of 73 fixed-route bus lines and paratransit services with an active fleet of 525 buses. The contracts require full operation and maintenance of the bus services. Contract services are accounted for in the Contracted Services Fund for financial reporting purposes.

iii
MTS owns the San Diego and Arizona Eastern Railway Company (SD&AE), a not-for-profit railroad holding company entrusted with assets which include 108 miles of rail line and over 2,000 acres of property. MTS has a contract with the San Diego and Imperial Valley Railway Co. (SDIV) for the operation of freight rail services over the UC San Diego Blue Line (downtown San Diego south to San Ysidro) and Orange Line (downtown San Diego east to El Cajon) trolley segments. MTS provides no subsidy to SDIV, but does receive a portion of its gross revenue. SD&AE is considered a blended component unit for financial reporting purposes.
In December 2012, SD&AE entered into a 99-year lease and operating agreement with Pacific Imperial Railroad, Inc. (PIR) over the 70-mile Desert Line freight right of way in East San Diego County. PIR filed for bankruptcy in September 2016 and the lease was transferred to Baja California Rail Road, Inc. (BJRR) as part of the bankruptcy process. On September 21, 2017, MTS executed an amended and restated Desert Line lease agreement with BJRR. The BJRR agreement provides specific performance milestones which begin after the US and Mexico governments formally approve construction and operation of a customs inspection facility serving the Desert Line, with a minimum of $1 million in annual revenue required. The agreement may be terminated if BJRR fails to meet the specified milestones, or at BJRR’s election with six months’ notice. If BJRR meets all milestones and commences freight operations along the Desert Line, MTS's revenue will increase to 7% of gross freight revenue.
MTS is financially accountable for the operation of Taxicab Administration and currently has contracts with the following cities through June 30, 2019: San Diego, National City, El Cajon, Imperial Beach, La Mesa, Lemon Grove, Poway, and Santee. The agreements include licensing and regulating taxicabs, jitneys, nonemergency medical, charter, low speed vehicle, and sightseeing for-hire vehicles.
The MTS Board of Directors is comprised of 15 members with four appointed from the San Diego City Council, one appointed from the San Diego County Board of Supervisors, one appointed from each city council of Chula Vista, Coronado, El Cajon, Imperial Beach, La Mesa, Lemon Grove, National City, Poway, and Santee, and one member of the public elected by other Board members to serve as Chairman. ECONOMIC CONDITION AND OUTLOOK
San Diego region's economy is geared toward continued prosperity in 2017. Industries projected to lead the region's growth are defense, tourism and innovation, followed by healthcare and professional services which are also predicted to continuously thrive in the current year. San Diego's gross domestic product (GDP), the total value of the region's economy, soared to $220.6 billion in 2015 compared to the $206.8 billion earned in 2014, and is forecasted to grow 2.7% in 2017. Unemployment is projected to further decrease to an annual average of 3.9 percent in 2017, and compares favorably to the unemployment rate in California and the national average. Long-term financial planning
The long-term goal of MTS is to fund operations solely with recurring revenues. While sales tax receipts throughout California, which impacts subsidy revenue available to MTS from both TDA and TransNet funds, increased again for the seventh consecutive year, MTS is currently in the second year of ridership declines, with overall passenger levels down by over 10% compared to the FY15 peaks. This had a similar impact on passenger revenue levels, and to compensate, MTS utilized one-time funding to balance both the FY17 amended budget and the FY18 operating budget. MTS also has a contingency reserve balance of 12.5% of the operating budget at its disposal. Major Initiatives
MTS has been addressing this two year ridership decline in a number of different ways. In Fall 2016, MTS launched its Transit Optimization Plan (TOP) to evaluate MTS’ current network of services and ensure that it is efficient and effective for the region’s travel needs. MTS collected nearly 4,000 online surveys, as well as valuable feedback at 15 outreach events. MTS then analyzed the findings in conjunction with system performance data, route segments and ridership patterns. MTS hosted more than 20 open house events at transit centers/stations across the county, asking the public for feedback on the proposed route and schedule changes that

iv
are aimed at realigning current transit services to meet market needs. The proposed system adjustments were approved by the Board in September 2017. As part of this ridership review and ease of use of the system, MTS had undertaken an initiative upgrading the region’s current fare collection system. A fare collection working group was established in 2016 to spearhead the creation of a set of preliminary requirements for the future electronic fare collection system. The working group hired a consultant to assist in its work, held a peer agency workshop, reviewed numerous documents produced by other agencies, and attended an international workshop. A whitepaper details the results of the working group’s efforts, and recommended the agency develop a Concept of Operations (ConOps). This ConOps, which was completed in summer of 2017, reviewed the current system components and contract terms, produced detailed system requirements for the new system (Eg. design of equipment, reporting system, sales channel review), provided direction for the procurement strategy and provided an updated cost estimate. The ConOps also generated plans for Mobile ticketing integration, implementation and transition to the new system. While the replacement of the current fare collection system is being reviewed, enhancements to the existing system are being rolled out to give added functionality to the system. In March of 2017, MTS and the North County Transit District (NCTD) launched Compass Cloud, the new anytime, anywhere mobile ticketing option for San Diego transit riders. It is the first mobile ticketing app that is good for both transit agencies, good 7 days a week and available for MTS Rapid, MTS Bus Operations, the San Diego Trolley and NCTD Coaster, Sprinter and Breeze. In the first phase, day passes, 30-day passes and Coaster one-way tickets are available for adult passengers (senior fares are available for Coaster one-ways). Future phases will include discounted fares for youth, seniors and disabled. Prices for passes will be the same as from Ticket Vending Machines, The Transit Store, Customer Service Centers and third-party outlets. With Compass Cloud, there is no need to have any other fare media. In June of 2017, MTS and NCTD launched Compass Cash, which added the capability of stored value to the Compass Card fare collection system. This gives the riders the ability to add funds to their smart card to be utilized as needed.
MTS has also focused on the customer facilities in its service area. Electronic display boards showing real-time next train arrival information are active at all 53 transit stations and on all three rail lines. The electronic boards connect GPS locating technology and Trolley schedules to map out the next arrival times. The information is used to create “by-the-minute” accuracy of the next arriving Trolley. The display boards identify the line, current time and the next three Trolley arrival times. Relative to Bus Operations, 600 new bus shelters and 1,850 bus benches are being installed throughout the MTS service territory. The new shelters have features such as a modern look, better lighting, solar power, custom aluminum benches, advertising panels, and a new roof design.
Finally, a major service enhancement is now underway. The Federal Transit Administration (FTA) signed a Full Funding Grant Agreement between SANDAG and the FTA to pay for half the cost of the Mid-Coast Trolley extension. The Mid-Coast Trolley extension is the largest public transit project in the history of the San Diego region. It will cost $2.1 billion to build, and MTS rail operations are expected to commence in 2021. The extension will extend the UC San Diego Blue Line from Santa Fe Depot to the University City community, serving major activity centers such as Old Town, UC San Diego, the VA Hospital and the Westfield UTC mall. MTS will have 11 more miles of track to serve, nine new stations, more trains to operate, and up to 20,000 more daily riders as a result of this project.
Over the last decade, MTS has made funding the Capital Improvement Plan (CIP) a priority to bring the system up to a state of good repair, with over $800 million of funding spent on Capital. MTS and SANDAG completed the rehabilitation of the Blue Line, also replaced both the East County and South Bay Bus facilities. The bus fleet replacement plan has been adjusted to keep the number of buses replaced to a manageable figure each year. The U2 light rail vehicle (LRV) fleet has been replaced and $48M has already been saved towards SD100 LRVs as they approach the end of their useful lives. MTS has committed $69 million for CIP in FY18, funding 46 projects focused on fleet replacement, maintaining a state of good repair, and a number of rehabilitation projects along the Orange Line.

v
AWARDS AND ACKNOWLEDGEMENTS
The Government Finance Officers Association of the United States and Canada (GFOA) awarded a Certificate of Achievement for Excellence in Financial Reporting to MTS for its Comprehensive Annual Financial Report (CAFR) for the fiscal year ended June 30, 2016. This was the eleventh consecutive year and the twenty first year overall that MTS has achieved this prestigious award. To be awarded a Certificate of Achievement, MTS must publish an easily readable and efficiently organized Comprehensive Annual Financial Report. This report must satisfy both generally accepted accounting principles and applicable legal requirements.
The Certificate of Achievement is valid for a period of one year only. We believe that our current CAFR continues to meet the Certificate of Achievement Program's requirements and we are submitting it to the GFOA to determine its eligibility for another certificate.
Acknowledgments
The staff of the finance department is to be commended for their efficient and dedicated service to the production of this report. In addition, we express our appreciation for the assistance and cooperation provided by management and staff in all departments throughout the organization.
Paul Jablonski Larry Marinesi Chief Executive Officer Chief Financial Officer November 3, 2017

San Diego Metropolitan Transit System
Listing of Board of Directors and Management
vi
Members Board position (elected position)Harry Mathis Chairman, since 1/06; Board Member since 12/94Ron Roberts Vice Chairman, since 1/11; Board Member since 11/89 (Supervisor, County Board of Supervisors)David Alvarez Board Member, since 1/12 (Councilmember, City of San Diego)David Arambula Board Member, since 1/17 (Councilmember, City of Lemon Grove)Lorie Bragg Board Member, since 1/12 (Councilmember, Imperial Beach)Myrtle Cole Board Member, since 9/13 (Councilmember, City of San Diego)Jim Cunningham Board Member, since 1/09 (Councilmember, City of Poway)Georgette Gomez Board Member, since 1/17 (Councilmember, City of San Diego)Ronn Hall Board Member, since 5/17 (Councilmember, City of Santee)Bob McClellan Board Member, since 4/08 (Councilmember, City of El Cajon)Guy McWhirter Board Member, since 1/15 (Councilmember, City of La Mesa)Mona Rios Board Member, since 9/11 (Councilmember, National City)Mary Salas Chair Pro Tem, since 1/17, Board Member, since 2/13 (Councilmember, City of Chula Vista)Bill Sandke Board Member, since 1/17 (Councilmember, City of Coronado)Lorie Zapf Board Member, since 12/14 (Councilmember, City of San Diego)
BOARD OF DIRECTORS
Executive CommitteeAccessible Services Advisory Committee
Airport Authority Advisory Committee
Public Security Committee
Harry Mathis, Chair Lorie Bragg, Chair Harry Mathis Myrtle ColeMyrtle Cole Jim CunninghamBob McClellan Harry MathisMona Rios Guy McWhirterRon Roberts Bill Sandke
Audit Oversight Committee
Budget Development Committee
Los Angeles-San Diego Rail Corridor Agency
Taxicab Advisory Committee
Ernie Ewin, Chair Ron Roberts, Chair Lorie Bragg Lorie ZapfMyrtle Cole Harry MathisHarry Mathis Bob McClellanBob McClellan Mary SalasMona Rios Lorie ZapfRon Roberts
SANDAG BoardSANDAG Regional Planning Committee
SANDAG Transportation Committee
Harry Mathis Mona Rios Harry Mathis
BOARD COMMITTEE MEMBERSHIP

San Diego Metropolitan Transit System
Listing of Board of Directors and Management (Continued)
vii
Staff Position
Paul Jablonski Chief Executive OfficerSharon Cooney Chief of StaffKaren Landers General CounselLarry Marinesi Chief Financial OfficerWilliam Spraul Chief Operating Officer, Transit SystemsE. Wayne Terry Chief Operating Officer, RailRobert Schupp Director, Marketing and CommunicationsJeff Stumbo Director, Human Resources and Labor RelationsManuel Guaderrama Chief of Police
MTS MANAGEMENT

San Diego Metropolitan Transit System
Executive Level Organization Chart
viii

San Diego Metropolitan Transit System
Certificate of Achievement for Excellence in Financial Reporting - GFOA
ix

This page intentionally left blank.

FINANCIAL SECTION

This page intentionally left blank.

INDEPENDENT AUDITORS’ REPORT
To the Board of Directors of the San Diego Metropolitan Transit System
San Diego, California Report on Financial Statements We have audited the accompanying basic financial statements of the San Diego Metropolitan Transit System (MTS), which comprise the statements of net position as of June 30, 2017 and 2016 and the related statements of revenues, expenses and changes in net position, and cash flows for the years then ended, and the related notes to the financial statements. Management’s Responsibility for the Financial Statements Management is responsible for the preparation and fair presentation of these financial statements in accordance with accounting principles generally accepted in the United States of America; this includes the design, implementation, and maintenance of internal control relevant to the preparation and fair presentation of financial statements that are free from material misstatement, whether due to fraud or error. Auditor’s Responsibility Our responsibility is to express an opinion on these financial statements based on our audits. We conducted our audits in accordance with auditing standards generally accepted in the United States of America, and the standards applicable to financial audits contained in Government Auditing Standards, issued by the Comptroller General of the United States. Those standards require that we plan and perform the audits to obtain reasonable assurance about whether the financial statements are free from material misstatement. An audit involves performing procedures to obtain audit evidence about the amounts and disclosures in the financial statements. The procedures selected depend on the auditor’s judgment, including the assessment of the risks of material misstatement of the financial statements, whether due to fraud or error. In making those risk assessments, the auditor considers internal control relevant to the entity’s preparation and fair presentation of the financial statements in order to design audit procedures that are appropriate in the circumstances, but not for the purpose of expressing an opinion on the effectiveness of the entity’s internal control. Accordingly, we express no such opinion. An audit also includes evaluating the appropriateness of accounting policies used and the reasonableness of significant accounting estimates made by management, as well as evaluating the overall presentation of the financial statements. We believe that the audit evidence we have obtained is sufficient and appropriate to provide a basis for our audit opinion. Opinion In our opinion, the financial statements referred to above present fairly, in all material respects, the respective financial position of MTS, as of June 30, 2017 and 2016, and the respective changes in financial position, and cash flows for the years then ended in accordance with accounting principles generally accepted in the United States of America.
4365 Executive Drive, Suite 710, San Diego, California 92121 Tel: 858-242-5100 • Fax: 858-242-5150
www.pungroup.com
3939352 Pun & McGeady_L_final.pdf 2 1/14/14 3:48 PM

To the Board of Directors of the San Diego Metropolitan Transit System
San Diego, California Page 2
2
Other Matters
Required Supplementary Information
Accounting principles generally accepted in the United States of America require that the Management’s Discussion and Analysis, Schedules of Proportionate Share of the Net Pension Liability, Schedules of Changes in Net Pension Liability and Related Ratios, Schedules of Contributions, and Schedule of Funding Progress of the Other Postemployment Health Benefits be presented to supplement the basic financial statements. Such information, although not a part of the basic financial statements, is required by the Governmental Accounting Standards Board, who considers it to be an essential part of financial reporting for placing the basic financial statements in an appropriate operational, economic, or historical context. We have applied certain limited procedures to the required supplementary information in accordance with auditing standards generally accepted in the United States of America, which consisted of inquiries of management about the methods of preparing the information and comparing the information for consistency with management’s responses to our inquiries, the basic financial statements, and other knowledge we obtained during our audit of the basic financial statements. We do not express an opinion or provide any assurance on the information because the limited procedures do not provide us with sufficient evidence to express an opinion or provide any assurance.
Other Information
Our audits were conducted for the purpose of forming opinions on the financial statements that collectively comprise MTS’s basic financial statements. The introductory section, combining and individual fund financial statements, and statistical section are presented for purposes of additional analysis and are not a required part of the basic financial statements.
The combining and individual fund financial statements are the responsibility of management and were derived from and relate directly to the underlying accounting and other records used to prepare the basic financial statements. Such information has been subjected to the auditing procedures applied in the audit of the basic financial statements and certain additional procedures, including comparing and reconciling such information directly to the underlying accounting and other records used to prepare the basic financial statements or to the basic financial statements themselves, and other additional procedures in accordance with auditing standards generally accepted in the United States of America. In our opinion, the combining and individual fund financial statements are fairly stated, in all material respects, in relation to the basic financial statements as a whole.
The introductory and statistical sections have not been subjected to the auditing procedures applied in the audit of the basic financial statements and, accordingly, we do not express an opinion or provide any assurance on them.
Other Reporting Required by Government Auditing Standards
In accordance with Government Auditing Standards, we have also issued our report dated November 3, 2017, on our consideration of MTS’s internal control over financial reporting and on our tests of its compliance with certain provisions of laws, regulations, contracts, and grant agreements and other matters. The purpose of that report is to describe the scope of our testing of internal control over financial reporting and compliance and the results of that testing, and not to provide an opinion on internal control over financial reporting or on compliance. That report is an integral part of an audit performed in accordance with Government Auditing Standards in considering MTS’s internal control over financial reporting and compliance.
San Diego, California November 3, 2017

San Diego Metropolitan Transit System Management's Discussion and Analysis
June 30, 2017 and 2016
3
The following discussion and analysis of the financial performance of the San Diego Metropolitan Transit System (MTS) is intended to provide an overview of MTS’s financial activities for the fiscal years ended June 30, 2017 and 2016. This information should be used in conjunction with the Letter of Transmittal, which can be found on pages i through v of this report. Financial Highlights
Net position, as reported in the statement of net position, totaled $1,724 million as of June 30, 2017, $1,738 million as of June 30, 2016, and $1,673 million as of June 30, 2015. Of this amount, $(20) million was the unrestricted deficit as of June 30, 2017, $(32) million was the unrestricted deficit as of June 30, 2016, and $(32) million was the unrestricted deficit as of June 30, 2015. Total net position decreased by $13 million in the current year and increased by $65 million in the prior year. The current year decrease is attributable to an increase in operating expenses and a decrease in federal funding and contributed capital, partially offset by increases in Transportation Development Act (TDA) and other state revenue funding.
For the year ended June 30, 2017, the combined farebox recovery ratio (the measure of the ability to recover operating costs through fare revenue) for San Diego Trolley, Inc., San Diego Transit Corporation, and MTS Contracted Services was 36.14% compared to 38.99% for the year ended June 30, 2016 and 40.52% for June 30, 2015. The current year decrease is due primarily to an increase in personnel costs and decrease in passenger revenue.
Overview of the Financial Statements This discussion and analysis is intended to serve as an introduction to MTS’s financial statements. The financial statements are comprised of two components: 1) financial statements and, 2) notes to financial statements. This report also contains other supplementary information in addition to the financial statements themselves.
Financial statements. The financial statements are designed to provide readers with a broad overview of MTS’s finances, in a manner similar to a private-sector business.
The statement of net position presents information on all of MTS’s assets, deferred outflow of resources, liabilities, and deferred inflow of resources with the difference between the four reported as net position. Over time, increases or decreases in net position may serve as a useful indicator of whether the financial position of MTS is improving or deteriorating.
The statement of revenues, expenses and changes in net position presents information showing how net position changed during the most recent fiscal year. All changes in net position are reported as soon as the underlying event giving rise to the change occurs, regardless of the timing of related cash flows. Thus, revenues and expenses are reported in this statement for some items that will only result in cash flows in future fiscal periods (e.g., earned but unused vacation leave).
The statement of cash flows presents information showing the sources and uses of cash related to operating activities, noncapital financing activities, capital and related financing activities and investing activities. In addition, the statement provides information about significant non-cash investing, capital and financing activities.
Since MTS’s primary function is to provide transportation services to the region’s citizens and recover costs through user fees and charges, the financial statements include business-type activities. In addition, the financial statements include not only MTS itself (known as the primary government), but also two legally separate transit operators and one legally separate freight railway, for which MTS is financially accountable: San Diego and Arizona Eastern Railway Company (SD&AE).
Notes to basic financial statements. The notes provide additional information that is essential to a full understanding of the data provided in the financial statements.

San Diego Metropolitan Transit System Management's Discussion and Analysis (Continued)
June 30, 2017 and 2016
4
Other information. In addition to the financial statements and accompanying notes, this report also presents certain required supplementary information concerning MTS’s progress in funding its obligation to provide pension and other post-employment benefits to its employees. Financial Analysis As noted earlier, net position may serve over time as a useful indicator of an entity’s financial stability. In the case of MTS, net position was $1,724 million at the close of the most recent fiscal year and $1,738 million at the end of FY2016. The largest portion of MTS’s net position reflects the investment in capital assets, net of accumulated depreciation, reduced by any outstanding bonds or other borrowings and deferred inflows and outflows of resources (Net Investment in Capital Asset). Most of the investment in capital assets is comprised of trolley system assets, buses, and in construction-in-progress totaling $36 million, of which the largest projects are the Enterprise Resource Planning (ERP) and Transit Asset Management System (TAM) and the procurement of new Siemens SD8 Light Rail Vehicles (LRVs), at $9.5 and $9.2 million respectively. The ERP/TAM project continues to streamline the way we do business and improves management of the assets in our system. The LRV procurement with Siemens is for 45 LRVs. Of the 45 LRVs, nine are being funded by MTS with California Cap-and-Trade funding and the remaining 36 being are being funded by the SANDAG Mid-Coast project. Of the nine funded by MTS, the first LRV is expected to be delivered by November 2018 and the ninth is expected to be delivered in early 2019. Prior year construction-in-progress totaled $41 million, of which the largest project under construction included the Regional Transportation Management System, $11.5 million. The capital assets that are represented by construction-in-progress will be used to provide services to citizens; consequently, these assets are not available for future spending. In FY2017, MTS transferred completed projects worth $59 million to SDTC, SDTI and Other Contracted Services compared to $47 million in FY2016. The balance in the unrestricted component of net position increased by $12 million during the current year and increased $232 thousand in the prior year. Total assets decreased by $13 million primarily due to capital assets decreasing by $22 million, partially offset by an increase in cash and cash equivalents of $13 million. In FY2016, total assets increased by $52 million. In the current fiscal year, total liabilities increased by $38 million primarily due to the increase in net pension liability of $49 million, partially offset by the reduction in subsidy revenue due to SANDAG of $5 million. In the previous year, total liabilities increased by $5 million.
June 30, 2017 June 30, 2016 Change June 30, 2015 Change
Current and other assets $ 212,694,682 $ 203,698,269 $ 8,996,413 $ 194,475,830 $ 9,222,439 Capital assets 1,741,107,404 1,762,821,219 (21,713,815) 1,720,337,305 42,483,914
Total assets 1,953,802,086 1,966,519,488 (12,717,402) 1,914,813,135 51,706,353
Deferred outflows of resources 70,889,473 35,443,795 35,445,678 17,417,561 18,026,234
Current and other liabilities 58,940,833 67,960,531 (9,019,698) 81,837,558 (13,877,027)Long-term liabilities outstanding 228,646,665 181,892,332 46,754,333 163,147,079 18,745,253
Total liabilities 287,587,498 249,852,863 37,734,635 244,984,637 4,868,226
Deferred inflows of resources 12,919,118 14,601,102 (1,681,984) 14,614,264 (13,162)
Net position:Net investment in capital assets 1,739,359,691 1,760,427,432 (21,067,741) 1,699,222,253 61,205,179 Restricted 4,440,262 8,750,133 (4,309,871) 5,309,440 3,440,693 Unrestricted (deficit) (19,615,010) (31,668,247) 12,053,237 (31,899,898) 231,651
Total net position $1,724,184,943 $1,737,509,318 $ (13,324,375) $1,672,631,795 $ 64,877,523

San Diego Metropolitan Transit System Management's Discussion and Analysis (Continued)
June 30, 2017 and 2016
5
Decreases in operating revenue are attributable to a decrease in passenger revenue of $5 million, partially offset by an increase in Compressed Natural Gas (CNG) credits totaling $3 million. Variances between FY2017 and FY2016 nonoperating revenues are attributable to significant decreases in Federal and other local subsidies, partially offset by an increase in other state revenues. The current year increase in operating expenses is attributable to an increase in depreciation expense associated with the acquisition of new capital assets, personnel costs, outside services and materials and supplies.
June 30, 2017 June 30, 2016 Change June 30, 2015 Change
Revenues:Operating revenues:
Passenger revenue $ 93,279,455 $ 97,913,890 $ (4,634,435) $ 97,620,664 $ 293,226 Other operating revenue 20,241,852 16,749,300 3,492,552 10,165,340 6,583,960
Nonoperating revenues: Federal revenue 72,404,730 81,901,246 (9,496,516) 60,474,595 21,426,651
Transportation Development Act 94,915,733 90,869,756 4,045,977 87,358,869 3,510,887 State Transit Assistance 12,918,834 14,720,378 (1,801,544) 18,787,817 (4,067,439) State revenue - other 14,183,196 5,724,586 8,458,610 42,953,271 (37,228,685) TransNet funds 37,270,235 35,898,669 1,371,566 21,625,551 14,273,118 Other nonoperating revenue 2,114,713 9,373,662 (7,258,949) 7,687,264 1,686,398
Total revenues 347,328,748 353,151,487 (5,822,739) 346,673,371 6,478,116
Expenses:Operating expenses 407,991,373 380,821,790 27,169,583 358,901,485 21,920,305 Nonoperating expenses 962,775 1,070,914 (108,139) 6,882,602 (5,811,688)
Total expenses 408,954,148 381,892,704 27,061,444 365,784,087 16,108,617
Increase (decrease) in net positionbefore capital contributions (61,625,400) (28,741,217) (32,884,183) (19,110,716) (9,630,501)
Capital contributions 48,301,025 93,618,740 (45,317,715) 245,716,854 (152,098,114)
Changes in net position (13,324,375) 64,877,523 (78,201,898) 226,606,138 (161,728,615)
Net Position:Beginning of year, as originally reported 1,737,509,318 1,672,631,795 64,877,523 1,583,061,953 89,569,842
Restatements due to implementation of GASB 68 - - - (137,036,296) 137,036,296
Beginning of year, as restated 1,737,509,318 1,672,631,795 64,877,523 1,446,025,657 226,606,138
End of year 1,724,184,943$ 1,737,509,318$ (13,324,375)$ 1,672,631,795$ 64,877,523$

San Diego Metropolitan Transit System Management's Discussion and Analysis (Continued)
June 30, 2017 and 2016
6
Capital Asset and Debt Administration Capital assets. MTS’s investment in capital assets net of accumulated depreciation as of June 30, 2017 and 2016 amounted to $1,741 million and $1,763 million respectively. This investment in capital assets includes land, buildings, vehicles, equipment, and construction-in-progress. Major capital asset events during the current fiscal year included the following:
MTS continues to modernize the bus fleet. In FY2017, 115 buses were placed into service for a total cost of $29 million, compared to FY2016, 63 buses were placed into service for a total cost of $37 million.
MTS expanded its communication system to the contracted bus operations in FY2017 at a total cost of $12 million.
Completed capital projects totaling $48 million were transferred from SANDAG to MTS and its component units during FY2017, compared to $94 million contributed in FY2016.
2017 2016 2015
Land $ 256,922,883 $ 256,922,883 $ 256,922,883 Buildings 968,444,183 975,356,436 945,992,877 Vehicles 426,479,686 441,587,804 447,072,544 Equipment & other 53,087,922 47,681,919 50,102,873 Construction-in-progress 36,172,730 41,272,177 20,246,128
Total $ 1,741,107,404 $ 1,762,821,219 $ 1,720,337,305
CAPITAL ASSETS(Net of Accumulated Depreciation)
Additional information on MTS’s capital assets can be found in Note 5 to the financial statements. Long-term debt. At the end of the current fiscal year, MTS has one capital lease obligation outstanding in the amount of $1.7 million. In addition, MTS has one finance obligation outstanding relating to Pension Obligation Bonds issued in fiscal year 2005 for a total obligation of $17.7 million. Additional information about MTS's long-term debt can be found in Note 8 to the financial statements. Bond Ratings Standard & Poor's Ratings Services provided an underlying rating for the Pension Obligation Bonds at "AA-" with a stable outlook in 2016, the outlook was previously positive in 2015. Additional information on MTS’s long-term debt can be found in Note 8 to the financial statements. Requests for Information This financial report is designed to provide a general overview of MTS’s finances for all those with an interest in the government’s finances. If you have questions concerning any of the information provided in this report or need additional financial information, visit our website at www.sdmts.com or direct inquiries to the Controller, MTS, 1255 Imperial Avenue, Suite 1000, San Diego, CA 92101.

7
BASIC FINANCIAL STATEMENTS

San Diego Metropolitan Transit System Statements of Net Position
June 30, 2017 and 2016
See Accompanying Notes to Basic Financial Statements. 8
2017 2016
ASSETS
Current assets:
Cash and cash equivalents 90,342,822$ 77,394,644$
Cash and cash equivalents restricted for capital support 6,743,868 13,508,715 Accounts and other receivables 9,852,134 7,935,944
Due from other governments 83,032,780 82,789,378
Inventory 19,935,276 19,596,426
Prepaid items and other current assets 2,787,802 2,463,241
Total current assets 212,694,682 203,688,348
Noncurrent assets:Capital assets, net of accumulated depreciation 1,741,107,404 1,762,821,219 Aggregate net pension asset - 9,921
Total noncurrent assets 1,741,107,404 1,762,831,140
Total assets 1,953,802,086 1,966,519,488
DEFERRED OUTFLOWS OF RESOURCESContributions made after the measurement date 17,802,710 15,496,003 Actuarial pension calculations:
Differences between projected and actual earnings on pension plan investments 32,303,322 18,194,912 Differences between expected and actual experience 638,684 1,610,468 Adjustments due to differences in proportions 91,415 142,412 Changes in assumption 20,053,342 -
Total deferred outflows of resources 70,889,473 35,443,795

San Diego Metropolitan Transit System Statements of Net Position (Continued)
June 30, 2017 and 2016
See Accompanying Notes to Basic Financial Statements. 9
2017 2016
LIABILITIESCurrent liabilities:
Accounts payable 20,296,850 20,357,013
Due to other governments 12,571,811 19,543,938
Unearned revenue 6,336,420 6,588,988
Accrued expenses 3,020,613 2,425,171
Retentions payable 352,438 90,042
Retentions payable from restricted assets 2,303,606 4,758,582
Due within one year:Compensated absences payable 6,086,017 6,968,657
Accrued damage, injury, and employee claims 4,981,633 4,377,066
Long-term debt 2,991,445 2,851,074
Total current liabilities 58,940,833 67,960,531
Noncurrent liabilities:
Due in more than one year:Compensated absences payable 4,903,862 4,215,464
Accrued damage, injury, and employee claims 10,653,209 11,218,084
Aggregate net pension liability 178,105,281 129,535,809
Net other postemployment benefits obligation 18,573,045 17,520,262 Long-term debt 16,411,268 19,402,713
Total noncurrent liabilities 228,646,665 181,892,332
Total liabilities 287,587,498 249,852,863
DEFERRED INFLOWS OF RESOURCESDeferred gain on refunding 221,938 313,775 Actuarial pension calculations:
Differences between projected and actual earnings on pension plan investments 6,884,556 10,326,835 Adjustments due to differences in proportions 1,417,393 421,843 Differences between actual and proportionate shares of employer contributions 440,180 323,386 Differences between expected and actual experience 1,914,686 415,807 Changes in assumptions 2,040,365 2,799,456
Total deferred inflows of resources 12,919,118 14,601,102
NET POSITIONNet investment in capital assets 1,739,359,691 1,760,427,432 Restricted for capital projects 4,440,262 8,750,133 Unrestricted (Deficit) (19,615,010) (31,668,247)
Total net position 1,724,184,943$ 1,737,509,318$

10
This page intentionally left blank.

San Diego Metropolitan Transit System Statements of Revenues, Expenses and Changes in Net Position
For the Years Ended June 30, 2017 and 2016
See Accompanying Notes to Basic Financial Statements. 11
2017 2016
Operating revenues:Passenger revenue $ 93,279,455 $ 97,913,890 Advertising 1,378,618 968,078 Miscellaneous 18,863,234 15,781,222
Total operating revenues 113,521,307 114,663,190
Operating expenses:Personnel costs 137,020,625 121,921,667 Outside services 97,800,332 94,801,673 Transit operations funding 463,345 490,882 Materials and supplies 13,065,035 9,714,608 Energy costs 25,552,178 24,530,708 Risk management 4,275,569 4,864,496 Miscellaneous 5,934,284 4,978,102 Depreciation 123,880,005 119,519,654
Total operating expenses 407,991,373 380,821,790
Operating (loss) (294,470,066) (266,158,600)
Public support and nonoperating revenues (expenses):Federal revenue 72,404,730 81,901,246 Transportation Development Act (TDA) funds 94,915,733 90,869,756 State Transit Assistance (STA) funds 12,918,834 14,720,378 State revenue - other 14,183,196 5,724,586 TransNet funds 37,270,235 35,898,669 Other local subsidies 1,082,697 6,648,825 Investment earnings 636,068 291,659 Interest expense (962,775) (1,070,914)Gain on disposal of assets 395,948 2,433,178
Total public support and nonoperating revenues (expenses) 232,844,666 237,417,383
(Loss) before contributed capital (61,625,400) (28,741,217) Contributed capital, net 48,301,025 93,618,740
Changes in net position (13,324,375) 64,877,523
Net Position:Beginning of year 1,737,509,318 1,672,631,795
End of year $ 1,724,184,943 $ 1,737,509,318
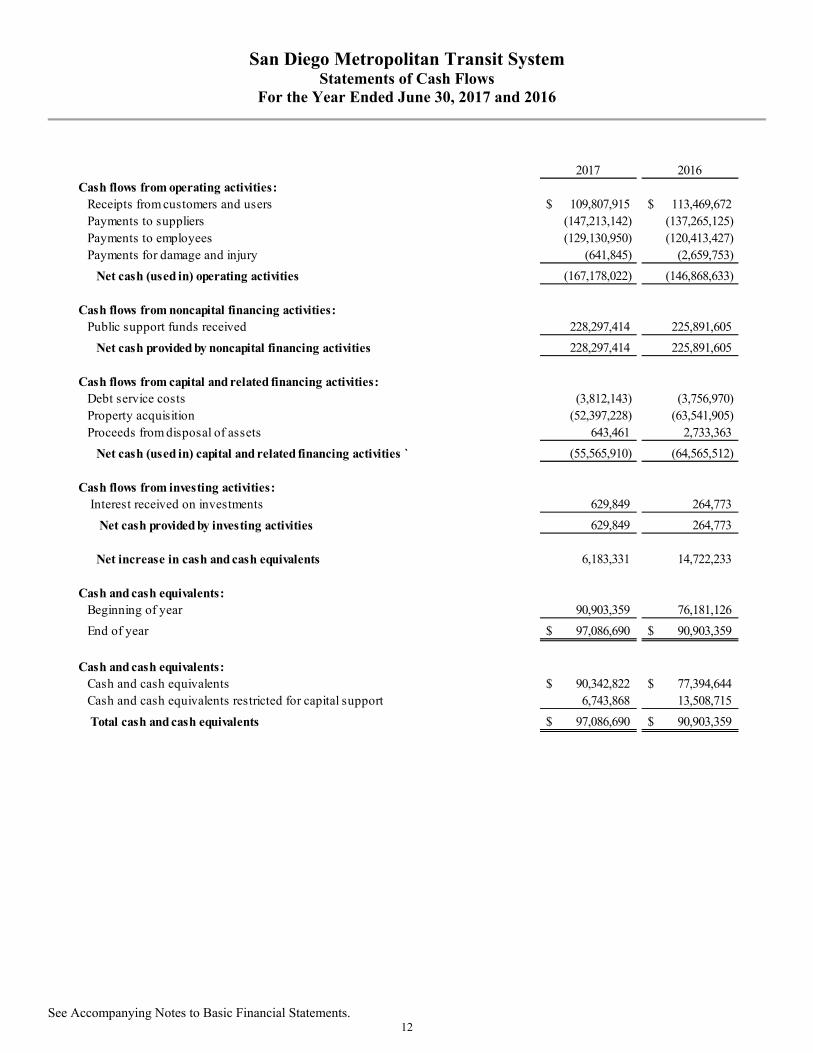
San Diego Metropolitan Transit System Statements of Cash Flows
For the Year Ended June 30, 2017 and 2016
See Accompanying Notes to Basic Financial Statements. 12
2017 2016
Cash flows from operating activities: Receipts from customers and users $ 109,807,915 $ 113,469,672 Payments to suppliers (147,213,142) (137,265,125)Payments to employees (129,130,950) (120,413,427)Payments for damage and injury (641,845) (2,659,753)
Net cash (used in) operating activities (167,178,022) (146,868,633)
Cash flows from noncapital financing activities: Public support funds received 228,297,414 225,891,605
Net cash provided by noncapital financing activities 228,297,414 225,891,605
Cash flows from capital and related financing activities: Debt service costs (3,812,143) (3,756,970)Property acquisition (52,397,228) (63,541,905)Proceeds from disposal of assets 643,461 2,733,363
Net cash (used in) capital and related financing activities ` (55,565,910) (64,565,512)
Cash flows from investing activities: Interest received on investments 629,849 264,773
Net cash provided by investing activities 629,849 264,773
Net increase in cash and cash equivalents 6,183,331 14,722,233
Cash and cash equivalents:Beginning of year 90,903,359 76,181,126
End of year $ 97,086,690 $ 90,903,359
Cash and cash equivalents:Cash and cash equivalents $ 90,342,822 $ 77,394,644 Cash and cash equivalents restricted for capital support 6,743,868 13,508,715
Total cash and cash equivalents $ 97,086,690 $ 90,903,359

San Diego Metropolitan Transit System Statements of Cash Flows (Continued)
For the Year Ended June 30, 2017 and 2016
See Accompanying Notes to Basic Financial Statements. 13
2017 2016
Reconciliation of Operating (Loss) tonet cash (used in) operating activities
Operating (loss) (294,470,066)$ (266,158,600)$ Adjustments to reconcile operating (loss) to
net cash (used in) operating activities: Depreciation 123,880,005 119,519,654 (Increase) decrease in:
Accounts and other receivables (1,867,463) (3,016,854) Due from other governments (1,850,442) (1,652,285) Inventory (338,850) (1,219,678) Prepaid items and other current assets (324,561) (44,975)
Increase (decrease) in: Accounts payable (2,252,743) 7,187,345 Due to other governments (352,486) 657,841 Accrued expenses 595,442 (5,044,356) Unearned revenue (252,568) 3,475,621 Aggregate net pension liability 9,236,861 (16,644) Net other postemployment benefits obligation 1,052,783 1,105,292 Compensated absences payable (194,242) (274,594) Accrued damage, injury and employee claims (39,692) (1,386,400)
Total adjustments 127,292,044 119,289,967
Net cash (used in) operating activities (167,178,022)$ (146,868,633)$
Interest paid 1,041,427$ 1,170,788$
Noncash investing, capital, and financing activities: Contributions of capital assets from SANDAG 48,301,025$ 94,038,740$ Contributions/adjustments of capital assets from outside parties - (420,000)
Total contributions of capital assets 48,301,025$ 93,618,740$
Increase (decrease) in fair value of investments (75,253)$ 35,127$

14
This page intentionally left blank.

15
NOTES TO BASIC FINANCIAL STATEMENTS

San Diego Metropolitan Transit System Notes to Basic Financial Statements
For the Years Ended June 30, 2017 and 2016
16
Table of Contents
Page Note 1 – Summary of Significant Accounting Policies ..................................................................................... 17
A. Reporting Entity ....................................................................................................................................... 17 B. Financial Statements ................................................................................................................................. 18 C. Measurement Focus, Basis of Accounting, and Financial Statement Presentation .................................. 18 D. Use of Restricted/Unrestricted Assets ...................................................................................................... 21 E. Cash, Cash Equivalents, and Investments ................................................................................................ 21 F. Inventory .................................................................................................................................................. 22 G. Prepaid Items and Other Assets ................................................................................................................ 22 H. Capital Assets ........................................................................................................................................... 22 I. Construction-in-Progress .......................................................................................................................... 22 J. Compensated Absences ............................................................................................................................ 22 K. Long-Term Obligations ............................................................................................................................ 23 L. Refunding of Debt .................................................................................................................................... 23 M. Pension ..................................................................................................................................................... 23 N. Net Position .............................................................................................................................................. 23 O. Use of Estimates ....................................................................................................................................... 23 P. Implementation of New GASB Pronouncements for the Year Ended June 30, 2017 .............................. 24 Q. Upcoming Government Accounting Standards for the Year Ended June 30, 2018 ................................. 25
Note 2 – Cash, Cash Equivalents, and Investments .......................................................................................... 26
Note 3 – Accounts Receivable ............................................................................................................................. 29
A. Accounts and Other Receivables .............................................................................................................. 29 B. Due from Other Governments .................................................................................................................. 29
Note 4 – Inventory ............................................................................................................................................... 29
Note 5 – Capital Assets ........................................................................................................................................ 30
Note 6 – Due to Other Governments .................................................................................................................. 32
Note 7 – Unearned Revenue ................................................................................................................................ 32
Note 8 – Long-Term Debt ................................................................................................................................... 33
A. Summary .................................................................................................................................................. 33 B. Capital Lease ............................................................................................................................................ 35 C. Pension Obligation Bonds ........................................................................................................................ 36
Note 9 – Risk Management ................................................................................................................................. 36
Note 10 – Contingencies ...................................................................................................................................... 37
Note 11 – Post-Employment Health Care Benefits ........................................................................................... 38
Note 12 – Employee Retirement Systems .......................................................................................................... 41
A. Summary .................................................................................................................................................. 41 B. MTS ..................................................................................................................................................... 44 C. SDTI ..................................................................................................................................................... 54 D. SDTC ..................................................................................................................................................... 66
Note 13 – Other Required Individual Fund Disclosures .................................................................................. 72

San Diego Metropolitan Transit System Notes to Basic Financial Statements (Continued)
For the Years Ended June 30, 2017 and 2016
17
Note 1 – Summary of Significant Accounting Policies
The accompanying basic financial statements of the San Diego Metropolitan Transit System (MTS) have been prepared in conformity with generally accepted accounting principles in the United States (U.S. GAAP) as applied to governmental units. The Governmental Accounting Standards Board (GASB) is the accepted standard-setting body for establishing governmental accounting and financial reporting standards. The more significant of MTS’s accounting policies are described below. A. Reporting Entity
MTS (also known as San Diego Metropolitan Transit Development Board) was formed on January 26, 1976 by passage of California Senate Bill 101 to plan, construct, and operate (or let contracts to operate) exclusive public mass transit guideways in the urbanized south coastal area of San Diego County. MTS has certain responsibilities for near-term transportation planning and administration of federal and state transportation funds within the area under its jurisdiction. The Board of Directors of MTS consists of 15 members composed of four appointees from the San Diego City Council; one appointee each from the cities of Chula Vista, Coronado, El Cajon, Imperial Beach, La Mesa, Lemon Grove, National City, Poway, and Santee; one appointee from the San Diego County Board of Supervisors; and a chairman elected by the other 14 members.
On January 1, 2003, California Senate Bill 1703 (SB 1703) became effective. SB 1703 required the consolidation of the planning and programming functions of MTS and the North County Transit District (NCTD) into the San Diego Association of Governments (SANDAG) in an initial transfer to take place prior to July 1, 2003. SB 1703 also required the consolidation of certain project development and construction functions of MTS and NCTD into SANDAG in a subsequent transfer to take place prior to January 30, 2004. The initial transfer occurred on July 1, 2003, and the subsequent transfer occurred on October 13, 2003. With these actions, employees were transferred from MTS and NCTD to SANDAG, and certain planning, development, and construction functions were also transferred. As a result, MTS’s activities since the consolidation have been focused on operating public transit systems in the urbanized area identified above. In addition to the consolidation required by SB 1703, MTS dissolved the independent Board of Directors of San Diego Transit Corporation (SDTC) and Board of Directors of San Diego Trolley, Inc. (SDTI). MTS now acts as the Board of Directors for all three agencies: MTS, SDTC, and SDTI. Beginning in FY2004, SDTC and SDTI are presented as blended component units.
These basic financial statements present MTS and its legally separate component units, entities for which MTS is considered to be financially accountable. Because MTS appoints a majority of the component units’ boards of directors, the boards are substantively the same, and MTS is able to impose its will on the component units, MTS presents blended component units. Blended component units, although legally separate entities, are, in substance, part of MTS's operations.
Included within the reporting entity as blended component units:
San Diego Transit Corporation: On July 1, 1985, MTS purchased the assets used by and acquired sole ownership of San Diego Transit Corporation (SDTC) from the City of San Diego for $1. SDTC has entered into an operating agreement with MTS to operate a public transportation bus system in the City of San Diego and certain regional routes within MTS’s jurisdictions. The current agreement, which was approved in December 2006, was renewed on June 23, 2011, as an open-ended agreement terminable upon six months' notice by either party. SDTC continues to provide local service to a number of adjoining cities under pre-existing contracts. Purchases or construction of bus capital items are made by MTS, with whom title remains, and are contributed to SDTC upon completion of a project or when individually purchased by MTS. SDTC’s assets, deferred outflows, liabilities, deferred inflows, net position, revenues, and expenses are included in MTS’s financial statements as a blended component unit. This agency has the same governing board as MTS and provides services directly to the public.

San Diego Metropolitan Transit System Notes to Basic Financial Statements (Continued)
For the Years Ended June 30, 2017 and 2016
18
Note 1 – Summary of Significant Accounting Policies (Continued) A. Reporting Entity (Continued)
San Diego Trolley, Inc.: San Diego Trolley, Inc. (SDTI) was organized by MTS in August 1980. SDTI was created to operate and maintain the Light Rail Transit (LRT) system pursuant to an operating agreement with MTS. The current agreement, which was approved in December 2006, was renewed on June 23, 2011, as an open-ended agreement terminable upon six months' notice by either party. Purchases or construction of LRT capital items are made by MTS, with whom title remains, and are contributed to SDTI upon completion of a project or when individually purchased by MTS. SDTI’s assets, deferred outflows, liabilities, deferred inflows, net position, revenues, and expenses are included in MTS’s financial statements as a blended component unit. This agency has the same governing board as MTS and provides services directly to the public.
San Diego and Arizona Eastern Railway Company: MTS purchased the San Diego and Arizona Eastern Railway Company (SD&AE) in 1979. SDTI operates on a portion of the line and private operators provide freight service on a portion of the line. Purchases of capital items are made by MTS, with whom title remains, and are contributed to SD&AE. Since SD&AE provides almost exclusive benefit to MTS, its assets, deferred outflows, liabilities, deferred inflows, net position, revenues, and expenses are included in MTS’s financial statements as a blended component unit. Separate financial reports are not available.
B. Financial Statements
The Financial Statements (i.e., the statement of net position, the statement of revenues, expenses and changes in net position, and statement of cash flows) report information on all of the activities of the primary government and its component units. The statement of revenues, expenses, and changes in net position demonstrates the degree to which the direct expenses of a given function or segment are offset by program revenues. Direct expenses are those that are clearly identifiable with a specific function or segment.
C. Measurement Focus, Basis of Accounting, and Financial Statement Presentation
The Financial Statements are reported using the “economic resources” measurement focus and the accrual basis of accounting. Revenues are recorded when earned and expenses are recorded when a liability is incurred, regardless of the timing of related cash flows. Grants and similar items are recognized as revenue as all eligibility requirements have been met. Interest associated with the current fiscal period is considered to be susceptible to accrual and so has been recognized as revenue of the current fiscal period. In accordance with GASB Statement No. 63, Financial Reporting of Deferred Outflows of Resources, Deferred Inflows of Resources, and Net Position, the Statement of Net Position reports separate sections for Deferred Outflows of Resources, and Deferred Inflows of Resources, when applicable. Deferred Outflows of Resources represent outflows of resources (consumption of net position) that apply to future periods and that, therefore, will not be recognized as an expense until that time. Deferred Inflows of Resources (acquisition of net position) that apply to future periods and that, therefore, are not recognized as a revenue until that time.
San Diego Metropolitan Transit System Notes to Basic Financial Statements (Continued)
For the Years Ended June 30, 2017 and 2016
19
Note 1 – Summary of Significant Accounting Policies (Continued)
C. Measurement Focus, Basis of Accounting, and Financial Statement Presentation (Continued) MTS receives funding primarily from the following revenue sources:
Passenger Revenue Passenger fares comprised approximately 35 percent and 37 percent of MTS's $269.8 million and $265.0 million operating budget for FY2017 and FY2016, respectively. Other Operating Revenues MTS receives a variety of operating revenues that are not received directly from passenger fares. The sources of these revenues are advertising, interest income, rental and land management income, income related to Taxicab administration, income from the SD&AE, and other miscellaneous income. Non Operating Revenues MTS receives subsidies that are derived from federal, state and local tax revenues. MTS does not levy or collect any tax funds, but receives allocated portions of tax funds through federal, state and local granting agencies. Federal Transit Administration (FTA) FTA revenues are funded by a federal gas tax and revenues of the federal general fund. Moving Ahead for Progress in the 21st Century (MAP-21) was reauthorized on a short-term basis multiple times before being replaced by the Fixing America's Surface Transportation (FAST) Act, signed into law on December 4, 2015. The FAST Act reauthorized surface transportation programs through September 30, 2020. Under the FAST Act, MTS receives Section 5307 and Section 5337 grants which are earmarked for capital assistance and preventive maintenance. Under MAP-21, transit agencies were not eligible to be direct recipients of Section 5339 Bus and Bus Facilities Funding. However, under FAST Act, MTS is now an eligible direct recipient of Section 5339 formula funds. In addition, MTS also receives Section 5311 and Section 5311F grants for operations. Transit Security Grant Program (TSGP) The Transit Security Grant Program (TSGP) is administered by the Department of Homeland Security (DHS). The program provides funds to owners and operators of transit systems to protect critical surface transportation infrastructure and the traveling public from acts of terrorism, major disasters, and other emergencies. Transit and Intercity Rail Capital Program (TIRCP) The TIRCP is a discretionary program that was created by Senate Bill (SB) 862 (Chapter 36, Statutes of 2014) and modified by Senate Bill 9 (Chapter 710, Statutes of 2015) to provide grants from the Greenhouse Gas Reduction Fund to fund transformative capital improvements that will modernize California’s intercity, commuter, and urban rail systems, and bus and ferry transit systems to reduce emissions of greenhouse gases by reducing congestion and vehicle miles travelled throughout California. MTS was awarded $31.9 million in 2015 for the construction of a new trolley station at the courthouse complex and the procurement of 9 LRVs for more frequent service on the Blue and Orange Lines. Both projects are currently underway. Compressed Natural Gas Rebate Alternative fuel credits are issued by the IRS to MTS for utilizing compressed natural gas to power its vehicles. This rebate program is reviewed annually as part of the federal tax code, and was approved again for calendar year 2017.

San Diego Metropolitan Transit System Notes to Basic Financial Statements (Continued)
For the Years Ended June 30, 2017 and 2016
20
Note 1 – Summary of Significant Accounting Policies (Continued)
C. Measurement Focus, Basis of Accounting, and Financial Statement Presentation (Continued)
Transportation Development Act (TDA) TDA provides funding for public transit operators. This state fund is one quarter of a percent of the 7.75 percent sales tax assessed in the region. SANDAG is responsible for apportionment of these funds within the San Diego region. As economic conditions improve, sales tax receipts have increased over the prior year, and as a result the TDA funds available for disbursement have increased as well. State Transit Assistance (STA) STA funding comes from the Public Transportation Act (PTA) which derives its revenue from the state sales tax on gasoline. These funds are designated as discretionary or formula. The former is appropriated by the legislature. The latter is a formula based upon population and fares generated. Proposition 1B Revenue (Prop 1B) The California Public Transportation Modernization, Improvement and Service Enhancement Act of 2006, approved by the voters as Proposition 1B (Prop 1B) in November 2006, authorizes the issuance of $19.9 billion in general obligation bonds for the purpose of improving highway safety, traffic reduction, air quality, and port security.
Low Carbon Transit Operations Program (LCTOP): The Low Carbon Transit Operations Program (LCTOP) is one of several programs that are part of the Transit, Affordable Housing, and Sustainable Communities Program established by the California Legislature in 2014 by Senate Bill 862. The LCTOP was created to provide operating and capital assistance for transit agencies to reduce greenhouse gas emission and improve mobility, with a priority on serving disadvantaged communities. Approved projects in LCTOP will support new or expanded bus or rail services, expand intermodal transit facilities, and may include equipment acquisition, fueling, maintenance and other costs to operate those services or facilities, with each project reducing greenhouse gas emissions. Senate Bill 862 continuously appropriates five percent of the annual auction proceeds in the Greenhouse Gas Reduction Fund for LCTOP, beginning in 2015-16. Other State Revenue MediCal provides further funding support specifically tied to several ADA Paratransit routes to aid patients in their transportation to medical appointments. TransNet TransNet funds are derived from the Proposition A one-half cent local transportation sales tax that was approved by area voters in November 1987. The original ordinance expired in 2008, but has since been extended to 2048 by subsequent voter approval. The ordinance allocated one-third of the sales tax proceeds for transit purposes, which are further divided between MTS and NCTD based on the proportion of the population within the area of each jurisdiction. TransNet funds are also apportioned by SANDAG. Other Local Subsidies The City of San Diego provides Maintenance of Effort funds to aid ADA efforts. In addition, SANDAG provides funds for the operation of certain express bus routes and NCTD provides partial subsidy for the Sorrento Valley Coaster Connection.

San Diego Metropolitan Transit System Notes to Basic Financial Statements (Continued)
For the Years Ended June 30, 2017 and 2016
21
Note 1 – Summary of Significant Accounting Policies (Continued) D. Use of Restricted/Unrestricted Assets
When both restricted and unrestricted resources are available for use, it is MTS’s policy to use restricted resources first, then unrestricted resources as they are needed.
E. Cash, Cash Equivalents, and Investments
Investments of pooled cash consist primarily of bankers’ acceptances, certificates of deposit, pooled investment funds, liquidity funds, governmental bonds, and commercial paper. Investments are stated at fair value, which is based on quoted market price. Money market investments and participating interest earning investment contracts that have a remaining maturity at the time of purchase of one year or less are reported at amortized cost, which approximates fair value. For purposes of the statement of cash flows, all highly liquid temporary investments purchased with a maturity of three months or less are considered cash equivalents. MTS participates in an investment pool managed by the State of California titled Local Agency Investment Fund (LAIF), which has invested a portion of the pool funds in structured notes and asset-backed securities. LAIF’s investments are subject to credit risk with the full faith and credit of the State of California collateralizing these investments. In addition, these structured notes and asset-backed securities are subject to market risk and to change in interest rates. The reported value of the pool is the same as the fair value of the pool shares. MTS also participates in the San Diego County Investment Pool, which is a local government investment pool managed by the County Treasurer's Office on behalf of the Investment Pool participants. Certain disclosure requirements, if applicable for deposit and investment risk, are specified for the following areas:
Interest Rate Risk Credit Risk
Overall Custodial Credit Risk Concentration of Credit Risk
Foreign Currency Risk In accordance with GASB Statement No. 72, Fair Value Measurement and Application, defines fair value, establishes a framework for measuring fair value and establishes disclosures about fair value measurement. Investments, unless otherwise specified, recorded at fair value in the Statements of Net Position, are categorized based upon the level of judgement associated with the inputs used to measure their fair value. Levels of inputs are as follows:
Level 1 - Inputs are unadjusted, quoted prices for identical assets and liabilities in active markets at the measurement date. Level 2 - Inputs, other than quoted prices included in Level 1, that are observable for the asset or liability through corroboration with market data at the measurement date. Level 3 - Unobservable inputs that reflect management's best estimate of what market participants would use in pricing the asset or liability at the measurement date.

San Diego Metropolitan Transit System Notes to Basic Financial Statements (Continued)
For the Years Ended June 30, 2017 and 2016
22
Note 1 – Summary of Significant Accounting Policies (Continued)
F. Inventory
Inventories are valued at the weighted average unit cost.
G. Prepaid Items and Other Assets
Payments made to vendors for services that will benefit periods beyond the fiscal year ended are recorded as prepaid items.
H. Capital Assets
Capital assets include land and right-of-way, buildings and infrastructure assets, vehicles, and equipment. Capital assets are defined by the government as assets with an initial, individual cost of more than $5,000. Such assets are recorded at historical cost or estimated historical cost if purchased or constructed. Donated capital assets, donated works of art and similar items, and capital assets received in a service concession arrangement are recorded at acquisition value.
The costs of normal maintenance and repairs that do not add to the value of the asset or materially extend the asset’s life are not capitalized. Major outlays for capital asset improvements are recorded as assets. SDTC has recorded assets received from the City of San Diego and the County Transit System at net book value in order to reflect SDTC’s custodial accountability for the assets.
Under the operating agreements between MTS and SDTC and SDTI, SDTC and SDTI are required to pay a license fee to MTS for the use of certain capital assets. Due to SDTC’s and SDTI’s continued shortage of operating funds sufficient to cover recurring expenditures, the payment of these fees is considered remote, and therefore, these amounts were not recorded in the accompanying basic financial statements. Buildings, vehicles, and equipment of the primary government, as well as the component units, are depreciated using the straight-line method over the following estimated useful lives:
Assets Years Building and structures 20 to 30 Vehicles and buses 5 to 25 Equipment and other capital assets 3 to 10 Capital leases 3 to 40
I. Construction-in-Progress
Costs incurred for construction associated with the bus and trolley systems are capitalized as construction-in-progress until such time as they are complete and operational. Upon completion, they are contributed to SDTC and SDTI to reflect their custodial accountability for the assets. Depreciation commences at the time of contribution. Assets acquired through capital leases are capitalized.

San Diego Metropolitan Transit System Notes to Basic Financial Statements (Continued)
For the Years Ended June 30, 2017 and 2016
23
Note 1 – Summary of Significant Accounting Policies (Continued)
J. Compensated Absences
It is MTS’s policy to permit employees to accumulate earned but unused personal leave time up to a maximum of 400 hours, which includes both vacation and sick pay benefits. All personal leave time is accrued when incurred.
K. Long-Term Obligations
Debt premiums and discounts, if any, are deferred and amortized over the life of the debt using the straight-line method. Long-term debt is reported net of the applicable bond premium or discount. Debt issuance costs are expensed when incurred.
L. Refunding of Debt Gains or losses occurring from current or advance refunding of debt are reported as deferred inflows or outflows of resources and are being amortized using the straight-line method over the original remaining life of the old debt or the life of the new debt, whichever is lesser.
M. Pension For purposes of measuring the net pension liability and deferred outflows/inflows of resources related to pensions and pension expense, information about the fiduciary net position of MTS, SDTC and SDTI's pension plans and additions to/deductions from the Plans' fiduciary net position have been determined on the same basis as they are reported by CalPERS. For this purpose, benefit payments (including refunds of employee contributions) are recognized when due and payable in accordance with benefit terms.
N. Net Position Net Position is classified as follows:
Net investments in capital assets - This component of net position consists of capital assets, net of accumulated depreciation, reduced by the outstanding balances of debt and deferred inflows and outflows of resources that are attributable to the acquisition, construction, or improvement of those assets.
Restricted - This component of net position consists of restricted assets reduced by liabilities and deferred inflows of resources related to those assets.
Unrestricted - This component of net position is the amount of the assets, deferred outflows of resources, liabilities, and deferred inflows of resources that are not included in the determination of net investments in capital assets or the restricted component of net position.
O. Use of Estimates
The preparation of the basic financial statements in conformity with generally accepted accounting principles in the United States requires management to make estimates and assumptions that affect certain reported amounts of assets and liabilities and disclosure of contingent assets and liabilities at the date of the financial statements, and the reported amounts of revenues and expenditures during the reported period. Actual results could differ from these estimates.

San Diego Metropolitan Transit System Notes to Basic Financial Statements (Continued)
For the Years Ended June 30, 2017 and 2016
24
Note 1 – Summary of Significant Accounting Policies (Continued)
P. Implementation of New GASB Pronouncements for the Year Ended June 30, 2017 During fiscal year ended June 30, 2017, MTS has implemented the following new GASB Pronouncements:
GASB Statement No. 74 – In June 2015, GASB issued Statement No. 74, Financial Reporting for Postemployment Benefit Plans Other Than Pension Plans, which addresses reporting by postemployment benefits other than pensions (OPEB) plans that administer benefits on behalf of governments. This statement basically parallels GASB Statement 67 and replaces GASB Statement 43. Application of this statement is effective for MTS's fiscal year ending June 30, 2017. GASB Statement No. 77 – In August 2015, GASB issued Statement No. 77, Tax Abatement Disclosures. This statement establishes financial reporting standards for tax abatement agreements entered into by state and local governments. Application of this statement is effective for MTS's fiscal year ending June 30, 2017. GASB Statement No. 78 – In December 2015, GASB issued Statement No. 78, Pensions Provided Through Certain Multiple-Employer Defined Pension Plans. This Statement amends the scope and applicability of Statement 68 to exclude pensions provided to employees of state or local governmental employers through a cost-sharing multiple-employer defined benefit pension plan that (1) is not a state or local governmental pension plan, (2) is used to provide defined benefit pensions to both employees of state or local governmental employers and to employees of employers that are not state or local governmental employers, and (3) has no predominant state or local governmental employer (either individually or collectively with other state or local governmental employees that provide pension through the pension plan). This statement establishes requirements for recognition and measurement of pension expense, expenditures, and liabilities; note disclosures; and required supplementary information for pensions that have characteristics described above. Application of this statement is effective for MTS's fiscal year ending June 30, 2017. GASB Statement No. 79 – In December 2015, GASB issued Statement No. 79, Certain External Investment Pools and Pool Participants. This Statement establishes additional note disclosure requirements for qualifying external investment pools that measure all of their investments at amortized cost for financial reporting purposes and for governments that participate in those pools. Those disclosures for both the qualifying external investment pools and their participants include information about any limitations or restrictions on participating withdrawals. Application of this statement is effective for MTS's fiscal year ending June 30, 2017. GASB Statement No. 80 – In December 2015, GASB issued Statement No. 80, Blending Requirements for Certain Component Units - An Amendment of GASB Statement No. 14. This Statement amends the blending requirements for the financial statement presentation of component units of all state and local governments. The additional criterion requires blending of a component unit incorporated as a not-for-profit corporation in which the primary government is the sole corporate member. The additional criterion does not apply to component units included in the financial reporting entity pursuant to the provision of Statement No. 39, Determining Whether Certain Organizations Are Component Units. Application of this statement is effective for MTS's fiscal year ending June 30, 2017.

San Diego Metropolitan Transit System Notes to Basic Financial Statements (Continued)
For the Years Ended June 30, 2017 and 2016
25
Note 1 – Summary of Significant Accounting Policies (Continued) Q. Upcoming Government Accounting Standards for the Year Ending June 30, 2018
For the fiscal year ending June 30, 2018, MTS will implement the following new GASB Pronouncements:
GASB Statement No. 75 – In June 2015, GASB issued Statement No. 75, Accounting and Financial Reporting for Postemployment Benefits Other Than Pensions. This statement applies to government employers who provide OPEB to their employees and for governments that finance OPEB for employees of other governments. This statement basically parallels GASB Statement 68 and replaces GASB Statement 45. Application of this statement is effective for MTS's fiscal year ending June 30, 2018. GASB Statement No. 81 – In December 2015, GASB issued Statement No. 81, Irrevocable Split-Interest Agreements. This Statement requires that a government that receives resources pursuant to an irrevocable split -interest agreement recognize assets, liabilities and deferred inflows of resources at the inception of the agreement. Furthermore, the Statement requires that a government recognize assets representing its beneficial interests in irrevocable split-interest agreements that are administered by a third party, if the government controls the present service capacity of the beneficial interest. This Statement requires that a government recognize revenue when the resources become applicable to the reporting period. Application of this statement is effective for MTS's fiscal year ending June 30, 2018. GASB Statement No. 82 – In December 2015, GASB issued Statement No. 82, Pension Issues - An Amendment of GASB Statements No. 67, No. 68 and No. 73. This Statement clarifies that payments that are made by an employer to satisfy contribution requirements that are identified by the pension plan terms as plan member contribution requirements should be classified as plan member contributions for purposes of Statement 67 and as employee contributions for purposes of Statement 68. It also requires that an employer's expense and expenditures of those amounts be recognized in the period for which the contribution is assessed and classified in the same manner as the employer classifies similar compensation other than pensions (for example, as salaries and wages or as fringe benefits). Application of this statement is effective for MTS's fiscal year ending June 30, 2018. GASB Statement No. 85 – In March 2017, GASB issued Statement No. 85, Omnibus 2017. This statement addresses practice issues that have been identified during implementation and application of certain GASB statements. This statement addresses a variety of areas including issues related to blending component units, goodwill, fair value measurement and application, and postemployment benefits (pensions and other postemployment benefits (OPEB)). Application of this statement is effective for MTS's fiscal year ending June 30, 2018. GASB Statement No. 86 - In May 2017, GASB issued Statement No. 86, Certain Debt Extinguishment Issues. This statement improves consistency in accounting and financial reporting for in-substance defeasance of debt by providing guidance for transactions in which cash and other monetary assets acquired with only existing resources-resources other than the proceeds of refunding debt-are placed in an irrevocable trust for the sole purpose of extinguishing debt. This statement also improves accounting and financial reporting for prepaid insurance on debt that is extinguished and notes to financial statements for debt that is defeased in substance. Application of this statement is effective for MTS's fiscal year ending June 30, 2018.

San Diego Metropolitan Transit System Notes to Basic Financial Statements (Continued)
For the Years Ended June 30, 2017 and 2016
26
Note 2 – Cash, Cash Equivalents, and Investments Cash and investments are reported in the accompanying statements of net position as follows on June 30, 2017 and 2016:
2017 2016
Cash and cash equivalents $ 90,342,822 $ 77,394,644 Cash and cash equivalents restricted for capital support 6,743,868 13,508,715
Total cash and investments $ 97,086,690 $ 90,903,359
Cash, cash equivalents, and investments consisted as follows on June 30, 2017 and 2016:
MeasurementInvestment Type Input 2017 2016
Cash and cash equivalents:Demand Deposits N/A 19,379,529$ 20,815,206$
Retention Trust Account N/A 2,303,606 4,758,582
San Diego County Investment Pool Level 2 4,440,261 8,750,133
State of California - Local Agency Investment Fund N/A 70,963,294 56,579,438
Total cash and cash equivalents 97,086,690$ 90,903,359$
Fair Value
Demand Deposits As of June 30, 2017, the carrying amount of demand deposits was $19,379,529 and the bank balance was $22,684,976 compared to $20,815,206 and $29,643,147 at June 30, 2016, of which the total amount was collateralized or insured with securities held by the pledging financial institutions in MTS’s name as discussed below.
All cash accounts are pooled and swept nightly to a concentration account. Funds required to be held by fiscal agents under the provisions of bond indentures are not included in the pooled cash account. Investments Under the provisions of MTS’s investment policy and in accordance with California Government Code, MTS is authorized to invest or deposit in the following:
Securities of the U.S. Government, its agencies and instrumentalities Obligations of the State of California or any local agency within the state rated "A" or higher by Standard
and Poor’s Corporation or Moody’s Investor Services, Inc. Repurchase agreements Bankers’ acceptances Commercial paper rated "A" or higher by Standard and Poor’s Corporation or Moody’s Investor Services,
Inc. Medium-term corporate notes rated "A" or higher by Standard and Poor’s Corporation or Moody’s Investor
Services, Inc. Negotiable certificates of deposit Local Agency Investment Fund (LAIF) established by the State Treasurer San Diego County Pooled Money Fund Passbook savings or money market demand deposits with an FDIC, SIPC, or SAIF insured financial
institution

San Diego Metropolitan Transit System Notes to Basic Financial Statements (Continued)
For the Years Ended June 30, 2017 and 2016
27
Note 2 – Cash, Cash Equivalents, and Investments (Continued) Local Agency Investment Funds MTS’s investments with Local Agency Investment Fund (LAIF) include a portion of the pool funds invested in structured notes and asset-backed securities. These investments include the following:
Structured Notes – debt securities (other than asset-backed securities) whose cash flow characteristics (coupon rate, redemption amount, or stated maturity) depend upon one or more indices and/or that have embedded forwards or options. They are issued by corporations and by government-sponsored enterprises.
Asset-Backed Securities – entitle their purchaser to receive a share of the cash flows from a pool of assets such as principal and interest repayments from a pool of mortgages (such as CMO’s), small business loans or credit card receivables.
LAIF is overseen by the Local Investment Advisory Board, which consists of five members, in accordance with State statute. The fair value of our position in the pool is the same as the value of the pool shares. As of June 30, 2017, MTS had $70,963,294 invested in LAIF, which had invested 2.89% of the pool investment funds in structured notes and asset-backed securities compared to $56,579,438 and 2.81% at June 30, 2016. San Diego County Investment Pool The San Diego County Investment Pool is a local government investment pool managed by the County Treasurer’s Office on behalf of Investment Pool participants. Depositors in the Investment Pool include both mandatory participants, those agencies required by law to deposit their funds with the County Treasurer’s Office, and voluntary participants, agencies that place their funds in the Investment Pool as an investment option. Voluntary participants, including cities, fire districts, and various special districts accounted for approximately 5.16% and 4.72% of the Investment Pool as of June 30, 2017 and 2016, respectively. At June 30, 2017 and 2016, the fair value of our position in the pool is 99.57% and 99.99%, respectively, of the value of the pool shares. Pursuant to Section 27130-27137 of the California Government Code, the County Board of Supervisors has established the Treasurer's Oversight Committee ("TOC") that monitors and reviews the Investment Policy. The TOC consists of members appointed from the districts or offices that they represent, and up to five members of the public having expertise in, or an academic background in public finance. To mitigate credit risk, the Investment Pool's Investment Policy, which is more restrictive than the Government Code, places a minimum standard on the ratings of investments held in the Investment Pool. Investments in securities other than those guaranteed by the U.S. Treasury or Government Sponsored Enterprises must have a credit rating of no less than "A" for long-term or "A1" for short-term. Non-rated securities include sweep accounts, collateralized certificates of deposit and repurchase agreements. Sweep accounts and collateralized certificates of deposit must be FDIC insured and collateralized with securities held by a named agent of the depository. Repurchase agreements are collateralized by securities, authorized by the California Government Code Section 53601, having fair market value of 102% or greater than the amount of the repurchase agreement. The Investment Pool does not hold any investments in structured notes. MTS’s investments with the County Treasurer's Office include a portion of the pool funds invested in asset-backed securities as defined in the preceding section for LAIF investments. As of June 30, 2017, MTS had $4,440,261 invested with the San Diego County Investment Pool, which had invested 2.03% of the pool investment funds in asset-backed securities compared to $8,750,133 and 0.55% at June 30, 2016.

San Diego Metropolitan Transit System Notes to Basic Financial Statements (Continued)
For the Years Ended June 30, 2017 and 2016
28
Note 2 – Cash, Cash Equivalents, and Investments (Continued) Disclosures Relating to Interest Rate Risk As a means of limiting its exposure to fair value losses arising from rising interest rates, MTS’s investment policy limits investments to a maximum of five years unless otherwise approved by the Board. Disclosures Relating to Credit Risk MTS’s investment policy limits investments in commercial paper and negotiable certificates of deposit to instruments rated "A" or better by Standard and Poor’s or Moody’s Investor Services, Inc. In the current year, MTS does not hold investments in commercial papers or certificates of deposit. Other investment instruments, including deposits in LAIF; San Diego County Investment Pool; and U.S. Government taxable bonds, are not rated and do not require ratings. Disclosures Relating to Concentration of Credit Risk The investment policy limits the amount of the percentage of the portfolio that can be invested by the type of investment for certain types of investments. MTS is in compliance with investment type percentages of the total portfolio of the investment policy. Disclosures Relating to Custodial Credit Risk Custodial credit risk for deposits is the risk that, in the event of the failure of a depository financial institution, a government will not be able to recover collateral securities that are in the possession of an outside party. The custodial credit risk for investments is the risk that, in the event of the failure of the broker or dealer to a transaction, a government will not be able to recover the value of its investments or collateral securities that are in the possession of another party. The California Government Code requires California banks and savings and loan associations to secure MTS’s cash deposits by pledging securities as collateral. This Code states that collateral pledged in this manner shall have the effect of perfecting a security interest in such collateral superior to those of a general creditor. Thus, collateral for cash deposits is considered to be held in MTS’s name. The market value of pledged securities must equal at least 110% of MTS’s cash deposits. California law also allows institutions to secure MTS deposits by pledging first trust deed mortgage notes having a value of 150% of MTS’s total cash deposits. MTS may waive collateral requirements for cash deposits which are fully insured up to $250,000 by the Federal Deposit Insurance Corporation. MTS, however, has not waived the collateralization requirements. Summary of Investments to Maturity Investments held by MTS grouped by maturity date at June 30, 2017 and 2016, are shown below:
Maturity 2017 2016
Current to one year 97,086,690$ 90,903,359$
Total 97,086,690$ 90,903,359$

San Diego Metropolitan Transit System Notes to Basic Financial Statements (Continued)
For the Years Ended June 30, 2017 and 2016
29
Note 3 – Accounts Receivable A. Accounts and Other Receivables
At June 30, 2017 and 2016, the net realizable accounts and other receivables consisted of the following:
2017 2016
Passenger revenue - General Public 4,563,590$ 4,243,919$
Other trade receivables 3,772,708 2,224,916
Pension plan receivable 1,515,836 1,467,109
Total accounts and other receivables 9,852,134$ 7,935,944$
B. Due From Other Governments
At June 30, 2017 and 2016, amounts due from other governments consisted of the following:
2017 2016
FTA Grant Funds $ 56,838,528 $ 60,138,136 State of California 5,614,601 1,549,949 County of San Diego 5,525,895 2,937,874 U.S. Treasury - CNG Rebate 4,062,830 - STA Funds 3,672,431 8,144,367 SANDAG - TransNet 3,099,453 4,445,843 Passenger Revenue - Other Governments 1,850,442 1,652,285 North County Transit District - shared costs 1,288,631 2,514,319 SANDAG - Project/Route reimbursement 551,069 687,063 Department of Homeland Security 288,225 476,283 City of San Diego 195,379 196,836 Other Local Governments 45,296 46,423
Total due from other governments $ 83,032,780 $ 82,789,378
Note 4 – Inventory At June 30, 2017 and 2016, inventory consists of the following repair and maintenance parts and administrative supplies:
2017 2016
San Diego Transit Corp. 2,998,622$ 2,431,515$
San Diego Trolley, Inc. 16,936,654 17,164,911
Total inventory 19,935,276$ 19,596,426$

San Diego Metropolitan Transit System Notes to Basic Financial Statements (Continued)
For the Years Ended June 30, 2017 and 2016
30
Note 5 – Capital Assets A summary of changes in capital assets for the year ended June 30, 2017 is as follows:
Balance Balance July 1, 2016 Additions Deletions June 30, 2017
Capital assets, not depreciatedLand and right-of-way $ 256,922,883 $ - $ - $ 256,922,883 Construction-in-progress 41,272,177 53,996,296 (59,095,743) 36,172,730
Total capital assets, not depreciated 298,195,060 53,996,296 (59,095,743) 293,095,613
Capital assets, depreciated:Buildings and structures 1,843,040,385 60,128,811 - 1,903,169,196 Buses and vehicles 778,103,145 29,389,846 (18,934,815) 788,558,176 Equipment and other 123,866,812 17,878,111 (210,404) 141,534,519 Capital lease property 12,091,981 - - 12,091,981
Total capital assets, depreciated 2,757,102,323 107,396,768 (19,145,219) 2,845,353,872
Less accumulated depreciation for:Buildings and structures (867,683,949) (67,041,064) - (934,725,013)Buses and vehicles (336,515,341) (44,373,373) 18,810,224 (362,078,490)Equipment and other (77,885,327) (12,087,694) 203,864 (89,769,157)Capital lease property (10,391,547) (377,874) - (10,769,421)
Total accumulated depreciation (1,292,476,164) (123,880,005) 19,014,088 (1,397,342,081)
Total capital assets, depreciated, net 1,464,626,159 (16,483,237) (131,131) 1,448,011,791
Total capital assets, net $ 1,762,821,219 $ 37,513,059 $ (59,226,874) $ 1,741,107,404
A summary of changes in capital assets for the year ended June 30, 2016 is as follows:
Balance Balance
July 1, 2015 Additions Deletions June 30, 2016Capital assets, not depreciated
Land and right-of-way $ 256,922,883 $ - $ - $ 256,922,883 Construction-in-progress 20,246,128 68,222,804 (47,196,755) 41,272,177
Total capital assets, not depreciated 277,169,011 68,222,804 (47,196,755) 298,195,060
Capital assets, depreciated:Buildings and structures 1,749,446,736 94,558,044 (964,395) 1,843,040,385 Buses and vehicles 781,227,339 37,340,001 (40,464,195) 778,103,145 Equipment and other 116,366,380 9,337,450 (1,837,018) 123,866,812 Capital lease property 12,091,981 - - 12,091,981
Total capital assets, depreciated 2,659,132,436 141,235,495 (43,265,608) 2,757,102,323
Less accumulated depreciation for:Buildings and structures (803,453,859) (65,147,988) 917,898 (867,683,949)Buses and vehicles (334,154,795) (42,802,028) 40,441,482 (336,515,341)Equipment and other (68,341,817) (11,191,762) 1,648,252 (77,885,327)Capital lease property (10,013,671) (377,876) - (10,391,547)
Total accumulated depreciation (1,215,964,142) (119,519,654) 43,007,632 (1,292,476,164)
Total capital assets, depreciated, net 1,443,168,294 21,715,841 (257,976) 1,464,626,159
Total capital assets, net $ 1,720,337,305 $ 89,938,645 $ (47,454,731) $ 1,762,821,219

San Diego Metropolitan Transit System Notes to Basic Financial Statements (Continued)
For the Years Ended June 30, 2017 and 2016
31
Note 5 – Capital Assets (Continued) Contributed Capital MTS converted $59 million in capital assets from CIP to assets in service in FY2017 compared to $47 million in FY2016. A summary of capital asset additions contributed by MTS is as follows:
2017 2016
General operations 3,384,790$ 3,411,258$
Other contracted services 43,463,478 15,267,146
San Diego Transit Corporation 4,221,190 25,425,706
San Diego Trolley, Inc. 8,026,285 3,092,645
Total 59,095,743$ 47,196,755$
Capital asset additions totaling $48 million were contributed by SANDAG in FY2017 compared to $94 million in FY2016. A summary of capital asset additions contributed by SANDAG is as follows:
2017 2016
Other contracted services 32,712,054$ 136,228$
San Diego Transit Corporation 10,940,508 7,041,137
San Diego Trolley, Inc. 4,648,463 86,861,375
Total 48,301,025$ 94,038,740$
MTS did not contribute any capital assets to other cities in FY2017 compared to $420,000 to the City of La Mesa in FY2016. A summary of contributed capital is as follows:
2017 2016
Contributed capital:
From SANDAG to MTS 48,301,025$ 94,038,740$
From MTS to City of La Mesa - (420,000)
Total 48,301,025$ 93,618,740$
Depreciation Depreciation expense for capital assets for the years ended June 30, 2017 and 2016 were comprised of the following:
2017 2016
General operations 2,547,636$ 2,454,052$
Other contracted services 19,079,087 16,001,781
San Diego Transit Corporation 25,188,350 24,278,346
San Diego Trolley, Inc. 77,064,932 76,785,475
Total 123,880,005$ 119,519,654$

San Diego Metropolitan Transit System Notes to Basic Financial Statements (Continued)
For the Years Ended June 30, 2017 and 2016
32
Note 6 – Due To Other Governments At June 30, 2017 and 2016, amounts due to other governments consisted of the following:
2017 2016
SANDAG - Subsidy revenue for construction projects in process $ 10,161,049 $ 15,576,914 State of California 763,104 545,515 North County Transit District 649,151 505,130 SANDAG - Project/Route reimbursements 595,170 1,740,255 City of Lemon Grove - TDA Funds 123,593 121,170 City of El Cajon - TDA Funds 92,701 90,883 County of San Diego 61,354 92,223 City of San Diego 60,360 745,245 City of Coronado - TDA Funds 28,840 36,434 Miscellaneous Other Governments 23,799 38,669 City of La Mesa - TDA Funds 12,690 51,500
Total due to other governments $ 12,571,811 $ 19,543,938
Note 7 – Unearned Revenue At June 30, 2017 and 2016, unearned revenue consisted of the following:
2017 2016
Fare media payments received in advance $ 2,514,412 $ 2,359,820 Caltrans LCTOP Payment for Trolley LRVs 1,696,280 3,663,014 Lease payments received in advance 1,439,824 566,154 UCSD Naming Rights payment received in advance 675,000 - Other reimbursements received in advance 10,904 -
Total unearned revenue $ 6,336,420 $ 6,588,988

San Diego Metropolitan Transit System Notes to Basic Financial Statements (Continued)
For the Years Ended June 30, 2017 and 2016
33
Note 8 – Long-Term Debt A. Summary
A summary of changes in long-term obligations for the year ended June 30, 2017 is as follows:
Amounts due Amounts dueBalance Balance within one in more than
July 1, 2016 Additions Reductions June 30, 2017 year one yearMTS:
Capital lease obligations $ 2,393,787 $ - $ (646,074) $ 1,747,713 $ 676,445 $ 1,071,268 Compensated absences payable 1,053,614 858,019 (829,706) 1,081,927 829,706 252,221 Accrued damage, injury, and employee claims 460,057 287,535 (216,000) 531,592 230,036 301,556 Aggregate net pension liability 9,717,218 6,436,169 (4,673,068) 11,480,319 - 11,480,319 Net other postemployment benefits 4,711,641 380,667 - 5,092,308 - 5,092,308
Total MTS 18,336,317 7,962,390 (6,364,848) 19,933,859 1,736,187 18,197,672
San Diego Transit Corporation:Pension Obligation Bonds 19,860,000 - (2,205,000) 17,655,000 2,315,000 15,340,000 Compensated absences payable 7,639,071 2,843,445 (3,237,943) 7,244,573 3,237,943 4,006,630 Accrued damage, injury, and employee claims 12,065,162 2,424,732 (2,300,000) 12,189,894 3,656,195 8,533,699 Aggregate net pension liability 98,098,137 52,865,440 (14,640,626) 136,322,951 - 136,322,951 Net other postemployment benefits 5,251,448 262,208 - 5,513,656 - 5,513,656
Total San Diego Transit Corporation 142,913,818 58,395,825 (22,383,569) 178,926,074 9,209,138 169,716,936
San Diego Trolley, Inc.:Compensated absences payable 2,491,436 2,190,311 (2,018,368) 2,663,379 2,018,368 645,011 Accrued damage, injury, and employee claims 3,069,931 887,425 (1,044,000) 2,913,356 1,095,402 1,817,954 Aggregate net pension liability 21,720,454 14,362,417 (5,780,860) 30,302,011 - 30,302,011 Net other postemployment benefits 7,557,173 409,908 - 7,967,081 - 7,967,081
Total San Diego Trolley, Inc. 34,838,994 17,850,061 (8,843,228) 43,845,827 3,113,770 40,732,057
Total $ 196,089,129 $ 84,208,276 $ (37,591,645) $ 242,705,760 $ 14,059,095 $ 228,646,665

San Diego Metropolitan Transit System Notes to Basic Financial Statements (Continued)
For the Years Ended June 30, 2017 and 2016
34
Note 8 – Long-Term Debt (Continued) A. Summary (Continued)
A summary of changes in long-term obligations for the year ended June 30, 2016 is as follows:
Amounts due Amounts dueBalance Balance within one in more than
July 1, 2015 Additions Reductions June 30, 2016 year one yearMTS:
Capital lease obligations $ 3,006,729 $ - $ (612,942) $ 2,393,787 $ 646,074 $ 1,747,713 Finance obligation 18,108,323 - (18,108,323) - - - Compensated absences payable 997,083 1,111,907 (1,055,376) 1,053,614 972,455 81,159 Accrued damage, injury, and employee claims 489,890 137,167 (167,000) 460,057 183,616 276,441 Aggregate net pension liability 8,261,547 7,367,797 (5,912,126) 9,717,218 - 9,717,218 Net other postemployment benefits 4,335,345 376,296 - 4,711,641 - 4,711,641
Total MTS 35,198,917 8,993,167 (25,855,767) 18,336,317 1,802,145 16,534,172
San Diego Transit Corporation:Pension Obligation Bonds 21,960,000 - (2,100,000) 19,860,000 2,205,000 17,655,000 Compensated absences payable 7,801,088 3,396,875 (3,558,892) 7,639,071 3,675,916 3,963,155 Accrued damage, injury, and employee claims 11,183,577 5,381,585 (4,500,000) 12,065,162 3,088,291 8,976,871 Aggregate net pension liability 85,694,264 25,119,593 (12,715,720) 98,098,137 - 98,098,137 Net other postemployment benefits 4,952,228 299,220 - 5,251,448 - 5,251,448
Total San Diego Transit Corporation 131,591,157 34,197,273 (22,874,612) 142,913,818 8,969,207 133,944,611
San Diego Trolley, Inc.:Compensated absences payable 2,660,544 2,145,208 (2,314,316) 2,491,436 2,320,286 171,150 Accrued damage, injury, and employee claims 2,535,283 1,436,648 (902,000) 3,069,931 1,105,159 1,964,772 Aggregate net pension liability 16,654,410 15,166,913 (10,100,869) 21,720,454 - 21,720,454 Net other postemployment benefits 7,127,397 429,776 - 7,557,173 - 7,557,173
Total San Diego Trolley, Inc. 28,977,634 19,178,545 (13,317,185) 34,838,994 3,425,445 31,413,549
Total $ 195,767,708 $ 62,368,985 $ (62,047,564) $ 196,089,129 $ 14,196,797 $ 181,892,332
Long-term debt is reported in the accompanying statements of net position as follows:
Due Within Noncurrent Due Within NoncurrentOne Year Liabilities One Year Liabilities
Long-Term Liabilities:Compensated absences payable 6,086,017$ 4,903,862$ 6,968,657$ 4,215,464$ Accrued damage, injury, and employee claims 4,981,633 10,653,209 4,377,066 11,218,084 Long-term debt 2,991,445 16,411,268 2,851,074 19,402,713 Aggregate net pension liability - 178,105,281 - 129,535,809 Net other postemployment benefits - 18,573,045 - 17,520,262
Total long-term liabilities: 14,059,095$ 228,646,665$ 14,196,797$ 181,892,332$
20162017

San Diego Metropolitan Transit System Notes to Basic Financial Statements (Continued)
For the Years Ended June 30, 2017 and 2016
35
Note 8 – Long-Term Debt (Continued) B. Capital Lease (Continued)
The County of San Diego (the County) has a master lease agreement with the MTS Joint Powers Agency (Agency) for the lease of the MTS Tower building. MTS entered into a sublease agreement with the County for a portion (27.61%) of the MTS Tower building. The sublease is classified as a capital lease because 27.61% of the title transfers to MTS at the end of the County’s master lease. The master lease terminates on November 1, 2086; however, the County has the option to terminate the agreement on November 1, 2041 and each tenth anniversary thereafter. In May 2011, San Diego County refunded the underlying debt obligation in order to secure a more favorable interest rate, which results in a $1.3 million reduction in future principal and interest payments under the terms of the lease agreement. A $788,266 net economic capital gain from the refunding, which is the difference between the present value of the minimum payments on the refunded debt and the present value of the minimum payments on the refunding debt, has been deferred. The deferred gain will be amortized as a component of interest expense over the life of the refunding debt, which is the same life as the refunded debt. The asset acquired through a capital lease is as follows:
2017 2016
Building – MTS Tower $ 12,091,981 $ 12,091,981 Less accumulated depreciation (10,769,421) (10,391,547)
Total $ 1,322,560 $ 1,700,434
The following is a summary of future minimum payments under the capital lease as of June 30, 2017:
Tower LeaseYear ending June 30: Payments
2018 $ 743,537 2019 744,055 2020 372,148
Total minimum lease payments 1,859,740 Less amount representing interest (112,027)
Present value of minimum lease payments $ 1,747,713
At June 30, 2017 and 2016, the future minimum payments were $1,747,213 and 2,393,787, respectively.

San Diego Metropolitan Transit System Notes to Basic Financial Statements (Continued)
For the Years Ended June 30, 2017 and 2016
36
Note 8 – Long-Term Debt (Continued)
C. Pension Obligation Bonds
In October 2004, MTS issued $77,490,000 of Taxable Pension Obligation Bonds (POBs) for the benefit of SDTC. The purpose of the bonds was to make contributions to the San Diego Transit Corporation Retirement Plan and reduce its unfunded liability. This is in essence a hedge versus the assumed investment rate of 8% used by the actuary to determine the Actuarial Accrued Liability. The proceeds less fees were invested into the retirement plan. The bonds consist of the following: Series A Bonds of $38,690,000 are fixed rate bonds that mature in annual installments between 2006 and
2024 and bear an interest rate from 2.58% to 5.15% increasing progressively over the maturities. Interest is due and payable semi-annually on June 1 and December 1. Principal is due and payable each year on December 1.
At June 30, 2017 and 2016, the outstanding balance of the Pension Obligation Bonds is $17,655,000 and $19,860,000, respectively. The maturity of the Pension Obligation Bonds including interest payments are as follows:
Year ending June 30 Principal Interest Total
2018 $ 2,315,000 $ 838,500 $ 3,153,500 2019 2,430,000 723,671 3,153,671 2020 2,555,000 599,074 3,154,074 2021 2,690,000 464,015 3,154,015 2022 2,835,000 321,746 3,156,746
2023-2024 4,830,000 219,390 5,049,390
Total $ 17,655,000 $ 3,166,396 $ 20,821,396
Note 9 – Risk Management MTS (including SDTI, SDTC, and Other Contracted Services) is self-insured for third party liability claims to a maximum of $2,000,000 per occurrence. Amounts in excess of the self-insured retention limits for public liability are covered through commercial insurance carriers up to $75,000,000 per occurrence. No stop loss or cap coverage is purchased above the $75,000,000 limits. MTS, SDTI, and SDTC purchase all-risk (excluding earthquake) insurance coverage for property damage up to $600,000,000 per occurrence with deductibles ranging from $25,000 to $250,000, depending on the type of property and peril involved. In addition, MTS, SDTC, and SDTI are self-insured for costs arising from employee workers’ compensation act benefit claims including employer’s liability to a retained limit of $1,000,000 per occurrence. Amounts in excess of $1,000,000 are insured up to statutory limits. MTS, SDTC, and SDTI all finance their respective unemployment insurance liabilities. MTS, SDTC and SDTI have policies for crime coverage through commercial insurance as well as cyber liability insurance to protect the agencies from third party claims alleging computer security breaches. The crime coverage policy has a limit of $1,000,000 subject to a $25,000 deductible and the cyber liability policy has a limit of $3,000,000 subject to a $100,000 deductible. These policies protect against theft, loss or unauthorized disclosure of personally identifiable information.

San Diego Metropolitan Transit System Notes to Basic Financial Statements (Continued)
For the Years Ended June 30, 2017 and 2016
37
Note 9 – Risk Management (Continued) Claim expenditures and liabilities in connection with these self-insurance programs are reported when it is probable that a loss has occurred and the amount of that loss can be reasonably estimated. These losses include an estimate of claims that have been incurred but not reported based upon past experience, modified for current trends and information. Claim payments up to $2,000,000 per incident were recorded as risk management expenses in the statements of revenues, expenses, and changes in net position. Claim payments did not exceed insurance coverage in any of the past three years.
Current yearclaims and
Beginning of changes Claims End offiscal year in estimates payments fiscal year
2015 $ 11,691,256 $ 6,357,494 $ (3,840,000) $ 14,208,750 2016 14,208,750 6,955,400 (5,569,000) 15,595,150 2017 15,595,150 3,599,692 (3,560,000) 15,634,842
Following is a summary of accrued damage injury, and employee claims for fiscal years 2017 and 2016:
2017 2016
Current portion $ 4,981,633 $ 4,377,066 Non-current portion 10,653,209 11,218,084
Total $ 15,634,842 $ 15,595,150
MTS has established a policy to consolidate the minimum balances required in the liability claims reserve accounts of SDTC and SDTI to be held by MTS. The policy also established eligible uses for the MTS reserve account, which included the reimbursement to SDTC and SDTI of awards/settlements of individual liability claims for personal injury and/or property damage in excess of $300,000, but within the self-insurance retention at SDTC and SDTI. In connection with these self-insurance programs, liabilities for SDTC, SDTI and MTS were $15,634,842 at June 30, 2017 and $15,595,150 at June 30, 2016. The Board has designated $2,000,000 for the purposes of funding the future claims liabilities of MTS, SDTI, and SDTC. Note 10 – Contingencies Pending legal actions. MTS, SDTC and SDTI have been named in certain legal actions pending at June 30, 2017. While the outcome of these lawsuits is not presently determinable, in the opinion of management of MTS, SDTC and SDTI, based in part on the advice of counsel, the resolution of these matters is not expected to have a material adverse effect on the financial position or results of operations of MTS, SDTC, or SDTI, or is adequately covered by insurance. Pledged Revenue. SDTC has pledged future revenues pursuant to the provision of the Pension Obligation Bonds issued by SDTC in FY2004.

San Diego Metropolitan Transit System Notes to Basic Financial Statements (Continued)
For the Years Ended June 30, 2017 and 2016
38
Note 11 – Other Postemployment Health Care Benefits Plan Description. MTS contracts with a third party to provide MTS, SDTI, and SDTC Management and SDTI Union retirees a nationwide private health care exchange. The third party also provides non-commissioned benefit advisors to assist retirees in determining the health plan that best suits their needs. MTS funds a Health Reimbursement Arrangement (HRA) account for each eligible retiree to offset the cost of the healthcare they purchase through the exchange. As in years past, SDTC has provided payments to operator and maintenance employee unions for provision of postemployment benefits as determined by each union. For the year ended June 30, 2017, total MTS payments were $91,161 for 19 retirees, total SDTI payments were $167,910 for 39 retirees, and total SDTC payments were $264,136 for 50 management retirees plus $277,760 for 168 union retirees currently receiving postemployment health care benefits. For the year ended June 30, 2016, total MTS payments were $108,990 for 18 retirees, total SDTI payments were $195,117 for 42 retirees, and total SDTC payments were $430,350 for 48 management retirees plus $357,048 for 163 union retirees currently receiving postemployment health care benefits. Because the three plans are funded as expenses are incurred, there are no accumulated plan assets and no separate benefit plan reports available at this time. The Plan's Net OPEB Obligation (NOO) is the cumulative excess of prior Annual Required Contribution (ARC) over benefit payments and contributions, with annual adjustments for interest and amortization. The changes in NOO for fiscal years 2017 and 2016 are as follows:
Net OPEB Obligation (NOO): MTS SDTI SDTC Total
NOO at June 30, 2015 4,335,345$ 7,127,397$ 4,952,228$ 16,414,970$ Benefit payments paid outside of a trust (116,864) (172,789) (1,019,791) (1,309,444) Estimated contributions to a trust - - - - Annual required contribution 482,855 585,625 1,307,241 2,375,721 Accrued interest on June 30, 2015 NOO 195,091 320,733 222,850 738,674 Amortization of June 30, 2015 NOO (184,786) (303,793) (211,080) (699,659)
NOO at June 30, 2016 4,711,641 7,557,173 5,251,448 17,520,262
Benefit payments paid outside of a trust (138,368) (220,451) (1,103,153) (1,461,972) Estimated contributions to a trust - - - - Annual required contribution 497,341 603,193 1,346,458 2,446,992 Accrued interest on June 30, 2016 NOO 212,024 340,073 236,315 788,412 Amortization of June 30, 2016 NOO (190,330) (312,907) (217,412) (720,649)
NOO at June 30, 2017 5,092,308$ 7,967,081$ 5,513,656$ 18,573,045$
Eligibility. Employees are eligible after attaining age/service years of 55/10 for MTS and SDTI management, 55/15 for SDTI union, 55/10 for SDTC management, and 55/5 for SDTC unions.
June 30, 2015 June 30, 2013
Current retirees and surviving spouses 260 229
Active employees eligible for benefits 1,570 1,426
Total 1,830 1,655
Participants as of(Most Current Available)

San Diego Metropolitan Transit System Notes to Basic Financial Statements (Continued)
For the Years Ended June 30, 2017 and 2016
39
Note 11 – Other Postemployment Health Care Benefits (Continued) Funding Policy. The contribution requirements of plan members and MTS are established by management and may be amended. The contribution is based on projected pay-as-you-go financing requirements. For fiscal year 2017, MTS contributions to the plan were $1,461,972 (or 67.50% of total gross health costs), while retirees contributed $703,991 (or 32.50% of total gross health costs), as compared to fiscal year 2016, MTS contributions to the plan were $1,309,444 (or 56.32% of total gross health costs), while retirees contributed $1,015,633 (or 43.68% of total gross health costs). Annual OPEB Cost and Net OPEB Obligation. MTS's annual OPEB cost (expense) is calculated based on the sponsoring employer's Annual Required Contribution (ARC), an amount actuarially determined in accordance with the parameters of GASB Statement 45. The ARC represents a level of funding that, if paid on an ongoing basis, is projected to cover normal cost each year and amortize any Unfunded Actuarial Accrued Liabilities (UAAL) as a level percentage of projected payroll on a closed basis over a period not to exceed thirty years. The following table shows the components of MTS's ARC and Annual OPEB Cost for the years ended June 30, 2017 and 2016, the amount actually contributed to the plans, and the changes in MTS' Net OPEB Obligation to the Plan:
2017 2016
Normal Cost 970,634$ 942,363$ Amortization of Unfunded AAL 1,476,358 1,433,358
Annual Required Contribution 2,446,992 2,375,721 Interest on beginning of year NOO 788,412 738,674 Amortization of beginning of year NOO (720,649) (699,659)
Annual OPEB cost 2,514,755 2,414,736 Contributions or Benefit Payments (1,099,627) (983,684) Implicit subsidy payments (362,345) (325,760)
Increase in net OPEB obligation 1,052,783 1,105,292
Net OPEB obligation:Beginning of year 17,520,262 16,414,970
End of year 18,573,045$ 17,520,262$
All Groups
MTS's Annual OPEB Cost, the percentage of Annual OPEB Cost contributed to the plan and the Net OPEB Obligation for fiscal years 2015, 2016 and 2017 were as follows:
% of AnnualFiscal Year Annual OPEB OPEB Cost Net OPEB
Ended Cost Contributed Obligation
June 30, 2015 $ 2,511,400 46.03% $ 16,414,970 June 30, 2016 2,414,736 54.23% 17,520,262 June 30, 2017 2,514,755 58.14% 18,573,045

San Diego Metropolitan Transit System Notes to Basic Financial Statements (Continued)
For the Years Ended June 30, 2017 and 2016
40
Note 11 – Other Postemployment Health Care Benefits (Continued) Funded Status and Funding Progress. As of June 30, 2015, the most recent actuarial valuation date, the Plan was not funded. The Actuarial Accrued Liability (AAL) for benefits was $33,628,566 and the actuarial value of assets was $0 compared to $36,511,800 and $0 as June 30, 2013. The covered payroll (annual payroll of active employees covered by the plan) as of June 30, 2015 was $73,896,000 and the ratio of Unfunded AAL to covered payroll was 46% percent compared to $68,044,900 and 54% as of June 30, 2013.
Actuarial valuations of an ongoing plan involve estimates of the value of reported amounts and assumptions about the probability of occurrence of events far into the future. Examples include assumptions about future employment, mortality, and the healthcare cost trend. Amounts determined regarding the funded status of the plan and the annual required contributions of the employer are subject to continual revision as actual results are compared with past expectations and new estimates are made about the future. The most recent funding progress schedules available for MTS, SDTI and SDTC are presented below:
Actuarial Annual UAAL as ofValuation Value of Entry Age Unfunded Funded Covered % of
Date Assets Normal AAL AAL Status Payroll Payroll
MTS 6/30/2015 -$ 3,863$ 3,863$ 0.00% 10,416$ 37.09%SDTI 6/30/2015 - 7,700 7,700 0.00% 26,709 28.83%SDTC 6/30/2015 - 22,066 22,066 0.00% 36,771 60.01%
Total -$ 33,629$ 33,629$ 0.00% 73,896$ 45.51%
(Amounts in '000)
Actuarial review and analysis of OPEB liability and funding status is required every two years, or annually if there are significant changes in the plan. The June 30, 2015 report was completed in FY2016. The next study, which we will based on activity through June 2017, will be completed during FY2018 and ready for the FY2018 financial report. Actuarial Methods and Assumptions. Projections of benefits for financial reporting purposes are based on the substantive plan (the plan as understood by the employer and the plan members) and include the types of benefits provided at the time of each valuation and the historical pattern of sharing of benefit costs between the employer and plan members to that point. The actuarial methods and assumptions used include techniques that are designed to reduce the effects of short-term volatility in Actuarial Accrued Liabilities consistent with the long-term perspective of the calculations. In the June 30, 2015 actuarial valuation, the Entry Age Normal actuarial cost method was used. The actuary assumed 4.5% investment rate of return (net of administrative expenses) which is the expected long-term investment returns on the employer's own investments, and a compensation increase of 3%. The annual healthcare cost trend rate varies depending on the plan and type of health care service involved. Beginning in fiscal year 2015/2016, medical/drug trends generally grade down from 7.0% and 6.5% to an ultimate of 4.5% by 2021, while dental expense trends stay flat at 4.0%. A general inflation rate of 2.75% was included in the investment rate, compensation rate, and the health care cost trend rate. The UAAL is being amortized as a level percentage of projected payroll over a rolling 30 years.

San Diego Metropolitan Transit System Notes to Basic Financial Statements (Continued)
For the Years Ended June 30, 2017 and 2016
41
Note 12 – Employee Retirement Systems A. Summary
Aggregate Net Pension Asset
Aggregate Net Pension Asset is reported in the accompanying statements of net position as follows:
2017 2016
MTS Miscellaneous Second Tier Plan - 30134 $ - $ (2,599)MTS Miscellaneous PEPRA Plan - 26789 - (7,322)
$ - $ (9,921)
Aggregate Net Pension Liability
Aggregate Net Pension Liability is reported in the accompanying statements of net position as follows:
2017 2016
MTS Miscellaneous Plan - 1223 $ 11,438,216 $ 9,717,218 MTS Miscellaneous Second Tier Plan - 30134 7,942 - MTS Miscellaneous PEPRA Plan - 26789 34,161 -
SDTI Miscellaneous Plan - 1406 27,706,592 19,555,041
SDTI PARS Plan 2,595,419 2,165,413 SDTC Retirement Plan 136,322,951 98,098,137
Total $ 178,105,281 $ 129,535,809
Deferred Outflows of Resources Deferred Outflows of Resources at June 30, 2017 are reported in the accompanying statement of net position as follows:
DifferenceBetween
Difference ProjectedContributions Between Adjustments and ActualMade After Expected and Due To Earnings on
Measurement Actual Difference in Pension Plan Changes in Date Experience Proportions Investments Assumptions Total
MTS Miscellaneous Plan - 1223 $ 1,370,412 $ 56,388 $ 91,107 $ 3,973,645 $ - 5,491,552$
MTS Miscellaneous Second Tier Plan - 30134 70,867 1,870 308 142,334 - 215,379
MTS Miscellaneous PEPRA Plan - 26789 290,432 6,018 - 584,584 - 881,034
SDTI Miscellaneous Plan - 1406 2,835,680 303,448 - 8,810,447 - 11,949,575
SDTI PARS Plan 586,218 - - 462,382 253,427 1,302,027
SDTC Retirement Plan 12,649,101 270,960 - 18,329,930 19,799,915 51,049,906
Total $ 17,802,710 $ 638,684 $ 91,415 $ 32,303,322 $ 20,053,342 $ 70,889,473

San Diego Metropolitan Transit System Notes to Basic Financial Statements (Continued)
For the Years Ended June 30, 2017 and 2016
42
Note 12 – Employee Retirement Systems (Continued) A. Summary (Continued)
Deferred Outflows of Resources (Continued) Deferred Outflows of Resources at June 30, 2016 are reported in the accompanying statement of net position as follows:
DifferenceBetween
Difference ProjectedContributions Between Adjustments and ActualMade After Expected and Due To Earnings on
Measurement Actual Difference in Pension PlanDate Experience Proportions Investments Total
MTS Miscellaneous Plan - 1223 $ 1,306,126 $ 87,715 $ 141,721 2,127,113$ 3,662,675$ MTS Miscellaneous Second Tier Plan - 30134 49,020 2,908 691 70,501 123,120 MTS Miscellaneous PEPRA Plan - 26789 227,181 9,362 - 227,042 463,585 SDTI Miscellaneous Plan - 1406 2,659,911 - - 4,226,627 6,886,538 SDTI PARS Plan 542,483 - - 164,631 707,114 SDTC Retirement Plan 10,711,282 1,510,483 - 11,378,998 23,600,763
Total $ 15,496,003 $ 1,610,468 $ 142,412 $ 18,194,912 $ 35,443,795
Deferred Inflows of Resources Deferred Inflows of Resources at June 30, 2017 are reported in the accompanying statement of net position as
follows:
Difference DifferenceBetween Between
Actual and Difference ProjectedProportionate Between Adjustments and Actual
Share of Expected and Due To Earnings on Employer Actual Changes in Difference in Pension Plan
Contributions Experience Assumption Proportions Investments Total
MTS Miscellaneous Plan - 1223 $ 374,067 $ 10,682 $ 533,487 $ 925,259 958,753$ 2,802,248$ MTS Miscellaneous Second Tier Plan - 30134 13,255 402 17,682 91,236 11 122,586 MTS Miscellaneous PEPRA Plan - 26789 52,858 1,861 56,943 400,898 339 512,899 SDTI Miscellaneous Plan - 1406 - 321,305 1,432,253 - 3,292,879 5,046,437 SDTI PARS Plan - 130,786 - - - 130,786 SDTC Retirement Plan - 1,449,650 - - 2,632,574 4,082,224
Total $ 440,180 $ 1,914,686 $ 2,040,365 $ 1,417,393 $ 6,884,556 $ 12,697,180
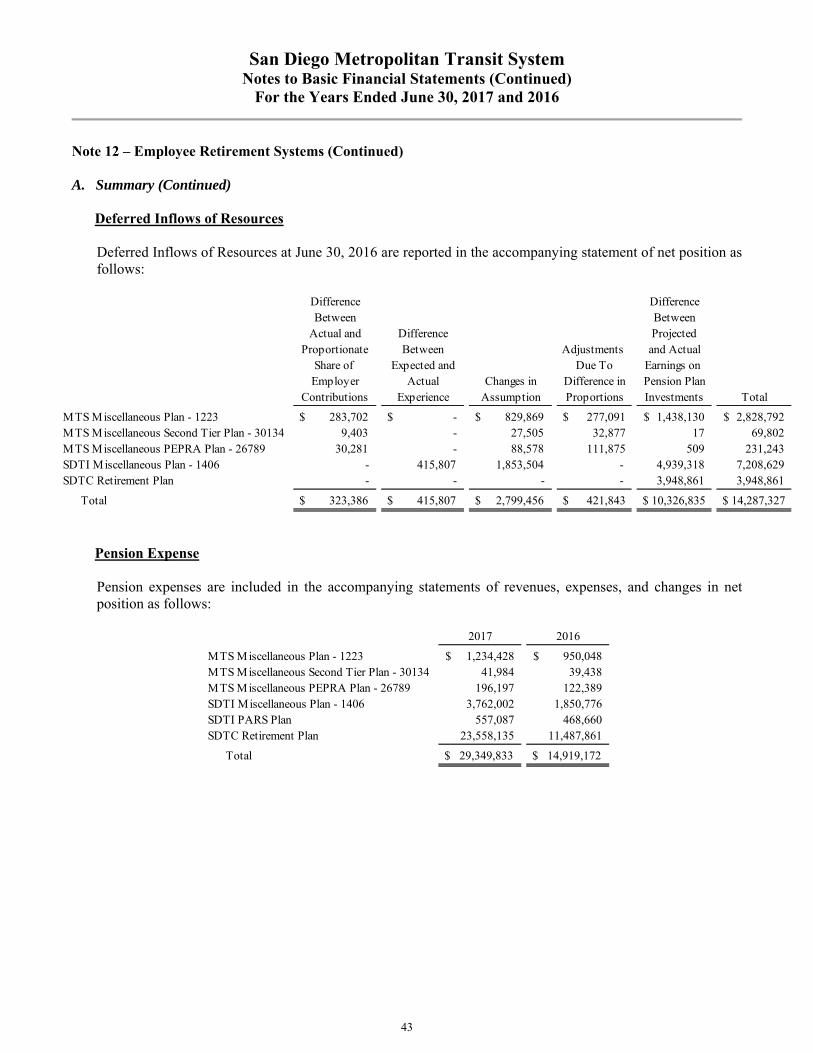
San Diego Metropolitan Transit System Notes to Basic Financial Statements (Continued)
For the Years Ended June 30, 2017 and 2016
43
Note 12 – Employee Retirement Systems (Continued) A. Summary (Continued)
Deferred Inflows of Resources Deferred Inflows of Resources at June 30, 2016 are reported in the accompanying statement of net position as
follows:
Difference DifferenceBetween Between
Actual and Difference ProjectedProportionate Between Adjustments and Actual
Share of Expected and Due To Earnings on Employer Actual Changes in Difference in Pension Plan
Contributions Experience Assumption Proportions Investments Total
MTS Miscellaneous Plan - 1223 $ 283,702 $ - $ 829,869 $ 277,091 1,438,130$ 2,828,792$ MTS Miscellaneous Second Tier Plan - 30134 9,403 - 27,505 32,877 17 69,802 MTS Miscellaneous PEPRA Plan - 26789 30,281 - 88,578 111,875 509 231,243 SDTI Miscellaneous Plan - 1406 - 415,807 1,853,504 - 4,939,318 7,208,629 SDTC Retirement Plan - - - - 3,948,861 3,948,861
Total $ 323,386 $ 415,807 $ 2,799,456 $ 421,843 $ 10,326,835 $ 14,287,327
Pension Expense Pension expenses are included in the accompanying statements of revenues, expenses, and changes in net
position as follows:
2017 2016
MTS Miscellaneous Plan - 1223 1,234,428$ 950,048$ MTS Miscellaneous Second Tier Plan - 30134 41,984 39,438 MTS Miscellaneous PEPRA Plan - 26789 196,197 122,389 SDTI Miscellaneous Plan - 1406 3,762,002 1,850,776 SDTI PARS Plan 557,087 468,660 SDTC Retirement Plan 23,558,135 11,487,861
Total $ 29,349,833 $ 14,919,172

San Diego Metropolitan Transit System Notes to Basic Financial Statements (Continued)
For the Years Ended June 30, 2017 and 2016
44
Note 12 – Employee Retirement Systems (Continued) B. MTS
General Information about the Pension Plans
Plan Description – All MTS management employees working the equivalent of 1,000 hours per fiscal year are eligible to participate in the MTS Miscellaneous, MTS Miscellaneous PEPRA, or MTS Miscellaneous Second Tier cost-sharing multiple employer defined benefit plans administered by California Public Employees’ Retirement System (CalPERS), which acts as a common investment and administrative agent for its participating member employers. Benefit Provisions under the Plans are established by State statutes within the Public Employee’s Retirement Law. CalPERS issues publicly available reports that include a full description of the pension plans regarding benefit provisions, assumptions and membership information that can be found on the CalPERS website. Copies of the CalPERS annual financial report may be obtained from the CalPERS Executive Office – 400 P Street, Sacramento, CA 95814. Benefits Provided – CalPERS provides service retirement and disability benefits, annual cost-of-living adjustments, and death benefits to plan members and beneficiaries. Benefits are based on years of credited service, equal to one year of full time employment and can only be amended by the MTS Board of Directors. The Plan’s provisions and benefits in effect as of June 30, 2017 are summarized as follows:
MTS Miscellaneous Plan-1223 CLOSED TO NEW MEMBERS
Hire date Prior to December 24, 2012 Benefit formula 2.7% @ 55 Benefit vesting schedule 5 years service Benefit payments Monthly for life Final Average Compensation Period 12 months Retirement age 50-55 Monthly benefits, as a % of eligible compensation 2.0%-2.7% Required employee contribution rates 8.00% Required employer contribution rates 20.35% Pre-Retirement Death Benefit Optional Settlement 2W Post-Retirement Death Benefit $500 Lump Sum Non-Industrial Standard Disability 1.8% of final compensation X multiplied by service COLA 2.00%
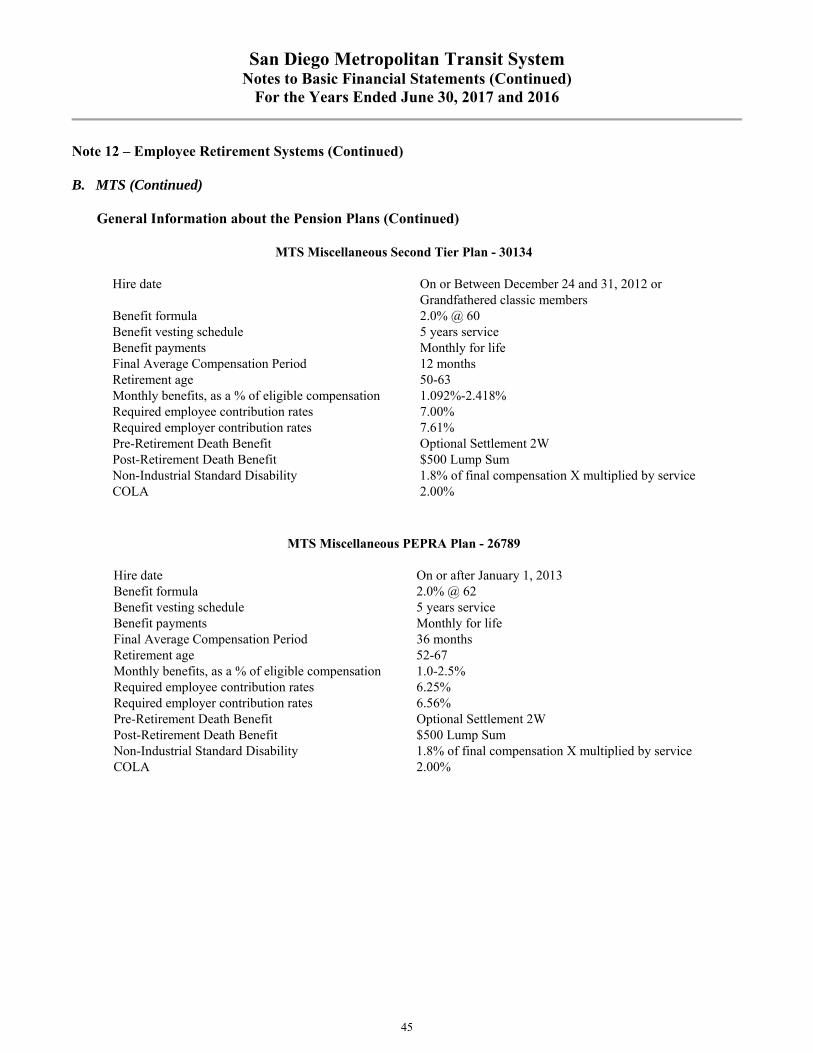
San Diego Metropolitan Transit System Notes to Basic Financial Statements (Continued)
For the Years Ended June 30, 2017 and 2016
45
Note 12 – Employee Retirement Systems (Continued) B. MTS (Continued)
General Information about the Pension Plans (Continued)
MTS Miscellaneous Second Tier Plan - 30134
Hire date On or Between December 24 and 31, 2012 or Grandfathered classic members
Benefit formula 2.0% @ 60 Benefit vesting schedule 5 years service Benefit payments Monthly for life Final Average Compensation Period 12 months Retirement age 50-63 Monthly benefits, as a % of eligible compensation 1.092%-2.418% Required employee contribution rates 7.00% Required employer contribution rates 7.61% Pre-Retirement Death Benefit Optional Settlement 2W Post-Retirement Death Benefit $500 Lump Sum Non-Industrial Standard Disability 1.8% of final compensation X multiplied by service COLA 2.00%
MTS Miscellaneous PEPRA Plan - 26789
Hire date On or after January 1, 2013 Benefit formula 2.0% @ 62 Benefit vesting schedule 5 years service Benefit payments Monthly for life Final Average Compensation Period 36 months Retirement age 52-67 Monthly benefits, as a % of eligible compensation 1.0-2.5% Required employee contribution rates 6.25% Required employer contribution rates 6.56% Pre-Retirement Death Benefit Optional Settlement 2W Post-Retirement Death Benefit $500 Lump Sum Non-Industrial Standard Disability 1.8% of final compensation X multiplied by service COLA 2.00%

San Diego Metropolitan Transit System Notes to Basic Financial Statements (Continued)
For the Years Ended June 30, 2017 and 2016
46
Note 12 – Employee Retirement Systems (Continued) B. MTS (Continued)
Employees Covered – At June 30, 2017, the following employees were covered by the benefit terms for each Plan:
MTS Miscellaneous
Plan - 1223
MTS Miscellaneous
Second Tier Plan - 30134
MTS Miscellaneous PEPRA Plan -
26789
Inactive employees or beneficiaries currently receiving benefits 117 4 0Inactive employees entitled to but not yet receiving benefits 50 0 0Active employees 69 12 75
Employees Covered – At June 30, 2016, the following employees were covered by the benefit terms for each Plan:
MTS Miscellaneous
Plan - 1223
MTS Miscellaneous
Second Tier Plan - 30134
MTS Miscellaneous PEPRA Plan -
26789
Inactive employees or beneficiaries currently receiving benefits 105 4 0Inactive employees entitled to but not yet receiving benefits 59 0 0Active employees 72 11 70
Contributions – Section 20814(c) of the California Public Employees’ Retirement Law (PERL) requires that the employer contribution rates for all public employers be determined on an annual basis by the actuary and shall be effective on the July 1 following notice of a change in the rate. The total plan contributions are determined through the CalPERS’ annual actuarial valuation process. For public agency cost-sharing plans covered by either the Miscellaneous or Safety risk pools, the Plan’s actuarially determined rate is based on the estimated amount necessary to pay the Plan’s allocated share of the risk pool’s costs of benefits earned by employees during the year, and any unfunded accrued liability. The employer is required to contribute the difference between the actuarially determined rate and the contribution rate of employees. For the year ended June 30, 2016 and 2015 (the measurement dates), the active employee contribution rates and average employer contribution rates were as follows:
Employee Contribution
Employer Contribution
Employee Contribution
Employer Contribution
MTS - Miscellaneous Plan-1223 8.00% 20.35% 7.00% 17.71%MTS Miscellaneous Second Tier Plan - 30134 7.00% 7.61% 7.00% 7.16%MTS PEPRA Miscellaneous Plan - 26789 6.25% 6.56% 6.25% 6.24%
Measurement Date2016 2015

San Diego Metropolitan Transit System Notes to Basic Financial Statements (Continued)
For the Years Ended June 30, 2017 and 2016
47
Note 12 – Employee Retirement Systems (Continued) B. MTS (Continued)
For the year ended June 30, 2016 (the measurement date), the plan's proportionate share of aggregate contributions recognized as part of pension expense for each Plan were as follows:
MTS Miscellaneous
Plan - 1223
MTS Miscellaneous
Second Tier Plan -30134
MTS Miscellaneous PEPRA Plan -
26789
1,564,713$ 58,855$ 272,574$ 618,282 23,256 107,705
Contributions - employerContributions - employee
For the year ended June 30, 2015 (the measurement date), the plan's proportionate share of aggregate contributions recognized as part of pension expense for each Plan were as follows:
MTS Miscellaneous
Plan - 1223
MTS Miscellaneous
Second Tier Plan -30134
MTS Miscellaneous PEPRA Plan -
26789
1,753,602$ 58,121$ 187,174$ 717,034 23,765 76,534
Contributions - employerContributions - employee
Pension Liabilities, Pension Expenses and Deferred Outflows/Inflows of Resources Related to Pensions – As of June 30, 2017 and 2016, MTS reported net pension liabilities for its proportionate shares of the net pension liability of each Plan as follows:
2017 2016
MTS - Miscellaneous Plan-1223 $ 11,438,216 $ 9,717,218 MTS Miscellaneous Second Tier Plan - 30134 7,942 (2,599)MTS Miscellaneous PEPRA Plan - 26789 34,161 (7,322)
Aggregate Net Pension Liability (Asset) $ 11,480,319 $ 9,707,297
Proportionate Share
of Net Pension Liability (Asset)
MTS’s net pension liability for each Plan is measured as the proportionate share of the net pension liability. The net pension liability of the Plans is measured as of June 30, 2016, and the total pension liability for each Plan used to calculate the net pension liability was determined by an actuarial valuation as of June 30, 2015 rolled forward to June 30, 2016 using standard update procedures. MTS’s proportion of the net pension liability was based on a projection of the MTS’s long-term share of contributions to the pension plans relative to the projected contributions of all participating employers, actuarially determined.

San Diego Metropolitan Transit System Notes to Basic Financial Statements (Continued)
For the Years Ended June 30, 2017 and 2016
48
Note 12 – Employee Retirement Systems (Continued) B. MTS (Continued)
The following is the approach established by the plan actuary to allocate the net pension liability and pension expense to the individual employers within the risk pool:
(1) In determining a cost-sharing plan's proportionate share, total amounts of liabilities and assets are first calculated for the risk pool as a whole on the valuation date (June 30, 2015). The risk pool's fiduciary net position ("FNP") subtracted from its total pension liability ("TPL") determines the net pension liability ("NPL") at the valuation date.
(2) Using standard actuarial roll forward methods, the risk pool TPL is then computed at the
measurement date (June 30, 2016). Risk pool FNP at the measurement date is then subtracted from this number to compute the NPL for the risk pool at the measurement date. For purposes of FNP in this step and any later reference thereto, the risk pool's FNP at the measurement date denotes the aggregate risk pool's FNP at June 30, 2016 less the sum of all additional side fund (or unfunded liability) contributions made by all employers during the measurement period (FY2016).
(3) The individual plan's TPL, FNP, and NPL are also calculated at the valuation date. (4) Two ratios are created by dividing the plan's individual TPL and FNP as of the valuation date from
step (3) by the amounts in step (1), the risk pool's total TPL and FNP, respectively. (5) The plan's TPL as of the measurement date is equal to the risk pool TPL generated in step (2)
multiplied by the TPL ratio generated in step (4). The plan's FNP as of the measurement date is equal to the FNP generated in step (2) multiplied by the FNP ratio generated in step (4) plus any additional side fund (or unfunded liability) contributions made by the employer on behalf of the plan during the measurement period.
(6) The plan's NPL at the measurement date is the difference between the TPL and FNP calculated in
step (5). MTS’s proportionate share of the net pension liability for each Plan as of June 30, 2016, 2015 and 2014 (measurement dates) were as follows:
MTS Miscellaneous
Plan - 1223
MTS Miscellaneous
Second Tier Plan -30134
MTS Miscellaneous PEPRA Plan -
26789
0.13274% 0.00000% 0.00003%
0.14157% -0.00004% -0.00011%0.00883% -0.00004% -0.00014%
0.13219% 0.00009% 0.00039%-0.00938% 0.00013% 0.00050%
Proportion June 30, 2014Proportion June 30, 2015Change - Increase (Decrease)
Change - Increase (Decrease)
Proportion June 30, 2016

San Diego Metropolitan Transit System Notes to Basic Financial Statements (Continued)
For the Years Ended June 30, 2017 and 2016
49
Note 12 – Employee Retirement Systems (Continued) B. MTS (Continued)
For the years ended June 30, 2017 and 2016, MTS recognized pension expense of $1,472,609 and $1,111,875, respectively. At June 30, 2017 and 2016, MTS reported deferred outflows of resources and deferred inflows of resources related to pensions from the following sources:
Deferred Deferred Deferred Deferred Outflows Inflows Outflows Inflows
of Resources of Resources of Resources of Resources
1,370,412$ -$ 1,306,126$ -$
56,388 (10,682) 87,715 -
- (533,487) - (829,869)
91,107 (925,259) 141,721 (277,091)
- (374,067) - (283,702)
3,973,645 (958,753) 2,127,113 (1,438,130)
Total 5,491,552$ (2,802,248)$ 3,662,675$ (2,828,792)$
Deferred Deferred Deferred Deferred Outflows Inflows Outflows Inflows
of Resources of Resources of Resources of Resources
70,867$ -$ 49,020$ -$
1,870 (402) 2,908 -
- (17,682) - (27,505)
308 (91,236) 691 (32,877)
- (13,255) - (9,403)
142,334 (11) 70,501 (17)
Total 215,379$ (122,586)$ 123,120$ (69,802)$
Net differences between projected and actual earnings on pension plan investments
Contributions made after the measurement date
Differences between expected and actual experience
Changes in assumptions
Adjustments due to difference in proportions
Differences between actual and proportionate share of employer contributions
MTS - Miscellaneous Plan - 1223
MTS - Miscellaneous Second Tier Plan - 301342017 2016
Contributions made after the measurement date
2017
Differences between expected and actual experience
Changes in assumptions
Adjustments due to difference in proportions
Differences between actual and proportionate share of employer contributions
Net differences between projected and actual earnings on pension plan investments
2016

San Diego Metropolitan Transit System Notes to Basic Financial Statements (Continued)
For the Years Ended June 30, 2017 and 2016
50
Note 12 – Employee Retirement Systems (Continued) B. MTS (Continued)
Deferred Deferred Deferred Deferred Outflows Inflows Outflows Inflows
of Resources of Resources of Resources of Resources
290,432$ -$ 227,181$ -$
6,018 (1,861) 9,362 -
- (56,943) - (88,578)
- (400,898) - (111,875)
- (52,858) - (30,281)
584,584 (339) 227,042 (509)
Total 881,034$ (512,899)$ 463,585$ (231,243)$
Differences between expected and actual experience
Changes in assumptions
Adjustments due to difference in proportions
Differences between actual and proportionate share of employer contributions
Net differences between projected and actual earnings on pension plan investments
MTS - Miscellaneous PEPRA Plan - 267892017 2016
Contributions made after the measurement date
The combined $1,731,711 reported as deferred outflows of resources related to contributions subsequent to the measurement date will be recognized as a reduction of the net pension liability in the year ended June 30, 2018 compared to the combined $1,582,327 reported in the previous year. As of the measurement date June 30, 2016, other amounts reported as deferred outflows of resources and deferred inflows of resources related to pensions will be recognized as pension expense as follows:
Year Ended June 30
MTS Miscellaneous
Plan - 1223
MTS Miscellaneous
Second Tier Plan -30134
MTS Miscellaneous PEPRA Plan -
26789
2018 (150,817)$ (11,354)$ (49,867)$ 2019 35,486 (6,884) (32,016) 2020 839,646 17,797 56,011 2021 594,577 22,367 103,575 2022 - - -
Total 1,318,892$ 21,926$ 77,703$

San Diego Metropolitan Transit System Notes to Basic Financial Statements (Continued)
For the Years Ended June 30, 2017 and 2016
51
Note 12 – Employee Retirement Systems (Continued) B. MTS (Continued)
As of the measurement date June 30, 2015, other amounts reported as deferred outflows of resources and deferred inflows of resources related to pensions will be recognized as pension expense as follows:
Year Ended June 30
MTS Miscellaneous
Plan - 1223
MTS Miscellaneous
Second Tier Plan -30134
MTS Miscellaneous PEPRA Plan -
26789
2017 (417,298)$ (5,883)$ (23,557)$ 2018 (386,514) (5,958) (22,948) 2019 (200,208) (1,488) (5,097) 2020 531,777 17,627 56,763 2021 - - -
Total (472,243)$ 4,298$ 5,161$
Actuarial Assumptions – The total pension liabilities in the June 30, 2015 actuarial valuations were determined using the following actuarial assumptions:
MTS Miscellaneous Plan - 1223
MTS Miscellaneous Second Tier Plan - 30134
MTS Miscellaneous PEPRA Plan - 26789
Valuation Date June 30, 2015 June 30, 2015 June 30, 2015Measurement Date June 30, 2016 June 30, 2016 June 30, 2016Actuarial Cost Method Entry Age Normal Entry Age Normal Entry Age NormalActuarial Assumptions:
Discount Rate 7.65% 7.65% 7.65%Inflation 2.75% 2.75% 2.75%Payroll Growth 3.00% 3.00% 3.00%Projected Salary Increase varies by entry age and
service (1)varies by entry age and service (1)
varies by entry age and service (1)
Investment Rate of Return 7.50% (2) 7.50% (2) 7.50% (2)Mortality derived using CalPERS's
membership data for all funds (3)
derived using CalPERS's membership data for all funds (3)
derived using CalPERS's membership data for all funds (3)
(1) Depending on age, service and type of employment.(2) Net of pension plan investment expenses, including inflation.(3) The mortality table used was developed based on CalPERS's specific data.
The table includes 20 years of mortality improvements using Society of Actuaries Scales BB. Change in Assumptions – GASB 68, paragraph 30 states that the long-term expected rate of return should be determined net of pension plan investment expense, but without reduction for pension plan administrative expense. In the current year, the actuarial report did not have a change of assumption. In the prior year the discount rate changed from 7.50 percent in 2014 to 7.65 percent as of June 30, 2015 measurement date to correct the adjustment which previously reduced the discount rate for administrative expense. The underlying mortality assumptions and all other actuarial assumptions used in the June 30, 2015 valuations were based on the results of a January 2014 actuarial experience study for the period 1997 to 2011. Further details of the Experience Study can be found on the CalPERS website.

San Diego Metropolitan Transit System Notes to Basic Financial Statements (Continued)
For the Years Ended June 30, 2017 and 2016
52
Note 12 – Employee Retirement Systems (Continued) B. MTS (Continued)
Discount Rate – The discount rate used to measure the total pension liability was 7.65 percent. To determine whether the municipal bond rate should be used in the calculation of a discount rate for each plan, CalPERS stress tested plans that would most likely result in a discount rate that would be different from the actuarially assumed discount rate. Based on the testing, none of the tested plans run out of assets. Therefore, the current 7.65 percent discount rate is adequate and the use of the municipal bond rate calculation is not necessary. The long term expected discount rate of 7.65 percent is applied to all plans in the Public Employees Retirement Fund. The stress test results are presented in a detailed report called “GASB Crossover Testing Report” that can be obtained at CalPERS’ website under the GASB 68 section. The long-term expected rate of return on pension plan investments was determined using a building-block method in which best-estimate ranges of expected future real rates of return (expected returns, net of pension plan investment expense and inflation) are developed for each major asset class. In determining the long-term expected rate of return, staff took into account both short-term and long-term market return expectations as well as the expected pension fund cash flows. Such cash flows were developed assuming that both members and employers will make their required contributions on time and as scheduled in all future years. Using historical returns of all the funds’ asset classes, expected compound (geometric) returns were calculated over the short-term (first 10 years) and the long-term (11-60 years) using a building-block approach. Using the expected nominal returns for both short-term and long-term, the present value of benefits was calculated for each fund. The expected rate of return was set by calculating the single equivalent expected return that arrived at the same present value of benefits for cash flows as the one calculated using both short-term and long-term returns. The expected rate of return was then set equivalent to the single equivalent rate calculated above and rounded down to the nearest one quarter of one percent. The table below reflects long-term expected real rate of return by asset class. The rate of return was calculated using the capital market assumptions applied to determine the discount rate and asset allocation.
Asset ClassNew Strategic
AllocationReal Return
Years 1-10 (a)Real Return Years 11+ (b)
Global Equity 51.00% 5.25% 5.71%Global Fixed Income 20.00% 0.99% 2.43%Inflation Sensitive 6.00% 0.45% 3.36%Private Equity 10.00% 6.83% 6.95%Real Estate 10.00% 4.50% 5.13%Infrastructure and Forestland 2.00% 4.50% 5.09%Liquidity 1.00% -0.55% -1.05%
(a) an expected inflation of 2.50% for this period(b) an expected inflation of 3.00% for this period

San Diego Metropolitan Transit System Notes to Basic Financial Statements (Continued)
For the Years Ended June 30, 2017 and 2016
53
Note 12 – Employee Retirement Systems (Continued) B. MTS (Continued)
Sensitivity of the Proportionate Share of the Net Pension Liability to Changes in the Discount Rate – The following presents MTS’s proportionate share of the net pension liability for each Plan as of June 30, 2017, calculated using the discount rate for each Plan, as well as what MTS’s proportionate share of the net pension liability would be if it were calculated using a discount rate that is one percentage point lower or one percentage point higher than the current rate:
MTS Miscellaneous
Plan - 1223
MTS Miscellaneous
Second Tier Plan -30134
MTS Miscellaneous PEPRA Plan -
26789 Aggregate
1% Decrease 6.65% 6.65% 6.65% 6.65%Net Pension Liability 17,820,440$ 12,375$ 53,222$ 17,886,037$
Current Discount Rate 7.65% 7.65% 7.65% 7.65%Net Pension Liability 11,438,216$ 7,942$ 34,161$ 11,480,319$
1% Increase 8.65% 8.65% 8.65% 8.65%Net Pension Liability 6,163,624$ 4,280$ 18,408$ 6,186,312$
The following presents MTS's proportionate share of the net pension liability for each Plan as of June 30, 2016, calculated using the discount rate for each Plan, as well as what MTS’s proportionate share of the net pension liability would be if it were calculated using a discount rate that is one percentage point lower or one percentage point higher than the current rate:
MTS Miscellaneous
Plan - 1223
MTS Miscellaneous
Second Tier Plan -30134
MTS Miscellaneous PEPRA Plan -
26789 Aggregate
1% Decrease 6.65% 6.65% 6.65% 6.65%Net Pension Liability 16,296,453$ (4,359)$ (12,280)$ 16,279,814$
Current Discount Rate 7.65% 7.65% 7.65% 7.65%Net Pension Liability 9,717,218$ (2,599)$ (7,322)$ 9,707,297$
1% Increase 8.65% 8.65% 8.65% 8.65%Net Pension Liability 4,285,296$ (1,146)$ (3,229)$ 4,280,921$
Pension Plan Fiduciary Net Position – Detailed information about each pension plan’s fiduciary net position is available in the separately issued CalPERS financial reports. Payable to the Pension Plan – At June 30, 2017, MTS reported a payable of $61,714 for the outstanding amount of contributions to the pension plan required for the year ended June 30, 2017 compared to $47,800 for the year ended June 30, 2016.

San Diego Metropolitan Transit System Notes to Basic Financial Statements (Continued)
For the Years Ended June 30, 2017 and 2016
54
Note 12 – Employee Retirement Systems (Continued) C. SDTI
1. CalPERS Plan
Plan Description – All SDTI employees working the equivalent of 1,000 hours per fiscal year are eligible to participate in the SDTI Miscellaneous or PEPRA Miscellaneous single employer defined benefit plans administered by California Public Employees’ Retirement System (CalPERS), which acts as a common investment and administrative agent for its participating member employers. Benefit Provisions under the Plans are established by State statutes within the Public Employee’s Retirement Law. CalPERS issues publicly available reports that include a full description of the pension plans regarding benefit provisions, assumptions and membership information that can be found on the CalPERS website. Copies of the CalPERS annual financial report may be obtained from the CalPERS Executive Office – 400 P Street, Sacrament, CA 95814. Benefits Provided – CalPERS provides service retirement and disability benefits, annual cost-of-living adjustments, and death benefits to plan members and beneficiaries. Plan members include both contract and non-contract employees. Benefits are based on years of credited service, equal to one year of full time employment and can only be amended by the MTS Board of Directors. The Plan’s provisions and benefits in effect as of June 30, 2017 are summarized as follows:
San Diego Trolley Miscellaneous Plan - 1406
Closed to New Members
Management Employees Union Employees Hire date Prior to January 1, 2013 Prior to January 1, 2013 Benefit formula 2.0% @ 55 2.0% @ 55 Benefit vesting schedule 5 years service 5 years service Benefit payments Monthly for life Monthly for life Final Average Compensation Period 12 months 12 months Retirement age 50-63 50-63 Monthly benefits, as a % of eligible compensation 1.426-2.418% 1.426-2.418% Required employee contribution rates 8.00% 7.00% Required employer contribution rates 9.85% 10.85% Pre-Retirement Death Benefit 1959 Survivor Benefit Level 2 1959 Survivor Benefit Level 2 Post-Retirement Death Benefit $500 Lump Sum $500 Lump Sum Non-Industrial Standard Disability
1.8% of final compensation X multiplied by service
1.8% of final compensation X multiplied by service
COLA 2.00% 2.00%
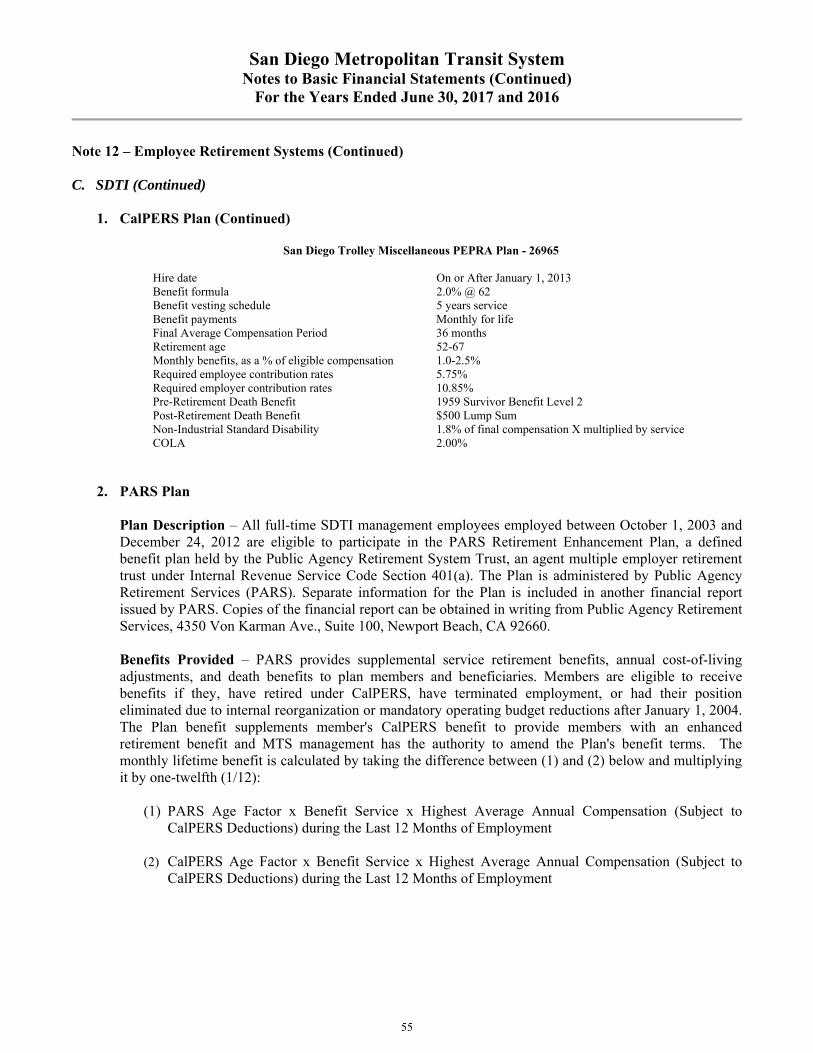
San Diego Metropolitan Transit System Notes to Basic Financial Statements (Continued)
For the Years Ended June 30, 2017 and 2016
55
Note 12 – Employee Retirement Systems (Continued) C. SDTI (Continued)
1. CalPERS Plan (Continued)
San Diego Trolley Miscellaneous PEPRA Plan - 26965
Hire date On or After January 1, 2013 Benefit formula 2.0% @ 62 Benefit vesting schedule 5 years service Benefit payments Monthly for life Final Average Compensation Period 36 months Retirement age 52-67 Monthly benefits, as a % of eligible compensation 1.0-2.5% Required employee contribution rates 5.75% Required employer contribution rates 10.85% Pre-Retirement Death Benefit 1959 Survivor Benefit Level 2 Post-Retirement Death Benefit $500 Lump Sum Non-Industrial Standard Disability 1.8% of final compensation X multiplied by service COLA 2.00%
2. PARS Plan
Plan Description – All full-time SDTI management employees employed between October 1, 2003 and December 24, 2012 are eligible to participate in the PARS Retirement Enhancement Plan, a defined benefit plan held by the Public Agency Retirement System Trust, an agent multiple employer retirement trust under Internal Revenue Service Code Section 401(a). The Plan is administered by Public Agency Retirement Services (PARS). Separate information for the Plan is included in another financial report issued by PARS. Copies of the financial report can be obtained in writing from Public Agency Retirement Services, 4350 Von Karman Ave., Suite 100, Newport Beach, CA 92660. Benefits Provided – PARS provides supplemental service retirement benefits, annual cost-of-living adjustments, and death benefits to plan members and beneficiaries. Members are eligible to receive benefits if they, have retired under CalPERS, have terminated employment, or had their position eliminated due to internal reorganization or mandatory operating budget reductions after January 1, 2004. The Plan benefit supplements member's CalPERS benefit to provide members with an enhanced retirement benefit and MTS management has the authority to amend the Plan's benefit terms. The monthly lifetime benefit is calculated by taking the difference between (1) and (2) below and multiplying it by one-twelfth (1/12):
(1) PARS Age Factor x Benefit Service x Highest Average Annual Compensation (Subject to CalPERS Deductions) during the Last 12 Months of Employment
(2) CalPERS Age Factor x Benefit Service x Highest Average Annual Compensation (Subject to CalPERS Deductions) during the Last 12 Months of Employment

San Diego Metropolitan Transit System Notes to Basic Financial Statements (Continued)
For the Years Ended June 30, 2017 and 2016
56
Note 12 – Employee Retirement Systems (Continued)
C. SDTI (Continued) 2. PARS Plan (Continued) The Plan’s provisions and benefits in effect as of June 30, 2017 are summarized as follows:
San Diego Trolley PARS Plan CLOSED TO NEW MEMBERS
Hire date Prior to January 1, 2013 Benefit formula 2.7% @ 55 Benefit vesting schedule 5 years service Benefit payments Monthly for life Final Average Compensation Period 12 months Retirement age 50-63 Monthly benefits, as a % of eligible compensation 0.282-0.574% Required employee contribution rates Not Required or Permitted Required employer contribution rates 9.96% Pre-Retirement Death Benefit None Post-Retirement Death Benefit Joint-and-100% Survivor Option Disability Retirement Benefit None COLA 2.00%
Employees Covered
At June 30, 2017, the following employees were covered by the benefit terms for each Plan:
SDTI Miscellaneous Plan - 1406* SDTI PARS Plan
Inactive employees or beneficiaries currently receiving benefits 226 41Inactive employees entitled to but not yet receiving benefits 232 0Active employees 531 59
*SDTI PEPRA Plan included in SDTI Miscellaneous Plan June 30, 2015 valuation report.
At June 30, 2016, the following employees were covered by the benefit terms for each Plan:
SDTI Miscellaneous Plan - 1406* SDTI PARS Plan
Inactive employees or beneficiaries currently receiving benefits 218 39Inactive employees entitled to but not yet receiving benefits 224 0Active employees 517 61
*SDTI PEPRA Plan included in SDTI Miscellaneous Plan June 30, 2014 valuation report.
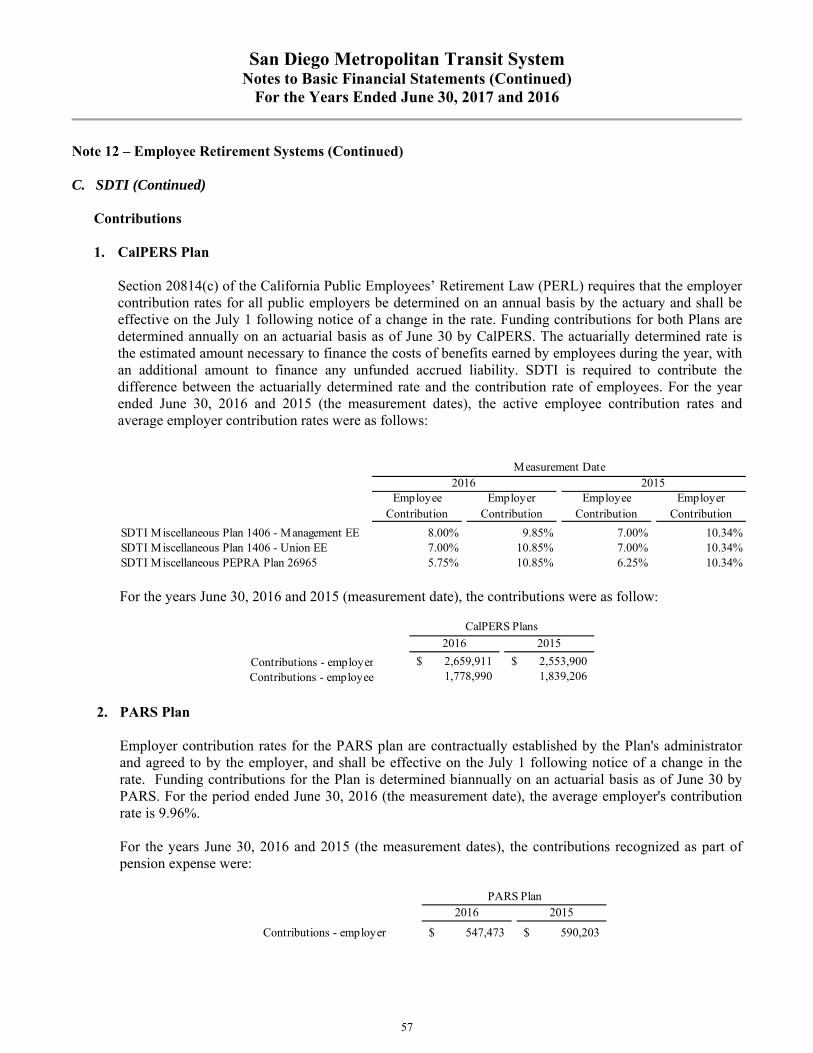
San Diego Metropolitan Transit System Notes to Basic Financial Statements (Continued)
For the Years Ended June 30, 2017 and 2016
57
Note 12 – Employee Retirement Systems (Continued)
C. SDTI (Continued) Contributions 1. CalPERS Plan
Section 20814(c) of the California Public Employees’ Retirement Law (PERL) requires that the employer contribution rates for all public employers be determined on an annual basis by the actuary and shall be effective on the July 1 following notice of a change in the rate. Funding contributions for both Plans are determined annually on an actuarial basis as of June 30 by CalPERS. The actuarially determined rate is the estimated amount necessary to finance the costs of benefits earned by employees during the year, with an additional amount to finance any unfunded accrued liability. SDTI is required to contribute the difference between the actuarially determined rate and the contribution rate of employees. For the year ended June 30, 2016 and 2015 (the measurement dates), the active employee contribution rates and average employer contribution rates were as follows:
Employee Contribution
Employer Contribution
Employee Contribution
Employer Contribution
SDTI Miscellaneous Plan 1406 - Management EE 8.00% 9.85% 7.00% 10.34%SDTI Miscellaneous Plan 1406 - Union EE 7.00% 10.85% 7.00% 10.34%SDTI Miscellaneous PEPRA Plan 26965 5.75% 10.85% 6.25% 10.34%
Measurement Date2016 2015
For the years June 30, 2016 and 2015 (measurement date), the contributions were as follow:
2016 2015
2,659,911$ 2,553,900$ 1,778,990 1,839,206
Contributions - employerContributions - employee
CalPERS Plans
2. PARS Plan Employer contribution rates for the PARS plan are contractually established by the Plan's administrator and agreed to by the employer, and shall be effective on the July 1 following notice of a change in the rate. Funding contributions for the Plan is determined biannually on an actuarial basis as of June 30 by PARS. For the period ended June 30, 2016 (the measurement date), the average employer's contribution rate is 9.96%.
For the years June 30, 2016 and 2015 (the measurement dates), the contributions recognized as part of pension expense were:
2016 2015
547,473$ 590,203$ Contributions - employer
PARS Plan

San Diego Metropolitan Transit System Notes to Basic Financial Statements (Continued)
For the Years Ended June 30, 2017 and 2016
58
Note 12 – Employee Retirement Systems (Continued) C. SDTI (Continued)
Net Pension Liability 1. CalPERS Plan
SDTI’s net pension liability is measured as the total pension liability less the pension plan’s fiduciary net position. The net pension liability of the Plan is measured as of June 30, 2016, using an annual actuarial valuation as of June 30, 2015 rolled forward to June 30, 2016 using standard update procedures. A summary of principal assumptions and methods used to determine the net pension liability is shown below. Actuarial Assumptions – The total pension liabilities in the June 30, 2015 actuarial valuations were determined using the following actuarial assumptions: Valuation Date June 30, 2015Measurement Date June 30, 2016Actuarial Cost Method Entry Age NormalActuarial Assumptions:
Discount Rate 7.65%Inflation 2.75%Payroll Growth 3.00%Projected Salary IncreaseInvestment Rate of Return 7.50% (2)MortalityPost Retirement Benefit Increase
(1) Depending on age, service and type of employment.
Contract COLA up to 2.75% until Purchasing Power applies, 2.75% thereafterderived using CalPERS's membership data for all funds (3)
varies by entry age and service (1)
(2) Net of pension plan investment expenses, including inflation.(3) The mortality table used was developed based on CalPERS's specific data.
The table includes 20 years of mortality improvements using Society of Actuaries Scales BB.
Changes in Assumptions – GASB 68, paragraph 30 states that the long-term expected rate of return should be determined net of pension plan investment expense, but without reduction for pension plan administrative expense. In the current year, the actuarial report did not have a change of assumption. In the prior year the discount rate changed from 7.50 percent in 2014 to 7.65 percent as of June 30, 2015 measurement date to correct the adjustment which previously reduced the discount rate for administrative expense. The underlying mortality assumptions and all other actuarial assumptions used in the June 30, 2015 valuations were based on the results of a January 2014 actuarial experience study for the period 1997 to 2011. Further details of the Experience Study can be found on the CalPERS website.

San Diego Metropolitan Transit System Notes to Basic Financial Statements (Continued)
For the Years Ended June 30, 2017 and 2016
59
Note 12 – Employee Retirement Systems (Continued) C. SDTI (Continued)
Net Pension Liability (Continued) 1. CalPERS Plan (Continued)
Discount Rate – The discount rate used to measure the total pension liability was 7.65 percent. To determine whether the municipal bond rate should be used in the calculation of a discount rate for each plan, CalPERS stress tested plans that would most likely result in a discount rate that would be different from the actuarially assumed discount rate. Based on the testing, none of the tested plans run out of assets. Therefore, the current 7.65 percent discount rate is adequate and the use of the municipal bond rate calculation is not necessary. The long term expected discount rate of 7.65 percent is applied to all plans in the Public Employees Retirement Fund. The stress test results are presented in a detailed report called “GASB Crossover Testing Report” that can be obtained at CalPERS’ website under the GASB 68 section. The long-term expected rate of return on pension plan investments was determined using a building-block method in which best-estimate ranges of expected future real rates of return (expected returns, net of pension plan investment expense and inflation) are developed for each major asset class.
In determining the long-term expected rate of return, staff took into account both short-term and long-term market return expectations as well as the expected pension fund cash flows. Such cash flows were developed assuming that both members and employers will make their required contributions on time and as scheduled in all future years. Using historical returns of all the funds’ asset classes, expected compound (geometric) returns were calculated over the short-term (first 10 years) and the long-term (11-60 years) using a building-block approach. Using the expected nominal returns for both short-term and long-term, the present value of benefits was calculated for each fund. The expected rate of return was set by calculating the single equivalent expected return that arrived at the same present value of benefits for cash flows as the one calculated using both short-term and long-term returns. The expected rate of return was then set equivalent to the single equivalent rate calculated above and rounded down to the nearest one quarter of one percent.
The table below reflects long-term expected real rate of return by asset class. The rate of return was calculated using the capital market assumptions applied to determine the discount rate and asset allocation. These geometric rates of return are net of administrative expenses.
Asset ClassNew Strategic
AllocationReal Return
Years 1-10 (a)Real Return Years 11+ (b)
Global Equity 51.00% 5.25% 5.71%Global Fixed Income 20.00% 0.99% 2.43%Inflation Sensitive 6.00% 0.45% 3.36%Private Equity 10.00% 6.83% 6.95%Real Estate 10.00% 4.50% 5.13%Infrastructure and Forestland 2.00% 4.50% 5.09%Liquidity 1.00% -0.55% -1.05%
(a) an expected inflation of 2.50% for this period(b) an expected inflation of 3.00% for this period

San Diego Metropolitan Transit System Notes to Basic Financial Statements (Continued)
For the Years Ended June 30, 2017 and 2016
60
Note 12 – Employee Retirement Systems (Continued) C. SDTI (Continued)
Net Pension Liability (Continued)
2. PARS Plan
The net pension liability for the PARS Plan is measured as the total pension liability, less the pension plan’s fiduciary net position. The net pension liability of the Plan is measured as of June 30, 2016, using an annual actuarial valuation as of June 30, 2015 rolled forward to June 30, 2016 using standard update procedures. A summary of principal assumptions and methods used to determine the net pension liability is shown below. Actuarial Assumptions – The total pension liabilities in the June 30, 2015 actuarial valuation were determined using the following actuarial assumptions: Valuation Date June 30, 2015Measurement Date June 30, 2016Actuarial Cost Method Entry Age NormalActuarial Assumptions:
Discount Rate 7.00%Inflation 2.75%Salary Increases Including InflationInvestment Rate of Return 7.00%Pre-Retirement Mortality
Post Retirement Benefit Increase
Graded rates based on years of services, 3.50% after 30 years of services
Consistent with Non-Industrial rates used to value the Miscellaneous CALPERS Pension Plans (1)
Any benefit in payment status will increase by 2% per annum on the anniversary of the participant's date of retirement
(1) CalPERS 1997-2011 Healthy Retiree Table (sex-distinct) with an assumed based year of 2008 and full generational projections using Scale AA.
Change in Assumptions – In the current report, the salary scale, retirement and pre-retirement mortality assumptions were updated to be consistent with those recommended for CalPERS actuarial valuations of public agency pension plans. These new demographic assumptions are described in the January 2014 experience study of the California Public Employees Retirement System. The study used data from the 1997 to 2011. The post-retirement mortality was updated to the CalPERS 1997-2011 Healthy Retiree Mortality Tables (sex-distinct) with an assumed base year of 2008 and full generational projections using Scale AA. The inflation rate was lowered from 3.0% to 2.75% to be consistent with CalPERS economic assumptions. For the prior year, there were no changes in assumptions, benefit terms or other inputs that affected the June 30, 2015 measurement of the net pension liability. There were no changes between the measurement date of the net pension liability and the reporting date.

San Diego Metropolitan Transit System Notes to Basic Financial Statements (Continued)
For the Years Ended June 30, 2017 and 2016
61
Note 12 – Employee Retirement Systems (Continued) C. SDTI (Continued)
Net Pension Liability (Continued)
2. PARS Plan (Continued)
Discount Rate – The discount rate used to measure the total pension liability was 7.00 percent. We have not performed a formal cash flow projection as described under Paragraph 27 of GASB Statement 68. However, Paragraph 29 allows for alternative methods to confirm the sufficiency of the Net Position if the evaluations “can be made with sufficient reliability without a separate projection of cash flows into and out of the pension plan…” In our professional judgment, adherence to the actuarial funding policy described above will result in the pension plan’s projected Fiduciary Net Position being greater than or equal to the benefit payments projected for each future period. Therefore, the long-term expected rate of return on Plan investments was applied to all periods of projected benefit payments to determine the Total Pension Liability. The best estimate for the long-term expected rate of return of 7.00% was determined by adding expected inflation to expected long-term real returns and reflecting expected volatility and correlation. The rate of return was calculated using the capital market assumptions applied to determine the discount rate and asset allocation. The table below reflects long-term expected real rate of return presented as arithmetic and geometric means by asset class.
Asset Class Target AllocationReal Return Years 1-10
Real Return Years 11+
U.S. Cash 4.34% 0.42% 0.41%U.S. Core Fixed Income 37.90% 2.12% 1.99%U.S. Equity Market 44.31% 5.12% 3.81%Foreign Developed Equity 10.06% 5.85% 4.20%Emerging Market Equities 3.39% 8.07% 4.79%
Sensitivity of the Net Pension Liability to Changes in the Discount Rate The following presents SDTI’s net pension liability at June 30, 2017 and 2016, calculated using the discount rate, as well as what SDTI’s net pension liability would be if it were calculated using a discount rate that is one percentage point lower or one percentage point higher than the current rate:
2017 2016 2017 2016
1% Decrease 6.65% 6.65% 6.00% 6.00%Net Pension Liability 46,496,681$ 37,308,074$ 3,585,443$ 3,039,616$
Current Discount Rate 7.65% 7.65% 7.00% 7.00%Net Pension Liability 27,706,592$ 19,555,041$ 2,595,419$ 2,165,413$
1% Increase 8.65% 8.65% 8.00% 8.00%Net Pension Liability 12,231,587$ 4,941,415$ 1,769,630$ 1,429,988$
PARS PlanCalPERS

San Diego Metropolitan Transit System Notes to Basic Financial Statements (Continued)
For the Years Ended June 30, 2017 and 2016
62
Note 12 – Employee Retirement Systems (Continued) C. SDTI (Continued)
Changes in the Net Pension Liability 1. CalPERS Plan
At June 30, 2017, the change in the Net Pension Liability for the Plan is as follows:
Total Pension Plan Fiduciary Net PensionLiability Net Position Liability
Balance at July 1, 2016 $ 120,286,668 100,731,627$ 19,555,041$ Changes in the year:
3,580,302 - 3,580,302 9,201,415 - 9,201,415 - - - 375,697 - 375,697 (4,345,171) (4,345,171) - - 2,659,911 (2,659,911) - 1,778,990 (1,778,990) - 628,353 (628,353) - (61,391) 61,391
Net Changes 8,812,243 660,692 8,151,551
Balance at June 30, 2017 129,098,911$ 101,392,319$ 27,706,592$
Contributions - employee
Interest on the total pension liabilityChanges of assumptionsDifferences between expected and actual experience
Net investment incomeAdministrative expense
Benefit payments, including refunds of member contributionsContributions - employer
Service cost
At June 30, 2016, the change in the Net Pension Liability for the Plan is as follows:
Total Pension Plan Fiduciary Net PensionLiability Net Position Liability
Balance at July 1, 2015 $ 114,700,654 98,046,244$ 16,654,410$ Changes in the year:
3,615,793 - 3,615,793 8,554,525 - 8,554,525 (2,274,755) - (2,274,755) (510,309) - (510,309) (3,799,240) (3,799,240) -
- 2,553,900 (2,553,900) - 1,839,206 (1,839,206) - 2,204,904 (2,204,904) - (113,387) 113,387
Net Changes 5,586,014 2,685,383 2,900,631
Balance at June 30, 2016 120,286,668$ 100,731,627$ 19,555,041$
Service costInterest on the total pension liabilityChanges of assumptionsDifferences between expected and actual experience
Net investment incomeAdministrative expense
Benefit payments, including refunds of member contributionsContributions - employerContributions - employee
Pension Plan Fiduciary Net Position – Detailed information about each pension plan’s fiduciary net position is available in the separately issued CalPERS financial reports.

San Diego Metropolitan Transit System Notes to Basic Financial Statements (Continued)
For the Years Ended June 30, 2017 and 2016
63
Note 12 – Employee Retirement Systems (Continued) C. SDTI (Continued)
Changes in the Net Pension Liability (Continued) 2. PARS Plan
At June 30, 2017, the change in the Net Pension Liability for the Plan is as follows:
Total Pension Plan Fiduciary Net Pension
Liability Net Position Liability
Balance at July 1, 2016 $ 7,232,872 5,067,459$ 2,165,413$ Changes in the year:
223,588 - 223,588 523,457 - 523,457 321,921 - 321,921 (166,133) - (166,133) (273,201) (273,201) - - 547,473 (547,473) - - - - (59,981) 59,981 - (14,665) 14,665
Net Changes 629,632 199,626 430,006
Balance at June 30, 2017 7,862,504$ 5,267,085$ 2,595,419$
Service costInterest on the total pension liabilityChanges of assumptionsDifferences between expected and actual experienceBenefit payments, including refunds of member contributionsContributions - employerContributions - employeeNet investment incomeAdministrative expense
At June 30, 2016, the change in the Net Pension Liability for the Plan is as follows:
Total Pension Plan Fiduciary Net PensionLiability Net Position Liability
Balance at July 1, 2015 $ 6,713,539 4,591,214$ 2,122,325$ Changes in the year:
267,889 - 267,889 480,808 - 480,808 (229,364) (229,364) - - 590,203 (590,203) - - - - 127,592 (127,592) - (12,186) 12,186
Net Changes 519,333 476,245 43,088
Balance at June 30, 2016 7,232,872$ 5,067,459$ 2,165,413$
Benefit payments, including refunds of member contributionsContributions - employerContributions - employeeNet investment incomeAdministrative expense
Service costInterest on the total pension liability
Pension Plan Fiduciary Net Position – Detailed information about the PARS Plan’s fiduciary net position is available in the separately issued financial reports.
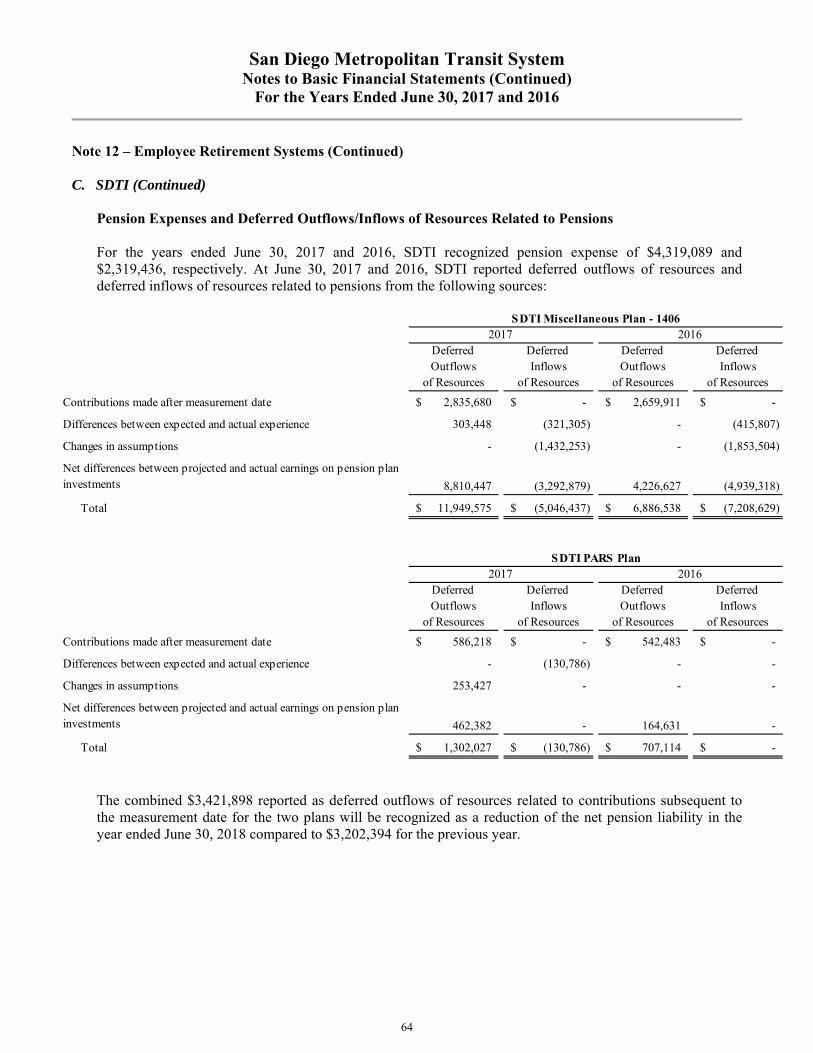
San Diego Metropolitan Transit System Notes to Basic Financial Statements (Continued)
For the Years Ended June 30, 2017 and 2016
64
Note 12 – Employee Retirement Systems (Continued) C. SDTI (Continued)
Pension Expenses and Deferred Outflows/Inflows of Resources Related to Pensions For the years ended June 30, 2017 and 2016, SDTI recognized pension expense of $4,319,089 and $2,319,436, respectively. At June 30, 2017 and 2016, SDTI reported deferred outflows of resources and deferred inflows of resources related to pensions from the following sources:
Deferred Deferred Deferred Deferred Outflows Inflows Outflows Inflows
of Resources of Resources of Resources of Resources
2,835,680$ -$ 2,659,911$ -$
303,448 (321,305) - (415,807)
- (1,432,253) - (1,853,504)
8,810,447 (3,292,879) 4,226,627 (4,939,318)
Total 11,949,575$ (5,046,437)$ 6,886,538$ (7,208,629)$
Deferred Deferred Deferred Deferred Outflows Inflows Outflows Inflows
of Resources of Resources of Resources of Resources
586,218$ -$ 542,483$ -$
- (130,786) - -
253,427 - - -
462,382 - 164,631 -
Total 1,302,027$ (130,786)$ 707,114$ -$
Changes in assumptions
Net differences between projected and actual earnings on pension plan investments
SDTI Miscellaneous Plan - 1406
SDTI PARS Plan
Net differences between projected and actual earnings on pension plan investments
2017 2016
Contributions made after measurement date
Differences between expected and actual experience
Contributions made after measurement date
Differences between expected and actual experience
Changes in assumptions
2017 2016
The combined $3,421,898 reported as deferred outflows of resources related to contributions subsequent to the measurement date for the two plans will be recognized as a reduction of the net pension liability in the year ended June 30, 2018 compared to $3,202,394 for the previous year.

San Diego Metropolitan Transit System Notes to Basic Financial Statements (Continued)
For the Years Ended June 30, 2017 and 2016
65
Note 12 – Employee Retirement Systems (Continued) C. SDTI (Continued)
Pension Expenses and Deferred Outflows/Inflows of Resources Related to Pensions (Continued) As of the measurement date, June 30, 2016, other amounts reported as deferred outflows of resources and deferred inflows of resources related to pensions will be recognized as pension expense as follows:
SDTIYear Ended Miscellaneous SDTI PARS
June 30 Plan - 1406 Plan
2018 376,833$ 159,032$ 2019 376,832 159,032 2020 2,023,271 159,031 2021 1,276,070 107,928 2022 14,452 -
Total 4,067,458$ 585,023$
As of the measurement date, June 30, 2015, other amounts reported as deferred outflows of resources and deferred inflows of resources related to pensions will be recognized as pension expense as follows:
SDTI
Year Ended Miscellaneous SDTI PARSJune 30 Plan - 1406 Plan
2017 (1,105,535)$ 41,158$ 2018 (1,105,535) 41,158 2019 (1,105,536) 41,158 2020 540,903 41,157 2021 (206,299) -
Total (2,982,002)$ 164,631$
Payable to the Pension Plan At June 30, 2017, SDTI reported a payable of $319,162 to CalPERS and $67,701 to PARS for the outstanding amount of contributions to the pension plans required for the fiscal year compared to $286,513 payable to CalPERS and $36,893 payable to PARS for the year ended June 30, 2016.

San Diego Metropolitan Transit System Notes to Basic Financial Statements (Continued)
For the Years Ended June 30, 2017 and 2016
66
Note 12 – Employee Retirement Systems (Continued) D. SDTC
General Information about the Pension Plans
Plan Description - The San Diego Transit Corporation (SDTC) Employee Retirement Plan (Plan), a single-employer defined benefit plan, is currently open to all full-time non-contract employees and certain part-time noncontract employees who have completed one year of service in which they have worked at least 1,000 hours. For contract employees to be eligible for participation in the defined benefit plan, the employee must have been hired before November 25, 2012 if they are an Amalgamated Transit Union (ATU), Local 1309 member, or before April 28, 2011 if they are an International Brotherhood of Electrical Workers (IBEW) Local 465 member. Beginning in FY 2011, SDTC negotiated changes to retirement benefits for ATU Local 1309 members and IBEW Local 465 members. ATU Local 1309 represented employees hired after November 25, 2012 and IBEW local 465 represented employees hired after April 28, 2011 will receive their retirement benefits from a defined contribution 401(a) plan. Based on the applicable Collective Bargaining Agreement, SDTC contributes a fixed percentage of each employee’s gross wages to a 401(a) account and matches voluntary employee contributions up to a maximum of 2% of the employees’ gross wages. The SDTC Plan issues a publicly available financial report that includes financial statements and required supplementary information. The financial report may be obtained by writing to San Diego Transit Corporation, 1255 Imperial Avenue, Suite 1000, San Diego, CA 92101. Benefits Provided – The SDTC Plan provides retirement, termination, and disability benefits, annual cost-of-living adjustments, and death benefits to eligible Plan members and beneficiaries. Benefits are based on years of credited service, equal to one year of full time employment and can only be amended by the MTS Board of Directors. The Plan’s provisions and benefits in effect as of June 30, 2017 and 2016 are summarized as follows:
San Diego Transit Pension Plan - Non-Contract EmployeesHire date Prior to January 1, 2013 On or after January 1, 2013 Benefit formula 2% @ 55 2% @ 62 Benefit vesting schedule 5 years service 5 years service Benefit payments Monthly for life Monthly for life Final Average Compensation Period 12 months 36 months Retirement age 53-63 52-67 Monthly benefits, as a % of eligible compensation 1.742%-2.418% 1.0%-2.5% Required employee contribution rates 8.00% 6.25% Required employer contribution rates 43.08% 44.83% Pre-Retirement Death Benefit 50% Joint & Survivor Post-Retirement Death Benefit Based on benefit election Non-Industrial Standard Disability 1.5% times average monthly final earnings times credited years of service COLA Lesser of CPI or 2.0%

San Diego Metropolitan Transit System Notes to Basic Financial Statements (Continued)
For the Years Ended June 30, 2017 and 2016
67
Note 12 – Employee Retirement Systems (Continued) D. SDTC (Continued)
General Information about the Pension Plans (Continued)
SDTC Contract Employees
ATU - Closed Plan IBEW - Closed PlanHire date Prior to November 25, 2012 Prior to January 1, 2013 Benefit formula 2% @ 55 2% @ 55 Benefit vesting schedule 5 years service 5 years service Benefit payments Monthly for life Monthly for life Final Average Compensation Period 36 months 36 months Retirement age 53-63 55-65 Monthly benefits, as a % of eligible compensation 1.742%-2.418% 2.0%-2.418% Required employee contribution rates 7.00% 8.00% Required employer contribution rates 44.08% 43.08% Pre-Retirement Death Benefit 50% Joint & Survivor Post-Retirement Death Benefit Based on benefit election Disability 1.5% times average monthly final earnings times credited years of service Employees Covered – At June 30, 2017 and 2016, the following employees were covered by the benefit terms for each Plan:
2017 2016
Inactive employees or beneficiaries currently receiving benefits 962 932Inactive employees entitled to but not yet receiving benefits 208 219Active employees 517 563
Contributions – Section 20814(c) of the California Public Employees’ Retirement Law (PERL) requires that the employer contribution rates for all public employers be determined on an annual basis by the actuary and shall be effective on the July 1 following notice of a change in the rate. The employer is required to contribute the difference between the actuarially determined rate and the contribution rate of employees. For the period ended June 30, 2016 (the measurement date), the active employee contribution rate is 6.25-8.00% of annual pay, and the average employer’s contribution rate is 43.77% of annual payroll compared to 6.0-6.25% and 33.62% for the previous year. For the years ended June 30, 2016 and 2015 (the measurement dates), the contributions recognized as part of pension expense for the Plan were as follows:
2016 2015
10,711,282$ 11,352,628$ 1,754,869 1,363,092
Contributions - employerContributions - employee

San Diego Metropolitan Transit System Notes to Basic Financial Statements (Continued)
For the Years Ended June 30, 2017 and 2016
68
Note 12 – Employee Retirement Systems (Continued) D. SDTC (Continued)
Net Pension Liability SDTC’s net pension liability is measured as the total pension liability, less the pension plan’s fiduciary net position. The net pension liability of the Plan is measured as of July 1, 2016, using an annual actuarial valuation as of July 1, 2016. Actuarial Assumptions – The total pension liabilities in the July 1, 2016 actuarial valuations were determined using the following actuarial assumptions: Valuation Date July 1, 2016Measurement Date July 1, 2016Actuarial Cost Method Entry Age NormalActuarial Assumptions:
Discount Rate 7.00%Inflation 2.75%Payroll Growth
Projected Salary IncreaseInvestment Rate of Return (1) 7.00%Mortality
COLA Increase - Non-Contract Members 2.00%
3.00%-6.25% for Non-Contract members3.50%-12.75% for Clerical members
(1) Net of pension plan investment expenses.
2.75%
RP-2000 Tables using male rates for both male and female members with generational improvements using Scale MP-2015
3.00%-10.25% for Mechanics3.25%-8.75% for Drivers
Changes in Assumptions – Changes in Actuarial Methods and Assumptions since the prior valuation were based on an experience study report dated April 2016. The assumptions were revised for investment rate of return, inflation, and merit pay increases, as well as decrements, mortality, disability, service retirement, and termination. There were no changes in assumption during the previous fiscal year. Discount Rate – The discount rate used to measure the Total Pension Liability was 7.00%.
We have assumed that the employees will continue to contribute to the Plan at the required rates and the employer will continue the historical and legally required practice of contributing to the Plan based on an actuarially determined contribution, reflecting a payment equal to annual Normal Cost, a portion of the expected Administrative Expenses, and an amount necessary to amortize the remaining Unfunded Actuarial Liability as of June 30, 2012, over a closed 25-year period (21 years remaining as of the July 1, 2016 actuarial valuation). Actuarial gains and losses in plan years after June 30, 2012 are amortized over closed 15-year periods as a level dollar amount.

San Diego Metropolitan Transit System Notes to Basic Financial Statements (Continued)
For the Years Ended June 30, 2017 and 2016
69
Note 12 – Employee Retirement Systems (Continued) D. SDTC (Continued)
Net Pension Liability (Continued) We have not performed a formal cash flow projection as described under Paragraph 27 of GASB Statement 68. However, Paragraph 29 allows for alternative methods to confirm the sufficiency of the Net Position if the evaluations “can be made with sufficient reliability without a separate projection of cash flows into and out of the pension plan…” In our professional judgment, adherence to the actuarial funding policy described above will result in the pension plan’s projected Fiduciary Net Position being greater than or equal to the benefit payments projected for each future period. Therefore, the long-term expected rate of return on Plan investments was applied to all periods of projected benefit payments to determine the Total Pension Liability. According to Paragraph 30 of GASB Statement 68, the long-term expected rate of return should be determined net of pension plan investment expenses but without reduction for pension plan administrative expenses. The 7.00% investment return assumption used in the Total Pension Liability is net of investment expenses only. The table below reflects long-term expected real rate of return by asset class. The critical inputs of the asset allocation model are the expected risk, return and correlations of different asset classes. The arithmetic rate of return is net of administrative expenses.
Asset ClassStrategic
AllocationReal Return
Years 1-10 (a)Real Return
Years 11+ (a)
United States Equity 20.00% 4.55% 4.55%Global Equity 20.00% 6.35% 6.35%Fixed Income 25.00% 1.00% 1.00%Absolute Return 15.00% 3.75% 3.75%Real Return 20.00% 3.75% 3.75%
(a) an expected inflation of 2.50% is used. Sensitivity of the Net Pension Liability to Changes in the Discount Rate - The following presents the net pension liability for the SDTC Plan as of June 30, 2017 and 2016, calculated using the discount rate, as well as what SDTC’s net pension liability would be if it were calculated using a discount rate that is one percentage point lower or one percentage point higher than the current rate:
2017 2016
1% Decrease 6.00% 6.50%
Net Pension Liability 167,803,770$ 123,319,640$
Current Discount Rate 7.00% 7.50%
Net Pension Liability 136,322,951$ 98,098,137$
1% Increase 8.00% 8.50%
Net Pension Liability 109,629,048$ 76,368,870$

San Diego Metropolitan Transit System Notes to Basic Financial Statements (Continued)
For the Years Ended June 30, 2017 and 2016
70
Note 12 – Employee Retirement Systems (Continued) D. SDTC (Continued)
Changes in Net Pension Liability At June 30, 2017, the change in the Net Pension Liability for the SDTC Plan is as follows:
Total Pension Plan Fiduciary Net PensionLiability Net Position Liability
Balance at July 1, 2016 256,745,469$ 158,647,332$ 98,098,137$ Changes in the year:
3,469,595 - 3,469,595
18,865,499 - 18,865,499
29,699,872 - 29,699,872
(2,174,475) - (2,174,475) (17,350,158) (17,350,158) -
- 10,711,282 (10,711,282)
- 1,754,869 (1,754,869)
- (540,093) 540,093
- (290,381) 290,381
Net Changes 32,510,333 (5,714,481) 38,224,814
Balance at June 30, 2017 289,255,802$ 152,932,851$ 136,322,951$
Administrative expense
Service costInterest on the total pension liabilityChanges of assumptionsDifferences between expected and actual experienceBenefit payments, including refunds of member contributionsContributions - employerContributions - employeeNet investment income
At June 30, 2016, the change in the Net Pension Liability for the SDTC Plan is as follows:
Total Pension Plan Fiduciary Net PensionLiability Net Position Liability
Balance at July 1, 2015 $ 250,491,593 164,797,329$ 85,694,264$
Changes in the year: 3,590,766 - 3,590,766
18,434,275 - 18,434,275
- - -
812,878 - 812,878 (16,584,043) (16,584,043) -
- 11,352,628 (11,352,628)
- 1,363,092 (1,363,092) - (2,018,866) 2,018,866 - (262,808) 262,808
Net Changes 6,253,876 (6,149,997) 12,403,873
Balance at June 30, 2016 256,745,469$ 158,647,332$ 98,098,137$
Changes of assumptionsDifferences between expected and actual experienceBenefit payments, including refunds of member contributionsContributions - employerContributions - employeeNet investment incomeAdministrative expense
Interest on the total pension liabilityService cost

San Diego Metropolitan Transit System Notes to Basic Financial Statements (Continued)
For the Years Ended June 30, 2017 and 2016
71
Note 12 – Employee Retirement Systems (Continued) D. SDTC (Continued)
Pension Plan Fiduciary Net Position – Detailed information about the SDTC Plan’s fiduciary net position is available in the separately issued financial reports. The financial report may be obtained by writing to San Diego Transit Corporation, 1255 Imperial Avenue, Suite 1000, San Diego, CA 92101. Pension Expenses and Deferred Outflows/Inflows of Resources Related to Pensions For the years ended June 30, 2017 and 2016, SDTC recognized pension expense of $23,558,135 and $11,487,861, respectively. At June 30, 2017 and 2016, SDTC reported deferred outflows of resources and deferred inflows of resources related to pensions from the following sources:
Deferred Deferred Deferred Deferred Outflows Inflows Outflows Inflows
of Resources of Resources of Resources of Resources
12,649,101$ -$ 10,711,282$ -$
19,799,915 - - -
270,960 (1,449,650) 1,510,483 -
18,329,930 (2,632,574) 11,378,998 (3,948,861)
Total 51,049,906$ (4,082,224)$ 23,600,763$ (3,948,861)$
2016
Differences between expected and actual experience
Differences between projected and actual earnings on pension plan investments
Contributions made after the measurement date
Changes in assumptions
2017
The $12,649,101 reported as deferred outflows of resources related to contributions subsequent to the measurement date will be recognized as a reduction of the net pension liability in the year ended June 30, 2018 compared to $10,711,282 for the previous year. Other amounts reported as deferred outflows of resources and deferred inflows of resources related to pensions will be recognized as pension expense as follows:
Year EndedJune 30 Amounts
2018 13,423,476$ 2019 13,152,517 2020 5,293,669 2021 2,448,919 2022 -
Total 34,318,581$

San Diego Metropolitan Transit System Notes to Basic Financial Statements (Continued)
For the Years Ended June 30, 2017 and 2016
72
Note 12 – Employee Retirement Systems (Continued) D. SDTC (Continued)
Pension Expenses and Deferred Outflows/Inflows of Resources Related to Pensions In the previous year, other amounts reported as deferred outflows of resources and deferred inflows of resources related to pensions were:
Year EndedJune 30 Amounts
2017 2,767,986$ 2018 1,799,423 2019 1,528,463 2020 2,844,748 2021 -
Total 8,940,620$
Payable to the Pension Plan At June 30, 2017, SDTC reported a payable of $1,068,786 for the outstanding amount of contributions to the pension plan required for the year ended June 30, 2017 compared to $852,440 for the year ended June 30, 2016.
Note 13 – Other Required Individual Fund Disclosures SDTC and SDTI had unrestricted (deficits) of $106,753,243 and $7,080,336 respectively as of June 30, 2017 compared to $93,851,767 and 5,572,877 at June 30, 2016. These deficits are primarily a result of the implementation of GASB 68, Accounting and Financial Reporting for Pensions, as well as timing difference between recognition of expenses on an accrual basis and when those expenses are funded by subsidy transfers for SDTC and SDTI.

73
REQUIRED SUPPLEMENTARY INFORMATION (Unaudited)

San Diego Metropolitan Transit System Required Supplementary Information
For the Years Ended June 30, 2017 and 2016
74
SCHEDULE OF PROPORTIONATE SHARE OF THE NET PENSION LIABILITY MTS'S PLANS
(LAST TEN YEARS*)
2017 2016 2015
Proportion of the net pension liability 0.13219% 0.14157% 0.13274%Proportionate share of the net pension liability 11,438,216$ 9,717,218$ 8,259,452$ Covered Payroll 6,363,275$ 7,016,370$ 8,422,933$ Proportionate Share of the Net Pension Liability as percentage of covered payroll 179.75% 138.49% 98.06%Plan's fiduciary net position as percentage of the total pension liability 72.68% 74.90% 77.17%Proportionate share of aggregate employer contributions 1,564,713$ 1,753,602$ 754,893$
Proportion of the net pension liability 0.00009% -0.00004% 0.00000%Proportionate share of the net pension liability (asset) 7,942$ (2,599)$ 76$ Covered Payroll 932,531$ 539,177$ 169,396$ Proportionate Share of the Net Pension Liability as percentage of covered payroll 0.85% -0.48% 0.04%Plan's fiduciary net position as percentage of the total pension liability 94.57% 104.82% 82.96%Proportionate share of aggregate employer contributions 58,855$ 58,121$ 10$
Proportion of the net pension liability 0.00039% -0.00011% 0.00003%Proportionate share of the net pension liability (asset) 34,161$ (7,322)$ 2,019$ Covered Payroll 4,513,704$ 2,399,171$ 685,453$ Proportionate Share of the Net Pension Liability as percentage of covered payroll 0.76% -0.31% 0.29%Plan's fiduciary net position as percentage of the total pension liability 92.21% 104.24% 83.03%Proportionate share of aggregate employer contributions 272,574$ 187,174$ 267$
*GASB 68 was implemented in fiscal year 2015, therefore only three years of data is presented.
Miscellaneous Plan
Miscellaneous Plan - Second Tier
Miscellaneous PEPRA Plan

San Diego Metropolitan Transit System Required Supplementary Information (Continued)
For the Years Ended June 30, 2017 and 2016
75
SCHEDULE OF CHANGES IN NET PENSION LIABILITY AND RELATED RATIOS SDTI'S CALPERS PLAN
(LAST TEN YEARS*)
2017 2016 2015
Total Pension LiabilityService Cost 3,580,302$ 3,615,793$ 3,721,950$
Interest on total pension liability 9,201,415 8,554,525 7,982,614
Differences between expected and actual experience 375,697 (510,309) -
Changes in assumptions - (2,274,755) -
Changes in benefit terms - - -
Benefit payments, including refunds of employee contributions (4,345,171) (3,799,240) (3,155,596)
Net change in total pension liability 8,812,243 5,586,014 8,548,968
Total pension liability - beginning 120,286,668 114,700,654 106,151,686
Total pension liability - ending (a) 129,098,911$ 120,286,668$ 114,700,654$
Plan fiduciary net positionContributions - employer 2,659,911$ 2,553,900$ 2,498,345$
Contributions - employee 1,778,990 1,839,206 2,179,194
Net investment income 628,353 2,204,904 14,416,106
Benefit payments, including refunds of employee contributions (4,345,171) (3,799,240) (3,155,596)
Administrative expense (61,391) (113,387) -
Net change in plan fiduciary net position 660,692 2,685,383 15,938,049
Plan fiduciary net position - beginning 100,731,627 98,046,244 82,108,195
Plan fiduciary net position - ending (b) 101,392,319$ 100,731,627$ 98,046,244$
Net pension liability - ending (a) - (b) 27,706,592$ 19,555,041$ 16,654,410$
Plan fiduciary net position as a percentage of the total pension liability 78.54% 83.74% 85.48%
Covered payroll 27,247,357$ 26,965,416$ 26,268,261$
Plan net pension liability/(asset) as a percentage of covered payroll 101.69% 72.52% 63.40%
Notes to Schedule:
Changes of assumption. There were no changes in assumptions in the June 30, 2016 (measurement date) report.
*GASB 68 was implemented in fiscal year 2015, therefore only three years of data is presented.
Benefit changes. The figures above do not include any liability impact that may have resulted from plan changes which occurred after the June 30, 2015 valuation date.

San Diego Metropolitan Transit System Required Supplementary Information (Continued)
For the Years Ended June 30, 2017 and 2016
76
SCHEDULE OF CHANGES IN NET PENSION LIABILITY AND RELATED RATIOS SDTI'S PARS PLAN
(LAST TEN YEARS*)
2017 2016
Total Pension LiabilityService Cost 223,588$ 267,889$
Interest on total pension liability 523,457 480,808
Differences between expected and actual experience (166,133) -
Changes in assumptions 321,921 -
Changes in benefit terms - -
Benefit payments, including refunds of employee contributions (273,201) (229,364)
Net change in total pension liability 629,632 519,333
Total pension liability - beginning 7,232,872 6,713,539
Total pension liability - ending (a) 7,862,504$ 7,232,872$
Plan fiduciary net positionContributions - employer 547,473$ 590,203$
Contributions - employee - -
Net investment income (59,981) 127,592
Benefit payments, including refunds of employee contributions (273,201) (229,364)
Administrative expense (14,665) (12,186)
Net change in plan fiduciary net position 199,626 476,245
Plan fiduciary net position - beginning 5,067,459 4,591,214
Plan fiduciary net position - ending (b) 5,267,085$ 5,067,459$
Net pension liability - ending (a) - (b) 2,595,419$ 2,165,413$
Plan fiduciary net position as a percentage of the total pension liability 66.99% 70.06%
Covered payroll 5,020,011$ 4,943,557$
Plan net pension liability/(asset) as a percentage of covered payroll 51.70% 43.80%
Notes to Schedule:
*GASB 68 for PARS was implemented in fiscal year 2016, therefore only two year of data is presented.
Benefit changes. The figures above do not include any liability impact that may have resulted from plan changes which occurred after the June 30, 2015 valuation date.
Changes in Assumption: In the June 30, 2015 valuation date report, the salary scale, retirement and pre-retirement mortality assunptions were updated. The inflation rate was lowered from 3.0% to 2.75%.

San Diego Metropolitan Transit System Required Supplementary Information (Continued)
For the Years Ended June 30, 2017 and 2016
77
SCHEDULE OF CHANGES IN NET PENSION LIABILITY AND RELATED RATIOS SDTC'S PLAN
(LAST TEN YEARS*)
2017 2016 2015
Total Pension LiabilityService Cost 3,469,595$ 3,590,766$ 3,908,376$
Interest on total pension liability 18,865,499 18,434,275 17,812,979
Differences between expected and actual experience (2,174,475) 812,878 2,905,692
Changes in assumptions 29,699,872 - -
Changes in benefit terms - - -
Benefit payments, including refunds of employee contributions (17,350,158) (16,584,043) (15,466,924)
Net change in total pension liability 32,510,333 6,253,876 9,160,123
Total pension liability - beginning 256,745,469 250,491,593 241,331,470
Total pension liability - ending (a) 289,255,802$ 256,745,469$ 250,491,593$
Plan fiduciary net positionContributions - employer 10,711,282$ 11,352,628$ 12,628,190$
Contributions - employee 1,754,869 1,363,092 899,791
Net investment income (540,093) (2,018,866) 18,417,439
Benefit payments, including refunds of employee contributions (17,350,158) (16,584,043) (15,466,924)
Administrative expense (290,381) (262,808) (258,142)
Net change in plan fiduciary net position (5,714,481) (6,149,997) 16,220,354
Plan fiduciary net position - beginning 158,647,332 164,797,329 148,576,975
Plan fiduciary net position - ending (b) 152,932,851$ 158,647,332$ 164,797,329$
Net pension liability - ending (a) - (b) 136,322,951$ 98,098,137$ 85,694,264$
Plan fiduciary net position as a percentage of the total pension liability 52.87% 61.79% 65.79%
Covered payroll 31,048,663$ 32,658,827$ 32,313,553$
Plan net pension liability/(asset) as a percentage of covered payroll 439.06% 300.37% 265.20%
Notes to Schedule:
*GASB 68 was implemented in fiscal year 2015, therefore only three years of data is presented.
Changes of assumption. In the current year, the investment rate of return decreased from 7.5% to 7.0%, inflation decreased from 3.0% to 2.75% and revisions were made to merit pay increases, mortality, disability, service retirement and terminations.
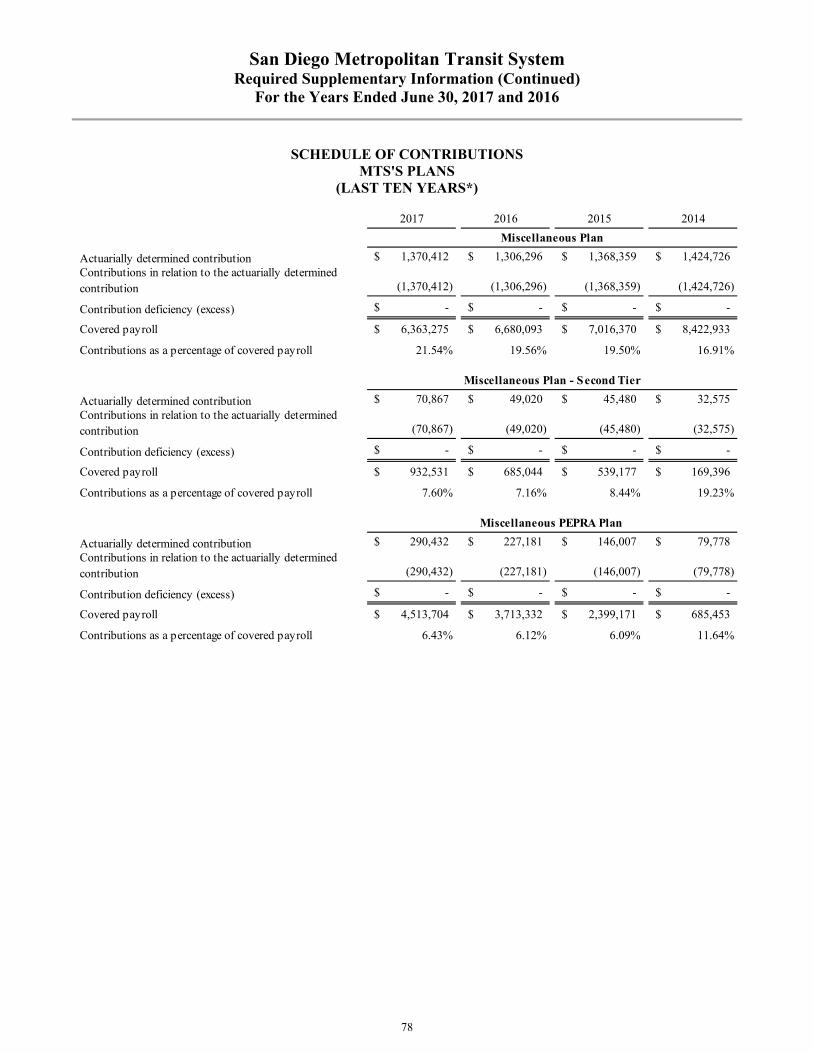
San Diego Metropolitan Transit System Required Supplementary Information (Continued)
For the Years Ended June 30, 2017 and 2016
78
SCHEDULE OF CONTRIBUTIONS MTS'S PLANS
(LAST TEN YEARS*)
2017 2016 2015 2014
Actuarially determined contribution 1,370,412$ 1,306,296$ 1,368,359$ 1,424,726$ Contributions in relation to the actuarially determined contribution (1,370,412) (1,306,296) (1,368,359) (1,424,726)
Contribution deficiency (excess) -$ -$ -$ -$
Covered payroll 6,363,275$ 6,680,093$ 7,016,370$ 8,422,933$
Contributions as a percentage of covered payroll 21.54% 19.56% 19.50% 16.91%
Actuarially determined contribution 70,867$ 49,020$ 45,480$ 32,575$ Contributions in relation to the actuarially determined contribution (70,867) (49,020) (45,480) (32,575)
Contribution deficiency (excess) -$ -$ -$ -$
Covered payroll 932,531$ 685,044$ 539,177$ 169,396$
Contributions as a percentage of covered payroll 7.60% 7.16% 8.44% 19.23%
Actuarially determined contribution 290,432$ 227,181$ 146,007$ 79,778$ Contributions in relation to the actuarially determined contribution (290,432) (227,181) (146,007) (79,778)
Contribution deficiency (excess) -$ -$ -$ -$
Covered payroll 4,513,704$ 3,713,332$ 2,399,171$ 685,453$
Contributions as a percentage of covered payroll 6.43% 6.12% 6.09% 11.64%
Miscellaneous Plan
Miscellaneous Plan - Second Tier
Miscellaneous PEPRA Plan

San Diego Metropolitan Transit System Required Supplementary Information (Continued)
For the Years Ended June 30, 2017 and 2016
79
SCHEDULE OF CONTRIBUTIONS MTS'S PLANS (Continued)
(LAST TEN YEARS*)
Notes to Schedule:
Methods and assumptions used to determine contribution rates:
Actuarial cost methodAmortization method/periodAsset valuation method
InflationSalary increasesPayroll growth
Investment rate of return
Retirement age
Mortality
* GASB 68 was implemented in fiscal year 2015, therefore only four years data are presented.
The probabilities of mortality are based on the 2010 CalPERS Experience Study for the period from 1997 to 2007. Pre-retirement and post-retirement mortality rates include 5 years of projected mortality improvement using Scale AA published by the Society of Actuaries.
Changes of assumption: In current year, there were no changes in assumptions.
Varies by entry age and service3.00%
7.50% net of pension plan investment and administrative expenses, including inflation
The probabilities of retirement are based on the 2010 CalPERS Experience Study for the period from 1997 and 2007.
Entry Age NormalFor details, see June 30, 2013 Funding Valuation Actuarial value of assets. For details, see June 30, 2013 Funding Valuation Report.
2.75%
Benefit changes: The figures above do not include any liability impact that may have resulted from plan changes which occurred after June 30, 2015 as they have minimal cost impact.
The actuarial methods and assumption used to set the actuarialy determined contributions for Fiscal Year 2015-2016 was derived from the June 30, 2013 funding valuation report.

San Diego Metropolitan Transit System Required Supplementary Information (Continued)
For the Years Ended June 30, 2017 and 2016
80
SCHEDULE OF CONTRIBUTIONS SDTI'S CALPERS PLAN
(LAST TEN YEARS*)
2017 2016 2015 2014
Actuarially determined contribution 2,835,680$ 2,659,911$ 2,553,900$ 2,498,345$ Contributions in relation to the actuarially determined contribution (2,835,680) (2,659,911) (2,553,900) (2,498,345)
Contribution deficiency (excess) -$ -$ -$ -$
Covered payroll 26,132,724$ 27,247,357$ 26,965,416$ 26,268,261$
Contributions as a percentage of covered payroll 10.85% 9.76% 9.47% 9.51%
Notes to Schedule:
Methods and assumptions used to determine contribution rates:
Actuarial cost methodAmortization method/periodAsset valuation method
InflationSalary increasesPayroll growth
Investment rate of return
Retirement age
Mortality
* GASB 68 was implemented in fiscal year 2015, therefore only four years data are presented.
The probabilities of mortality are based on the 2010 CalPERS Experience Study for the period from 1997 to 2007. Pre-retirement and post-retirement mortality rates include 5 years of projected mortality improvement using Scale AA published by the Society of Actuaries.
Benefit changes: The figures above do not include any liability impact that may have resulted from plan changes which occurred after June 30, 2015 as they have minimal cost impact.
Changes of assumption: There were no changes in assumptions in the current year.
The actuarial methods and assumption used to set the actuarially determined contributions for Fiscal Year 2015-2016 was derived from the June 30, 2013 funding valuation report.
The probabilities of retirement are based on the 2010 CalPERS Experience Study for the period from 1997 and 2007.
3.00%
Entry Age NormalFor details, see June 30, 2013 Funding Valuation Actuarial value of assets. For details, see June 30, 2013 Funding Valuation Report.
2.75%Varies by entry age and service
7.50% net of pension plan investment and administrative expenses, including inflation

San Diego Metropolitan Transit System Required Supplementary Information (Continued)
For the Years Ended June 30, 2017 and 2016
81
SCHEDULE OF CONTRIBUTIONS SDTI PARS PLAN
(LAST TEN YEARS*)
2017 2016 2015 2014
Actuarially determined contribution 499,993$ 445,465$ 546,873$ 463,079$ Contributions in relation to the actuarially determined contribution (605,864) (547,473) (590,203) (453,934)
Contribution deficiency (excess) (105,871)$ (102,008)$ (43,330)$ 9,145$
Covered payroll 5,170,611$ 5,020,011$ 4,943,557$ 5,984,089$
Contributions as a percentage of covered payroll 11.72% 10.91% 11.94% 7.59%
Notes to Schedule:
Methods and assumptions used to determine contribution rates:
Valuation dateActuarial cost method
Amortization method
Amortization period
Asset valuation methodInflationSalary increasesPayroll growth 3.00%Investment rate of return
* GASB 68 was implemented in fiscal year 2015, therefore only four years data are presented.
Benefit changes: The figures above do not include any liability impact that may have resulted from plan changes which occurred after July 1, 2013 as they have minimal cost impact.
Changes in Assumption: In the June 30, 2015 valuation date report, the salary scale, retirement and pre-retirement mortality assunptions were updated. The inflation rate was lowered from 3.0% to 2.75%.
7.00%
Entry Age Normal
20 years as of valuation date
July 1, 2016
Level percent of payroll
5-year smoothed market2.75%varies by entry age and service

San Diego Metropolitan Transit System Required Supplementary Information (Continued)
For the Years Ended June 30, 2017 and 2016
82
SCHEDULE OF CONTRIBUTIONS SDTC'S PLAN
(LAST TEN YEARS*)
2017 2016 2015 2014
Actuarially determined contribution 12,649,101$ 10,711,282$ 11,352,628$ 12,628,190$ Contributions in relation to the actuarially determined contribution (12,649,101) (10,711,282) (11,352,628) (12,628,190)
Contribution deficiency (excess) -$ -$ -$ -$
Covered payroll 31,579,634$ 31,048,663$ 32,658,827$ 32,313,553$
Contributions as a percentage of covered payroll 40.05% 34.50% 34.76% 39.08%
Notes to Schedule:
Methods and assumptions used to determine contribution rates:
Valuation dateActuarial cost method Entry AgeAmortization method/periodAsset valuation methodSalary increases
3.00%-6.25% for non-contract members
Payroll growth 2.75%Investment rate of returnMortality RP-2000 tables using male rates for both male and female members
* GASB 68 was implemented in fiscal year 2015, therefore only four years data are presented.
Changes in Assumptions: In the current year, assumptions were revised for investment rate of return, inflation, and merit pay increases, as well as decrements, mortality, disability, service retirement and terminiation
Benefit changes: The figures above do not include any liability impact that may have resulted from plan changes which occurred after July 1, 2016 as they have minimal cost impact.
with generational improvements using Scale MP-2015
July 1, 2016
Level percent of payroll, closed 25-year period
3.25%-8.75% for drivers3.25%-10.25% for mechanics
3.00%-12.75% for clerical members
7.00% net of pension plan investment expenses.
5-year smoothed market

San Diego Metropolitan Transit System Required Supplementary Information (Continued)
For the Years Ended June 30, 2017 and 2016
83
SCHEDULE OF FUNDING PROGRESS OF OTHER POSTEMPLOYMENT HEALTHCARE PLAN (OPEB) The following Schedule of Funding Progress shows the recent history of the actuarial value of assets, actuarial accrued liability, their relationship, and the relationship of the unfunded actuarial accrued liability to payroll. (Amounts in thousands of dollars). MTS (in 000s):
Actuarial Annual UAAL as a
Valuation Value of Entry Age Unfunded Funded Covered % of
Date Assets Normal AAL AAL Status Payroll Payroll
6/30/2011 -$ 3,276$ 3,276$ 0.00% 8,023$ 40.83%
6/30/2013 - 3,855 3,855 0.00% 8,698 44.32%
6/30/2015 - 3,863 3,863 0.00% 10,416 37.09%
SDTI (in 000s):
Actuarial Annual UAAL as a
Valuation Value of Entry Age Unfunded Funded Covered % of
Date Assets Normal AAL AAL Status Payroll Payroll
6/30/2011 -$ 9,417$ 9,417$ 0.00% 24,617$ 38.25%
6/30/2013 - 9,545 9,545 0.00% 25,277 37.76%
6/30/2015 - 7,700 7,700 0.00% 26,709 28.83%
SDTC (in 000s):
Actuarial Annual UAAL as a
Valuation Value of Entry Age Unfunded Funded Covered % of
Date Assets Normal AAL AAL Status Payroll Payroll
6/30/2011 -$ 24,326$ 24,326$ 0.00% 33,136$ 73.41%
6/30/2013 - 23,111 23,111 0.00% 34,070 67.83%
6/30/2015 - 22,066 22,066 0.00% 36,771 60.01% Actuarial review and analysis of OPEB liability and funding status is performed every two years or annually if there are significant changes in the plan. The next scheduled actuarial review and analysis of OPEB liability and funding status will be performed in FY2018 based on the year ending June 30, 2017.

84
This page intentionally left blank.

85
SUPPLEMENTARY INFORMATION
Combining Schedule of Net Position Combining Schedule of Revenues, Expenses, and Changes in Net Position Combining Statement of Cash Flows Schedule of Revenues, Expenses, and Changes in Net Position – Budget and Actual: Combined Operations General Operations Taxicab Administration San Diego & Arizona Eastern Railway Contracted Services San Diego Transit Corporation (SDTC) San Diego Trolley, Inc. (SDTI)

San
Die
go M
etro
pol
itan
Tra
nsi
t S
yste
m
Com
bin
ing
Sch
edu
le o
f N
et P
osit
ion
Ju
ne
30, 2
017
G
ener
alC
ontr
acte
dO
pera
tions
Serv
ices
SDT
CSD
TI
Tot
a l
AS
SET
SC
urre
nt a
sset
s:C
ash
and
cash
equ
ival
ents
$
9
0,71
0,35
0 $
54
,582
$
(
100,
592)
$
(32
1,51
8)90
,342
,822
$
Cas
h an
d ca
sh e
quiv
alen
ts re
stric
ted
for c
apita
l sup
port
6,74
3,86
8
-
-
-
6,
743,
868
Acc
ount
s an
d ot
her r
ecei
vabl
es
8
,197
,749
487
1
,542
,059
111
,839
9,
852,
134
Due
from
oth
er g
over
nmen
ts
82,
849,
092
62,9
72
9,6
03
1
11,1
13
83,0
32,7
8 0
Inte
rnal
bal
ance
s
(47,
399,
665)
8,9
39,5
57
2
4,07
2,69
4
14,
387,
414
-
Inve
ntor
y
-
-
2
,998
,622
16,
936,
654
19,9
35,2
76
Prep
aid
item
s an
d ot
her c
urre
nt a
sset
s
949
,047
309
,330
667
,444
861
,981
2,
787,
802
Tot
al c
urre
nt a
sset
s14
2,05
0,44
1
9,
366,
928
29,1
89,8
30
32,0
87,4
83
212,
694,
682
Non
curr
ent a
sset
s:C
apita
l ass
ets
(net
of a
ccum
ulat
ed d
epre
ciat
ion)
9
5,48
8,72
1
202,
196,
970
24
2,41
6,70
7
1,
201,
005,
006
1,74
1,10
7,40
4
Tot
al n
oncu
rren
t ass
ets
9
5,48
8,72
1
202,
196,
970
24
2,41
6,70
7
1,
201,
005,
006
1,74
1,10
7,40
4
Tot
al a
sset
s23
7,53
9,16
2
21
1,56
3,89
8
27
1,60
6,53
7
1,
233,
092,
489
1,
953,
802,
086
DEF
ERR
ED O
UT
FLO
WS
OF
RES
OU
RC
ESC
ontr
ibut
ions
mad
e af
ter t
he m
easu
rem
ent d
ate
1,73
1,71
1
-
12,
649,
101
3,42
1,89
8 17
,802
,710
A
ctua
rial p
ensi
on c
alul
atio
ns:
Diff
eren
ces
betw
een
proj
ecte
d an
d ac
tual
ear
ning
s on
pen
sion
pl
an in
vest
men
ts
4
,700
,563
-
18,
329,
930
9,2
72,8
29
32,3
03,3
22
D
iffer
ence
s be
twee
n ex
pect
ed a
nd a
ctua
l exp
erie
nce
6
4,27
6
-
270,
960
30
3,44
8 63
8,68
4
Adj
ustm
ents
due
to d
iffer
ence
s in
pro
port
ions
9
1,41
5
-
-
-
91
,415
Cha
nge
in a
ssum
ptio
n
-
-
19,
799,
915
2
53,4
27
20,0
53,3
42
Tot
al d
efer
red
outf
low
s of
res
ourc
es6,
587,
965
-
51,0
49,9
06
13,2
51,6
02
70,8
89,4
73
86

San
Die
go M
etro
pol
itan
Tra
nsi
t S
yste
m
Com
bin
ing
Sch
edu
le o
f N
et P
osit
ion
(C
onti
nu
ed)
Jun
e 30
, 201
7
G
ener
alC
ontr
acte
dO
pera
tions
Serv
ices
SDT
CSD
TI
Tot
alL
IAB
ILIT
IES
Cur
rent
liab
ilit
ies:
Acc
ount
s pa
yabl
e
7
,879
,710
7
,882
,837
2
,779
,335
1
,754
,968
20
,296
,850
Due
to o
ther
gov
ernm
ents
1
1,95
4,87
5
15
,299
104
,329
497
,308
12
,571
,811
Une
arne
d re
venu
e
6
,297
,644
-
-
38
,776
6,
336,
420
Acc
rued
exp
ense
s
802
,061
12
,216
1
,101
,017
1
,105
,319
3,
020,
613
Ret
entio
ns p
ayab
le
351
,037
1
,401
-
- 35
2,43
8
Ret
entio
ns p
ayab
le fr
om re
stric
ted
asse
ts
2
,303
,606
-
-
- 2,
303,
606
Due
with
in o
ne y
ear:
Com
pens
ated
abs
ence
s pa
yabl
e
829
,706
-
3
,237
,943
2
,018
,368
6,
086,
017
Acc
rued
dam
age,
inju
ry, a
nd e
mpl
oyee
cla
ims
2
30,0
36
-
3,6
56,1
95
1,0
95,4
02
4,98
1,63
3
Lo
ng-t
erm
deb
t
676
,445
-
2
,315
,000
- 2,
991,
445
Tot
al c
urre
nt li
abil
itie
s31
,325
,120
7,91
1,75
3
13
,193
,819
6,51
0,14
1
58
,940
,833
Non
curr
ent l
iabi
liti
es:
Due
in m
ore
than
one
yea
r:C
ompe
nsat
ed a
bsen
ces
paya
ble
252,
221
-
4,
006,
630
645,
011
4,
903,
862
Acc
rued
dam
age,
inju
ry, a
nd e
mpl
oyee
cla
ims
301,
556
-
8,
533,
699
1,81
7,95
4
10
,653
,209
Agg
rega
te n
et p
ensi
on li
abili
ty11
,480
,319
-
136,
322,
951
30
,302
,011
178,
105,
281
N
et o
ther
pos
tem
ploy
men
t ben
efits
obl
igat
ion
5,09
2,30
8
-
5,
513,
656
7,96
7,08
1
18
,573
,045
Long
-ter
m d
ebt
1,07
1,26
8
-
15
,340
,000
-
16,4
11,2
68
Tot
al n
oncu
rren
t lia
bili
ties
18,1
97,6
72
-
16
9,71
6,93
6
40,7
32,0
57
22
8,64
6,66
5
Tot
al li
abil
itie
s49
,522
,792
7,91
1,75
3
18
2,91
0,75
5
47,2
42,1
98
28
7,58
7,49
8
87

San
Die
go M
etro
pol
itan
Tra
nsi
t S
yste
m
Com
bin
ing
Sch
edu
le o
f N
et P
osit
ion
(C
onti
nu
ed)
Jun
e 30
, 201
7
G
ener
alC
ontr
acte
dO
pera
tions
Serv
ices
SDT
CSD
TI
Tot
alD
EFER
RED
INFL
OW
S O
F R
ESO
UR
CES
Def
erre
d ga
in o
n re
fund
ing
2
21,9
38
-
-
-
221,
938
A
ctua
rial p
ensi
on c
alul
atio
ns:
Diff
eren
ces
betw
een
proj
ecte
d an
d ac
tual
ear
ning
s on
pen
sion
pl
an in
vest
men
ts
959
,103
-
2
,632
,574
3
,292
,879
6,
884,
556
Adj
ustm
ents
due
to d
iffer
ence
s in
pro
port
ions
1,4
17,3
93
-
-
-
1,41
7,39
3
D
iffer
ence
s be
twee
n ac
tual
and
pro
port
iona
te s
hare
s of
em
ploy
er c
ontr
ibut
ions
4
40,1
80
-
-
-
440,
180
D
iffer
ence
s be
twee
n ex
pect
ed a
nd a
ctua
l exp
erie
nce
12,9
45
-
1,4
49,6
50
4
52,0
91
1,91
4,68
6
C
hang
es in
ass
umpt
ions
6
08,1
12
-
-
1,4
32,2
53
2,04
0,36
5
Tot
al d
efer
red
infl
ows
of r
esou
rces
3,65
9,67
1
-
4,
082,
224
5,17
7,22
3
12
,919
,118
NET
PO
SIT
ION
Net
inve
stm
ent i
n ca
pita
l ass
ets
93,7
41,0
08
20
2,19
6,97
0
242,
416,
707
1,
201,
005,
006
1,73
9,35
9,69
1
R
estr
icte
d fo
r:C
apita
l pro
ject
s4,
440,
262
-
-
-
4,44
0,26
2
U
nres
tric
ted
(def
icit)
92,7
63,3
94
1,
455,
175
(106
,753
,243
)
(7,0
80,3
36)
(19,
615,
010)
Tot
al n
et p
osit
ion
190,
944,
664
$
20
3,65
2,14
5$
135,
663,
464
$
1,
193,
924,
670
$
1,72
4,18
4,94
3$
88

89
This page intentionally left blank.

San
Die
go M
etro
pol
itan
Tra
nsi
t S
yste
m
Com
bin
ing
Sch
edu
le o
f R
even
ues
, Exp
ense
s, a
nd
Ch
ange
s in
Net
Pos
itio
n F
or t
he
Yea
r E
nd
ed J
un
e 30
, 201
7
Gen
eral
Con
trac
ted
Ope
ratio
nsSe
rvic
esSD
TC
SDT
IEl
imin
atio
nsT
otal
Ope
rati
ng r
even
ues:
Pass
enge
r rev
enue
$
-
$
2
9,44
7,30
4 $
24,
863,
742
$
3
8,96
8,40
9 $
- 93
,279
,455
$
Adv
ertis
ing
1,3
78,6
18
-
-
-
-
1,37
8,61
8
Mis
cella
neou
s op
erat
ing
reve
nues
1
8,14
6,86
9
1
,927
10
,192
704
,246
- 18
,863
,234
Tot
al o
pera
ting
rev
enue
s19
,525
,487
29
,449
,231
24
,873
,934
39
,672
,655
-
11
3,52
1,30
7
Ope
rati
ng e
xpen
ses:
Pers
onne
l cos
ts
19,
752,
442
57
2,97
2
80,
157,
201
3
6,53
8,01
0
-
13
7,02
0,62
5
Out
side
ser
vice
s
16,
582,
215
7
0,86
9,31
2
3,
311,
004
7,03
7,80
1
-
97
,800
,332
Tra
nsit
oper
atio
ns fu
ndin
g
1
14,1
63,7
94
-
-
-
(113
,700
,449
)46
3,34
5
Mat
eria
ls a
nd s
uppl
ies
2
7,68
6
14,
489
4,54
1,13
8
8,
481,
722
-
13,0
65,0
35
Ener
gy c
osts
19
3,67
5
7,
984,
352
5,73
8,30
3
11,
635,
848
-
25,5
52,1
78
Ris
k m
anag
emen
t
420,
812
1
5,30
0
2,
157,
063
1,68
2,39
4
-
4,
275,
569
Mis
cella
neou
s op
erat
ing
expe
nses
(22
,978
,148
)
2,
287,
867
9,19
6,79
6
17,
427,
769
-
5,93
4,28
4
Dep
reci
atio
n
2,
547,
636
1
9,07
9,08
7
25,
188,
350
7
7,06
4,93
2
-
12
3,88
0,00
5
Tot
al o
pera
ting
exp
ense
s13
0,71
0,11
2
10
0,82
3,37
9
13
0,28
9,85
5
159,
868,
476
(113
,700
,449
)
40
7,99
1,37
3
Ope
rati
ng in
com
e (l
oss)
(111
,184
,625
)
(7
1,37
4,14
8)
(105
,415
,921
)
(1
20,1
95,8
21)
113,
700,
449
(294
,470
,066
)
90

San
Die
go M
etro
pol
itan
Tra
nsi
t S
yste
m
Com
bin
ing
Sch
edu
le o
f R
even
ues
, Exp
ense
s, a
nd
Ch
ange
s in
Net
Pos
itio
n (
Con
tin
ued
) F
or t
he
Yea
r E
nd
ed J
un
e 30
, 201
7
G
ener
alC
ontr
acte
dO
pera
tions
Serv
ices
SDT
CSD
TI
Elim
inat
ions
Tot
alP
ubli
c su
ppor
t and
non
oper
atin
g re
venu
es (e
xpen
ses)
:Fe
dera
l rev
enue
7
2,40
4,73
0
13,
837,
667
2
0,00
0,00
0
23,
149,
033
(5
6,98
6,70
0)72
,404
,730
Tra
nspo
rtat
ion
Dev
elop
men
t Act
(TD
A) f
unds
9
4,91
5,73
3
32,
484,
980
1
3,36
5,53
6
10,
303,
635
(5
6,15
4,15
1)94
,915
,733
Stat
e T
rans
it A
ssis
tanc
e (S
TA
) fun
ds
12,
918,
834
-
3,6
00,9
56
2,7
00,1
47
(
6,30
1,10
3)12
,918
,834
Stat
e re
venu
e - o
ther
1
4,18
3,19
6
3
,676
,560
171
,729
605
,608
(4,
453,
897)
14,1
83,1
96
T
rans
Net
fund
s
42,
770,
235
1,5
47,4
31
3
0,72
2,80
5
5
,000
,000
(42,
770,
236)
37,2
70,2
35
O
ther
loca
l sub
sidi
es
1
,082
,697
748
,423
315
,000
-
(1,
063,
423)
1,08
2,69
7
In
vest
men
t ear
ning
s
631
,555
-
-
4
,513
- 63
6,06
8
Inte
rest
exp
ense
(1,7
06)
-
(96
1,06
9)
-
- (9
62,7
75)
G
ain
(loss
) on
disp
osal
of a
sset
s
237
,944
-
109
,724
48
,280
- 39
5,94
8
Tot
al p
ubli
c su
ppor
t and
non
oper
atin
g re
venu
es
(exp
ense
s):
239,
143,
218
52
,295
,061
67,3
24,6
81
41
,811
,216
(167
,729
,510
)
232,
844,
666
Inco
me
(los
s) b
efor
e tr
ansf
ers
and
cont
ribu
ted
capi
tal
127,
958,
593
(1
9,07
9,08
7)
(38,
091,
240)
(7
8,38
4,60
5)
(54,
029,
061)
(6
1,62
5,40
0)
Tra
nsfe
rs
(54,
029,
061)
-
-
-
5
4,02
9,06
1 -
C
ontr
ibut
ed c
apita
l, ne
t
(55,
897,
246)
7
6,17
5,53
3
15,
161,
698
1
2,86
1,04
0
- 48
,301
,025
Cha
nges
in n
et p
osit
ion
18,0
32,2
86
57
,096
,446
(22,
929,
542)
(6
5,52
3,56
5)
-
(13,
324,
375)
Net
Pos
itio
n:B
egin
ning
of y
ear
172,
912,
378
14
6,55
5,69
9
158,
593,
006
1,
259,
448,
235
-
1,73
7,50
9,31
8
End
of y
ear
190,
944,
664
$
20
3,65
2,14
5$
135,
663,
464
$
1,
193,
924,
670
$
-$
1,72
4,18
4,94
3$
91
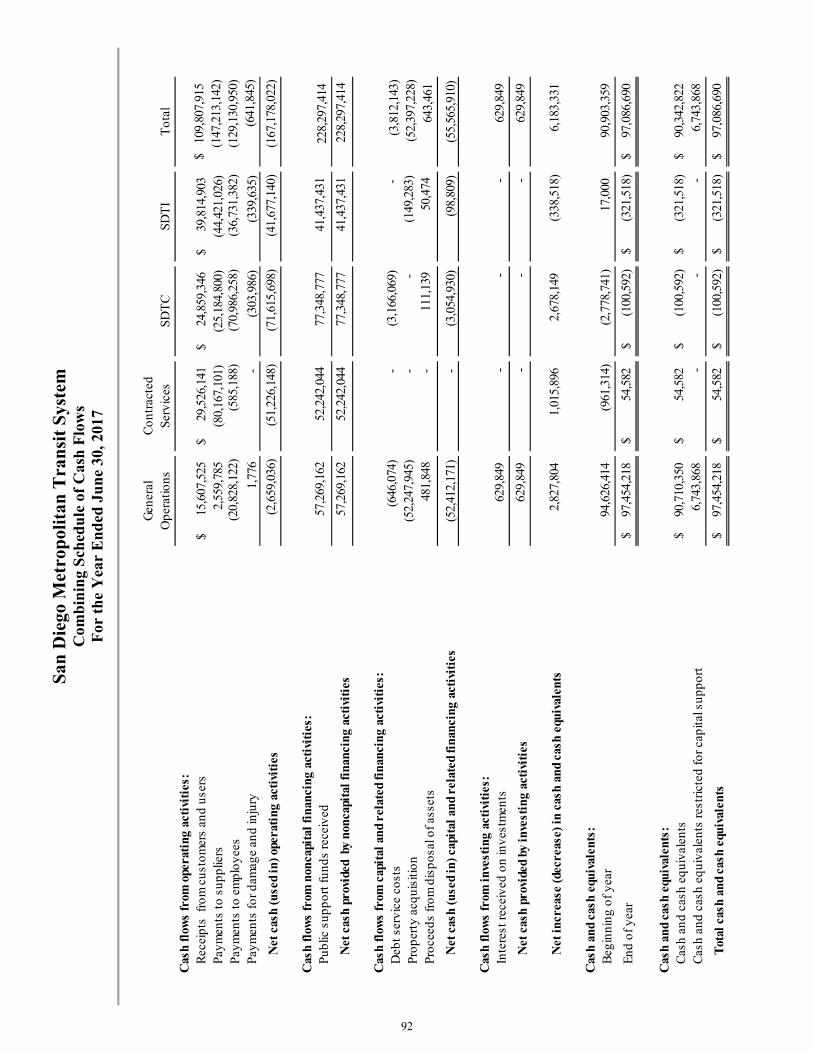
San
Die
go M
etro
pol
itan
Tra
nsi
t S
yste
m
Com
bin
ing
Sch
edu
le o
f C
ash
Flo
ws
For
th
e Y
ear
En
ded
Ju
ne
30, 2
017
G
ener
alC
ontr
acte
dO
pera
tions
Serv
ices
SDT
CSD
TI
Tot
a l
Cas
h fl
ows
from
ope
rati
ng a
ctiv
itie
s:R
ecei
pts
from
cus
tom
ers
and
user
s $
15,6
07,5
25
$
29
,526
,141
$
24,8
59,3
46
$
39
,814
,903
10
9,80
7,91
5$
Paym
ents
to s
uppl
iers
2
,559
,785
(8
0,16
7,10
1)
(2
5,18
4,80
0)
(4
4,42
1,02
6)(1
47,2
13,1
42)
Paym
ents
to e
mpl
oyee
s(2
0,82
8,12
2)
(5
85,1
88)
(70,
986,
258)
(36,
731,
382)
(129
,130
,950
)
Paym
ents
for d
amag
e an
d in
jury
1,77
6
-
(303
,986
)
(3
39,6
35)
(641
,845
)
Net
cas
h (u
sed
in) o
pera
ting
act
ivit
ies
(2,6
59,0
36)
(5
1,22
6,14
8)
(71,
615,
698)
(41,
677,
140)
(167
,178
,022
)
Cas
h fl
ows
from
non
capi
tal f
inan
cing
act
ivit
ies:
Publ
ic s
uppo
rt fu
nds
rece
ived
57,
269,
162
52,
242,
044
77,
348,
777
41,
437,
431
228,
297,
414
Net
cas
h pr
ovid
ed b
y no
ncap
ital
fina
ncin
g ac
tivi
ties
57,
269,
162
52,
242,
044
77,
348,
777
41,
437,
431
228,
297,
414
Cas
h fl
ows
from
cap
ital
and
rel
ated
fina
ncin
g ac
tivi
ties
:D
ebt s
ervi
ce c
osts
(
646,
074)
-
(
3,16
6,06
9)
-
(3,8
12,1
43)
Prop
erty
acq
uisi
tion
(52,
247,
945)
-
-
(
149,
283)
(52,
397,
228)
Proc
eeds
from
dis
posa
l of a
sset
s
4
81,8
48
-
1
11,1
39
50
,474
64
3,46
1
Net
cas
h (u
sed
in) c
apit
al a
nd r
elat
ed fi
nanc
ing
acti
viti
es
(5
2,41
2,17
1)
-
(3
,054
,930
)
(
98,8
09)
(55,
565,
910)
Cas
h fl
ows
from
inve
stin
g ac
tivi
ties
:In
tere
st re
ceiv
ed o
n in
vest
men
ts62
9,84
9
-
-
-
629,
849
Net
cas
h pr
ovid
ed b
y in
vest
ing
acti
viti
es62
9,84
9
-
-
-
629,
849
Net
incr
ease
(dec
reas
e) in
cas
h an
d ca
sh e
quiv
alen
ts2,
827,
804
1,
015,
896
2,67
8,14
9
(338
,518
)
6,
183,
331
Cas
h an
d ca
sh e
quiv
alen
ts:
Beg
inni
ng o
f yea
r94
,626
,414
(961
,314
)
(2
,778
,741
)
17,0
00
90,9
03,3
59
End
of y
ear
97,4
54,2
18$
54,5
82$
(100
,592
)$
(3
21,5
18)
$
97,0
86,6
9 0$
Cas
h an
d ca
sh e
quiv
alen
ts:
Cas
h an
d ca
sh e
quiv
alen
ts90
,710
,350
$
54
,582
$
(1
00,5
92)
$
(321
,518
)$
90
,342
,822
$
Cas
h an
d ca
sh e
quiv
alen
ts re
stric
ted
for c
apita
l sup
port
6,74
3,86
8
-
-
-
6,
743,
868
Tot
al c
ash
and
cash
equ
ival
ents
97,4
54,2
18$
54,5
82$
(100
,592
)$
(3
21,5
18)
$
97,0
86,6
9 0$
92

San
Die
go M
etro
pol
itan
Tra
nsi
t S
yste
m
Com
bin
ing
Sch
edu
le o
f C
ash
Flo
ws
(Con
tin
ued
) F
or t
he
Yea
r E
nd
ed J
un
e 30
, 201
7
Gen
eral
Con
trac
ted
Ope
ratio
nsSe
rvic
esSD
TC
SDT
IT
otal
Rec
onci
liat
ion
of O
pera
ting
Inc
ome
(Los
s) to
Net
Cas
h (U
sed
In) O
pera
ting
A
ctiv
itie
sO
pera
ting
(los
s):
$
2
,515
,824
$
(7
1,37
4,14
8) $
(10
5,41
5,92
1) $
(12
0,19
5,82
1)(2
94,4
70,0
66)
$
Adj
ustm
ents
to re
conc
ile o
pera
ting
inco
me
(loss
) to
net c
ash
(use
d in
) op
erat
ing
activ
ities
Dep
reci
atio
n an
d am
ortiz
atio
n
2,5
47,6
36
19
,079
,087
25,1
88,3
50
77
,064
,932
12
3,88
0,00
5
(Inc
reas
e) d
ecre
ase
in:
Acc
ount
s an
d ot
her r
ecei
vabl
es
(2,0
67,5
20)
7
6,91
0
(
14,5
88)
137
,735
(1
,867
,463
)
Due
from
oth
er g
over
nmen
ts
(1,8
50,4
42)
-
-
- (1
,850
,442
)
Inve
ntor
y
-
-
(5
67,1
07)
228
,257
(3
38,8
50)
Prep
aid
expe
nses
and
oth
er c
urre
nt a
sset
s
1
15,4
09
67
3
(
50,6
04)
(390
,039
)(3
24,5
61)
Incr
ease
(dec
reas
e) in
:A
ccou
nts
paya
ble
(3
,359
,029
)
9
77,5
82
176
,528
(
47,8
24)
(2,2
52,7
43)
Due
to o
ther
gov
ernm
ents
(385
,708
)
1,
657
3
2,46
6
(9
01)
(352
,486
)
A
ccru
ed e
xpen
ses
171
,827
12,
091
320
,985
90,
539
595,
442
U
near
ned
reve
nue
(277
,427
)
-
-
24,
859
(252
,568
)
A
ggre
gate
net
pen
sion
liab
ility
(407
,051
)
-
8
,971
,215
6
72,6
97
9,23
6,86
1
N
et o
ther
pos
tem
ploy
men
t ben
efits
obl
igat
ion
380
,667
-
262
,208
4
09,9
08
1,05
2,78
3
C
ompe
nsat
ed a
bsen
ces
paya
ble
2
8,31
3
-
(394
,498
)
1
71,9
43
(194
,242
)
A
ccru
ed d
amag
e, in
jury
and
em
ploy
ee c
laim
s
(
71,5
35)
-
(1
24,7
32)
156
,575
(3
9,69
2)
Tot
al a
djus
tmen
ts
(5,1
74,8
60)
20
,148
,000
33,8
00,2
23
78
,518
,681
1
27,2
92,0
44
Net
cas
h (u
sed
in) o
pera
ting
act
ivit
ies
(2,6
59,0
36)
$
(5
1,22
6,14
8)$
(71,
615,
698)
$
(4
1,67
7,14
0)$
(167
,178
,022
)$
Sup
plem
enta
l non
cash
dis
clos
ures
:D
urin
g th
e ye
ar S
AN
DA
G c
ontr
ibut
ed $
48,3
01,0
25 in
cap
ital a
sset
s D
urin
g th
e ye
ar th
e fa
ir va
lue
of in
vest
men
ts d
ecre
ased
by
$75,
253
93

San
Die
go M
etro
pol
itan
Tra
nsi
t S
yste
m
Com
bin
ed O
per
atio
ns
Sch
edu
le o
f R
even
ues
, Exp
ense
s an
d C
han
ges
in N
et P
osit
ion
– B
ud
get
and
Act
ual
F
or t
he
Yea
r E
nd
ed J
un
e 30
, 201
7
Act
uals
per
Stat
emen
t of
Rev
enue
s,Ex
pens
es, a
ndV
aria
nce
with
Cha
nges
inFi
nal B
udge
tN
et P
ositi
onB
udge
t Bas
isA
ctua
ls o
nPo
sitiv
eO
rigin
alFi
nal
Am
ount
sA
djus
tmen
tsB
udge
t Bas
is(N
egat
ive)
Ope
rati
ng r
even
ues:
Pass
enge
r rev
enue
100,
808,
623
$
94,8
73,8
38$
93,2
79,4
55$
-
$
93,2
79,4
55$
(1,5
94,3
83)
$
Adv
ertis
ing
750,
000
1,15
0,00
0
1,37
8,61
8
-
1,37
8,61
8
228,
618
Mis
cella
neou
s op
erat
ing
reve
nues
13,4
09,4
19
12
,760
,000
18,8
63,2
34
(6,1
72,4
40)
12
,690
,794
(69,
206)
Tot
al o
pera
ting
rev
enue
s11
4,96
8,04
2
10
8,78
3,83
8
11
3,52
1,30
7
(6,1
72,4
40)
10
7,34
8,86
7
(1
,434
,971
)
Ope
rati
ng e
xpen
ses:
Pers
onne
l cos
ts12
9,14
1,50
5
1
25,7
18,1
74
137,
020,
625
(1
2,08
8,34
6)12
4,93
2,27
9
78
5,89
5
Out
side
ser
vice
s96
,058
,528
96
,253
,904
97
,800
,332
-
97,8
00,3
32
(1
,546
,428
)
Tra
nsit
oper
atio
ns fu
ndin
g55
1,00
8
5
57,8
92
463,
345
-
463,
345
94,5
47
Mat
eria
ls a
nd s
uppl
ies
11,3
53,4
08
10,9
94,5
66
13,0
65,0
35
- 13
,065
,035
(2,0
70,4
69)
Ener
gy c
osts
27,6
84,9
50
26,4
13,3
61
25,5
52,1
78
- 25
,552
,178
861,
183
Ris
k m
anag
emen
t4,
039,
713
4,1
13,5
91
4,27
5,56
9
(3
53,4
56)
3,92
2,11
3
191,
478
Mis
cella
neou
s op
erat
ing
expe
nses
5,63
2,26
1
5
,719
,832
5,
934,
284
(186
,291
)5,
747,
993
(2
8,16
1)
Dep
reci
atio
n-
- 12
3,88
0,00
5
(
123,
880,
005)
-
-
Tot
al o
pera
ting
exp
ense
s27
4,46
1,37
3
26
9,77
1,32
0
40
7,99
1,37
3
(136
,508
,098
)
271,
483,
275
(1,7
11,9
55)
Ope
rati
ng in
com
e (l
oss)
(159
,493
,331
)
(160
,987
,482
)
(294
,470
,066
)
13
0,33
5,65
8
(1
64,1
34,4
08)
(3
,146
,926
)
Bud
gete
d A
mou
nts
Act
ual A
mou
nts
94

San
Die
go M
etro
pol
itan
Tra
nsi
t S
yste
m
Com
bin
ed O
per
atio
ns
Sch
edu
le o
f R
even
ues
, Exp
ense
s an
d C
han
ges
in N
et P
osit
ion
– B
ud
get
and
Act
ual
(C
onti
nue
d)
For
th
e Y
ear
En
ded
Ju
ne
30, 2
017
Act
uals
per
Stat
emen
t of
Rev
enue
s,Ex
pens
es, a
ndV
aria
nce
with
Cha
nges
inFi
nal B
udge
tN
et P
ositi
onB
udge
t Bas
isA
ctua
ls o
nPo
sitiv
eO
rigin
alFi
nal
Am
ount
sA
djus
tmen
tsB
udge
t Bas
is(N
egat
ive)
Pub
lic
supp
ort a
nd n
onop
erat
ing
reve
nues
(exp
ense
s):
Fede
ral r
even
ue
56,8
70,6
00
57
,063
,600
72
,404
,730
(
15,4
35,8
91)
56,9
68,8
39
(9
4,76
1)
Tra
nspo
rtat
ion
Dev
elop
men
t Act
(TD
A) f
unds
60
,030
,082
60,0
30,0
82
94,9
15,7
33
(33
,270
,680
)61
,645
,053
1,61
4,97
1
Stat
e T
rans
it A
ssis
tanc
e (S
TA
) fun
ds
3,6
00,0
00
3
,600
,000
12
,918
,834
(6,6
17,7
31)
6,30
1,10
3
2,70
1,10
3
Stat
e re
venu
e - o
ther
1
,400
,000
1,4
00,0
00
14,1
83,1
96
(10
,168
,320
)4,
014,
876
2,
614,
876
Tran
sNet
fun
ds
37,4
81,0
38
36
,335
,000
37
,270
,235
-
37
,270
,235
935,
235
Oth
er lo
cal s
ubsi
dies
1
,674
,102
1,0
34,1
02
1,08
2,69
7
(
19,2
74)
1,06
3,42
3
29,3
21
Inve
stm
ent e
arni
ngs
100
,000
3
50,0
00
636,
068
(
52,8
46)
583,
222
233,
222
Inte
rest
exp
ense
(1
,687
,501
)
(1,7
04,4
07)
(962
,775
)
(737
,911
)(1
,700
,686
)
3,72
1
Gai
n (lo
ss) o
n di
spos
al o
f ass
ets
-
200
,000
39
5,94
8
247
,513
64
3,46
1
44
3,46
1
Tot
al p
ubli
c su
ppor
t and
non
oper
atin
g re
venu
es
(exp
ense
s):
159,
468,
321
158,
308,
377
232,
844,
666
(6
6,05
5,14
0)
166,
789,
526
8,48
1,14
9
Inco
me
(los
s) b
efor
e co
ntri
bute
d ca
pita
l(2
5,01
0)
(2
,679
,105
)
(61,
625,
400)
64
,280
,518
2,65
5,11
8
5,33
4,22
3
Res
erve
reve
nue
25,0
1 0
2,67
9,10
5
-
2,59
6,12
1
2,59
6,12
1
(82,
984)
Con
trib
uted
cap
ital,
net
-
-
48,3
01,0
25
(4
8,30
1,02
5)
-
-
Cha
nges
in n
et p
osit
ion
-$
-$
(13,
324,
375)
18
,575
,614
$
5,
251,
239
$
5,25
1,23
9$
Net
Pos
itio
n:B
egin
ning
of y
ear
1,73
7,50
9,31
8
End
of y
ear
1,72
4,18
4,94
3$
Bud
gete
d A
mou
nts
Act
ual A
mou
nts
95

San
Die
go M
etro
pol
itan
Tra
nsi
t S
yste
m
Gen
eral
Ope
rati
ons
Sch
edu
le o
f R
even
ues
, Exp
ense
s an
d C
han
ges
in N
et P
osit
ion
– B
ud
get
and
Act
ual
F
or t
he
Yea
r E
nd
ed J
un
e 30
, 201
7
Act
uals
per
Stat
emen
t of
Rev
enue
s,Ex
pens
es, a
ndV
aria
nce
with
Cha
nges
inFi
nal B
udge
tN
et P
ositi
onB
udge
t Bas
isA
ctua
ls o
nPo
sitiv
eO
rigin
alFi
nal
Am
ount
sA
djus
tmen
tsB
udge
t Bas
is(N
egat
ive)
Ope
rati
ng r
even
ues:
Adv
ertis
ing
750,
000
$
1,15
0,00
0$
1,37
8,61
8$
-
$
1,37
8,61
8$
228,
618
$
Mis
cella
neou
s op
erat
ing
reve
nues
11,1
79,4
19
11
,054
,000
16,2
38,8
49
(5,1
72,4
40)
11
,066
,409
12,4
09
Tot
al o
pera
ting
rev
enue
s11
,929
,419
12,2
04,0
00
17
,617
,467
(5
,172
,440
)
12,4
45,0
27
24
1,02
7
Ope
rati
ng e
xpen
ses:
Pers
onne
l cos
ts19
,242
,569
18
,478
,126
18,
832,
869
(151
,313
)18
,681
,556
(203
,430
)
Out
side
ser
vice
s16
,006
,056
16
,239
,567
16,
373,
792
- 16
,373
,792
(134
,225
)
Tra
nsit
oper
atio
ns fu
ndin
g55
1,00
8
5
57,8
92
11
4,16
3,79
4
(11
3,70
0,44
8)46
3,34
6
94
,546
Mat
eria
ls a
nd s
uppl
ies
24,0
00
(128
,200
)
25
,072
-
25,0
72
(153
,272
)
Ener
gy c
osts
227,
700
183
,500
188
,778
-
188,
778
(5,2
78)
Ris
k m
anag
emen
t45
0,65
6
3
94,3
89
3
99,9
82
(71
,535
)32
8,44
7
65
,942
Mis
cella
neou
s op
erat
ing
expe
nses
(24,
521,
179)
(23,
012,
909)
(2
3,32
5,95
2)
-
(23,
325,
952)
313,
043
Dep
reci
atio
n-
-
2
,525
,774
(2,5
25,7
74)
-
-
Tot
al o
pera
ting
exp
ense
s11
,980
,810
12,7
12,3
65
12
9,18
4,10
9
(116
,449
,070
)
12,7
35,0
39
(2
2,67
4)
Ope
rati
ng in
com
e (l
oss)
(51,
391)
(508
,365
)
(1
11,5
66,6
42)
111,
276,
630
(290
,012
)
21
8,35
3
Bud
gete
d A
mou
nts
Act
ual A
mou
nts
96

San
Die
go M
etro
pol
itan
Tra
nsi
t S
yste
m
Gen
eral
Ope
rati
ons
Sch
edu
le o
f R
even
ues
, Exp
ense
s an
d C
han
ges
in N
et P
osit
ion
– B
ud
get
and
Act
ual
(C
onti
nue
d)
For
th
e Y
ear
En
ded
Ju
ne
30, 2
017
Act
uals
per
Stat
emen
t of
Rev
enue
s,Ex
pens
es, a
ndV
aria
nce
with
Cha
nges
inFi
nal B
udge
tN
et P
ositi
onB
udge
t Bas
isA
ctua
ls o
nPo
sitiv
eO
rigin
alFi
nal
Am
ount
sA
djus
tmen
tsB
udge
t Bas
is(N
egat
ive)
Pub
lic
supp
ort a
nd n
onop
erat
ing
reve
nues
(exp
ense
s):
Fede
ral r
even
ue
-
140
,000
72,
404,
730
(72,
273,
558)
131,
172
(8,8
28)
Tra
nspo
rtat
ion
Dev
elop
men
t Act
(TD
A) f
unds
551
,008
5
57,8
92
9
4,91
5,73
3
(8
9,38
7,57
3)5,
528,
160
4,
970,
268
Stat
e T
rans
it A
ssis
tanc
e (S
TA
) fun
ds
-
-
12,
918,
834
(12,
918,
834)
-
-
Stat
e re
venu
e - o
ther
-
-
1
4,18
3,19
6
(1
4,62
2,21
6)(4
39,0
20)
(439
,020
)
Tran
sNet
fund
s
-
-
42,
770,
235
(42,
770,
235)
-
-
Oth
er lo
cal s
ubsi
dies
140
,000
-
1,0
82,6
97
(1
,082
,697
)-
-
Inve
stm
ent e
arni
ngs
100
,000
3
50,0
00
6
31,5
55
(52
,846
)57
8,70
9
22
8,70
9
Inte
rest
exp
ense
(739
,617
)
(7
39,5
27)
(1,7
06)
(737
,911
)(7
39,6
17)
(90)
Gai
n (lo
ss) o
n di
spos
al o
f ass
ets
-
2
00,0
00
2
37,9
44
243
,904
48
1,84
8
28
1,84
8
Tot
al p
ubli
c su
ppor
t and
non
oper
atin
g re
venu
es
(exp
ense
s):
51,3
91
508,
365
23
9,14
3,21
8
(233
,601
,966
)
5,
541,
252
5,03
2,88
7
Inco
me
(los
s) b
efor
e tr
ansf
ers
and
cont
ribu
ted
capi
tal
-
-
127,
576,
576
(1
22,3
25,3
36)
5,
251,
240
5,
251,
240
Tra
nsfe
rs-
-
(5
4,02
9,06
1)
54,0
29,0
61
-
-
Con
trib
uted
cap
ital,
net
-
-
(54,
897,
246)
54
,897
,246
-
-
Cha
nges
in n
et p
osit
ion
-$
-$
18,6
50,2
69
(1
3,39
9,02
9)$
5,25
1,24
0$
5,
251,
240
$
Net
Pos
itio
n:B
egin
ning
of y
ear
152,
884,
529
End
of y
ear
171,
534,
798
$
Bud
gete
d A
mou
nts
Act
ual A
mou
nts
97

San
Die
go M
etro
pol
itan
Tra
nsi
t S
yste
m
Tax
icab
Ad
min
istr
atio
n
Sch
edu
le o
f R
even
ues
, Exp
ense
s an
d C
han
ges
in N
et P
osit
ion
– B
ud
get
and
Act
ual
F
or t
he
Yea
r E
nd
ed J
un
e 30
, 201
7
Act
uals
per
Stat
emen
t of
Rev
enue
s,Ex
pens
es, a
ndV
aria
nce
with
Cha
nges
inFi
nal B
udge
tN
et P
ositi
onB
udge
t Bas
isA
ctua
ls o
nPo
sitiv
eO
rigin
alFi
nal
Am
ount
sA
djus
tmen
tsB
udge
t Bas
is(N
egat
ive)
Ope
rati
ng r
even
ues:
Mis
cella
neou
s op
erat
ing
reve
nues
1,39
0,00
0$
850,
000
$
700,
525
$
-
$
700,
525
$
(149
,475
)$
Tot
al o
pera
ting
rev
enue
s1,
390,
000
85
0,00
0
70
0,52
5
-
70
0,52
5
(1
49,4
75)
Ope
rati
ng e
xpen
ses:
Pers
onne
l cos
ts97
6,87
5
9
32,9
50
878
,659
-
878,
659
54,2
91
Out
side
ser
vice
s10
1,11
0
83,
110
5
3,67
2
-
53,6
72
29,4
38
Mat
eria
ls a
nd s
uppl
ies
7,00
0
7,00
0
2,
614
- 2,
614
4,
386
Ener
gy c
osts
15,0
00
1
1,00
0
4,
897
- 4,
897
6,
103
Ris
k m
anag
emen
t-
3
0,00
0
5,
064
- 5,
064
24
,936
Mis
cella
neou
s op
erat
ing
expe
nses
286,
614
274
,045
2
75,4
57
- 27
5,45
7
(1
,412
)
Dep
reci
atio
n-
-
4,
774
(4
,774
)-
-
Tot
al o
pera
ting
exp
ense
s1,
386,
599
1,
338,
105
1,
225,
137
(4,7
74)
1,
220,
363
11
7,74
2
Ope
rati
ng in
com
e (l
oss)
3,40
1
(488
,105
)
(5
24,6
12)
4,77
4
(519
,838
)
(3
1,73
3)
Res
erve
reve
nue
(3,4
01)
48
8,10
5
-
519,
838
519,
838
31,7
33
Cha
nges
in n
et p
osit
ion
-$
-$
(524
,612
)
52
4,61
2$
-$
-$
Net
Pos
itio
n:B
egin
ning
of y
ear
1,02
4,47
2
End
of y
ear
499,
860
$
Bud
gete
d A
mou
nts
Act
ual A
mou
nts
98
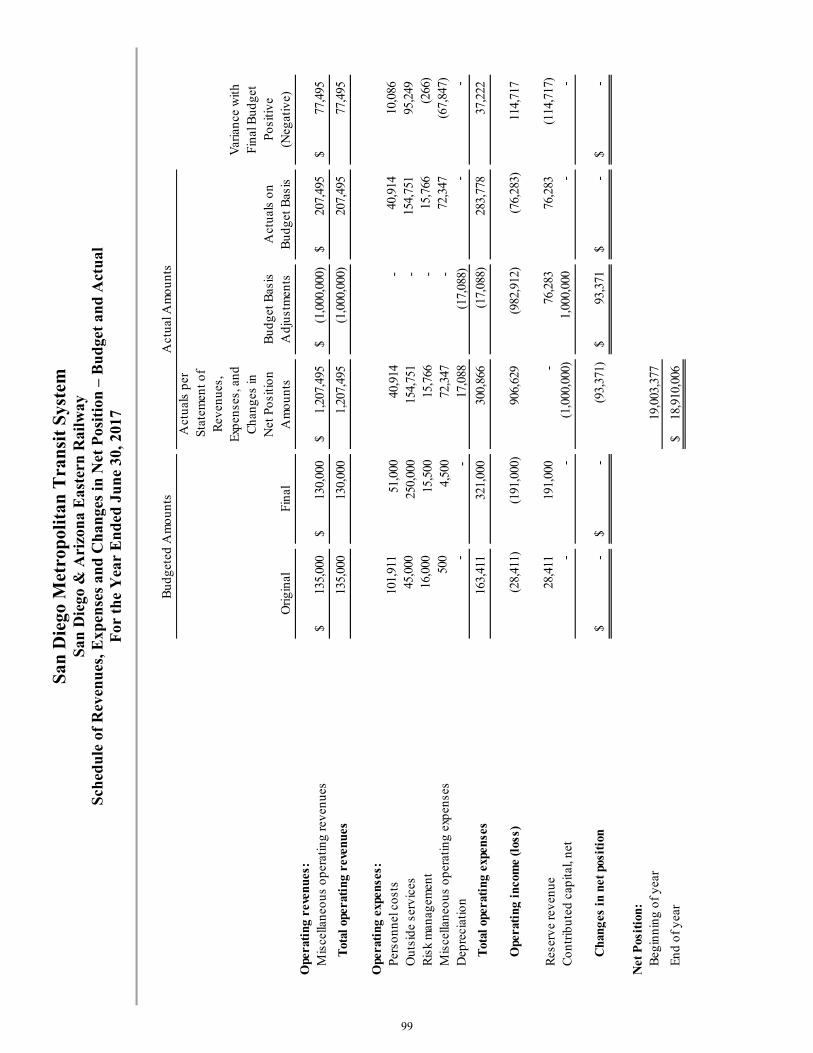
San
Die
go M
etro
pol
itan
Tra
nsi
t S
yste
m
San
Die
go &
Ari
zon
a E
aste
rn R
ailw
ay
Sch
edu
le o
f R
even
ues
, Exp
ense
s an
d C
han
ges
in N
et P
osit
ion
– B
ud
get
and
Act
ual
F
or t
he
Yea
r E
nd
ed J
un
e 30
, 201
7
Act
uals
per
Stat
emen
t of
Rev
enue
s,Ex
pens
es, a
ndV
aria
nce
with
Cha
nges
inFi
nal B
udge
tN
et P
ositi
onB
udge
t Bas
isA
ctua
ls o
nPo
sitiv
eO
rigin
alFi
nal
Am
ount
sA
djus
tmen
tsB
udge
t Bas
is(N
egat
ive)
Ope
rati
ng r
even
ues:
Mis
cella
neou
s op
erat
ing
reve
nues
135,
000
$
130,
000
$
1,20
7,49
5$
(1
,000
,000
)$
207,
495
$
77,4
95$
Tot
al o
pera
ting
rev
enue
s13
5,00
0
13
0,00
0
1,
207,
495
(1,0
00,0
00)
20
7,49
5
77
,495
Ope
rati
ng e
xpen
ses:
Pers
onne
l cos
ts10
1,91
1
51,
000
4
0,91
4
-
40,9
14
10,0
86
Out
side
ser
vice
s45
,000
2
50,0
00
154
,751
-
154,
751
95,2
49
Ris
k m
anag
emen
t16
,000
15,
500
1
5,76
6
-
15,7
66
(266
)
Mis
cella
neou
s op
erat
ing
expe
nses
500
4,50
0
72,
347
- 72
,347
(6
7,84
7)
Dep
reci
atio
n-
-
17,
088
(17
,088
)-
-
Tot
al o
pera
ting
exp
ense
s16
3,41
1
32
1,00
0
30
0,86
6
(17,
088)
283,
778
37,2
22
Ope
rati
ng in
com
e (l
oss)
(28,
411)
(191
,000
)
90
6,62
9
(982
,912
)
(7
6,28
3)
11
4,71
7
Res
erve
reve
nue
28,4
11
191,
000
-
76
,283
76
,283
(1
14,7
17)
Con
trib
uted
cap
ital,
net
-
-
(1,0
00,0
00)
1,
000,
000
-
-
Cha
n ges
in n
et p
osit
ion
-$
-
$
(93,
371)
93
,371
$
-
$
-$
Net
Pos
itio
n:B
egin
ning
of y
ear
19,0
03,3
77
End
of y
ear
18,9
10,0
06$
Bud
gete
d A
mou
nts
Act
ual A
mou
nts
99

San
Die
go M
etro
pol
itan
Tra
nsi
t S
yste
m
Con
trac
ted
Ser
vice
s S
ched
ule
of
Rev
enu
es, E
xpen
ses
and
Ch
ange
s in
Net
Pos
itio
n –
Bu
dge
t an
d A
ctu
al
For
th
e Y
ear
En
ded
Ju
ne
30, 2
017
Act
uals
per
Stat
emen
t of
Rev
enue
s,Ex
pens
es, a
ndV
aria
nce
with
Cha
nges
inFi
nal B
udge
tN
et P
ositi
onB
udge
t Bas
isA
ctua
ls o
nPo
sitiv
eO
rigin
alFi
nal
Am
ount
sA
djus
tmen
tsB
udge
t Bas
is(N
egat
ive)
Ope
rati
ng r
even
ues:
Pass
enge
r rev
enue
31,9
94,5
09$
30,1
55,0
0 0$
29,4
47,3
04$
-$
29
,447
,304
$
(7
07,6
96)
$
Mis
cella
neou
s op
erat
ing
reve
nues
-
1,
000
1,
927
-
1,
927
92
7
Tot
al o
pera
ting
rev
enue
s31
,994
,509
30,1
56,0
0 0
29
,449
,231
-
29,4
49,2
31
(7
06,7
69)
Ope
rati
ng e
xpen
ses:
Pers
onne
l cos
ts70
1,55
9
4
97,1
85
572
,972
-
572,
972
(75,
787)
Out
side
ser
vice
s72
,330
,190
72
,213
,322
70,8
69,3
12
- 70
,869
,312
1,34
4,01
0
Mat
eria
ls a
nd s
uppl
ies
49,2
00
3
0,50
0
14,
489
- 14
,489
16
,011
Ener
gy c
osts
8,26
9,94
6
8
,043
,861
7,9
84,3
52
- 7,
984,
352
59
,509
Ris
k m
anag
emen
t15
,300
15,
300
1
5,30
0
-
15,3
00
-
Mis
cella
neou
s op
erat
ing
expe
nses
2,58
1,32
5
2
,157
,501
2,2
87,8
67
- 2,
287,
867
(1
30,3
66)
Dep
reci
atio
n-
-
19,0
79,0
87
(19,
079,
087)
-
-
Tot
al o
pera
ting
exp
ense
s83
,947
,520
82,9
57,6
69
10
0,82
3,37
9
(1
9,07
9,08
7)
81
,744
,292
1,21
3,37
7
Ope
rati
ng in
com
e (l
oss)
(51,
953,
011)
(52,
801,
669)
(71,
374,
148)
19
,079
,087
(52,
295,
061)
506,
608
Bud
gete
d A
mou
nts
Act
ual A
mou
nts
100

San
Die
go M
etro
pol
itan
Tra
nsi
t S
yste
m
Con
trac
ted
Ser
vice
s S
ched
ule
of
Rev
enu
es, E
xpen
ses
and
Ch
ange
s in
Net
Pos
itio
n –
Bu
dge
t an
d A
ctu
al (
Con
tin
ued
) F
or t
he
Yea
r E
nd
ed J
un
e 30
, 201
7
Act
uals
per
Stat
emen
t of
Rev
enue
s,Ex
pens
es, a
ndV
aria
nce
with
Cha
nges
inFi
nal B
udge
tN
et P
ositi
onB
udge
t Bas
isA
ctua
ls o
nPo
sitiv
eO
rigin
alFi
nal
Am
ount
sA
djus
tmen
tsB
udge
t Bas
is(N
egat
ive)
Pub
lic
supp
ort a
nd n
onop
erat
ing
reve
nues
(exp
ense
s):
Fede
ral r
even
ue
13,8
70,6
00
13
,923
,600
13,8
37,6
67
- 13
,837
,667
(85,
933)
Tra
nspo
rtat
ion
Dev
elop
men
t Act
(TD
A) f
unds
33
,955
,442
35,1
91,9
67
32
,484
,980
-
32,4
84,9
80
(2
,706
,987
)
Stat
e re
venu
e - o
ther
1
,400
,000
1,4
00,0
00
3
,676
,560
-
3,67
6,56
0
2,27
6,56
0
Tran
sNet
fun
ds
2,0
07,8
67
1
,567
,000
1,5
47,4
31
- 1,
547,
431
(1
9,56
9)
Oth
er lo
cal s
ubsi
dies
719
,102
7
19,1
02
748
,423
-
748,
423
29,3
21
Tot
al p
ubli
c su
ppor
t and
non
oper
atin
g re
venu
es
(exp
ense
s):
51,9
53,0
11
52,8
01,6
69
52,2
95,0
61
-
52,2
95,0
61
(506
,608
)
Inco
me
(los
s) b
efor
e co
ntri
bute
d ca
pita
l-
-
(1
9,07
9,08
7)
19,0
79,0
87
-
-
Con
trib
uted
cap
ital,
net
-
-
76,1
75,5
33
(76,
175,
533)
-
-
Cha
nges
in n
et p
osit
ion
-$
-$
57,0
96,4
46
(57,
096,
446)
$
-
$
-
$
Net
Pos
itio
n:B
egin
ning
of y
ear
146,
555,
699
End
of y
ear
203,
652,
145
$
Bud
gete
d A
mou
nts
Act
ual A
mou
nts
101

San
Die
go M
etro
pol
itan
Tra
nsi
t S
yste
m
San
Die
go T
ran
sit
Cor
por
atio
n S
ched
ule
of
Rev
enu
es, E
xpen
ses
and
Ch
ange
s in
Net
Pos
itio
n –
Bu
dge
t an
d A
ctu
al
For
th
e Y
ear
En
ded
Ju
ne
30, 2
017
Act
uals
per
Stat
emen
t of
Rev
enue
s,Ex
pens
es, a
ndV
aria
nce
with
Cha
nges
inFi
nal B
udge
tN
et P
ositi
onB
udge
t Bas
isA
ctua
ls o
nPo
sitiv
eO
rigin
alFi
nal
Am
ount
sA
djus
tmen
tsB
udge
t Bas
is(N
egat
ive)
Ope
rati
ng r
even
ues:
Pass
enge
r rev
enue
26,7
42,0
66$
24,0
52,4
00$
24,8
63,7
42$
-$
24
,863
,742
$
81
1,34
2$
Mis
cella
neou
s op
erat
ing
reve
nues
5,00
0
5,00
0
10,1
92
-
10
,192
5,
192
Tot
al o
pera
ting
rev
enue
s26
,747
,066
24,0
57,4
00
24
,873
,934
-
24,8
73,9
34
81
6,53
4
Ope
rati
ng e
xpen
ses:
Pers
onne
l cos
ts73
,332
,540
70
,749
,017
80
,157
,201
(1
0,69
6,40
2)69
,460
,799
1,28
8,21
8
Out
side
ser
vice
s1,
701,
450
2,4
67,9
29
3,31
1,00
4
-
3,31
1,00
4
(843
,075
)
Mat
eria
ls a
nd s
uppl
ies
4,36
2,10
7
4
,459
,318
4,
541,
138
- 4,
541,
138
(8
1,82
0)
Ener
gy c
osts
6,19
0,40
4
5
,957
,000
5,
738,
303
- 5,
738,
303
21
8,69
7
Ris
k m
anag
emen
t1,
751,
738
1,8
30,0
27
2,15
7,06
3
(2
05,0
73)
1,95
1,99
0
(121
,963
)
Mis
cella
neou
s op
erat
ing
expe
nses
10,5
40,0
42
9,2
51,7
21
9,19
6,79
6
-
9,19
6,79
6
54,9
25
Dep
reci
atio
n-
- 25
,188
,350
(2
5,18
8,35
0)-
-
Tot
al o
pera
ting
exp
ense
s97
,878
,281
94,7
15,0
12
13
0,28
9,85
5
(3
6,08
9,82
5)
94
,200
,030
514,
982
Ope
rati
ng in
com
e (l
oss)
(71,
131,
215)
(70,
657,
612)
(105
,415
,921
)
36
,089
,825
(69,
326,
096)
1,33
1,51
6
Bud
gete
d A
mou
nts
Act
ual A
mou
nts
102

San
Die
go M
etro
pol
itan
Tra
nsi
t S
yste
m
San
Die
go T
ran
sit
Cor
por
atio
n S
ched
ule
of
Rev
enu
es, E
xpen
ses
and
Ch
ange
s in
Net
Pos
itio
n –
Bu
dge
t an
d A
ctu
al (
Con
tin
ued
) F
or t
he
Yea
r E
nd
ed J
un
e 30
, 201
7
Act
uals
per
Stat
emen
t of
Rev
enue
s,Ex
pens
es, a
ndV
aria
nce
with
Cha
nges
inFi
nal B
udge
tN
et P
ositi
onB
udge
t Bas
isA
ctua
ls o
nPo
sitiv
eO
rigin
alFi
nal
Am
ount
sA
djus
tmen
tsB
udge
t Bas
is(N
egat
ive)
Pub
lic
supp
ort a
nd n
onop
erat
ing
reve
nues
(exp
ense
s):
Fede
ral r
even
ue
20,0
00,0
00
20
,000
,000
20
,000
,00 0
-
20,0
00,0
00
-
Tra
nspo
rtat
ion
Dev
elop
men
t Act
(TD
A) f
unds
17
,190
,928
15,9
39,4
92
13,3
65,5
36
- 13
,365
,536
(2,5
73,9
56)
Stat
e T
rans
it A
ssis
tanc
e (S
TA
) fun
ds
3,6
00,0
00
3
,600
,000
3,
600,
956
- 3,
600,
956
95
6
Stat
e re
venu
e - o
ther
-
-
171,
729
-
171,
729
171,
729
Tran
sNet
fund
s
30,4
73,1
71
29
,768
,000
30
,722
,805
-
30,7
22,8
05
95
4,80
5
Oth
er lo
cal s
ubsi
dies
815
,000
3
15,0
00
315,
000
-
315,
000
-
Inte
rest
exp
ense
(947
,884
)
(9
64,8
80)
(961
,069
)
-
(961
,069
)
3,
811
Gai
n (lo
ss) o
n di
spos
al o
f ass
ets
-
-
109,
724
1,
415
111,
139
111,
139
Tot
al p
ubli
c su
ppor
t and
non
oper
atin
g re
venu
es
(exp
ense
s):
71,1
31,2
15
68,6
57,6
12
67,3
24,6
81
1,41
5
67
,326
,096
(1
,331
,516
)
Inco
me
(los
s) b
efor
e co
ntri
bute
d ca
pita
l-
(2,0
00,0
00)
(3
8,09
1,24
0)
36,0
91,2
40
(2
,000
,000
)
-
Res
erve
reve
nue
-
2,
000,
000
-
2,00
0,00
0
2,00
0,00
0
-
Con
trib
uted
cap
ital,
net
-
-
15,1
61,6
98
(15,
161,
698)
-
-
Cha
nges
in n
et p
osit
ion
-$
-$
(22,
929,
542)
22
,929
,542
$
-
$
-
$
Net
Pos
itio
n:B
egin
ning
of y
ear
158,
593,
006
End
of y
ear
135,
663,
464
$
Bud
gete
d A
mou
nts
Act
ual A
mou
nts
103
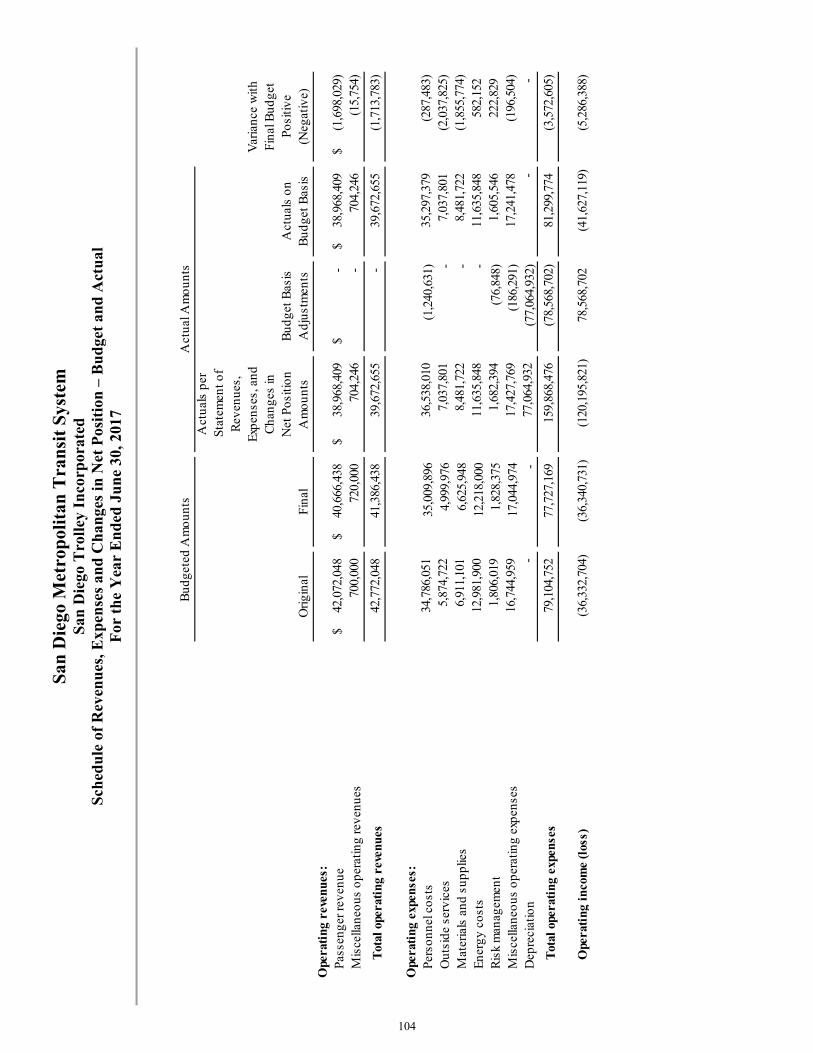
San
Die
go M
etro
pol
itan
Tra
nsi
t S
yste
m
San
Die
go T
roll
ey I
nco
rpor
ated
S
ched
ule
of
Rev
enu
es, E
xpen
ses
and
Ch
ange
s in
Net
Pos
itio
n –
Bu
dge
t an
d A
ctu
al
For
th
e Y
ear
En
ded
Ju
ne
30, 2
017
Act
uals
per
Stat
emen
t of
Rev
enue
s,Ex
pens
es, a
ndV
aria
nce
with
Cha
nges
inFi
nal B
udge
tN
et P
ositi
onB
udge
t Bas
isA
ctua
ls o
nPo
sitiv
eO
rigin
alFi
nal
Am
ount
sA
djus
tmen
tsB
udge
t Bas
is(N
egat
ive)
Ope
rati
ng r
even
ues:
Pass
enge
r rev
enue
42,0
72,0
48$
40,6
66,4
38$
38,9
68,4
09$
-
$
38,9
68,4
09$
(1,6
98,0
29)
$
Mis
cella
neou
s op
erat
ing
reve
nues
700,
000
720,
000
704,
246
-
704,
246
(15,
754)
Tot
al o
pera
ting
rev
enue
s42
,772
,048
41,3
86,4
38
39
,672
,655
-
39,6
72,6
55
(1
,713
,783
)
Ope
rati
ng e
xpen
ses:
Pers
onne
l cos
ts34
,786
,051
35
,009
,896
36
,538
,010
(1,2
40,6
31)
35,2
97,3
79
(2
87,4
83)
Out
side
ser
vice
s5,
874,
722
4,9
99,9
76
7,03
7,80
1
-
7,03
7,80
1
(2,0
37,8
25)
Mat
eria
ls a
nd s
uppl
ies
6,91
1,10
1
6
,625
,948
8,
481,
722
- 8,
481,
722
(1
,855
,774
)
Ener
gy c
osts
12,9
81,9
00
12,2
18,0
00
11,6
35,8
48
- 11
,635
,848
582,
152
Ris
k m
anag
emen
t1,
806,
019
1,8
28,3
75
1,68
2,39
4
(
76,8
48)
1,60
5,54
6
222,
829
Mis
cella
neou
s op
erat
ing
expe
nses
16,7
44,9
59
17,0
44,9
74
17,4
27,7
69
(186
,291
)17
,241
,478
(196
,504
)
Dep
reci
atio
n-
- 77
,064
,932
(7
7,06
4,93
2)-
-
Tot
al o
pera
ting
exp
ense
s79
,104
,752
77,7
27,1
69
15
9,86
8,47
6
(78,
568,
702)
81,2
99,7
74
(3
,572
,605
)
Ope
rati
ng in
com
e (l
oss)
(36,
332,
704)
(36,
340,
731)
(120
,195
,821
)
78
,568
,702
(41,
627,
119)
(5,2
86,3
88)
Bud
gete
d A
mou
nts
Act
ual A
mou
nts
104

San
Die
go M
etro
pol
itan
Tra
nsi
t S
yste
m
San
Die
go T
roll
ey I
nco
rpor
ated
S
ched
ule
of
Rev
enu
es, E
xpen
ses
and
Ch
ange
s in
Net
Pos
itio
n –
Bu
dge
t an
d A
ctu
al (
Con
tin
ued
) F
or t
he
Yea
r E
nd
ed J
un
e 30
, 201
7
Act
uals
per
Stat
emen
t of
Rev
enue
s,Ex
pens
es, a
ndV
aria
nce
with
Cha
nges
inFi
nal B
udge
tN
et P
ositi
onB
udge
t Bas
isA
ctua
ls o
nPo
sitiv
eO
rigin
alFi
nal
Am
ount
sA
djus
tmen
tsB
udge
t Bas
is(N
egat
ive)
Pub
lic
supp
ort a
nd n
onop
erat
ing
reve
nues
(exp
ense
s):
Fede
ral r
even
ue
23,0
00,0
00
23
,000
,000
23
,149
,033
(1
49,0
33)
23,0
00,0
00
-
Tra
nspo
rtat
ion
Dev
elop
men
t Act
(TD
A) f
unds
8
,332
,704
8,3
40,7
31
10,3
03,6
35
(37
,258
)10
,266
,377
1,92
5,64
6
Stat
e T
rans
it A
ssis
tanc
e (S
TA
) fun
ds
-
-
2,
700,
147
-
2,70
0,14
7
2,70
0,14
7
Stat
e re
venu
e - o
ther
-
-
605,
608
-
60
5,60
8
60
5,60
8
Tran
sNet
fun
ds
5,0
00,0
00
5
,000
,000
5,
000,
000
-
5,00
0,00
0
-
Inve
stm
ent e
arni
ngs
-
-
4,51
3
-
4,51
3
4,
513
Gai
n (lo
ss) o
n di
spos
al o
f ass
ets
-
-
48,2
80
2,19
4 50
,474
50
,474
Tot
al p
ubli
c su
ppor
t and
non
oper
atin
g re
venu
es
(exp
ense
s):
36,3
32,7
04
36,3
40,7
31
41,8
11,2
16
(1
84,0
97)
41,6
27,1
19
5,28
6,38
8
Inco
me
(los
s) b
efor
e co
ntri
bute
d ca
pita
l-
-
(7
8,38
4,60
5)
78,3
84,6
05
-
-
Con
trib
uted
cap
ital,
net
-
-
12,8
61,0
40
(1
2,86
1,04
0)
-
-
Cha
nges
in n
et p
osit
ion
-$
-$
(65,
523,
565)
65
,523
,565
$
-
$
-
$
Net
Pos
itio
n:B
egin
ning
of y
ear
1,25
9,44
8,23
5
End
of y
ear
1,19
3,92
4,67
0$
Bud
gete
d A
mou
nts
Act
ual A
mou
nts
105

106
This page intentionally left blank.

107
STATISTICAL SECTION (Unaudited)
Included in this section of the Metropolitan Transit System comprehensive annual financial report is detailed information to assist in analysis and understanding of the information presented in the financial statements, notes and required supplementary information.
Contents
Financial trends These schedules contain trend information to help the reader understand how MTS's financial position has changed over time. Revenue Capacity These schedules contain detailed information about the fare structures and revenue generated from transit operations provided by MTS. Debt Capacity This schedule presents information to help the reader assess the affordability of MTS's current levels of outstanding debt and MTS's ability to issue debt in the future. Demographic and Economic Information These schedules provide service and infrastructure data to help the reader understand how the information in MTS's financial report relates to the services MTS provides. Operating Information These schedules provide service and infrastructure data to help the reader understand how the information in MTS's financial report relates to the services MTS provides.

108
FINANCIAL TRENDS

San
Die
go M
etro
pol
itan
Tra
nsi
t S
yste
m
Net
Pos
itio
n b
y C
omp
onen
t (‘
000s
) L
ast
Ten
Fis
cal Y
ears
2017
2016
2015
2014
2013
2012
2011
2010
2009
2008
Bu
sin
ess-
type
act
ivit
ies:
Net
inve
stm
ent
in c
apit
al a
sset
s $
1,7
39,3
60
$ 1
,760
,427
$
1,6
99,2
22
$ 1
,395
,206
$
1,2
96,2
17
$ 1
,172
,816
$
1,0
73,5
62
$ 1
,078
,178
$
1,0
75,1
05
$ 1
,079
,967
R
estr
icte
d
4,4
40
8
,750
5,3
09
6
,742
7,2
55
78
,378
7,0
07
2
,548
2,7
00
- U
nres
tric
ted
(19
,615
)
(
31,6
68)
(31
,900
)
1
81,1
14
189
,837
1
57,6
09
173
,128
1
77,1
58
172
,344
1
85,6
10
Tot
al b
usi
nes
s-ty
pe a
ctiv
itie
s n
et
posi
tion
$ 1
,724
,185
$
1,7
37,5
09
$ 1
,672
,631
$
1,5
83,0
62
$ 1
,493
,309
$
1,4
08,8
03
$ 1
,253
,697
$
1,2
57,8
84
$ 1
,250
,149
$
1,2
65,5
77
Pri
mar
y go
vern
men
t:N
et in
vest
men
t in
cap
ital
ass
ets
$ 1
,739
,360
$
1,7
60,4
27
$ 1
,699
,222
$
1,3
95,2
06
$ 1
,296
,217
$
1,1
72,8
16
$ 1
,073
,562
$
1,0
78,1
78
$ 1
,075
,105
$
1,0
79,9
67
Res
tric
ted
4
,440
8,7
50
5
,309
6,7
42
7
,255
78,3
78
7
,007
2,5
48
2
,700
-
Unr
estr
icte
d
(
19,6
15)
(31
,668
)
(
31,9
00)
181
,114
1
89,8
37
157
,609
1
73,1
28
177
,158
1
72,3
44
185
,610
Tot
al p
rim
ary
gove
rnm
ent
net
po
siti
on $
1,7
24,1
85
$ 1
,737
,509
$
1,6
72,6
31
$ 1
,583
,062
$
1,4
93,3
09
$ 1
,408
,803
$
1,2
53,6
97
$ 1
,257
,884
$
1,2
50,1
49
$ 1
,265
,577
Sour
ce:
Aud
ited
fin
anci
al s
tate
men
ts
109

San
Die
go M
etro
pol
itan
Tra
nsi
t S
yste
m
Ch
ange
s in
Net
Pos
itio
n (
‘000
s)
Las
t T
en F
isca
l Yea
rs
2017
2016
2015
2014
2013
2012
2011
2010
2009
2008
Ope
rati
ng r
even
ues:
Pa
ssen
ger r
even
ue $
9
3,27
9 $
9
7,91
4 $
9
7,61
5 $
9
3,99
5 $
9
0,65
2 $
8
8,09
4 $
8
4,76
4 $
8
4,16
7 $
8
5,19
2 $
7
5,93
9
Adv
ertis
ing
1,
379
968
816
870
972
784
621
783
925
1,
119
C
hart
er
-
-
6
30
1
18
6
12
9
12
8
6
9
6
3
Mis
cella
neou
s
1
8,86
3
1
5,78
1
9,34
9
9,53
1
4,93
4
4,44
5
4,68
8
4,26
4
4,87
4
3,67
1
Tot
al o
pera
ting
rev
enue
s
113
,521
114
,663
107
,786
104
,426
9
6,55
9
9
3,50
9
9
0,20
2
8
9,34
2
9
1,06
0
8
0,79
2
Ope
rati
ng e
xpen
ses:
Pe
rson
nel c
osts
1
37,0
21
1
21,9
21
1
14,5
75
1
17,0
92
1
23,7
20
1
12,5
37
1
04,3
29
1
09,5
12
1
01,9
13
1
02,8
47
O
utsi
de s
ervi
ces
97,
800
94,
802
84,
302
73,
859
67,
414
66,
050
64,
037
63,
574
65,
140
64,
940
T
rans
it op
erat
ions
fund
ing
463
491
2,
692
4,
243
3,
571
3,
721
4,
053
3,
758
3,
004
3,
853
M
ater
ials
and
sup
plie
s
1
3,06
5
9,71
5
1
0,30
7
9,27
6
8,46
9
7,97
7
7,67
8
6,68
0
7,19
0
7,59
0
Ener
gy c
osts
25,
552
24,
531
28,
003
26,
044
22,
572
22,
689
21,
932
22,
892
25,
283
27,
211
R
isk
man
agem
ent
4,
276
4,
864
5,
849
3,
610
2,
902
4,
030
3,
924
4,
859
4,
074
3,
898
M
isce
llane
ous
5,
934
4,
978
4,
975
6,
244
6,
493
5,
116
4,
899
3,
571
2,
052
1,
975
D
epre
ciat
ion
1
23,8
80
1
19,5
20
1
08,1
99
1
03,1
98
92,
788
84,
811
81,
041
98,
238
75,
499
85,
543
Tot
al o
pera
ting
exp
ense
s
407
,991
380
,822
358
,902
343
,566
327
,929
306
,931
291
,893
313
,084
284
,155
297
,857
Ope
rati
ng in
com
e (l
oss)
(2
94,4
70)
(2
66,1
59)
(2
51,1
16)
(2
39,1
40)
(2
31,3
70)
(2
13,4
22)
(2
01,6
91)
(2
23,7
42)
(1
93,0
95)
(2
17,0
65)
110

San
Die
go M
etro
pol
itan
Tra
nsi
t S
yste
m
Ch
ange
s in
Net
Pos
itio
n (
‘000
s) (
Con
tin
ued
) L
ast
Ten
Fis
cal Y
ears
2017
2016
2015
2014
2013
2012
2011
2010
2009
2008
Pub
lic
supp
ort a
nd n
onop
erat
ing
reve
nues
(exp
ense
s):
G
rant
s an
d co
ntrib
utio
ns
232
,775
235
,763
235
,755
211
,517
183
,945
325
,658
170
,850
224
,506
176
,979
200
,879
Inve
stm
ent e
arni
ngs
636
292
3,
065
6,
087
6,
267
7,
622
7,
695
9,
708
10,
584
13,
394
In
tere
st e
xpen
se
(96
3)
(
1,07
1)
(
6,88
3)
(
6,98
2)
(
7,52
0)
(
8,01
4)
(
8,42
0)
(1
2,70
2)
(1
1,15
3)
(1
0,66
6)
Gai
n (lo
ss) o
n di
spos
al o
f ass
ets
396
2,
433
67
(
273)
804
(
620)
712
(69)
294
88
O
ther
exp
ense
s
-
-
-
(13)
(13)
(5
)
(13
9)
(
1,07
5)
(70
5)
(46
5)
Tot
al p
ubli
c su
ppor
t and
no
nope
rati
ng r
even
ues
(exp
ense
s)
232
,844
237
,417
232
,004
210
,336
183
,483
324
,641
170
,698
220
,368
175
,999
203
,230
Inco
me
(los
s) b
efor
e co
ntri
bute
d ca
pita
l
(6
1,62
6)
(2
8,74
2)
(1
9,11
2)
(2
8,80
4)
(4
7,88
7)
111
,219
(3
0,99
3)
(
3,37
4)
(1
7,09
6)
(1
3,83
5)
C
ontr
ibut
ed c
apita
l, ne
t
4
8,30
1
9
3,61
9
245
,717
118
,768
132
,182
4
4,11
8
2
6,80
6
1
1,11
0
1,66
8
1
8,49
2
Cha
nges
in n
et p
osit
ion
$
(13,
325)
$
64,
877
$ 2
26,6
05
$
89,
964
$
84,
295
$ 1
55,3
37
$
(4,
187)
$
7,
736
$
(15,
428)
$
4,
657
111

112
This page intentionally left blank.

113
REVENUE CAPACITY

San Diego Metropolitan Transit System Operating Revenue by Source (in 000's)
Last Ten Fiscal Years
114
Federal State Local
Fiscal Year Passenger Operating Operating OperatingEnded Fares Funds Funds Funds Other
San Diego Transit2008 $ 23,680 $ 13,934 $ 21,863 $ 10,507 $ 1,154 2009 27,882 17,177 24,496 14,416 141 2010 26,708 18,267 16,249 21,456 182 2011 26,056 19,894 29,435 18,307 152 2012 27,498 20,709 20,497 17,549 196 2013 28,621 20,266 31,954 18,886 6 2014 27,781 19,336 16,489 20,897 34 2015 27,156 18,096 18,085 28,982 5 2016 26,169 18,000 15,993 35,558 2 2017 24,864 20,000 17,138 31,038 10
San Diego Trolley2008 $ 31,120 $ 13,881 $ 4,479 $ 6,000 $ 604 2009 33,454 16,616 787 7,043 1,012 2010 33,050 16,449 5,637 5,000 462 2011 34,673 14,912 5,497 5,000 528 2012 35,216 14,989 7,208 5,492 552 2013 35,554 22,426 3,379 5,000 574 2014 40,188 22,913 1,501 5,000 1,256 2015 41,140 21,151 5,047 5,000 628 2016 41,113 21,148 6,040 5,000 698 2017 38,968 23,149 13,609 5,000 704
MTS - Contracted Services2008 $ 21,138 $ 921 $ 38,020 $ 1,285 $ 67 2009 23,857 4,681 29,581 1,456 64 2010 24,410 10,420 21,524 1,636 47 2011 24,036 4,641 28,857 2,002 - 2012 25,380 7,155 26,635 1,984 - 2013 26,476 5,595 28,132 2,368 - 2014 26,025 10,362 26,906 2,665 - 2015 29,318 14,127 30,543 2,123 79 2016 30,631 13,827 33,796 2,258 (2)2017 29,447 13,838 36,162 2,296 2
Source: Audited Financial Statements.

San
Die
go M
etro
pol
itan
Tra
nsi
t S
yste
m
Far
e S
tru
ctu
re
Las
t T
en F
isca
l Yea
rs
2017
2016
2015
2014
2013
2012
2011
2010
2009
2008
Bus
Cas
h Fa
res
One
-way
fare
, loc
al ro
utes
2.2
5
2.
25
2.25
2.
25
2.25
2.
25
2.25
2.
25
2.25
2.
00
Seni
or/d
isab
led,
loca
l rou
tes
1.1
0
1.
10
1.10
1.
10
1.10
1.
10
1.10
1.
10
1.10
0.
75
Urb
an
-
-
-
-
-
-
-
-
-
2.25
R
apid
/Exp
ress
2.5
0
2.
50
2.50
2.
50
2.50
2.
50
2.50
2.
50
2.50
2.
50
Seni
or/d
isab
led
Rap
id/E
xpre
ss
1
.25
1.25
1.
25
1.25
1.
25
1.25
1.
25
1.25
1.
25
0.75
R
a pid
Exp
ress
/Pre
miu
m
5.0
0
5.
00
5.00
5.
00
5.00
5.
00
5.00
5.
00
5.00
5.
00
Seni
or/d
isab
led
Rap
id E
xpre
ss/P
rem
ium
2.5
0
2.
50
2.50
2.
50
2.50
2.
50
2.50
2.
50
2.50
0.
75
Rur
al b
us 5
.00-
10.0
0 5.
00-1
0.00
5.
00-1
0.00
5.
00-1
0.00
5.
00-1
0.00
5.
00-1
0.00
5.
00-1
0.00
5.
00-1
0.00
5.
00-1
0.00
5.
00-1
0.00
Se
nior
/dis
able
d R
ural
bus
2.50
-5.0
0 2.
50-5
.00
2.50
-5.0
0 2.
50-5
.00
2.50
-5.0
0 2.
50-5
.00
2.50
-5.0
0 2.
50-5
.00
2.50
-5.0
0
-
Sorr
ento
Val
ley
Coa
ster
Con
nect
ion
-
-
-
-
-
-
-
-
1.00
-
Seni
or/d
isab
led
Coa
ster
Con
nect
ion
-
-
-
-
-
-
-
-
0.50
-
Shut
tles
-
-
-
-
-
-
-
-
-
1.
00
Tro
lley
Cas
h Fa
res
One
-way
fare
, all
stat
ions
2.5
0
2.
50
2.50
2.
50
2.50
2.
50
2.50
2.
50
2.50
- Se
nior
/dis
able
d on
e-w
ay fa
re a
ll st
atio
ns
1
.25
1.25
1.
25
1.25
1.
25
1.25
1.
25
1.25
1.
25
1.00
D
ownt
own
-
-
-
-
-
-
-
-
1.25
1.
25
Seni
or/d
isab
led
Dow
ntow
n -
-
-
-
- -
-
-
0.
60
-
1 st
atio
n-20
+ st
atio
ns -
-
-
-
- -
-
-
-
1.
50-3
.00
Bus
and
Tro
lley
Day
Pas
ses
Reg
iona
l day
pas
s
5
.00
5.00
5.
00
5.00
5.
00
5.00
5.
00
5.00
-
- R
egio
n pl
us d
ay p
ass
1
2.00
12.
00
1
2.00
12.
00
1
2.00
12.
00
1
4.00
14.
00
-
-
Bus
and
Tro
lle y
Mon
thly
Pas
ses
Reg
iona
l mon
thly
pas
s
72.
00
7
2.00
72.
00
7
2.00
72.
00
7
2.00
72.
00
7
2.00
68.
00
6
4.00
Se
nior
/dis
able
d R
egio
nal
1
8.00
18.
00
1
8.00
18.
00
1
8.00
18.
00
1
8.00
18.
00
1
7.00
16.
00
You
th R
egio
nal
3
6.00
36.
00
3
6.00
36.
00
3
6.00
36.
00
3
6.00
36.
00
3
4.00
32.
00
14-D
ay/H
alf-
mon
th
43.
00
4
3.00
43.
00
4
3.00
43.
00
4
3.00
43.
00
4
3.00
41.
00
-
Rap
id E
xpre
ss/P
rem
ium
mon
thly
pas
s
100.
00
10
0.00
100.
00
10
0.00
100.
00
10
0.00
100.
00
10
0.00
90.
00
-
Seni
or/d
isab
led
Rap
id E
xpre
ss/P
rem
ium
2
5.00
25.
00
2
5.00
25.
00
2
5.00
25.
00
2
5.00
25.
00
2
2.50
- Y
outh
Rap
id E
xpre
ss/P
rem
ium
5
0.00
50.
00
5
0.00
50.
00
5
0.00
50.
00
5
0.00
50.
00
4
5.00
- 14
-Day
/Hal
f-m
onth
Rap
id
Expr
ess/
Prem
ium
6
0.00
60.
00
6
0.00
60.
00
6
0.00
60.
00
6
0.00
60.
00
5
4.00
-
SOU
RC
E: S
AN
DA
G C
ompr
ehen
sive
Far
e O
rdin
ance
, am
endm
ents
eff
ectiv
e Ju
ly 2
014.
115
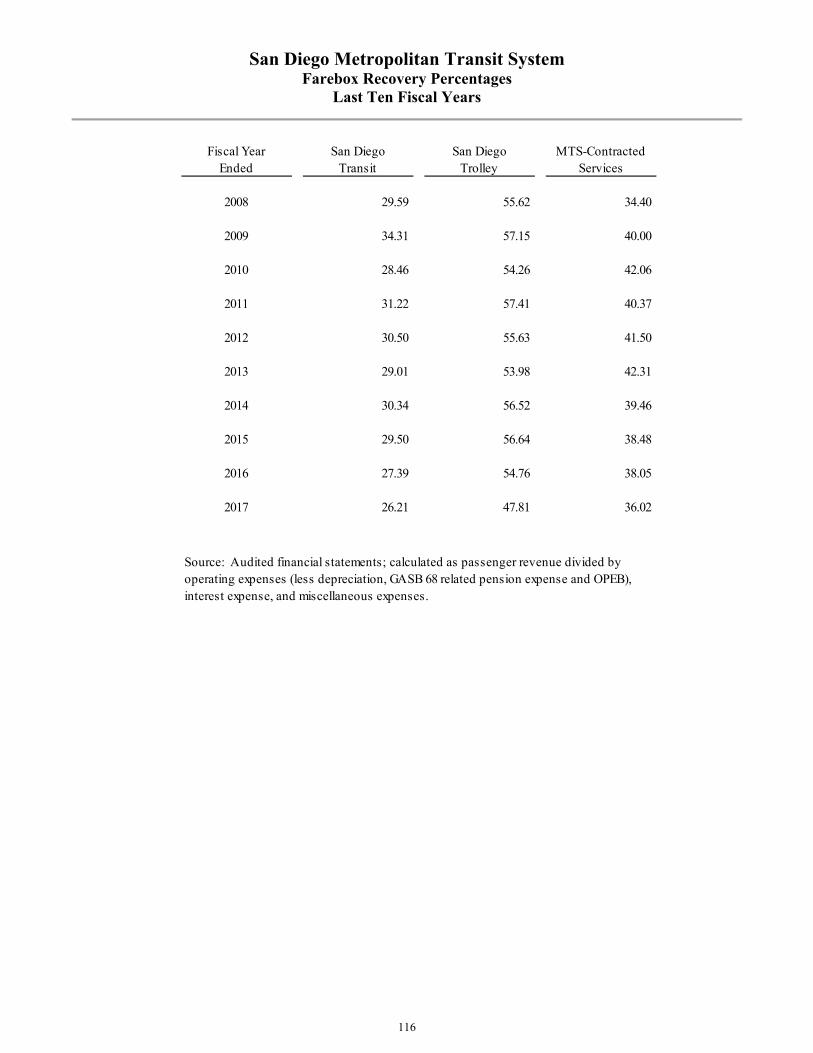
San Diego Metropolitan Transit System Farebox Recovery Percentages
Last Ten Fiscal Years
116
Fiscal Year San Diego San Diego MTS-ContractedEnded Transit Trolley Services
2008 29.59 55.62 34.40
2009 34.31 57.15 40.00
2010 28.46 54.26 42.06
2011 31.22 57.41 40.37
2012 30.50 55.63 41.50
2013 29.01 53.98 42.31
2014 30.34 56.52 39.46
2015 29.50 56.64 38.48
2016 27.39 54.76 38.05
2017 26.21 47.81 36.02
Source: Audited financial statements; calculated as passenger revenue divided by operating expenses (less depreciation, GASB 68 related pension expense and OPEB), interest expense, and miscellaneous expenses.

117
DEBT CAPACITY

San Diego Metropolitan Transit System Ratio of Outstanding Debt by Type
Last Ten Fiscal Years
118
Year ended June 30
Capital Lease -Tower
Capital Lease-Equipment
1995 LRV Lease/
Leaseback
Pension Obligation
Bonds Total
Percentage of Personal Income
Debt per Capita
2008 $ 7,617,599 $ 187,737 $ 122,540,596 $ 73,120,000 $ 203,465,932 0.14% $ 67
2009 7,141,327 117,470 121,292,645 71,565,000 200,116,442 0.15% 65
2010 6,647,108 44,190 119,948,726 61,150,000 187,790,024 0.13% 61
2011 5,317,686 - 118,501,460 47,265,000 171,084,146 0.11% 55
2012 4,766,867 - 116,942,900 40,510,000 162,219,767 0.10% 51
2013 4,189,818 - 115,264,486 25,880,000 145,334,304 0.09% 46
2014 3,614,149 - 113,457,002 23,965,000 141,036,151 0.08% 44
2015 3,006,729 - 18,108,323 21,960,000 43,075,052 0.02% 13
2016 2,393,787 - - 19,860,000 22,253,787 0.01% 7
2017 1,747,713 - - 17,655,000 19,402,713 0.01% 6
Details regarding MTS's outstanding debt can be found in the notes to the financial statements.
MTS retired the capital equipment lease and refunded the Tower capital lease in FY2011
MTS retired the variable rate Pension Obligation Bonds in FY2013
MTS retired the 1995 LRV Lease/Leaseback obligation in FY2016

119
DEMOGRAPHIC AND ECONOMIC STATISTICS

San Diego Metropolitan Transit System Regional Population and Personal Income Statistics
Last Ten Fiscal Years
120
County of San Diego Population
(1)
County of San Diego Personal
Income (thousands) (1)
Per Capita Personal Income (1)
San Diego County Average
Unemployment Rate (2)
2008 3,051,262 141,800,000 50,069 6.40%
2009 3,077,633 137,300,000 48,464 10.20%
2010 3,102,852 138,300,000 48,286 10.50%
2011 3,137,283 148,000,000 49,745 10.40%
2012 3,174,808 156,000,000 50,779 9.30%
2013 3,209,225 160,800,000 51,250 7.40%
2014 3,247,522 167,900,000 52,180 6.10%
2015 3,275,546 177,700,000 54,249 5.00%
2016 3,305,481 187,900,000 55,801 5.10%
2017 3,337,300 199,700,000 57,037 4.30%
Source: (1) California Department of Transportation - Actuals 2007-2015, Forecast 2016-2017(2) California Employment Development Department, June 2017
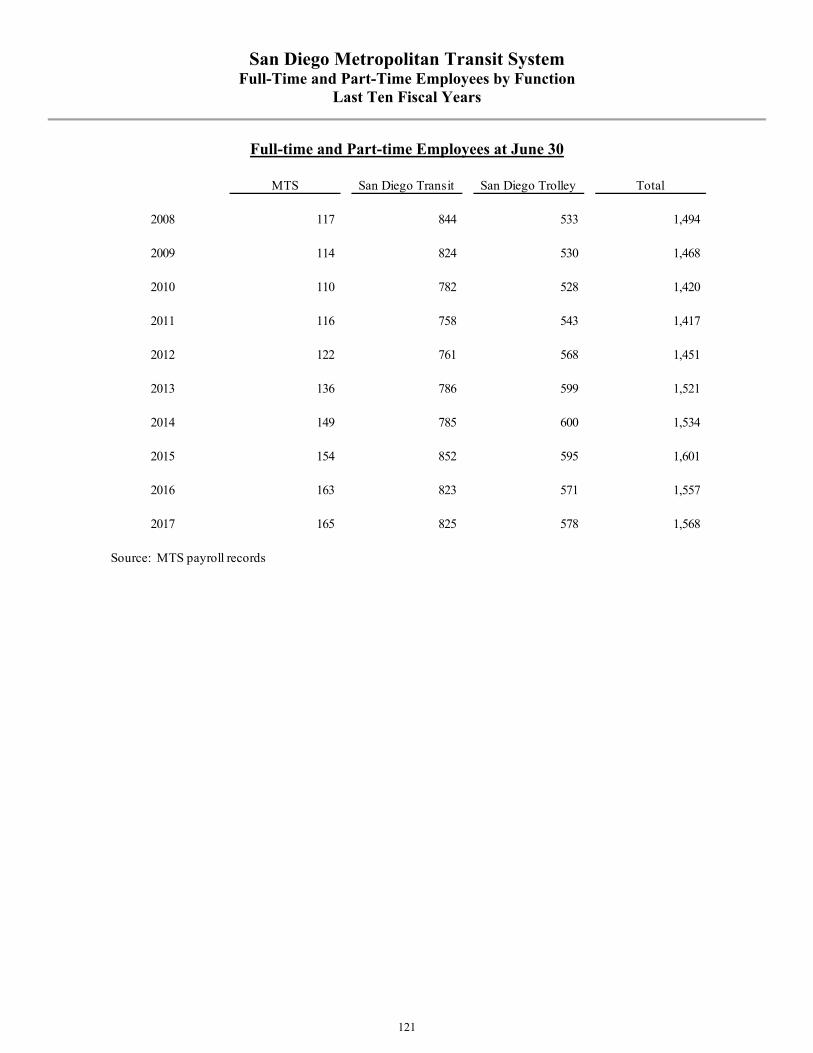
San Diego Metropolitan Transit System Full-Time and Part-Time Employees by Function
Last Ten Fiscal Years
121
Full-time and Part-time Employees at June 30
MTS San Diego Transit San Diego Trolley Total
2008 117 844 533 1,494
2009 114 824 530 1,468
2010 110 782 528 1,420
2011 116 758 543 1,417
2012 122 761 568 1,451
2013 136 786 599 1,521
2014 149 785 600 1,534
2015 154 852 595 1,601
2016 163 823 571 1,557
2017 165 825 578 1,568
Source: MTS payroll records

San Diego Metropolitan Transit System Ten Largest Employers in San Diego County
122
Number of Percent of 1,563,000Company Name Employees (1) County Total (2)
* Federal Government 35,213 2.25%University of California, San Diego 32,524 2.08%Sharp Healthcare 17,962 1.15%Scripps Health 15,238 0.97%Qualcomm Inc. 12,600 0.81%City of San Diego 11,544 0.74%State of California 9,168 0.59%Kaiser Permanente 8,965 0.57%UC San Diego Health System 8,923 0.57%
San Diego Community College District 6,817 0.44%
Source:(1) San Diego Business Journal - 2017 Book of Lists. *U.S. Office of Personnel Management data reported for
Executive Branch(2) Employment Development Department, State of California
Note: County of San Diego employment information is presented. Employer information is not currently available for the area served by the Metropolitan Transit System within San Diego County. MTS presents only current employment data for the county of San Diego.

123
OPERATING INFORMATION

San
Die
go M
etro
pol
itan
Tra
nsi
t S
yste
m
Op
erat
ing
Ind
icat
ors
by F
un
ctio
n
Las
t T
en F
isca
l Yea
rs
2017
2016
2015
2014
2013
2012
2011
2010
2009
2008
Ope
rati
ng C
ost (
in 0
00's
) Sa
n D
iego
Tra
nsit
$
94,
878
$
95,
526
$
92,
059
$
91,
568
$
98,
666
$
90,
153
$
83,
457
$
93,
831
$
81,
271
$
80,
031
San
Die
go T
rolle
y
8
1,50
1
7
5,08
6
7
2,63
7
7
1,09
8
6
5,85
9
6
3,30
9
6
0,39
5
6
0,91
3
5
8,53
7
5
5,94
9 M
TS-
Con
trac
t Ser
vice
s
8
1,74
4
8
0,51
1
7
6,19
0
6
5,95
9
6
2,57
3
6
1,15
4
5
9,53
6
5
8,03
7
5
9,63
9
6
1,45
1
Fare
box
Rev
enue
(in
000'
s)Sa
n D
iego
Tra
nsit
$
24,
864
$
26,
169
$
27,
156
$
27,
781
$
28,
621
$
27,
498
$
26,
056
$
26,
708
$
27,
882
$
23,
680
San
Die
go T
rolle
y
3
8,96
8
4
1,11
3
4
1,14
0
4
0,18
8
3
5,55
4
3
5,21
6
3
4,67
3
3
3,05
0
3
3,45
4
3
1,12
0 M
TS-
Con
trac
t Ser
vice
s
2
9,44
7
3
0,63
1
2
9,31
8
2
6,02
5
2
6,47
6
2
5,38
0
2
4,03
6
2
4,41
0
2
3,85
7
2
1,13
8
Tot
al P
asse
nger
s (i
n 00
0's)
San
Die
go T
rans
it $
2
4,31
5 $
2
5,62
8 $
2
7,26
4 $
2
8,54
1 $
2
8,92
7 $
2
8,80
2 $
2
7,25
2 $
2
6,92
1 $
2
9,76
2 $
2
8,09
4 Sa
n D
iego
Tro
lley
37,
639
39,
614
40,
082
39,
695
29,
699
32,
655
31,
613
30,
469
36,
928
37,
621
MT
S-C
ontr
act S
ervi
ces
26,
241
27,
194
27,
574
23,
761
23,
479
23,
780
22,
664
21,
988
21,
645
21,
460
Rev
enue
Mil
es (i
n 00
0's)
San
Die
go T
rans
it $
9,62
6 $
9,70
2 $
9,56
1 $
8,69
5 $
8,55
7 $
8,22
1 $
8,17
8 $
8,62
4 $
9,22
1 $
9,52
2 Sa
n D
iego
Tro
lley
8,
728
8,
424
8,
596
8,
516
7,
758
7,
544
7,
519
7,
743
7,
895
8,
003
MT
S-C
ontr
act S
ervi
ces
15,
144
14,
969
13,
328
12,
139
11,
607
11,
214
11,
196
11,
450
12,
179
12,
501
Sub
sidy
/ T
otal
Pas
seng
erSa
n D
iego
Tra
nsit
$
2
.88
$
2
.71
$
2
.38
$
2
.24
$
2
.42
$
2
.18
$
2
.11
$
2
.50
$
1
.79
$
2
.01
San
Die
go T
rolle
y
1.1
3
0.8
6
0.7
9
0.7
8
1.0
2
0.8
6
0.8
1
0.9
2
0.6
8
0.6
6 M
TS-
Con
trac
t Ser
vice
s
1.9
9
1.8
3
1.7
0
1.6
8
1.5
4
1.5
0
1.5
7
1.5
3
1.6
6
1.8
8
Sour
ce: N
TD
Rep
ort,
and
audi
ted
finan
cial
sta
tem
ents
.
124

San
Die
go M
etro
pol
itan
Tra
nsi
t S
yste
m
Ser
vice
Per
form
ance
Dat
a L
ast
Ten
Fis
cal Y
ears
2017
2016
2015
2014
2013
2012
2011
2010
2009
2008
Serv
ice
Prov
ided
San
Die
go T
rans
it V
ehic
le R
even
ue M
iles
(in 0
00's
)
9,6
26
9
,702
9,5
61
8
,695
8,5
57
8
,221
8,1
78
8
,624
9,2
21
9
,522
V
ehic
le R
even
ue H
ours
(in
000'
s)
8
22
825
8
06
795
7
87
757
7
54
789
8
43
870
P
asse
nger
s (in
000
's)
24
,315
25,6
28
27
,264
28,5
41
28
,927
28,8
02
27
,252
26,9
21
29
,762
28,0
94
Pas
seng
er M
iles
(in 0
00's
)
1
09,7
27
111
,639
1
17,5
85
110
,009
1
08,2
22
106
,804
1
00,5
00
98
,163
1
07,4
08
100
,256
N
umbe
r of V
ehic
les
278
2
79
272
3
10
260
2
36
236
2
38
247
2
67
San
Die
go T
rolle
y V
ehic
le R
even
ue M
iles
(in 0
00's
)
8,7
28
8
,424
8,5
96
8
,516
7,7
58
7
,544
7,5
19
7
,743
7,8
95
8
,003
V
ehic
le R
even
ue H
ours
(in
000'
s)
4
90
493
4
96
504
4
72
428
4
23
442
4
10
439
P
asse
nger
Car
Hou
rs (i
n 00
0's)
504
5
07
509
5
12
476
4
33
429
4
48
416
4
45
Pas
seng
ers
(in 0
00's
)
37,6
39
39
,614
40,0
82
39
,695
29,6
99
32
,655
31,6
13
30
,469
36,9
28
37
,621
P
asse
nger
Mile
s (in
000
's)
210
,971
2
23,1
85
224
,422
2
28,5
31
173
,151
1
94,8
22
193
,063
1
86,5
09
220
,639
2
06,9
24
Num
ber o
f Veh
icle
s
177
1
77
177
1
79
178
1
51
128
1
34
133
1
34
MT
S-C
ontr
acte
d Se
rvic
es V
ehic
le R
even
ue M
iles
(in 0
00's
)
15,1
44
14
,969
13,3
28
12
,139
11,6
07
11
,214
11,1
96
11
,450
12,1
79
12
,501
V
ehic
le R
even
ue H
ours
(in
000'
s)
1,2
69
1
,252
1,1
12
998
9
61
933
9
27
946
9
86
1
,019
P
asse
nger
s (in
000
's)
26
,241
27,1
94
27
,573
23,7
61
23
,479
23,7
80
22
,664
21,9
88
21
,645
21,4
60
Pas
seng
er M
iles
(in 0
00's
)
95,9
40
97
,479
94,5
04
85
,269
84,0
21
79
,789
82,1
25
79
,237
80,1
04
77
,173
N
umbe
r of V
ehic
les
526
5
20
520
4
49
427
4
04
407
3
69
388
3
58
Tot
al P
asse
nger
s (in
000
's)
88
,195
92,4
36
94
,919
91,9
97
82
,105
85,2
37
81
,529
79,3
78
88
,335
87,1
75
Pas
seng
er M
iles
(in 0
00's
)
4
16,6
38
432
,303
4
36,5
11
423
,809
3
65,3
94
381
,415
3
75,6
88
363
,909
4
08,1
51
384
,353
Sour
ce: N
TD
Rep
ort a
nd M
TS
inte
rnal
cap
ital a
sset
sys
tem
125
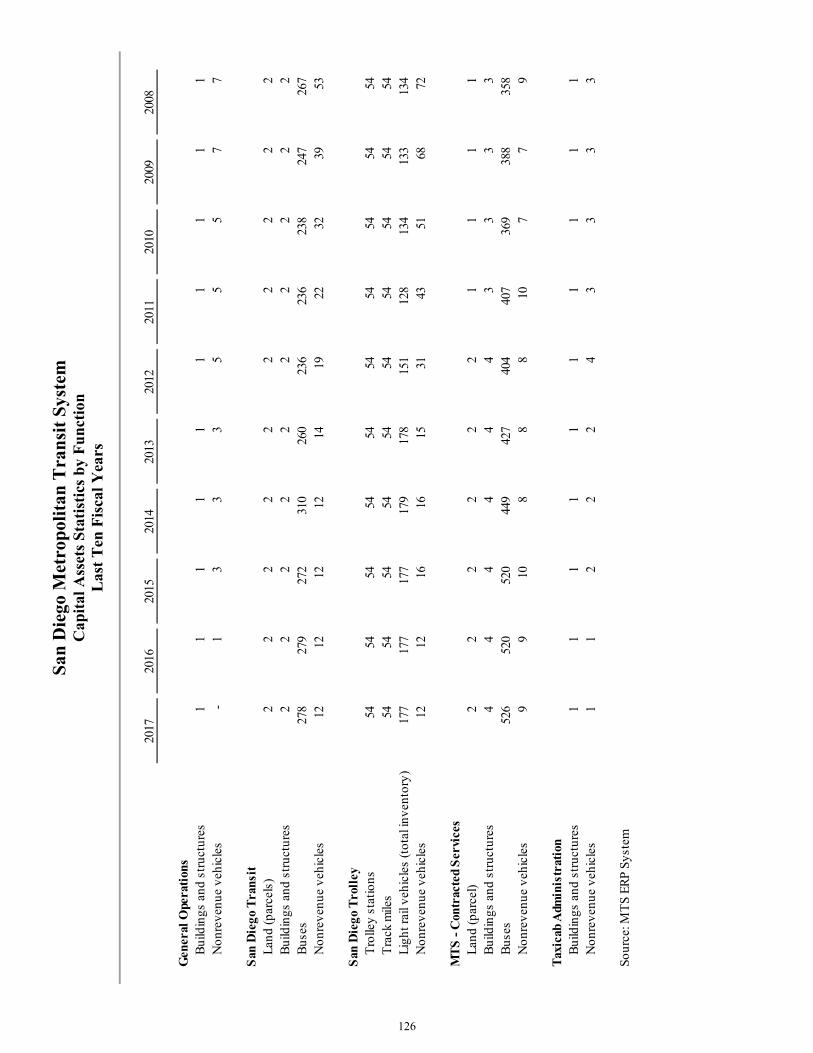
San
Die
go M
etro
pol
itan
Tra
nsi
t S
yste
m
Cap
ital
Ass
ets
Sta
tist
ics
by
Fu
nct
ion
L
ast
Ten
Fis
cal Y
ears
2017
2016
2015
2014
2013
2012
2011
2010
2009
2008
Gen
eral
Ope
rati
ons
B
uild
ings
and
str
uctu
res
1
1
1
1
1
1
1
1
1
1
N
onre
venu
e ve
hicl
es
-
1
3
3
3
5
5
5
7
7
San
Die
go T
rans
it
Lan
d (p
arce
ls)
2
2
2
2
2
2
2
2
2
2
B
uild
ings
and
str
uctu
res
2
2
2
2
2
2
2
2
2
2
B
uses
278
279
272
310
260
236
236
238
247
267
N
onre
venu
e ve
hicl
es
1
2
1
2
1
2
1
2
1
4
1
9
2
2
3
2
3
9
5
3
San
Die
go T
roll
ey
Tro
lley
stat
ions
54
54
54
54
54
54
54
54
54
54
T
rack
mile
s
5
4
5
4
5
4
5
4
5
4
5
4
5
4
5
4
5
4
5
4
Lig
ht ra
il ve
hicl
es (t
otal
inve
ntor
y)
17
7
17
7
17
7
17
9
17
8
15
1
12
8
13
4
13
3
13
4
Non
reve
nue
vehi
cles
12
12
16
16
15
31
43
51
68
72
MT
S -
Con
trac
ted
Ser
vice
s
Lan
d (p
arce
l)
2
2
2
2
2
2
1
1
1
1
Bui
ldin
gs a
nd s
truc
ture
s
4
4
4
4
4
4
3
3
3
3
Bus
es
52
6
52
0
52
0
44
9
42
7
40
4
40
7
36
9
38
8
35
8
Non
reve
nue
vehi
cles
9
9
10
8
8
8
1
0
7
7
9
Tax
icab
Adm
inis
trat
ion
B
uild
ings
and
str
uctu
res
1
1
1
1
1
1
1
1
1
1
N
onre
venu
e ve
hicl
es
1
1
2
2
2
4
3
3
3
3
Sour
ce: M
TS
ERP
Syst
em
126

San
Die
go M
etro
pol
itan
Tra
nsi
t S
yste
m
Rid
ersh
ip
Las
t T
en F
isca
l Yea
rs
2017
2016
2015
2014
2013
2012
2011
2010
2009
2008
Rid
ersh
ip (i
n 00
0's)
San
Die
go T
rans
it
2
4,31
5
2
5,62
8
2
7,26
4
2
8,54
1
2
8,92
7
2
8,80
2
2
7,25
2
2
6,92
1
2
9,76
2
2
8,09
4 %
Cha
nge
-5.1
2%-6
.00%
-4.4
8%-1
.33%
0.43
%5.
69%
1.23
%-9
.55%
5.94
%7.
74%
San
Die
go T
rolle
y
3
7,63
9
3
9,61
4
4
0,08
2
3
9,69
5
2
9,69
9
3
2,65
5
3
1,61
3
3
0,46
9
3
6,92
8
3
7,62
1 %
Cha
nge
-4.9
9%-1
.17%
0.98
%33
.65%
-9.0
5%3.
30%
3.75
%-1
7.49
%-1
.84%
7.14
%
MT
S - C
ontr
acte
d Se
rvic
es
2
6,24
1
2
7,19
4
2
7,57
4
2
3,76
1
2
3,47
9
2
3,78
0
2
2,66
4
2
1,98
8
2
1,64
5
2
1,46
0 %
Cha
nge
-3.5
1%-1
.38%
16.0
5%1.
20%
-1.2
7%4.
92%
3.07
%1.
58%
0.86
%1.
50%
Sour
ce: N
TD
Rep
ort
127

San
Die
go M
etro
pol
itan
Tra
nsi
t S
yste
m
Op
erat
ing
Su
bsi
dy
Las
t T
en F
isca
l Yea
rs
2017
2016
2015
2014
2013
2012
2011
2010
2009
2008
Ave
rage
Far
e pe
r Rid
erSa
n D
iego
Tra
nsit
1
.02
1
.02
1
.00
0
.97
0
.99
0
.95
0
.96
0
.99
0
.94
0
.84
San
Die
go T
rolle
y
1.0
4
1.0
4
1.0
3
1.0
1
1.2
0
1.0
8
1.1
0
1.0
8
0.9
1
0.8
3 M
TS
- Con
trac
t Ser
vice
s
1.1
2
1.1
3
1.0
6
1.1
0
1.1
3
1.0
7
1.0
6
1.1
1
1.1
0
0.9
8
Ope
ratin
g Ex
pens
e pe
r Rid
erSa
n D
iego
Tra
nsit
3
.90
3
.73
3
.38
3
.21
3
.41
3
.13
3
.06
3
.49
2
.73
2
.85
San
Die
go T
rolle
y
2.1
7
1.9
0
1.8
1
1.7
9
2.2
2
1.9
4
1.9
1
2.0
0
1.5
9
1.4
9 M
TS
- Con
trac
t Ser
vice
s
3.1
2
2.9
6
2.7
6
2.7
8
2.6
7
2.5
7
2.6
3
2.6
4
2.7
6
2.8
6
Subs
idy
per R
ider
San
Die
go T
rans
it
2.8
8
2.7
1
2.3
8
2.2
4
2.4
2
2.1
8
2.1
1
2.5
0
1.7
9
2.0
1 Sa
n D
iego
Tro
lley
1
.13
0
.86
0
.79
0
.78
1
.02
0
.86
0
.81
0
.92
0
.68
0
.66
MT
S - C
ontr
act S
ervi
ces
1
.99
1
.83
1
.70
1
.68
1
.54
1
.50
1
.57
1
.53
1
.66
1
.88
Sour
ce:
NT
D re
port
and
Aud
ited
finan
cial
sta
tem
ents
128

REPORT ON INTERNAL CONTROL OVER FINANCIAL REPORTING AND ON COMPLIANCE AND OTHER MATTERS BASED ON AN AUDIT OF FINANCIAL STATEMENTS PERFORMED IN
ACCORDANCE WITH GOVERNMENT AUDITING STANDARDS
Independent Auditors’ Report
To the Board of Directors of the San Diego Metropolitan Transit System
San Diego, California We have audited, in accordance with the auditing standards generally accepted in the United States of America and the standards applicable to financial audits contained in Government Auditing Standards issued by the Comptroller General of the United States, the basic financial statements of the San Diego Metropolitan Transit System (MTS), which comprise of the statements of net position as of and for the years ended June 30, 2017 and 2016, and the related statements of revenues, expenses and changes in net position and cash flows for the year then ended, and notes to basic financial statements, and have issued our report thereon dated November 3, 2017.
Internal Control over Financial Reporting
In planning and performing our audit of the financial statements, we considered MTS’s internal control over financial reporting (internal control) to determine the audit procedures that are appropriate in the circumstances for the purpose of expressing our opinions on the financial statements, but not for the purpose of expressing an opinion on the effectiveness of MTS’s internal control. Accordingly, we do not express an opinion on the effectiveness of MTS’s internal control.
A deficiency in internal control exists when the design or operation of a control does not allow management or employees, in the normal course of performing their assigned functions, to prevent, or detect and correct, misstatements on a timely basis. A material weakness is a deficiency, or a combination of deficiencies, in internal control, such that there is a reasonable possibility that a material misstatement of the entity’s financial statements will not be prevented, or detected and corrected on a timely basis. A significant deficiency is a deficiency, or a combination of deficiencies, in internal control that is less severe than a material weakness, yet important enough to merit attention by those charged with governance.
Our consideration of internal control was for the limited purpose described in the first paragraph of this section and was not designed to identify all deficiencies in internal control that might be material weaknesses or, significant deficiencies. Given these limitations, during our audit we did not identify any deficiencies in internal control that we consider to be material weaknesses. However, material weaknesses may exist that have not been identified.
Compliance and Other Matters
As part of obtaining reasonable assurance about whether MTS’s financial statements are free from material misstatement, we performed tests of its compliance with certain provisions of laws, regulations, contracts, and grant agreements, noncompliance with which could have a direct and material effect on the determination of financial statement amounts. However, providing an opinion on compliance with those provisions was not an objective of our audit, and accordingly, we do not express such an opinion. The results of our tests disclosed no instances of noncompliance or other matters that are required to be reported under Government Auditing Standards.
4365 Executive Drive, Suite 710, San Diego, California 92121 Tel: 858-242-5100 • Fax: 858-242-5150
www.pungroup.com
3939352 Pun & McGeady_L_final.pdf 2 1/14/14 3:48 PM

To the Board of Directors of the San Diego Metropolitan Transit System
San Diego, California Page 2
130
Purpose of this Report The purpose of this report is solely to describe the scope of our testing of internal control and compliance and the results of that testing, and not to provide an opinion on the effectiveness of the entity’s internal control or on compliance. This report is an integral part of an audit performed in accordance with Government Auditing Standards in considering the entity’s internal control and compliance. Accordingly, this communication is not suitable for any other purpose.
San Diego, California November 3, 2017